Alert Evaluation Script
vuSmartMaps lets you use an evaluation script to create programmable alerts. Using an evaluation script, you can generate alerts based on custom business logic, beyond simple metric threshold breaches. Below is a typical alert engine execution workflow and where the evaluation script is used.
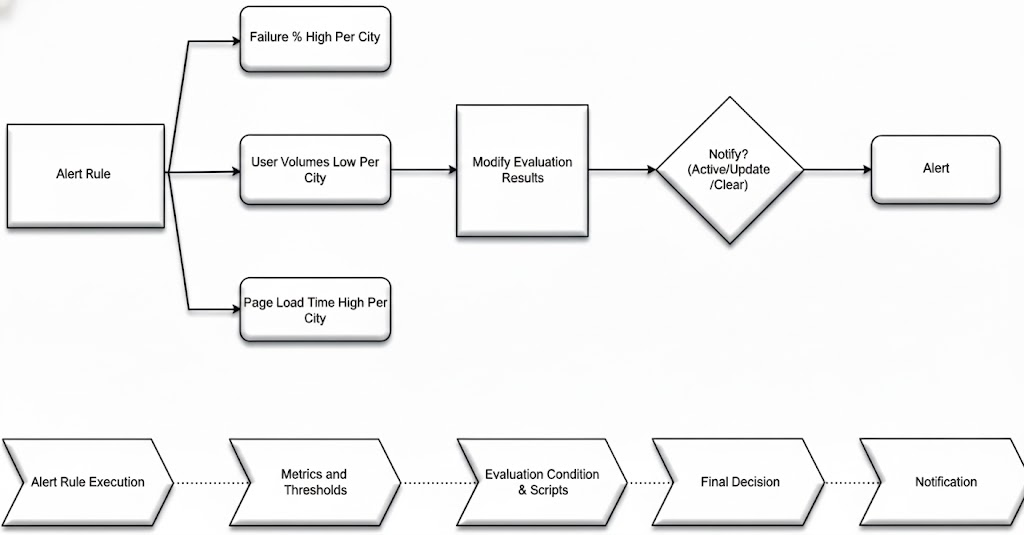
The evaluation script runs after metrics are evaluated and thresholds are applied, allowing you to customize alert behavior. Apart from implementing business logic to generate the alert, you can also enrich alert information such as summary, description, and severity.
In simple terms, the evaluation script lets you create detailed and specific alert conditions that fit your operational needs. You can write this script in the Based on a custom script section of the alert configuration.
In the evaluation script, you can do the following:
- Set Custom Conditions: You can implement complex conditions using scripting logic to determine if the alert should be generated. For example, you can:
- Apply different alert logic for specific environments or systems
- Combine multiple evaluation conditions
- Adjust alert behavior based on grouping values such as server type or application
- Control Alert Triggering: Decide whether an alert should be generated or suppressed by explicitly setting the final evaluation result. This ensures alerts are raised only when the defined conditions are truly met, even if thresholds are breached.
- Customize Alert Content: Modify alert content and add additional context. You can dynamically update fields such as summary, description, and severity based on metric values, enabling responders to understand the issue more quickly and take appropriate action.
These options give you flexibility in how you design and control alert behavior. The following sections explain these capabilities in more detail.
The programming interface is supported exclusively using Starlark Language.
Input Parameters for the Script
vuSmartMaps provides a set of predefined input parameters to the evaluation script, such as rule results, metric data, grouping values, and alert metadata. These parameters can be used within the script logic to control alert generation and enrichment.
The following table lists the input parameters available to the evaluation script.
Input Parameters
| Parameter | Type | Description | How to Access |
|---|---|---|---|
R<n> | Boolean | Indicates whether Rule-n threshold evaluation matched (true or false) | The result of Rule-1 is available as R1, Rule-2 as R2, and so on |
D | List | Data Model evaluation results | D[0] contains Data Model values for Rule-1, D[1] for Rule-2, and so on (array-style indexing) |
grouping_values | List | Grouping values associated with the alert instance. These correspond to the bucketing fields configured in the Data Model | grouping_values[0] for the first grouping field, grouping_values[1] for the second, and so on |
If no grouping is configured for a rule, grouping_values[0] will contain the metric name.
META_DATA
META_DATA is a map containing contextual information about the alert instance.
| Field | Type | Description | How to Access |
|---|---|---|---|
META_DATA['duration'] | Seconds | Duration for which the alert condition has been continuously active | META_DATA.get('duration', 0) |
META_DATA['history'] | Map | Historical information related to this alert | Refer to examples in the following sections |
Output Parameters Available for the Script
The following table lists the output parameters available to the evaluation script for controlling the final behavior of the alert.
Output Parameters
| Parameter | Type | Description | How to Access |
|---|---|---|---|
RESULT | Boolean | Determines whether an alert should be generated. Setting this to true triggers the alert, while setting it to false suppresses the alert | Example:RESULT = true, RESULT = false |
R<n> | Boolean | Indicates whether Rule-n threshold evaluation matched (true or false). These values are read-only in the evaluation script | The result of Rule-1 is available as R1, Rule-2 as R2, and so on |
D | List | Data Model evaluation results used for alert evaluation | D[0] contains Data Model values for Rule-1, D[1] for Rule-2, and so on |
META_DATA | Map | Metadata associated with the alert instance | Access using META_DATA['key'] |
META_DATA Output Controls
| Field | Type | Description |
|---|---|---|
META_DATA['force_update'] | Boolean | When set to true, forces an update notification to be sent for the alert even if the alert state has not changed |
Changing Evaluation Formula
By default, vuSmartMaps generates an alert only when all conditions in an alert rule are true. So, if there are two rules R1 and R2, an alert will be generated only if both R1 and R2 are true.
In the evaluation script, each rule’s result is represented by variables like R1, R2, etc., where a rule match is represented as R1 = True. You can use logical operators in the evaluation script. So, the above two-rule evaluation can be represented in the evaluation script as:
if R1 and R2:
    RESULT = True
else:
    RESULT = False
You can use and and or logic to create complex conditions, such as R1 and (R2 or R3) and not R4. So, for instance, the evaluation script will look like the following if either R1 or R2 condition is to be met:
if R1 or R2:
    RESULT = True
else:
    RESULT = False
This gives you control over when alerts are generated based on your specific criteria and combinations of conditions.
Accessing Metric Values
In the evaluation script, you can access the current values of the metrics used in your alert conditions. Each metric value is available through the evaluated Data Model results, which are exposed to the script in a structured format.
To simplify access, a built-in accessor function is provided to retrieve values of specific metric columns from the Data Model associated with an alert rule. This allows you to make informed decisions in the script about whether an alert should be generated.
D               - Rule result list
rule_identifier - Identifier of the rule (1, 2, etc.)
metric_column   - Metric column name
Example:
get_vumetric_value(D, 1, "success_rate")
Example: Comparing current value with daily average
# Get metric values from Rule 1
current_success = get_vumetric_value(D, 1, "success_rate")
daily_avg = get_vumetric_value(D, 1, "daily_average")

RESULT = True

if current_success != None and daily_avg != None:
    ratio = current_success / daily_avg

    if ratio < 0.75:
        RESULT = False
In this example, the alert is suppressed if the current success rate drops below 75% of the daily average.
Example: Generating alerts with different severities
Metric values can also be used to control alert severity.
For example, to generate:
- a warning alert when the value is between 80 and 90
- a critical alert when the value is greater than 90
A Data Model threshold of 80 can be configured, and additional logic can be applied in the evaluation script.
bw = get_vumetric_value(D, 1, "input_bandwidth")

if bw != None and bw >= 80 and bw < 90:
    RESULT = True
    DYNAMIC_FIELDS["severity"] = "warning"
elif bw != None and bw >= 90:
    RESULT = True
    DYNAMIC_FIELDS["severity"] = "critical"
else:
    RESULT = False
This approach allows metric values to directly influence:
- Whether an alert is generated
- The severity and context of the alert
All logic is executed deterministically within the NG Alerts evaluation engine using Starlark.
Controlling Alert Generation
Suppose you want to generate an alert only when the transaction success rate is 25% lower than the daily average. You can achieve this by creating a custom evaluation script.
For example, if you have a Data Model named “Success Rates” with metrics “Current Rate” and “Daily Average”, the following evaluation script can be used:
current_success = get_vumetric_value(D, 1, "Current Rate")
daily_avg = get_vumetric_value(D, 1, "Daily Average")

RESULT = True

if current_success != None and daily_avg != None:
    if daily_avg != 0:
        # avoid division by zero
        ratio = current_success / daily_avg
    else:
        ratio = 0

    if ratio < 0.75:
        RESULT = False
In the evaluation script, the variable RESULT plays a crucial role in determining whether an alert should be generated.
- If
RESULTis set toTrue, an alert will be triggered for the evaluated condition - If
RESULTis set toFalse, no alert will be generated - If the script does not explicitly set
RESULTtoTrue, no alert will be generated by default
Accessing Grouping Values
You can access grouping values for the alert currently being evaluated within the evaluation script. This is useful when alerts are grouped by multiple dimensions, and you want to control alert generation for specific group combinations.
Grouping values are available as an indexed list called grouping_values, where:
grouping_values[0]represents the first grouping levelgrouping_values[1]represents the second grouping level- and so on
Example:
If alerts are grouped by hostname and interface name, and you want to avoid generating alerts for the serial interface on the host AppServer, you can use the following evaluation script:
RESULT = True
if grouping_values[0] == 'AppServer' and grouping_values[1] == 'serial-1-1':
    RESULT = False
Explanation
grouping_values[0]checks the hostname.grouping_values[1]checks the interface name.- When both conditions match,
RESULTis set toFalse, preventing the alert from being generated. - For all other grouping combinations,
RESULTremainsTrue, and the alert is generated.
Adding New Fields
You can add custom fields to the notifications generated by NG Alert Engine using the evaluation script. These fields can be dynamically populated based on metric values evaluated at runtime.
For example, if you want to include a new field called category in the alert notification based on the transaction success rate, you can use the following evaluation logic.
In this example:
- If the transaction success rate is greater than 90%, the alert is categorized as Normal
- Otherwise, the category is set to Need Investigation
success_rate = get_vumetric_value(D, 1, 'Success Rate')

if success_rate is not None and success_rate > 90:
    DYNAMIC_FIELDS['category'] = 'Normal'
else:
    DYNAMIC_FIELDS['category'] = 'Need Investigation'

RESULT = True
How this works
DYNAMIC_FIELDS is a dictionary used by NG Alert Engine to append additional fields to the alert notification. Each key-value pair added to DYNAMIC_FIELDS appears as a custom field in the alert payload.
These fields can be used in:
- Notification templates
- Integrations (Slack, Email, Webhooks, etc.)
- Downstream alert processing
Adding Additional Content in Notifications
Standard alert notifications in vuSmartMaps include information such as the alert summary, description, event duration, evaluated metric values, and relevant historical data. However, in many scenarios, users need additional contextual details to quickly understand the impact and root cause of an issue. Alerts supports enriching notifications with such contextual data through Information Rules.
Adding Additional Fields to Metric Information
For example, when an alert is generated for high CPU usage on a server, users may want the notification to also include:
- Server location
- Operating system
- Application name running on the server
These additional attributes help operators immediately understand where and why the issue is occurring, without needing to manually navigate to dashboards.
Information Rules
Information Rules are used to attach contextual insights to alert notifications when an alarm is generated.
Examples include:
- For a high CPU usage alert, list the top processes consuming CPU
- For a low transaction success rate alert in an e-commerce application, listing the top failure reasons
In all such scenarios, Information Rules are associated with the primary alert rule and are evaluated when the alert condition becomes true.
Example: Primary Rule and Information Rule
- Primary Rule: Monitors system CPU usage, grouped by hostname, and determines whether the alert condition is met.
- Information Rule: Identifies the top CPU-consuming processes and uses hostname + process ID as grouping keys.
When the alert triggers, the notification includes both:
- The alert condition details from the primary rule
- The contextual insights from the information rule
Using Multiple Information Rules
Alerts allow you to configure multiple information rules for a single alert rule to further enrich notifications.
Key points to note:
- At least one primary rule is required to define the alert condition
- Information rules do not determine whether an alert is triggered
- Information rules are evaluated only when the alert condition is met
Thresholds in Information Rules
You can define thresholds within Information Rules.
- These thresholds are used to:
- Apply color coding
- Highlight insights in notifications
- Thresholds in information rules:
- Do not affect the alarm state
- Are used only for contextual visualization
This ensures that alert severity and state remain controlled by the primary alert conditions, while Information Rules enhance clarity and diagnosis.
Controlling Notification Channels and Recipients
You can control which notification channels are used and who receives the notifications directly from the evaluation script. This is done using the ALERT_CHANNELS list.
You can add or remove channels from this list dynamically based on alert conditions, allowing fine-grained control over how and where alerts are sent.
Supported Notification Channels
Use the following predefined channel identifiers:
alertByEmailalertByReportalertByRunBookalertByWhatsAppalertByTicket
Example: Dynamically Controlling Channels Based on Metric Values
In the example below, the data model provides the Success Rate of online banking transactions (such as UPI, NEFT, RTGS, Credit Card, Debit Card, etc.). Based on this value, different notification channels are enabled.
success_rate = get_vumetric_value(D, 1, 'Success Rate')

if success_rate is not None and success_rate > 90:
    ALERT_CHANNELS.append('alertByEmail')
    EMAIL_ID_LIST = ['ops@rban.com', 'tom@rban.com']
elif success_rate is not None and success_rate < 80:
    ALERT_CHANNELS.append('alertByTicket')

RESULT = True
How this works
- If the success rate is greater than 90%, the alert is sent via Email
- If the success rate drops below 80%, a Ticket is created
RESULT = Trueensures the alert is generated- Recipient details are configured alongside the channel
Controlling Recipients per Channel
Each notification channel supports its own set of control variables, allowing you to define who receives the alert.
| Field Name | Channel | Description |
|---|---|---|
EMAIL_ID_LIST | List of email addresses (e.g., ops@rban.com) | |
EMAILGROUP_LIST | List of email group names (e.g., Support) | |
REPORT_LIST | Report | List of report names (e.g., CXO Report) |
PHONE_NUMBER_LIST | List of phone numbers (e.g., 9881234567) | |
RUNBOOK_SCRIPT | Runbook | Runbook script name (e.g., service_restart) |
These fields can be set or modified dynamically in the evaluation script, based on alert context and metric values.
Controlling Severity
The severity of the alert can be modified using an evaluation script.
Example
The following script increases the severity to information when the success rate goes above 90%:
RESULT = False

success_rate = get_vumetric_value(D, 1, "Success Rate")

if success_rate is not None and success_rate > 90:
    DYNAMIC_FIELDS['severity'] = 'information'
    RESULT = True
What this does
- If the success rate > 90% → alert is triggered with severity = information
- Otherwise → no alert is generated (
RESULT = False)
Modifying Summary and Description
Similar to severity, you can modify the summary and description fields of an alert through the evaluation script. This allows the alert message to be dynamically customized based on metric values.
success_rate = get_vumetric_value(D, 1, 'Success Rate')

if success_rate is not None and success_rate > 90:
    DYNAMIC_FIELDS['summary'] = 'Resource Usage High for %g'
    DYNAMIC_FIELDS['description'] = 'Investigation of this server .....'

RESULT = True
DYNAMIC_FIELDS['summary']andDYNAMIC_FIELDS['description']can include format specifiers like%g.- These values override whatever is configured in Step 3. Generate Content for the Alert of the alert setup.
Accessing Duration
The duration for which the current alarm condition has been active is available through the META_DATA dictionary. You can use this value to implement escalation logic based on how long the condition has persisted.
The duration is provided in minutes, allowing you to decide when additional notifications or stricter actions should apply.
RESULT = True

if META_DATA['duration'] > 6 * 60:   # 6 hours in minutes
    ALERT_CHANNELS.append('alertByEmail')
    EMAIL_ID_LIST = ['ops@rban.com', 'tom@rban.com']
What This Does
META_DATA['duration']→ number of minutes the alert condition has been continuously active.- If the duration exceeds 6 hours (360 minutes):
- Email alerting is added dynamically.
- Specific recipients are added to
EMAIL_ID_LIST.
RESULT = Trueensures that the alert is generated.
Accessing the History of an Alarm
An evaluation script can make use of the history of the alarm condition to decide alert behavior. The following example performs escalation if the condition has been activated more than 10 times in the last week.
RESULT = true

if len(META_DATA["history"]["list"]) > 10:
    ALERT_CHANNELS.append("alertByEmail")
    EMAIL_ID_LIST = ["ops@rban.com", "tom@rban.com"]
This script checks the number of past activations using the META_DATA['history']['list'] field and adds an additional channel when the threshold is exceeded.
Using Enrichments in Alerts
You can use metric values and grouping information available during alert evaluation to enrich the generated alert document. Enrichments help provide additional operational context, making alerts more meaningful and actionable for responders. Using the evaluation script, you can retrieve metric values, add custom fields, and dynamically populate alert attributes such as the summary, severity, and other contextual information.
The get_value_from_lookup_file() function is currently not supported in the NG Alert Engine. Until support is introduced in a future release, lookup file operations that require this function can be implemented using the Python Engine.
Example Evaluation Script
RESULT = false

if R1:
    server_name = get_vumetric_value(D, 1, "ServerName")
    cpu_usage = get_vumetric_value(D, 1, "cpu_usage")
    device_ip = get_vumetric_value(D, 1, "DeviceIP")

    DYNAMIC_FIELDS["ServerName"] = server_name
    DYNAMIC_FIELDS["DeviceIP"] = device_ip
    DYNAMIC_FIELDS["CPU_Usage"] = str(cpu_usage) + "%"
    DYNAMIC_FIELDS["summary"] = (
        "High CPU usage detected on " + str(server_name)
    )

    if cpu_usage >= 90:
        DYNAMIC_FIELDS["severity"] = "critical"
    else:
        DYNAMIC_FIELDS["severity"] = "warning"

    RESULT = true
What this script does
- Retrieves the server name, CPU usage, and device IP from the selected data model.
- Enriches the generated alert with additional contextual fields.
- Dynamically generates the alert summary using the server name.
- Sets the alert severity based on the CPU usage value.
- Generates the alert when the evaluation condition (
R1) evaluates to true.
Using Time of Alert
The time of alert is available in the variable OBSERVATION_TIME. This can be used to make decisions based on when the alert is generated.
Example: Different thresholds for business hours vs. non-business hours
success_rate = get_vumetric_value(D, 1, "success_rate")

# OBSERVATION_TIME is a datetime object
hour = int(OBSERVATION_TIME.strftime("%H"))

# Threshold adjustment for business hours (9-17) vs non-business hours
threshold = 80 if hour >= 9 and hour <= 17 else 60

RESULT = true if success_rate != None and success_rate > threshold else false
Example: Different thresholds for weekdays vs weekends
success_rate = get_vumetric_value(D, 1, "Success Rate")

# OBSERVATION_TIME is a datetime object
day = OBSERVATION_TIME.strftime("%A")

# Threshold adjustment for weekends
threshold = 50 if day in {"Sunday", "Saturday"} else 70

RESULT = true if success_rate != None and success_rate > threshold else false
OBSERVATION_TIME internally represents the last alert execution time in the local timezone.
Evaluation script for Mapping Fields to Alert Console Columns
Mapping using Evaluation Script (Dynamic Fields)
- The Alert Console supports specific columns such as Region, Status, Device IP, Affected Category, Business Impact, Source, Location, App Name, and others.
- These columns can be populated dynamically using the
DYNAMIC_FIELDSdictionary inside the Evaluation Script. - The following backend mapping is used by the alert engine. The key represents the column name displayed in the Alert Console, and the value represents the supported field name(s) that can be assigned within
DYNAMIC_FIELDS.
"Device IP":        ["DeviceIP", "target", "host"],
"Affected Category":["category"],
"Business Impact":  ["impact"],
"Source":           ["source"],
"Location":         ["location", "Location", "region"],
"Environment":      ["environment"],
"O11ysource Name":  ["o11ysource_name"],
"ServerName":       ["ServerName"],
"Business Journey": ["journey", "journey_name", "business_journey"],
"AppName":          ["application"],
"Component":        ["component", "component_name"],
"Component Type":   ["component_type"],
Example: Setting a static value using DYNAMIC_FIELDS
To populate the Device IP column, any of the mapped keys may be used:
DYNAMIC_FIELDS["Device IP"] = "1.0.0.0"
# OR
DYNAMIC_FIELDS["target"] = "1.0.0.0"
# OR
DYNAMIC_FIELDS["host"] = "1.0.0.0"
Dynamic value mapping example
If the value must be read from a Data Model:
# Fetch list of IPs from Data Model column "IP"
device_ip = get_vumetric_value(D, 1, "IP")

# Map it to "target" (accepted key for Device IP column)
DYNAMIC_FIELDS["target"] = device_ip
Mapping the Region for the Alert Trendgraph
Only the "Region-wise" trend is currently supported.
# Static value
DYNAMIC_FIELDS["location"] = "Bengaluru"

# OR fetch dynamically
city = get_vumetric_value(D, 2, "Region")
DYNAMIC_FIELDS["location"] = city
Mapping using Add Fields (Recommended for NG Engine)
- With the NG alert engine, you no longer need to use Evaluation Scripts for console-field mapping.
- Static values can be added directly using Add Fields in the Alert Configuration, making configuration easier and UI-driven.
- The table below lists Alert Console columns and the corresponding Key names you can enter in the Add Fields section.
| Alert Console Column | Supported Key(s) to Enter in Add Fields |
|---|---|
| Device IP | DeviceIP, target, host |
| Location | location, Location, region |
| Affected Category | category |
| Business Impact | impact |
| Source | source |
| App Name | Application, application_name, app_name, AppName |
| Business Journey | Journey, journey_name, business_journey |
| Component | component, component_name |
| Component Type | component_type |
| Server Name | server_name |
| Environment | environment |
| O11ysource Name | o11ysource_name |
Evaluation Script to Configure Related Dashboard
To configure Related Dashboards, use the YAML configuration as shown below. The “Device Availability Overview” is the name of a preconfigured dashboard referenced in the alert configuration.
DYNAMIC_FIELDS['related_dashboards'] = ['Device Avalibility Overview']
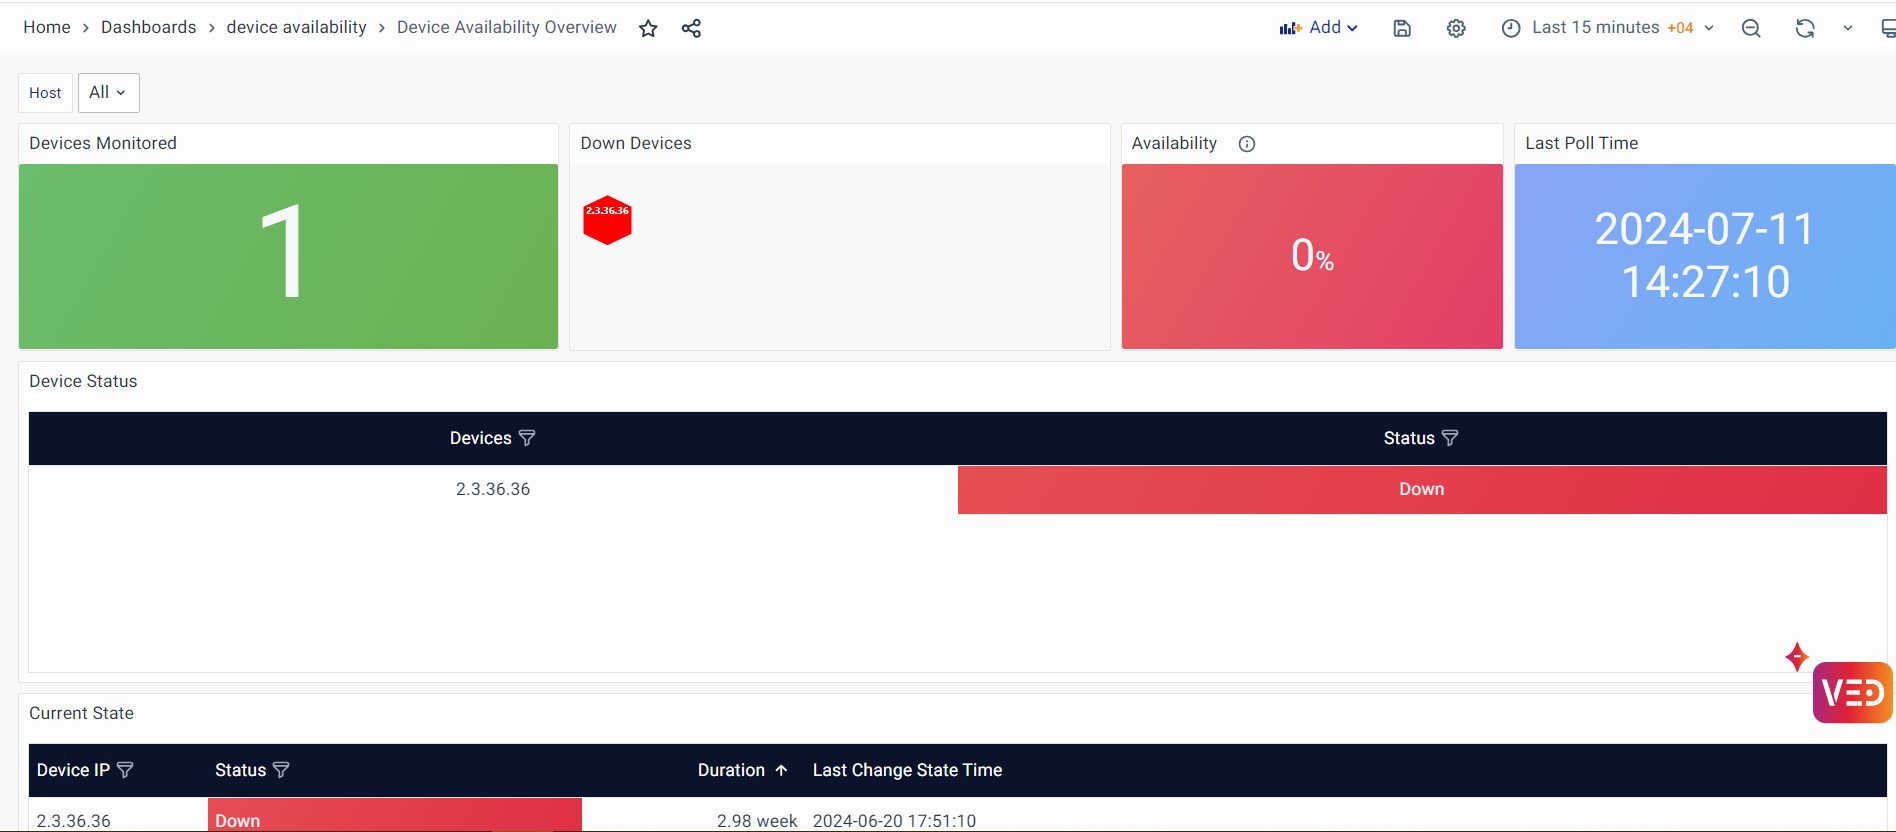
The output of this configuration is displayed in the Detailed View of the alert in the Alert Console.
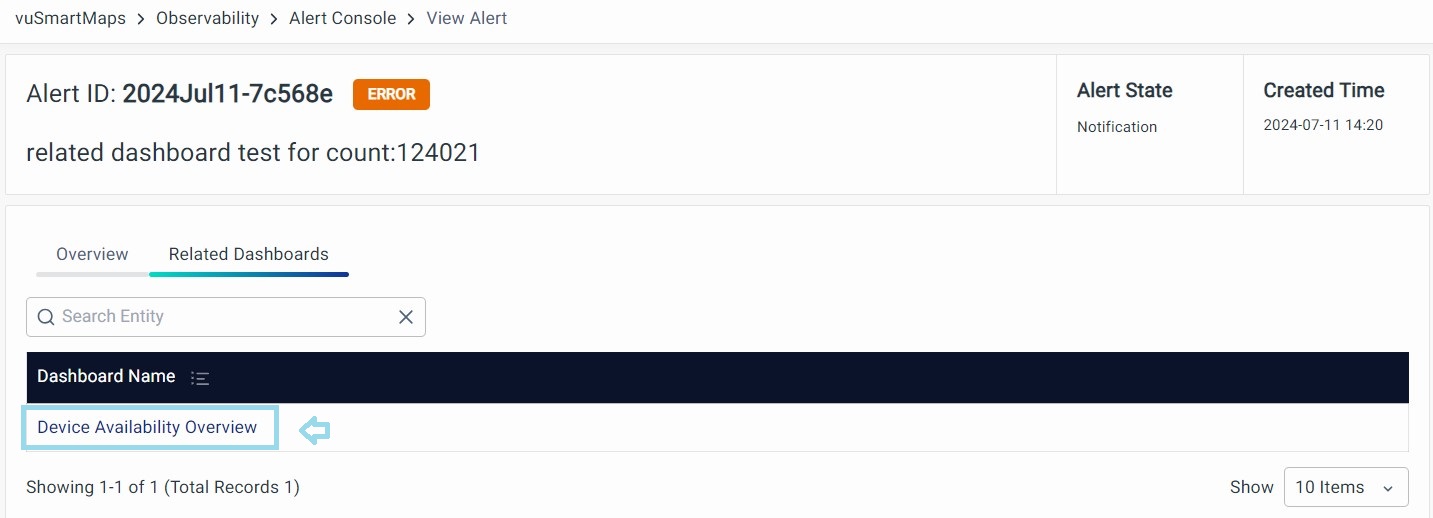
When you click on the highlighted dashboard name in the alert details, the corresponding dashboard opens and is displayed.
FAQs
What are Alert Evaluation Conditions?
Alert Evaluation Conditions define the logic used to determine when an alert should be generated. You can configure one or more conditions using metrics, thresholds, durations, custom expressions, or Starlark evaluation scripts.
What is the difference between Default Thresholds and Custom Thresholds?
Default Thresholds use the threshold values configured in the selected Data Model, whereas Custom Thresholds allow you to define alert-specific threshold values without modifying the Data Model.
When should I use Custom Expressions?
Use Custom Expressions when alert logic requires combining multiple evaluation conditions using logical operators such as AND (&&) and OR (||) without writing scripts.
When should I use an Evaluation Script?
Use a Starlark Evaluation Script only when the required alert logic cannot be achieved using evaluation conditions or custom expressions.
Can an alert rule monitor multiple metrics?
Yes. You can configure multiple evaluation conditions, each monitoring different metrics, and combine them using predefined evaluation options or custom expressions.
How is alert severity determined?
Alert severity is determined in the following order of precedence:
- Severity returned by the Evaluation Script.
- Alert-level Severity Override.
- Default or Custom Threshold Severity.
