Mobile Dashboard Studio
Overview
Mobile Dashboard Studio is used for creating and managing Mobile Dashboards and Mobile Visualizations in vuSmartMaps. Since web-based visualizations cannot be directly rendered on mobile devices, the platform provides a dedicated Mobile Dashboard Configuration feature for mobile-compatible visualization rendering.
The vuSmartMaps Mobile Application supports the following visualization types:
- KPI
- Table
- Trend Chart
- Insights
This feature helps banking operations teams, payment monitoring teams, NOC engineers, and support users access observability data directly from mobile devices without depending on desktop dashboards.
Prerequisites
Before configuring Mobile Dashboards in vuSmartMaps, ensure the following prerequisites are met:
- A public IP address or a valid domain with an SSL certificate must be configured to access vuSmartMaps from mobile devices.
- If vuSmartMaps is deployed inside a restricted network or firewall environment that blocks internet access, one of the following secure access mechanisms must be configured:
- VPN (Virtual Private Network) Allows mobile users to securely connect to the internal organization network.
- MDM (Mobile Device Management) Enables controlled and managed access from enterprise mobile devices.
- API Gateway Allows secure communication between the vuSmartMaps Mobile Application and backend servers.
Organizations can choose the most suitable access mechanism based on their security and network architecture requirements.
Why This Feature Is Useful
In banking and payment ecosystems, monitoring teams often need immediate access to operational insights while away from their workstations. Mobile Dashboard Configuration supports operational continuity by providing mobile-ready dashboards for critical observability use cases.
This feature helps teams:
- Monitor transaction health remotely.
- View payment KPIs in real time.
- Track transaction latency trends.
- Review operational insights during incidents.
- Access observability dashboards during escalations.
- Monitor business-critical systems while on call.
For example:
- A UPI operations team can monitor transaction success rates during peak traffic hours.
- A support engineer can analyze payment latency trends from a mobile device during production incidents.
- An NOC engineer can monitor infrastructure KPIs while performing field activities.
Example Scenario
A bank’s payment operations team wants to provide mobile access to critical transaction monitoring dashboards.The team creates a Mobile Dashboard containing:
- KPI visualization for UPI transaction success percentage.
- Trend Chart for transaction latency.
- Table visualization for failed transaction categories.
- Insights visualization for operational alerts.
The dashboard is enabled and assigned to mobile users. Operations engineers can now monitor payment health and transaction trends directly from the vuSmartMaps Mobile Application during incidents, maintenance activities, or operational reviews.
When to Use This Feature
Use Mobile Dashboard Configuration in the following scenarios:
- When users require monitoring access from mobile devices
- When operational dashboards need mobile-compatible rendering
- When critical KPIs must be monitored remotely
- When transaction trends need to be visualized on mobile
- When management teams require simplified executive dashboards
- When operational alerts and insights need mobile visibility
- When organizations want mobile-based observability access for support teams

Comprehensive Understanding
To access Mobile Dashboard Studio: Left Navigation Menu → Observability Studios → Mobile Dashboard Studio On clicking the Mobile Dashboard Studio option, the Mobile Dashboard landing page opens.The Mobile Dashboard module primarily consists of four major areas:
Mobile Dashboard Listing Page
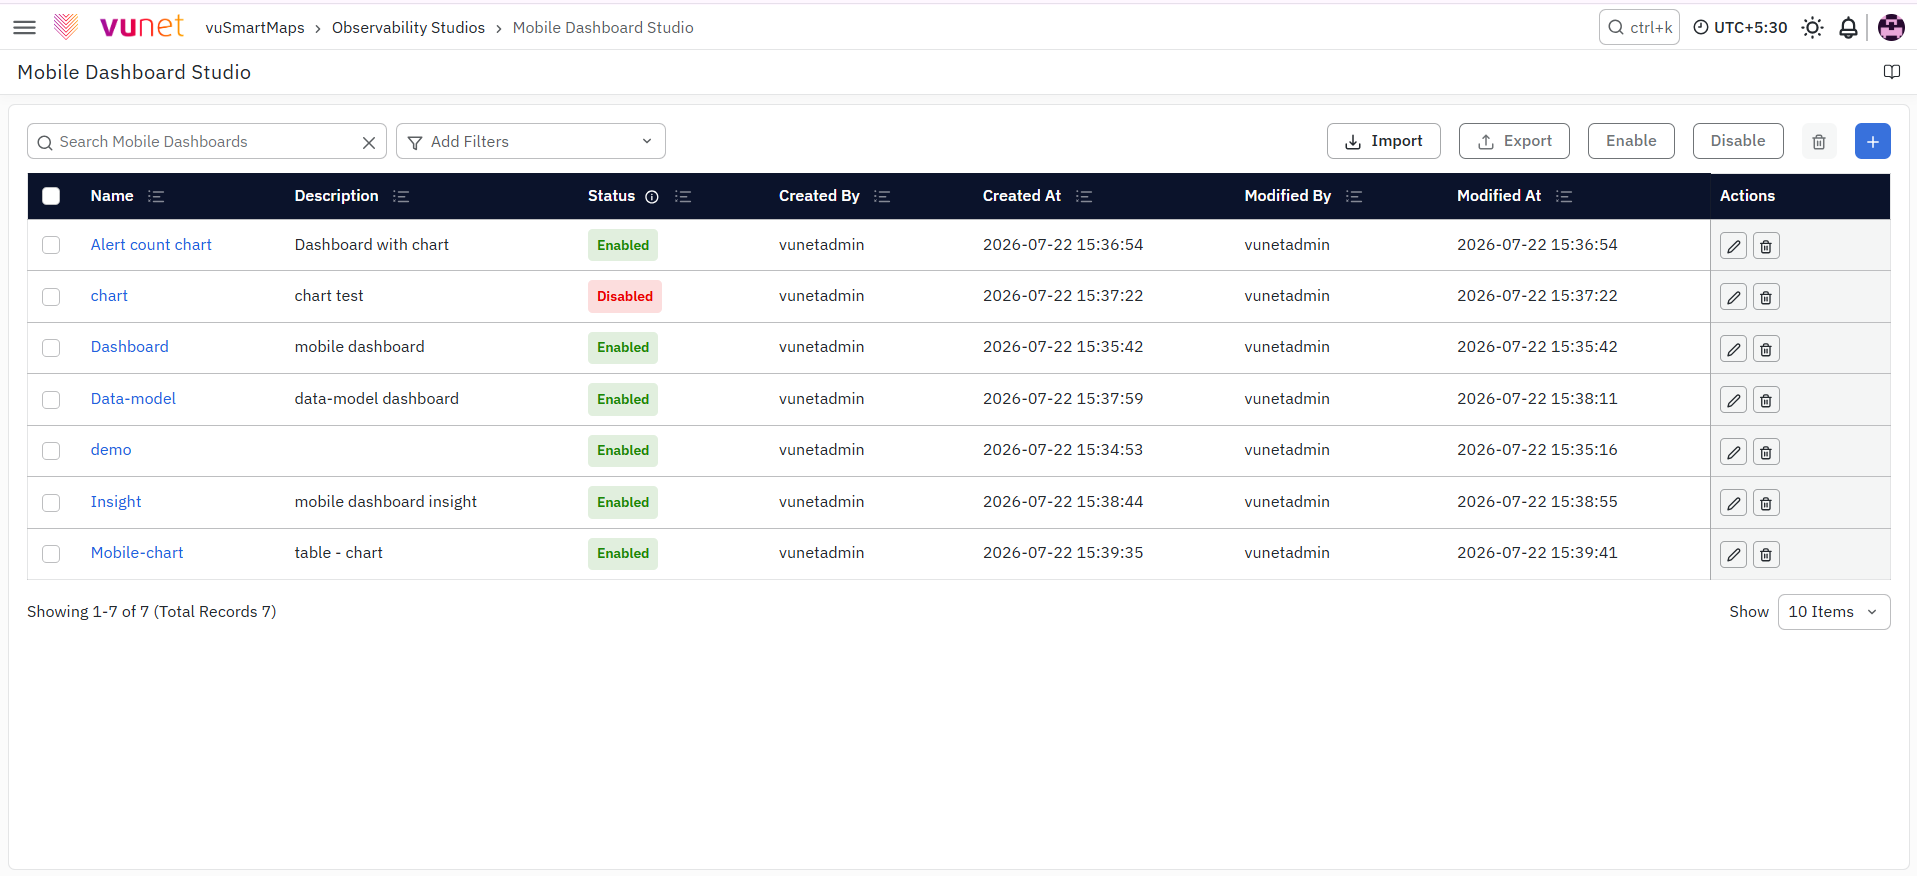
The Page acts as the centralized management console for Mobile Dashboards.
Users can:
- View existing Mobile Dashboards.
- Edit dashboards.
- Delete dashboards.
- Add new dashboards.
The page also displays:
- Dashboard Description
- Dashboard Status
- Created By
- Created At
- Modified By
- Modified At
The Dashboard Status determines whether the dashboard is visible in the Mobile Application. Even if a dashboard is assigned to a mobile user, it will only appear when the dashboard is enabled.
Mobile Dashboard Configuration Page
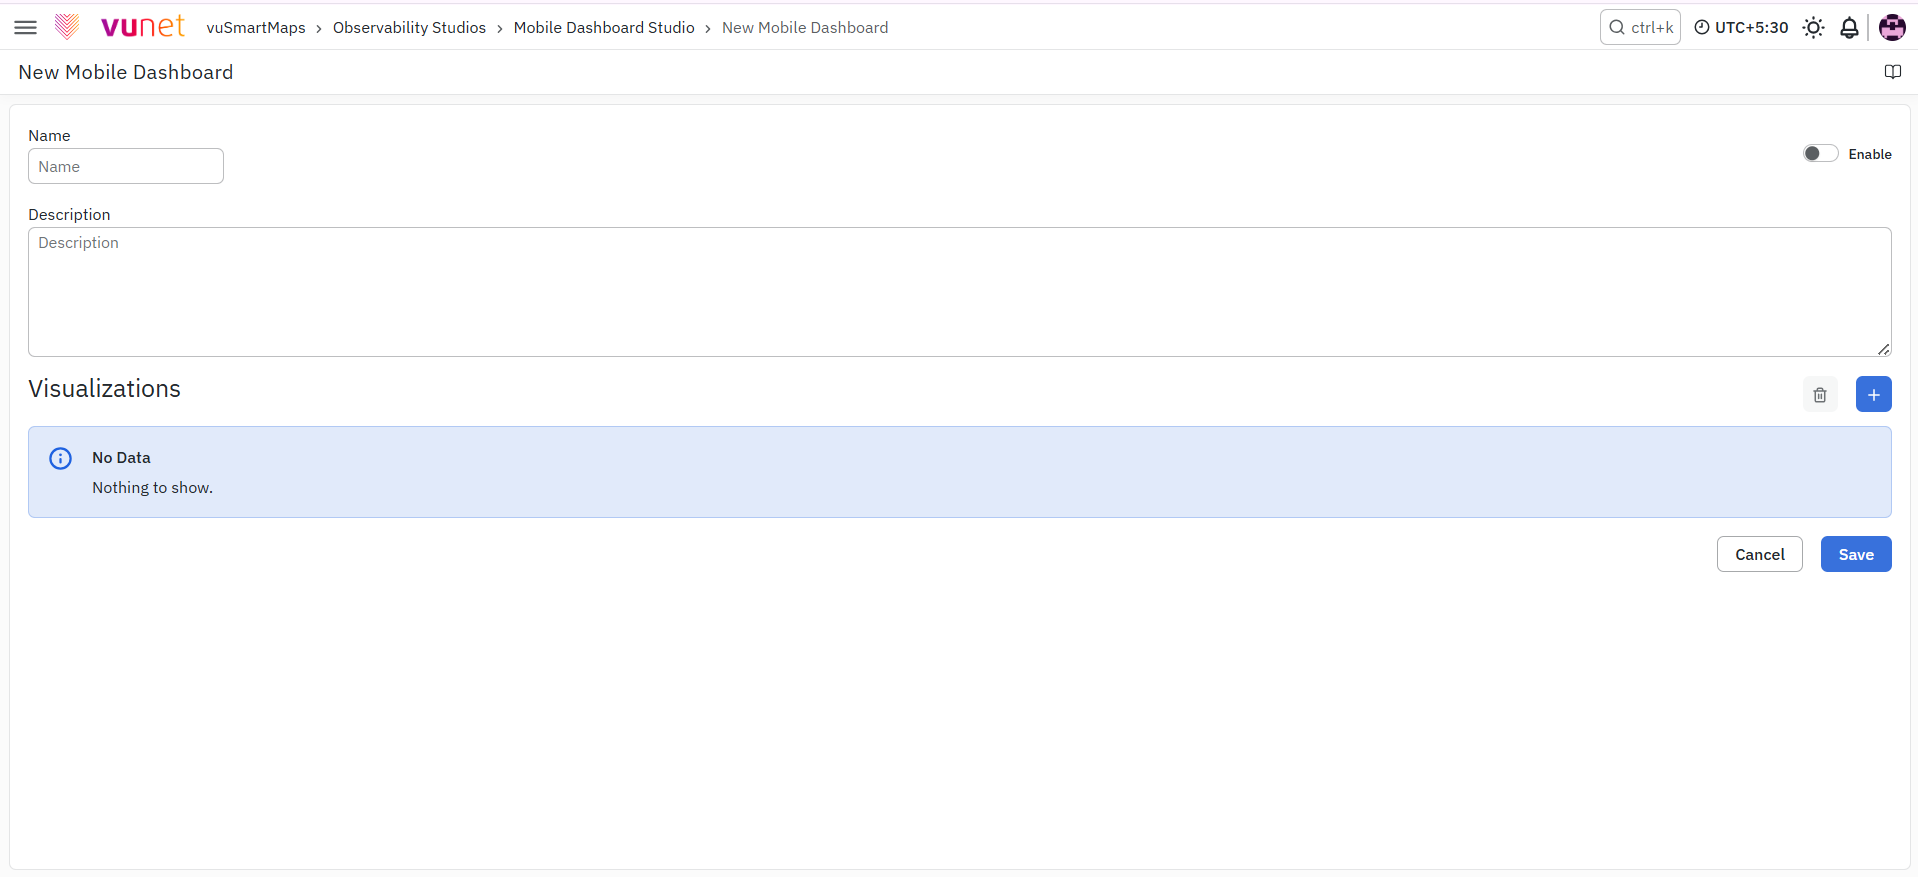
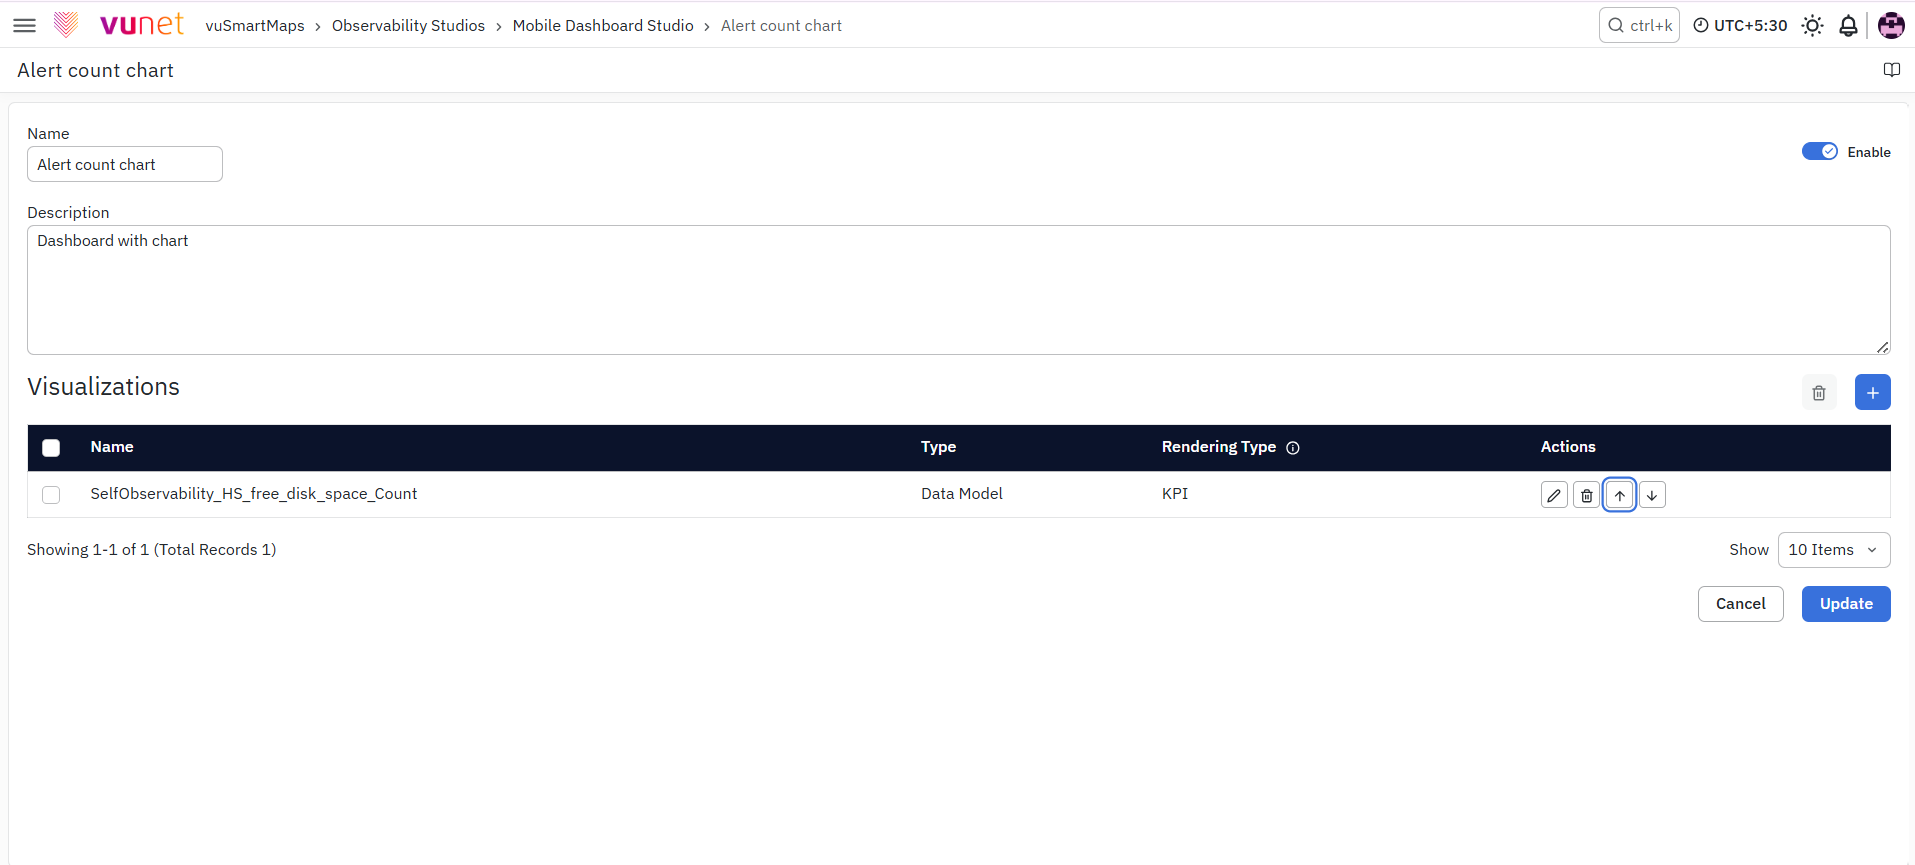
The Mobile Dashboard Configuration Page is used to configure dashboard properties and visualizations.Users can:
- Configure the Dashboard Name.
- Configure the Dashboard Description.
- Enable or disable dashboard visibility.
- Add mobile-compatible visualizations.
- Select visualization type.
- Select rendering type.
- Rearrange visualization order.
The Dashboard Name should always be unique. This helps avoid validation conflicts during dashboard creation or import operations. The Description field is optional and is generally used for:
- Dashboard grouping
- Operational identification
- Categorization of related visualizations
Data Model Creation Details
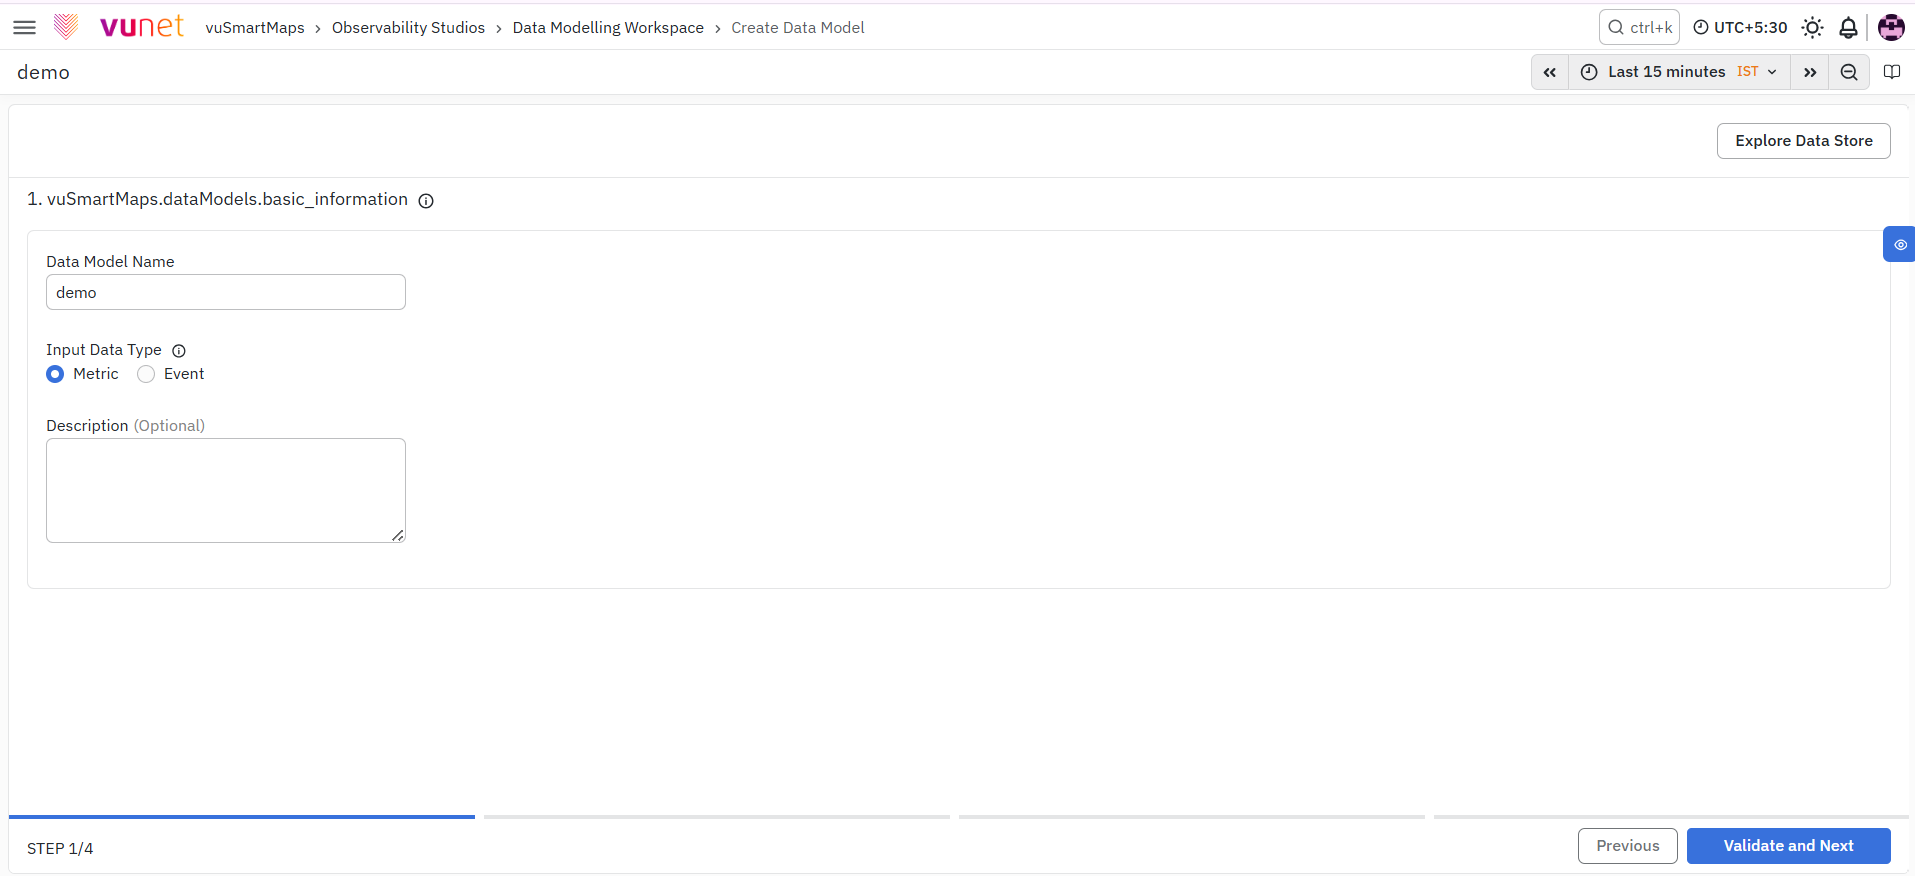
The Mobile Dashboard feature relies on properly configured Data Models. At least one metric must be selected during Data Model creation. Only selected metrics are rendered inside the Mobile Application. Different visualization types require different Data Model structures.
KPI Visualization Requirements
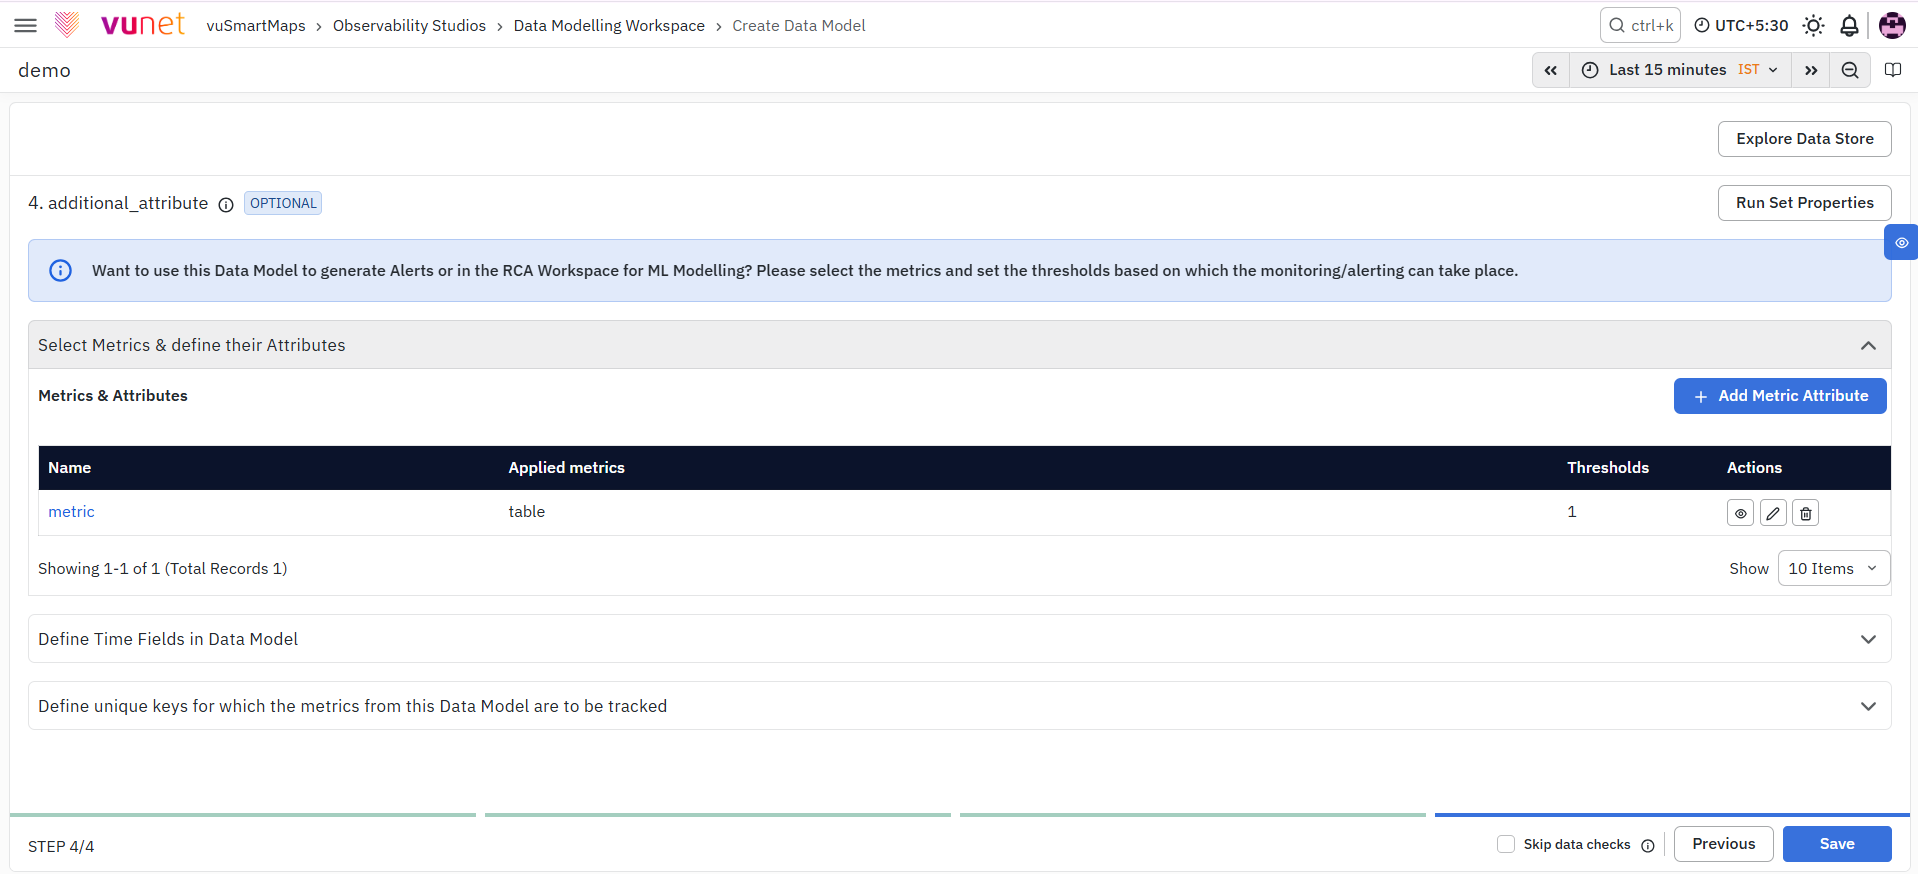
For KPI rendering:
- Numerical aggregation must be configured.
- No grouping fields should be selected in the Define Unique Keys section.
This ensures that the Mobile Application displays a single aggregated KPI value.
Trend Chart Visualization Requirements
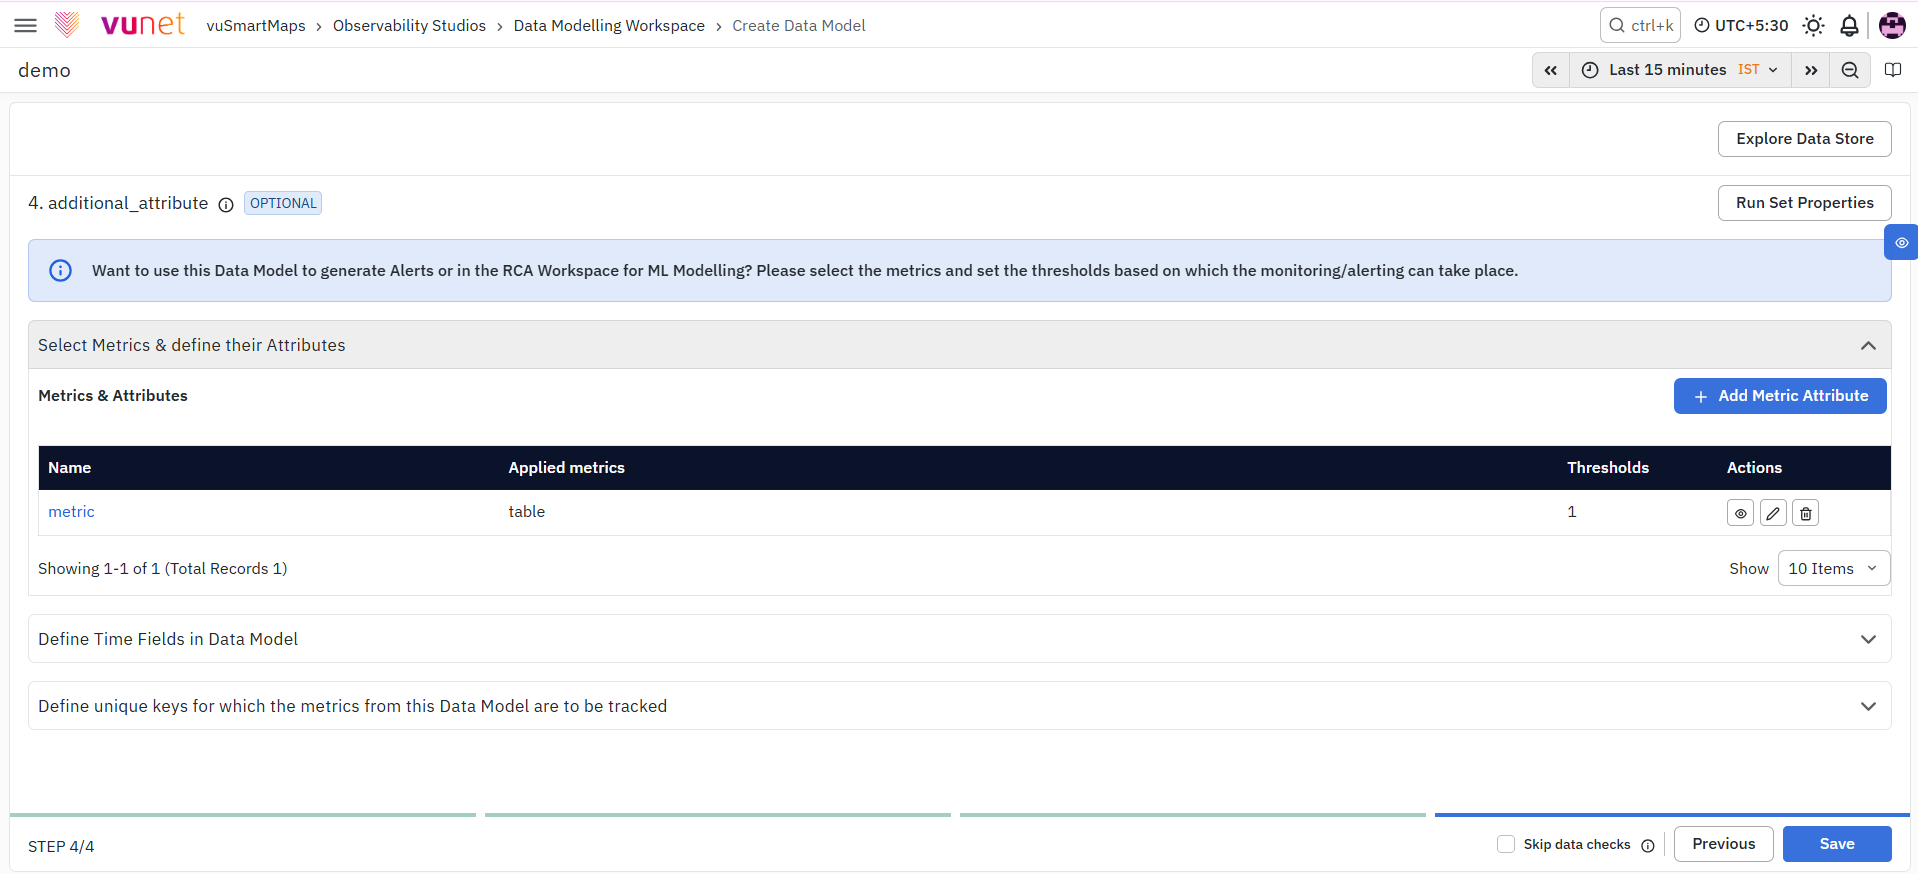
For Trend Chart rendering:
- The Data Model must use time-series data.
- At least one metric must be selected.
This allows historical trends to be rendered properly in the Mobile Application.
Table Visualization Requirements
For Table rendering:
- One or more grouping fields must be configured.
- Fields selected under Select Metrics must not overlap with fields selected under Define Unique Keys.
- Threshold must be configured for each selected metric.
Example:
- Grouping Fields
asc_targetasc_target_state
- Metric
count
Improper overlap between grouping fields and metrics may result in incorrect visualization rendering.
Import / Export Mobile
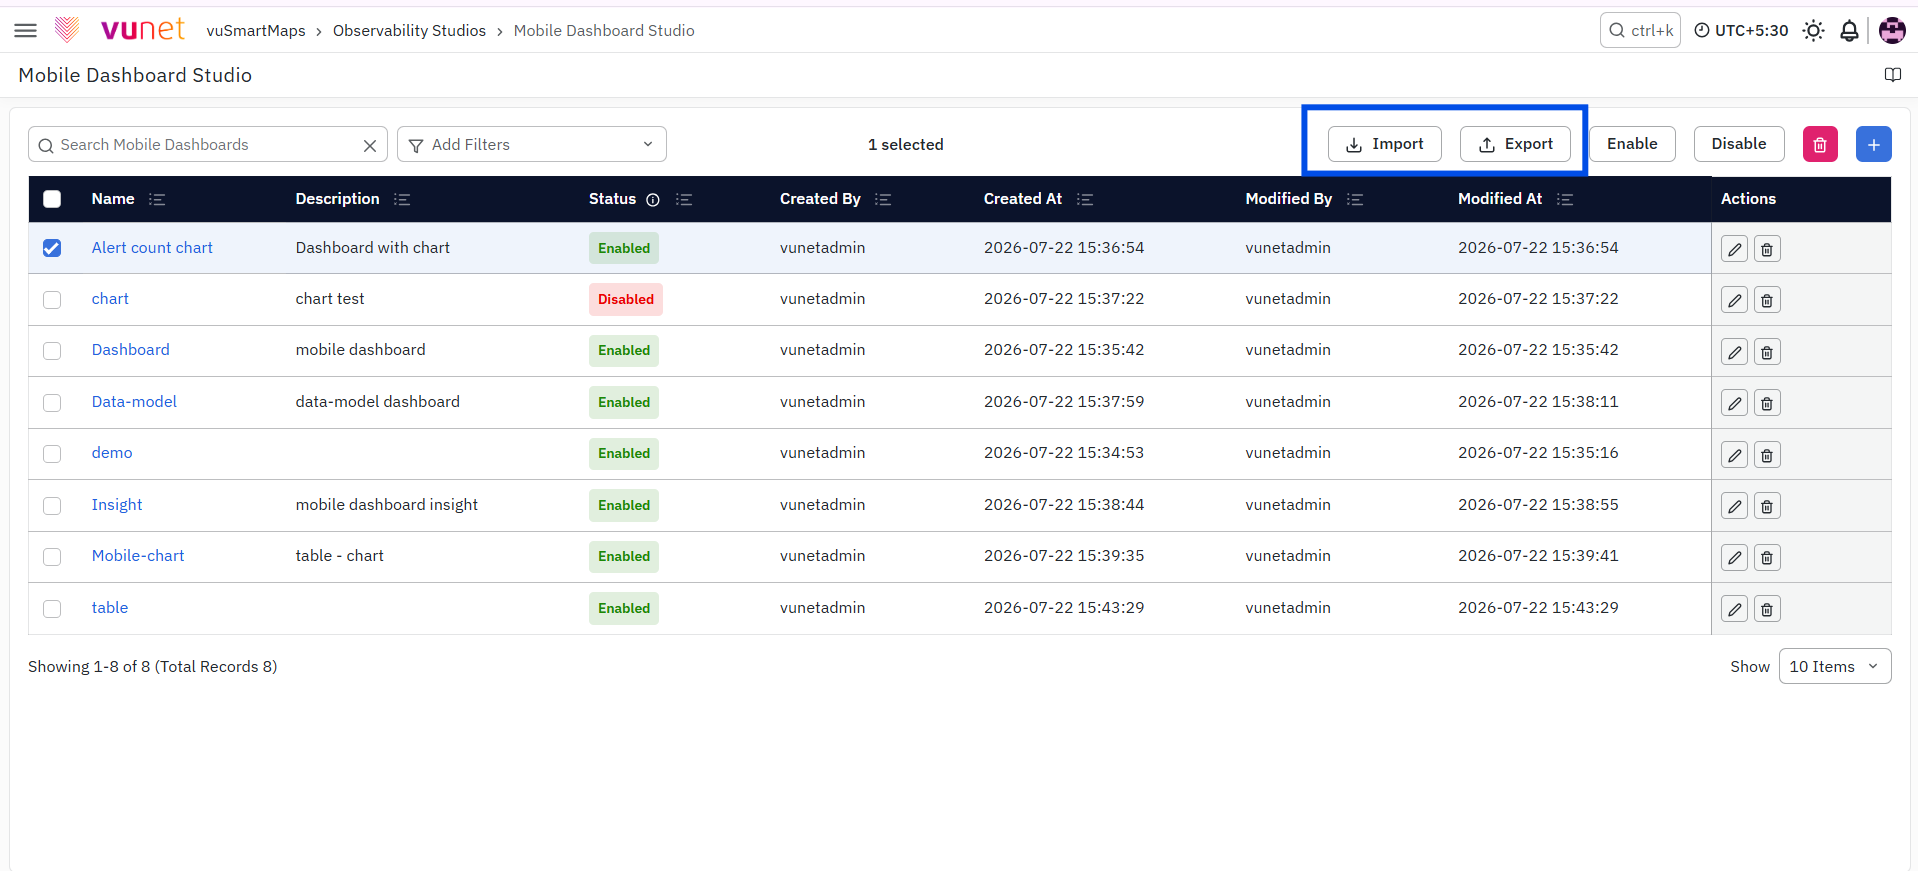
The module supports dashboard portability using Import and Export operations.
Using Export:
- Users can select one or more dashboard rows.
- Export selected dashboards as JSON.
- Store configurations for backup or migration.
Using Import:
- Users can upload previously exported JSON files.
- Recreate dashboards in another environment.
Import operations fail if a dashboard with the same name already exists in the environment. This validation prevents duplicate dashboard creation.
Dashboard Name
Used to configure a unique Dashboard name. Example: Insights
Unique Dashboard names should always be used to prevent validation errors.
Dashboard Description
Optional field used for:
- Dashboard categorization
- Visualization grouping
- Operational identification
Enable / Disable Dashboard
Used to control dashboard visibility in the Mobile Application. The dashboard can be enabled or disabled from:
- Mobile Dashboard Configuration page
- Mobile Dashboard Listing page
Visualizations Section
Used to configure mobile-compatible visualizations.
Users can:
- Add visualizations
- Preview Data Models
- Edit visualizations
- Rearrange visualization order
Supported Visualization Types:
- Data Model
- Insights
HTML Insights with JavaScript are currently unsupported.
Rendering Type
Available only when Visualization Type is selected as Data Model. Supported Rendering Types:
- KPI
- Table
- Trend Chart
Incorrect Data Model selection for a rendering type may cause visualization failures in the Mobile Application.
Step-by-Step Instructions
Create a Mobile Dashboard
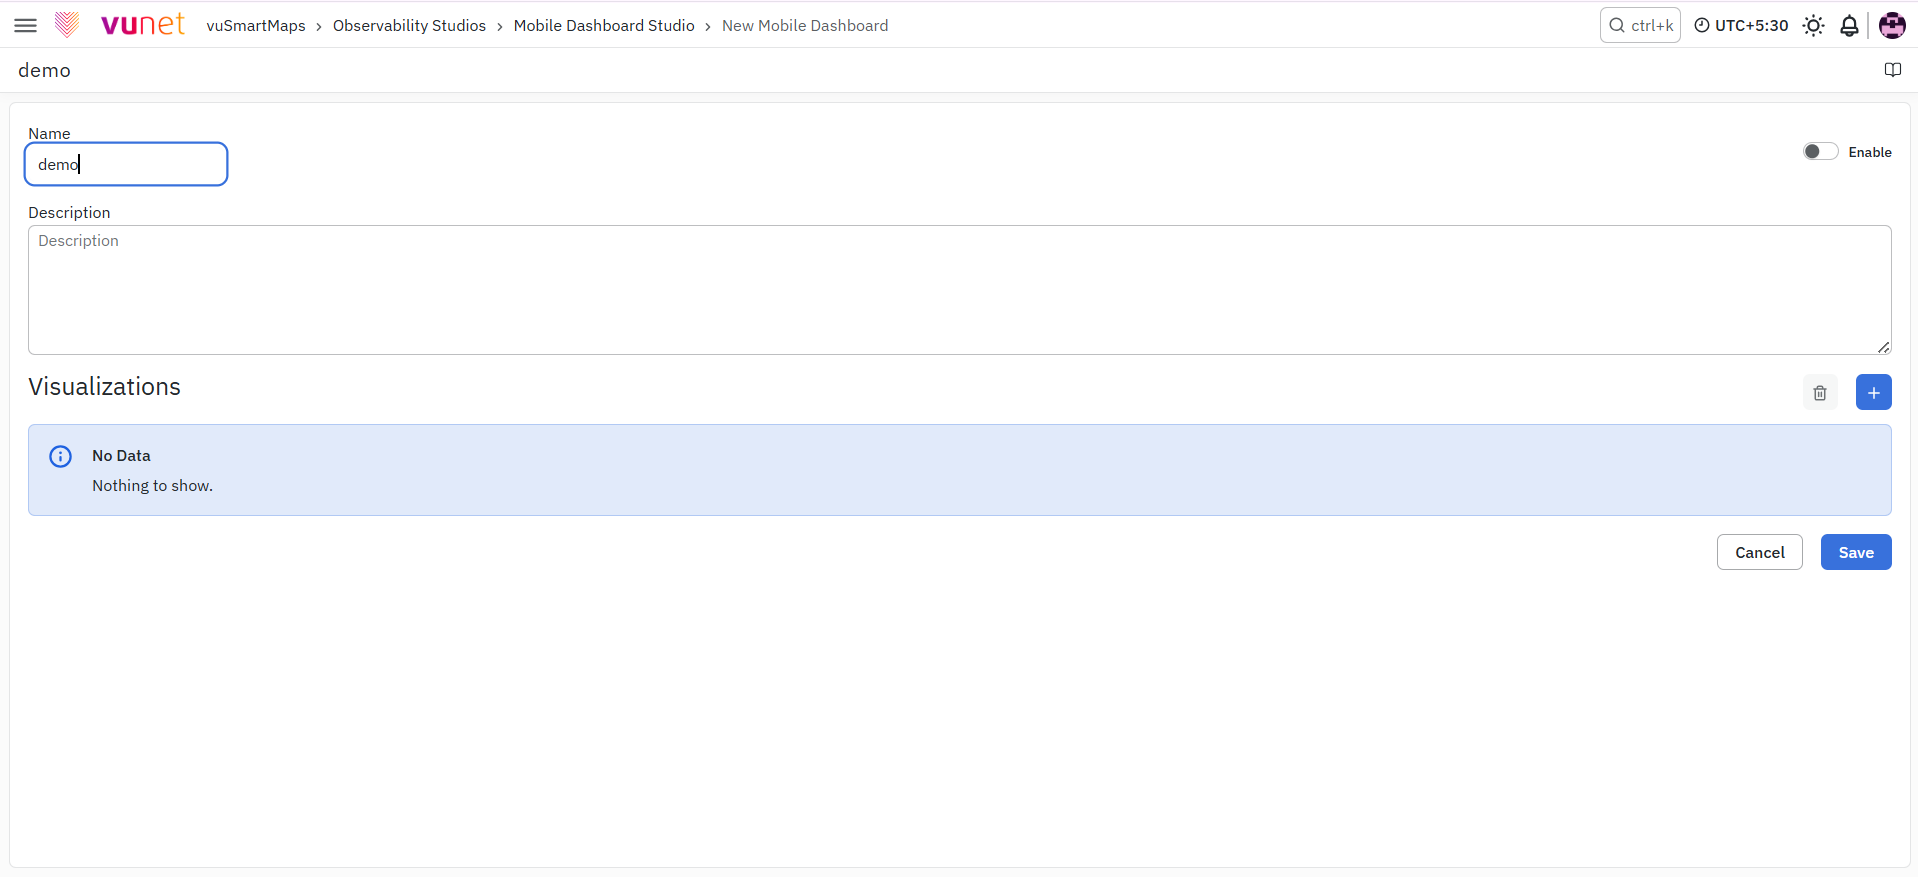
- Navigate to: Left Navigation Menu → Observability Studios → Mobile Dashboard Studio
- The Mobile Dashboard Listing Page opens.
- Click the + icon to create a new Mobile Dashboard.
- Enter the Dashboard Name.
- Optionally provide the Dashboard Description.
- Enable or disable the Dashboard as required.
Add Visualization
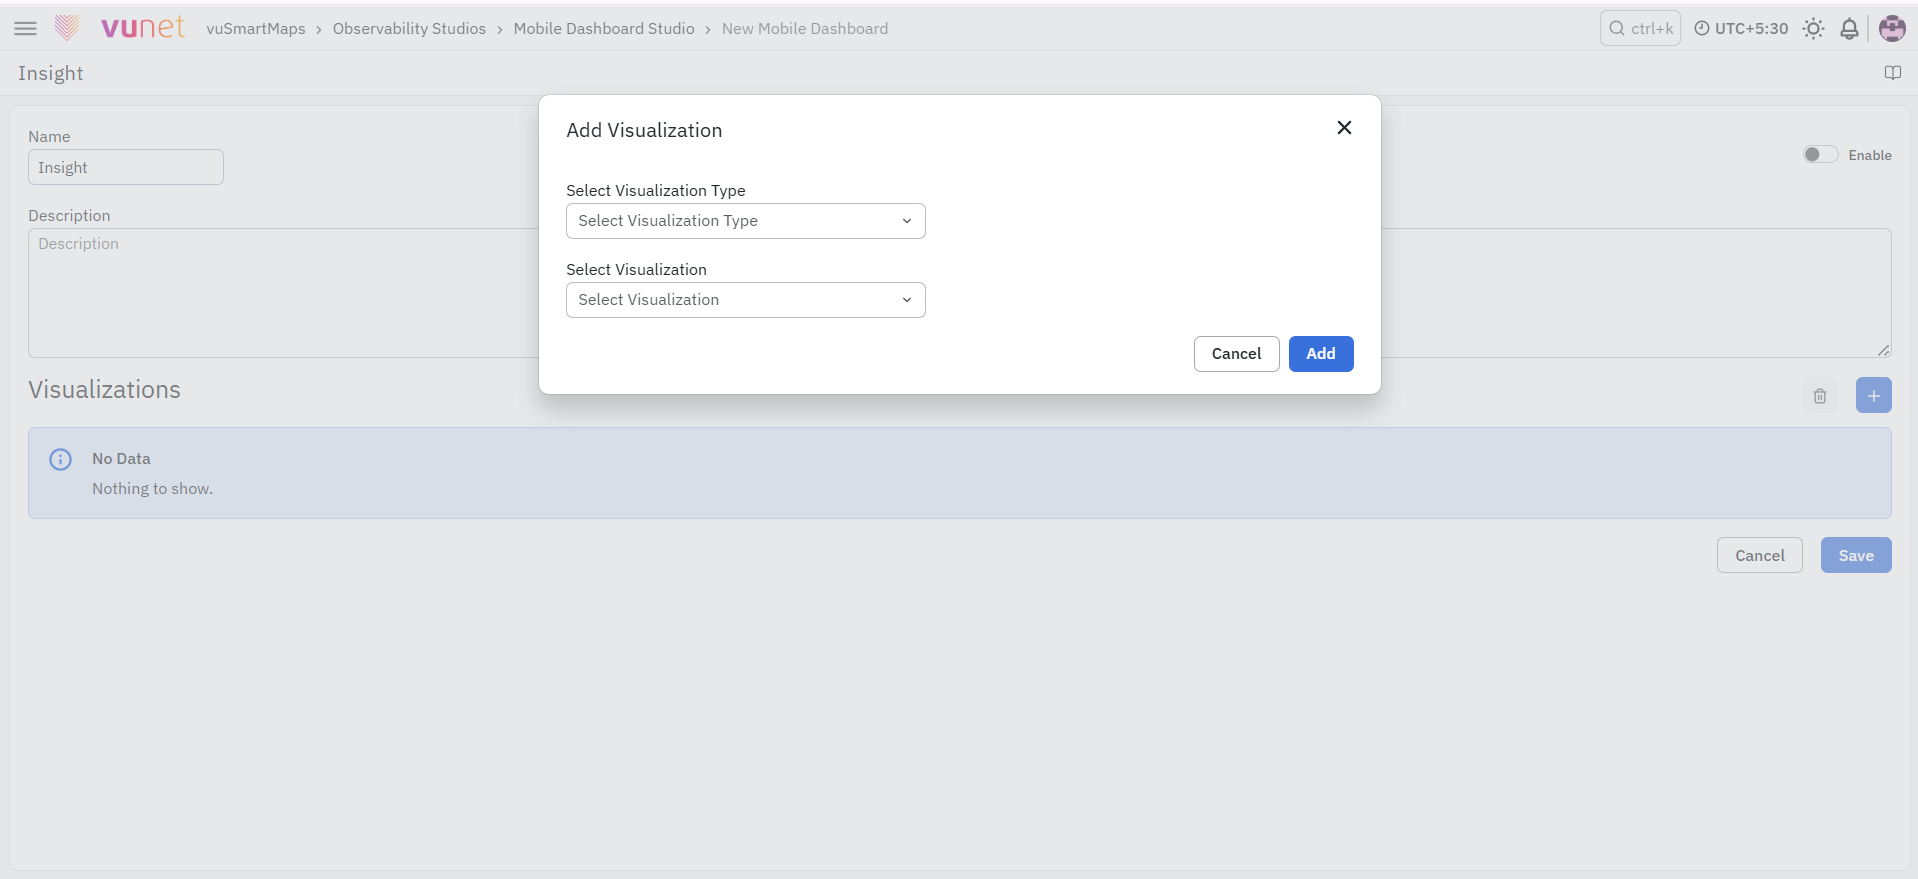
- In the Visualizations section, click the + icon.
- The Add Visualization dialog opens.
- Select the Visualization Type:
- Data Model
- Insights
- Select the required Visualization.
The available options depend on the selected Visualization Type.
Use a unique Dashboard Name. Duplicate names can cause validation errors during dashboard creation or import operations.
Configure Rendering Type
If Visualization Type is selected as Data Model, select the Rendering Type:
- KPI
- Table
- Trend Chart
Preview Visualization
- Select the Data Model from the Select Visualization dropdown.
- Preview the selected Data Model before adding it to the Dashboard.
Create Data Model or Insights Directly
- Click the + icon beside Select Visualization.
- The system redirects based on Visualization Type:
- Data Model → Data Model Creation page
- Insights → Dashboard Creation page
Add Visualization Entry
- Click Add.
- The Visualization entry appears at the top of the Visualizations table.
- Rearrange the order using the Up and Down arrows under the Actions column.
Visualization order determines the rendering sequence in the Mobile Application.
- Use the Edit button under Actions to modify visualization configuration.
- Click Save.
- The Mobile Dashboard is created and displayed in the Mobile Dashboard Listing Page.
Import Mobile Dashboard
- Click the Import button.
- Upload the exported JSON file.
- The Dashboard configuration is imported into the environment.
Import fails if a Dashboard with the same name already exists.
Export Mobile Dashboard
- Select one or more Dashboard rows.
- Click the Export button.
- A JSON file containing Dashboard configuration details is downloaded.
What Happens After the Steps
After saving:
- The Mobile Dashboard appears in the Mobile Dashboard Listing Page
- Enabled Dashboards become available in the Mobile Application
- Visualizations are rendered in the configured sequence
- Supported visualizations are displayed using mobile-compatible rendering
- Mobile users assigned to the Dashboard can access it through the Mobile Application
Tips / Best Practices
- Use meaningful and unique Dashboard names.
- Keep mobile dashboards operationally focused and lightweight.
- Place critical KPIs at the top of the visualization order.
- Validate Data Models before adding them to dashboards.
- Use Trend Charts for transaction latency monitoring.
- Use Tables for grouped operational summaries.
- Export dashboards periodically for backup and migration purposes.
- Avoid duplicate dashboard names during Import operations.
Troubleshooting
-
Issue: Dashboard not visible in Mobile Application.
- Possible Cause: Dashboard is disabled.
- Solution: Enable the Dashboard from:
- Mobile Dashboard Configuration page.
- Mobile Dashboard Listing page.
-
Issue: KPI visualization not rendering properly.
- Possible Cause: The Data Model does not meet KPI rendering requirements.
- Solution: Ensure that:
- Numerical aggregation is configured.
- No grouping fields are selected in Define Unique Keys.
-
Issue: Trend Chart visualization not rendering properly.
- Possible Cause: The Data Model is not configured as time-series data.
- Solution: Ensure that:
- Time-series configuration is enabled.
- At least one metric is selected.
-
Issue: Table visualization not rendering correctly.
- Possible Cause: Grouping fields and metrics overlap.
- Solution: Ensure that:
- One or more grouping fields are configured.
- Metrics do not overlap with Define Unique Keys fields.
- Threshold is configured for each metric.
- Example: Grouping Fields (
asc_target,asc_target_state), Metric (count).
-
Issue: Import operation fails.
- Possible Cause: A Dashboard with the same name already exists.
- Solution: Rename the Dashboard before importing the JSON file.
-
Issue: Insights visualization not supported.
- Possible Cause: HTML Insights with JavaScript are unsupported.
- Solution: Use supported Insights configurations only.
FAQs
What is Mobile Dashboard Configuration used for?
Mobile Dashboard Configuration is used to create and manage Mobile Dashboards and Mobile Visualizations for the vuSmartMaps Mobile Application. It allows users to configure mobile-supported visualizations such as KPI, Table, Trend Chart, and Insights.
Why is a separate Mobile Dashboard required?
Web-based visualizations cannot be directly visualized on mobile. Mobile Dashboard Configuration provides a dedicated way to create dashboards and visualizations that can be viewed properly in the vuSmartMaps Mobile Application.
What are the prerequisites for accessing vuSmartMaps from a mobile device?
To access vuSmartMaps from a mobile device, a public IP address or a valid domain with an SSL certificate must be configured. If vuSmartMaps is deployed inside a restricted network, access can be enabled using VPN, MDM, or API Gateway based on the organization’s security requirements.
How can I access Mobile Dashboard Studio?
Mobile Dashboard Studio can be accessed from the left navigation menu using the path:
Left Navigation Menu → Observability Studios → Mobile Dashboard Studio
Why is my Mobile Dashboard not visible in the Mobile Application?
A Mobile Dashboard is visible in the Mobile Application only when it is enabled. Even if the dashboard is assigned to a mobile user, it will not appear in the Mobile Application if the dashboard status is disabled.
What details are shown on the Mobile Dashboard Listing Page?
The Mobile Dashboard Listing Page shows the list of existing Mobile Dashboards. It includes details such as dashboard description, status, created by, created at, modified by, modified at, and available actions such as edit and delete.
What visualization types can be added to a Mobile Dashboard?
A Mobile Dashboard can include visualizations based on Data Model or Insights. When Data Model is selected, the supported rendering types are KPI, Table, and Trend Chart.
What should I check before selecting a Data Model for mobile visualization?
The Data Model must match the selected rendering type. KPI visualizations require numerical aggregation with no grouping. Trend Charts require time-series data and one metric. Table visualizations require one or more grouping fields, and selected metrics must not overlap with fields selected under Define Unique Keys.
Does visualization order matter in the Mobile Dashboard?
Yes. The order of visualizations in the Visualizations table determines the display sequence in the Mobile Application. Users can rearrange visualizations using the Up and Down arrow icons under the Actions column.
Why does Mobile Dashboard import fail?
Import fails if the JSON file contains a Mobile Dashboard with the same name as an existing saved Mobile Dashboard. To resolve this, ensure that the dashboard name is unique before importing the JSON file.
