Alerting Common Use Cases and Examples
This section explains common use cases encountered in configuring alert rules.
Alert Configuration with Multiple Rules
Users often want to create alert rules with multiple related conditions to ensure more meaningful and actionable notifications.
For example, instead of having separate alerts for server resource usage and application service turnaround time, it is more effective to trigger a single alert when both conditions are met. Here’s how such an alert rule can be configured:
Condition 1: Check CPU Usage and Memory Usage (Server Resource Usage Data Model).
Condition 2: Check Service Requests Turnaround Time (TAT Data Model).
The Server Resource Usage Data Model used for Condition 1 can include multiple metrics that monitor various health parameters such as CPU usage, memory usage, disk I/O, and more. This allows you to create comprehensive alerts that consider multiple factors together.
Default Evaluation Behavior
By default, the NG Alert Engine generates notifications only when all conditions are true. So, if there are two conditions, C1 and C2, an alert is generated when both conditions are satisfied.
Custom Evaluation Logic
If you want to trigger an alert when either the turnaround time is high or the server resource usage is high, you can configure an OR condition using the evaluation script.
In this example, an alert is generated when either condition is met:
- R1 → Server resource usage is high
- R2 → Service turnaround time is high
# Trigger alert if either condition is true
RESULT = False

if R1 or R2:
    RESULT = True
With this evaluation logic:
- The alert is generated if any one of the conditions evaluates to
true. - The alert details will include the metrics and evaluation results of the condition(s) that contributed to the alert.
- This helps users clearly understand whether the alert was triggered due to high server resource usage, high turnaround time, or both.
Alert When Any or All of the Conditions Turn True
In a default alert rule with multiple conditions, the NG Alert Engine generates alerts only when all conditions are true (for example: C1 and C2 and C3 and C4).
If you want the system to trigger an alert when any one of the conditions is true, you can configure the evaluation script using an OR condition, such as:
C1 or C2 or C3 or C4
You can also define more advanced evaluation logic by combining conditions.
For example:
C1 and (C2 or C3) and not C4
This logic generates an alert when C1 is true, either C2 or C3 is true, and C4 is false.
Tracking State Changes Along with Other Conditions
In some cases, alerts must be generated based on a state change combined with a threshold condition. For example, suppose you want to generate notifications when:
- The connectivity status is Down, or
- The connectivity latency exceeds 100 ms
To achieve this, you would configure:
- Condition C1 using a Data Model that tracks connectivity status
- Condition C2 using a Data Model that tracks latency
By default, alerts are generated only when both conditions are true.
To trigger an alert when either condition is met, you can modify the evaluation logic as follows:
RESULT = False

if C1 or C2:
    RESULT = True
With this configuration, notifications are generated whenever any one of the specified conditions evaluates to true.
Users Interested Only in Down Event Notifications
If you want notifications only when a component enters an undesired state (for example, when connectivity changes to Down), you can disable alarm mode in the condition configuration.
When alarm mode is disabled:
- Notifications are generated at regular intervals (default: every 5 minutes) while the condition remains true
- Throttling can be configured to control notification frequency
- No clear notification is generated
- Notifications stop automatically when the condition is no longer true
This configuration is useful when users are interested only in continuous updates for a specific undesired state rather than full alarm lifecycle tracking.
Summarized Notifications
In scenarios where vuSmartMaps is used to monitor the success rate of different transaction types in an e-commerce application, you may want to receive notifications when the success rate of any transaction type falls below a defined threshold (for example, 85%).
| Transaction Type | Success Rate | Action Required |
|---|---|---|
| Login | 92% | No Action |
| Checkout | 81% | Alarm |
| Payment | 76% | Alarm |
| Search | 93% | No Action |
| User Settings | 95% | No Action |
| Review | 87% | No Action |
In this example, only Checkout and Payment transaction types require attention, as their success rates have dropped below the configured threshold.
Instead of receiving separate alerts for each transaction type, NG Alert Engine supports summarized notifications, allowing you to receive a single consolidated notification when multiple related conditions are breached. This helps reduce alert noise and provides a clearer operational view.
'notification_level': 0
Some transaction types are experiencing lower success rates than usual. Here are the current success rates for each transaction type:
| Transaction Type | Success Rate |
|---|---|
| Login | 92% |
| Checkout | 81% |
| Payment | 76% |
| Search | 93% |
| User Settings | 95% |
| Review | 87% |
Adding Contextual Information
To provide additional contextual information in alert notifications, such as listing the top CPU-consuming processes when a high CPU usage alert is triggered, you can use Information Rules. Information Rules allow you to enrich alert notifications with supporting data that helps operators quickly understand the issue. Refer to the Information Rules section for more details.
Removing Metrics from Contextual Information in an Alert
When multiple conditions are configured in a single alert, the results from all conditions are included in the alert notification by default. However, there are scenarios where you may want to exclude contextual data from specific conditions.
Example Scenario
- Condition C1: Low transaction volume
- Condition C2: Kafka stream processing lag
You may want to generate an alert for low transaction volume only when Kafka lag is within limits, but exclude Kafka lag details from the alert notification.
This can be achieved through Evaluation Script settings.
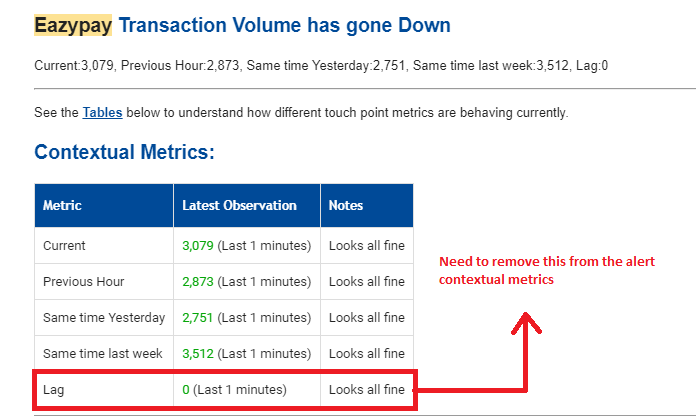
You can remove contextual data for a specific condition by clearing its entry from the D array after performing the required checks.
Example:
RESULT = False

if C1 and C2:
    # Remove contextual data for Condition 2 from alert output
    D[1] = {}
    RESULT = True
This ensures:
- The alert is triggered based on both conditions
- Only relevant contextual information is included in the notification
Sending Periodic Updates When an Alarm Persists
NG Alert Engine supports periodic update notifications when an alarm remains active for a prolonged duration. These updates help operators stay informed without repeatedly triggering new alarms. Periodic updates are configured per notification channel using Advanced Configuration settings.
Supported Channel Update Settings
| Channel | Configuration Key |
|---|---|
| EmailAlerterUpdate | |
| SMS | SmsAlerterUpdate |
| WhatsAppAlerterUpdate | |
| Microsoft Teams | TeamsAlerterUpdate |
| Slack | SlackAlerterUpdate |
Example Configuration
To send update emails every 30 minutes while the alarm is active:
EmailAlerterUpdate: 30
This configuration results in periodic notifications being sent every 30 minutes until the alarm clears.
Sending Triggered Update Notifications Using force_update
In alarm mode, notifications are typically sent:
- When the alarm becomes active
- When the alarm clears
- When severity changes
In some cases, you may want to send an update notification immediately when a specific condition is met, even if the alarm state does not change. This can be done using the force_update flag in META_DATA.
Example Scenario
Send an update notification when transaction volume exceeds a defined threshold while the alarm is already active.
if C1:
    # Alert is already active based on rule configuration
    vol = get_vumetric_value(D, 1, "success_rate")

    if vol != None and vol > 100000:
        META_DATA["force_update"] = True
This forces an update notification to be sent immediately when the condition is met.
Disabling Contextual Metrics in Alert Console
By default, Contextual Metrics display the top values that breach a threshold across all groups defined using the Group By (bucketing) field. While this provides additional insight, it may introduce unnecessary details when multiple buckets (such as Applications or Hosts) are configured. In scenarios where users want to focus only on the primary alert condition and avoid data from other buckets, contextual metrics can be disabled.
Disabling Contextual Metrics
Contextual metrics can be disabled globally using an Advanced Configuration flag. When disabled, contextual metrics are excluded from both the Alert Console and alert notification channels. To disable contextual metrics, set the following flag in the alert configuration:
SHOW_CONTEXTUAL_METRICS = false
Once configured, alert details and notifications will no longer include contextual metrics.
Escalation Matrix
In alarm mode, notifications are sent when the alarm becomes active and when it clears. Notifications are also updated when the alert severity changes. However, in some cases, you may want to escalate notifications if the alarm condition remains active for an extended duration.
The following example demonstrates how to implement a multi-level escalation strategy using the evaluation script:
- Send an escalation email to Group 1 if the alarm remains active for more than 2 hours
- Send a further escalation email to Group 2 if the alarm persists for more than 6 hours
This enables tiered escalation for critical alerts.
Example Evaluation Script
if C1:
    # Mark the alarm as active
    RESULT = True

    # Duration (in seconds) for which the alarm has been active
    duration = META_DATA.get("duration", 0)

    # Time since last email update (in seconds)
    last_update = META_DATA.get("EmailAlerter_last_update", 0)
    time_since_last_update = duration - last_update

    # Escalation after 2 hours
    if duration >= (2 * 60 * 60) and duration <= (6 * 60 * 60) and time_since_last_update > (1 * 60 * 60):
        ALERT_CHANNELS.append("alertByEmail")
        EMAIL_GROUP_LIST = ["group1"]
        META_DATA["force_update"] = True

    # Escalation after 6 hours
    elif duration > (6 * 60 * 60) and time_since_last_update > (3 * 60 * 60):
        ALERT_CHANNELS.append("alertByEmail")
        EMAIL_GROUP_LIST = ["group2"]
        META_DATA["force_update"] = True
How This Works
META_DATA["duration"]is used to determine how long the alarm has been activeEmailAlerter_last_updateprevents frequent duplicate escalation emailsforce_updateensures an escalation notification is sent immediately- Different escalation groups are notified based on how long the alarm persists
Avoiding Alarm Clear Notifications on Certain Channels
In alarm mode, NG Alert Engine sends notifications when an alarm becomes active and again when it is cleared. However, there may be situations where operators do not want to receive clear notifications on specific channels such as Email, SMS, or WhatsApp.
This behavior can be controlled using Advanced Configuration settings, allowing you to disable clear notifications on selected channels while keeping them enabled on others. This provides finer control over how alert lifecycle notifications are delivered.
| Channel | Configuration Key |
|---|---|
| EmailAlerterClear | |
| SMS | SmsAlerterClear |
| WhatsAppAlerterClear |
Example Configuration
If clear notification emails are not required, set the following in Advanced Configuration:
EmailAlerterClear: false
Rules with Different Grouping Levels
Consider an e-commerce application where application nodes are running on four different systems. Assume an alert needs to be generated when either:
- The overall transaction success rate of the application falls below 85%, or
- The success rate of transactions on any individual application node falls below 85%
To meet this requirement, the alert configuration uses two conditions, each backed by a separate Data Model.
Conditions Used
- Condition C1 → Total transaction success rate with a threshold of > 85%
(No grouping applied) - Condition C2 → Transaction success rate with a threshold of > 85%
(Grouped by application node name)
Default Grouping Behavior
In NG Alert Engine, when multiple conditions use different grouping levels, the system automatically selects the largest grouping level among the conditions as the level at which notifications are generated.
In this example:
- Since Condition C2 is grouped by application node,
- Notifications are generated per application node
This means separate alert notifications will be raised for each node that violates the threshold.
Generating Alerts at an Aggregate Level
If the requirement is to generate alerts at an overall (aggregate) level, instead of per node, this can be controlled using the notification_level setting in Advanced Configuration.
By configuring the notification level to 0, alerts are generated without any grouping, regardless of the grouping defined in individual conditions.
notification_level: 0
This allows:
- Evaluation to still happen at detailed levels
- Notifications to be generated at a consolidated, top-level view
Stale Alarm Clear Controls
There are situations where an alarm may become stale. This typically happens when the system stops receiving data for a specific bucket after an alarm has already been generated, but the alarm condition has not cleared.
Such scenarios can occur due to:
- Issues with the monitored target
- Data ingestion problems
- Data store or query issues that prevent fresh data from being available
When this happens, the alarm remains active but stops receiving updates and therefore does not clear automatically. This state is referred to as a stale alarm.
Default Stale Alarm Cleanup Behavior
Alerts include a default cleanup mechanism for stale alarms.
- If no data is received for a bucket for 24 hours
- The stale alarm is automatically cleared by the system
This ensures that outdated alarms do not remain active indefinitely.
Configuring Stale Alarm Clear Duration
If required, the stale alarm cleanup duration can be customized per alert rule using Advanced Configuration.
- The configuration value is specified in minutes
- Once the configured duration elapses without receiving data for the bucket, the stale alarm is cleared automatically
Stale_alarm_duration: 20
This allows teams to:
- Reduce the cleanup time for high-frequency metrics
- Increase the duration for metrics that report infrequently
FAQs
When should I use Custom Expressions instead of Evaluation Scripts?
Use Custom Expressions whenever the required alert logic can be expressed using evaluation conditions and logical operators. They are simpler to configure, easier to maintain, and recommended for most alerting scenarios.
When should I use an Evaluation Script instead of predefined alert logic?
Use an Evaluation Script only when the required alerting logic cannot be implemented using standard evaluation conditions, thresholds, or custom expressions.
Can I combine multiple evaluation conditions in a single alert rule?
Yes. You can configure multiple evaluation conditions and combine them using predefined evaluation options, custom expressions, or Starlark evaluation scripts to support complex alerting scenarios.
