Creating an Alert Rule
Creating an alert rule in vuSmartMaps involves completing seven guided steps, each allowing you to define how the alert is detected, enriched, and delivered.
Step 1. Basic details
The Alert Configuration defines the key parameters used by the system to evaluate conditions and trigger notifications. It outlines what will be checked, what information will be included in the alert, and how the notifications will be sent to users.
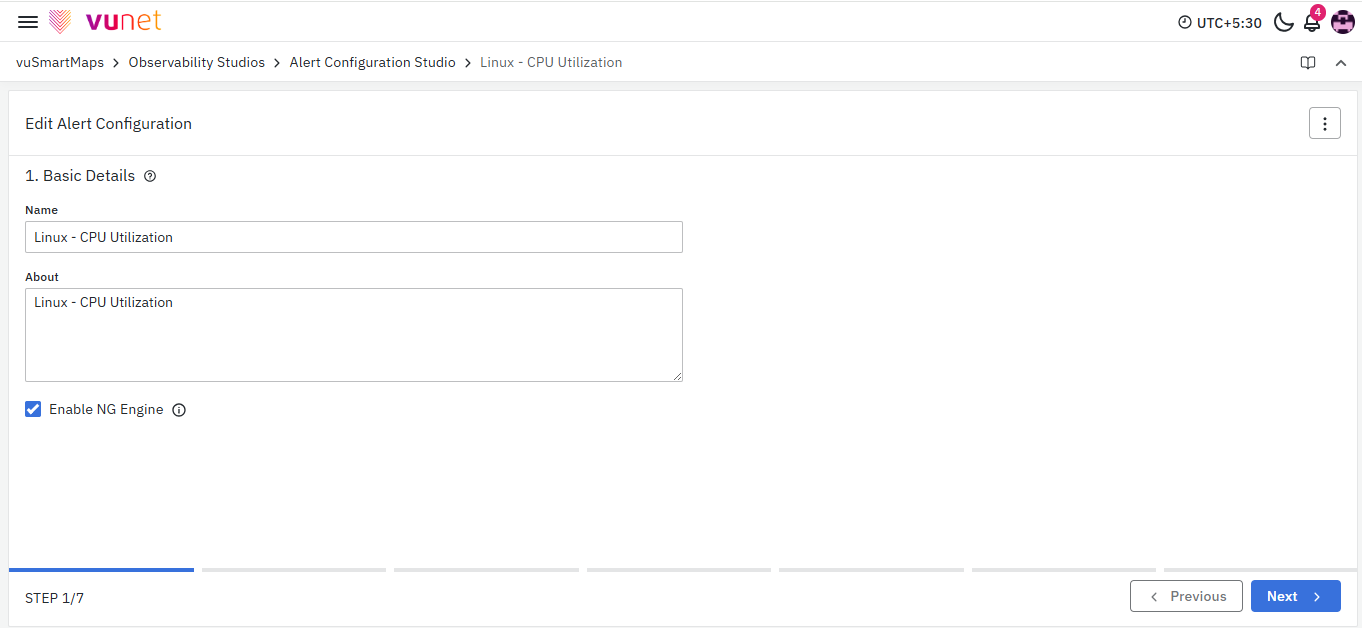
- Name: A unique title used to identify the Alert Configuration. This name appears in the alert list and helps you quickly recognize the rule. It is used for reference only and does not appear in the generated alert message.
- Example: High Memory Usage
- About: A short description explaining the purpose of the Alert Configuration. This helps provide context in the alert list but is not included in the alert notifications.
- Example: Monitors memory utilization across application servers and triggers a notification when it exceeds the defined threshold.
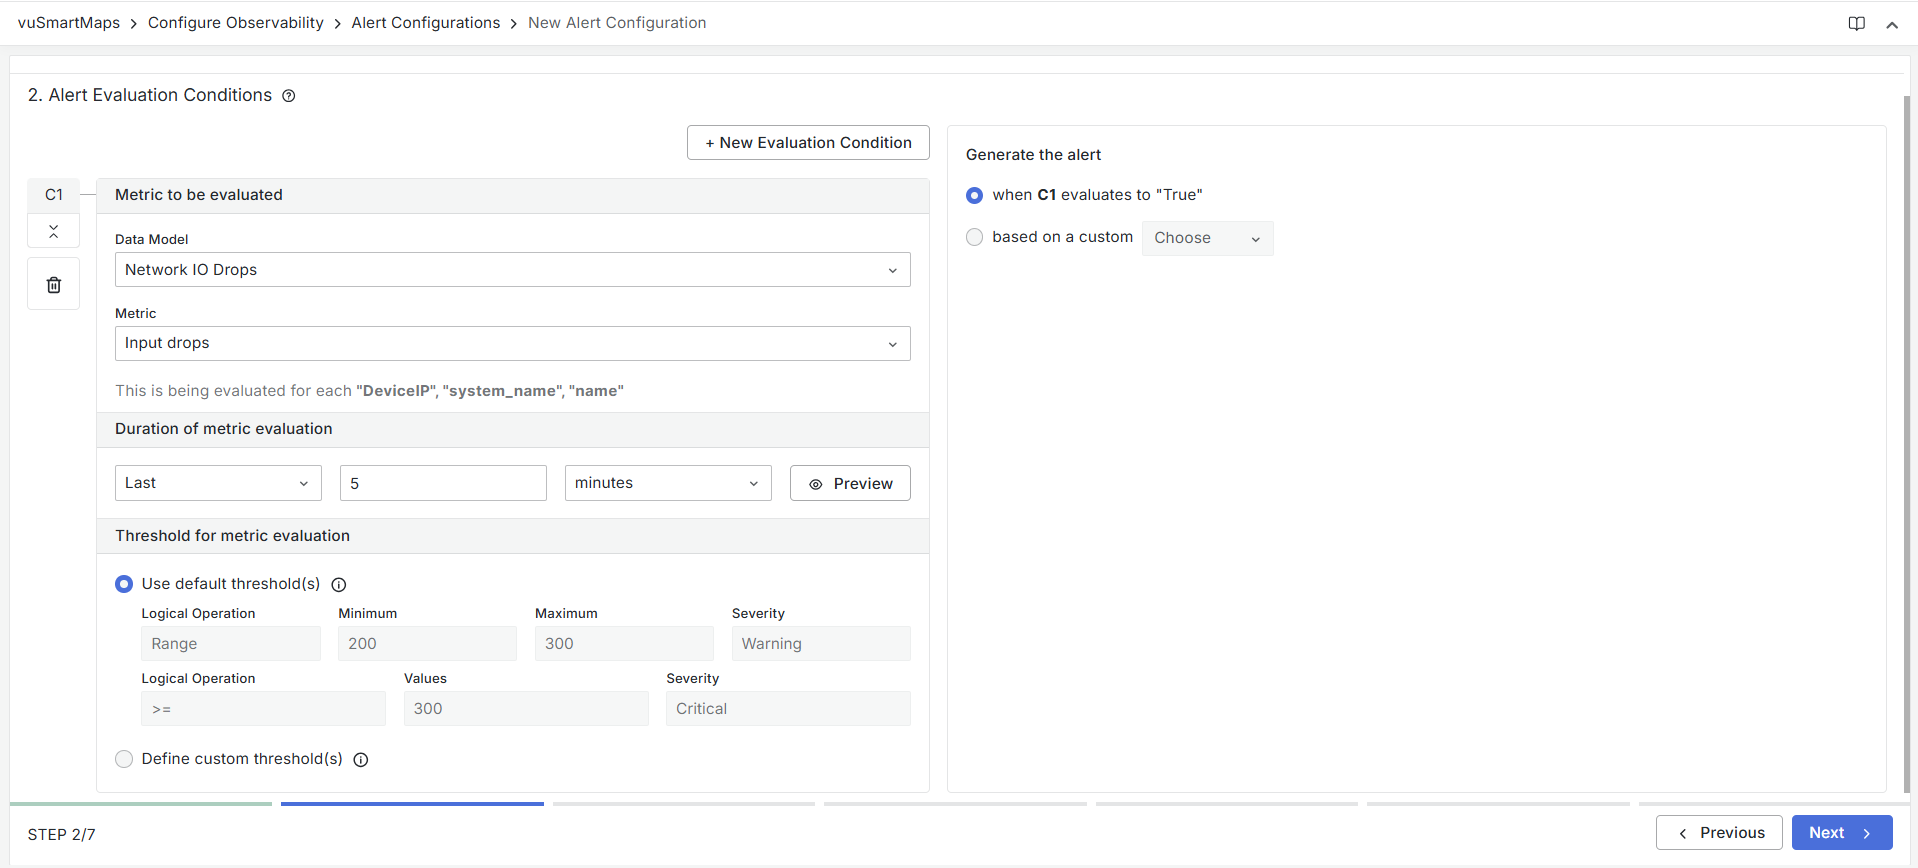
Step 2. Alert Evaluation Conditions
This step defines the rules that determine when an alert should trigger. The system evaluates selected metrics over a defined duration and checks whether the values cross the set thresholds. If the condition evaluates to True, the alert will be generated. Alerts in vuSmartMaps can be configured using one or more evaluation conditions. Each evaluation condition defines what metric to evaluate and how it should be evaluated. Once evaluation conditions are defined, you can control how alerts are generated based on the results of these conditions.
Evaluation Conditions (Common for Single & Multiple)
Metric to be Evaluated
-
Data Model: Select the Data Model that contains the metric you want to monitor. Once a Data Model is chosen, the associated metrics will automatically appear in the dropdown below.
- Example: Selecting Network I/O Drops displays metrics such as Input Errors or Output Errors.

- Metric: Choose the specific metric from the selected Data Model to evaluate.
- Example: Input Drops under Network I/O Drops.
- Evaluated For Each displays the grouping fields automatically derived from the selected Data Model, such as Device IP, System Name, or Name.
- The alert condition is evaluated independently for each unique value or combination of these grouping fields. If the configured thresholds are breached for specific devices or entities, alerts are generated only for those affected entries
- Example: if thresholds are breached for 3 out of 10 devices, alerts are triggered for those 3 devices.
Duration of Metric Evaluation
This setting defines the time window over which metric data is evaluated to determine whether alert conditions are met. Choosing the appropriate duration is critical, as it directly impacts how sensitive or stable the alert behavior is.
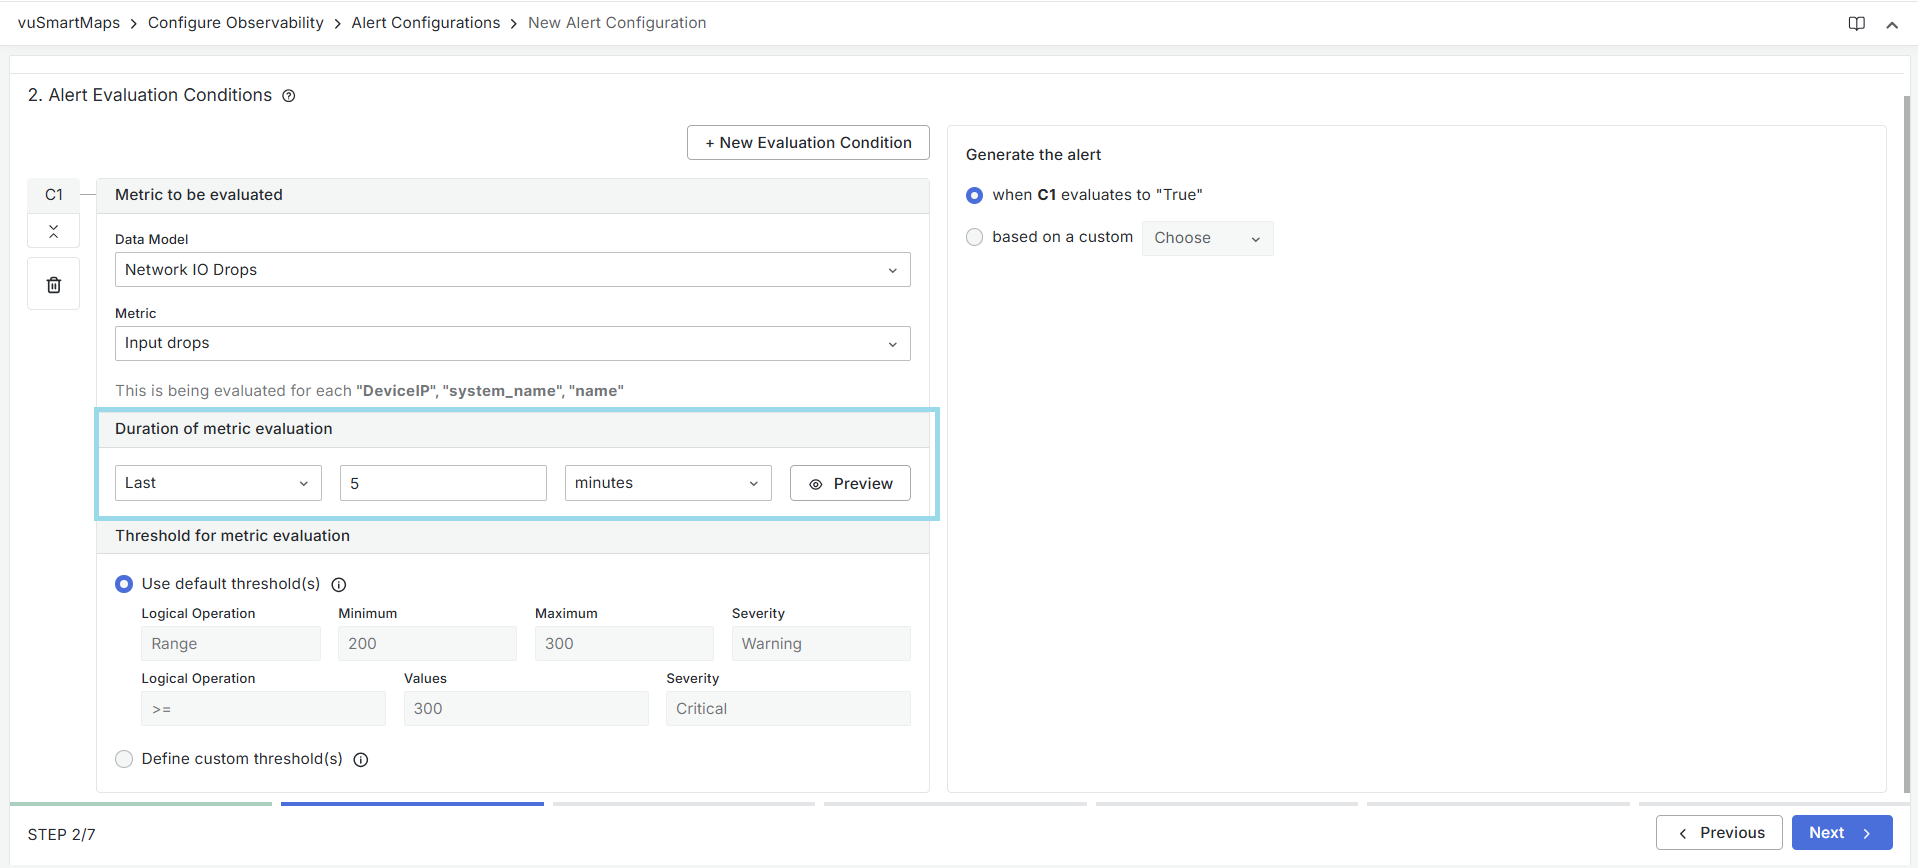
- By default, the evaluation is set to Last 5 minutes, which analyzes metric values over the most recent time window. You can modify this duration using the dropdown to evaluate data over longer windows such as Last 10 minutes or Last 1 hour, helping smooth out short-lived spikes and reduce noise.
- In addition to Last, the Current option is also available.
- Last evaluates metric data over a rolling time window.
- Current evaluates the most recent data point, making it suitable for real-time or instantaneous checks.
- Use the Preview option to quickly visualize metric values for the selected duration and validate that the chosen evaluation window aligns with the expected alert behavior.
Threshold for metric evaluation
The metric threshold configuration defines the conditions under which a metric value is considered to have breached acceptable limits and can contribute to alert generation. Thresholds determine when an evaluation condition evaluates to true and what severity should be associated with the breach.
vuSmartMaps supports the following ways to configure metric thresholds:
- Use Default Threshold(s): Thresholds defined in the selected Data Model
- Define Custom Threshold(s): User-defined thresholds configured at the alert level
- Evaluation Script: Threshold logic defined programmatically using a custom evaluation script
Severity precedence order:
- Severity set in the Evaluation Script (highest priority)
- Alert-level severity override (configured in Step 3, if applicable)
- Severity derived from Default or Custom Thresholds
Use Default Threshold(s)
When this option is selected, the alert uses the threshold configuration defined in the selected Data Model.
- The thresholds configured in the Data Model are applied automatically for alert evaluation.
- The threshold conditions selected within the Data Model are displayed for user reference.
- Each threshold level can have an associated Severity such as Warning, Critical, etc.
Thresholds with Severity = Success are ignored for alert generation. All other severities are considered and can trigger alerts when the thresholds are breached.
- Example:
- Range 200–300 → Warning
- Value ≥ 300 → Critical
Define Custom Threshold(s)
- Allows you to configure your own evaluation logic.
- A maximum of 10 thresholds can be added.
- Select a Logical Operation from the dropdown (e.g.,
==,!=,<,<=,>,>=,Range). - Enter the Value(s) to compare against.
- Select the Severity level for that condition.
- When
Rangeis selected, both Minimum and Maximum values can be defined. - Example: Range (Min: 100, Max: 300) → Warning
- Example: Value > 300 → Critical
- When
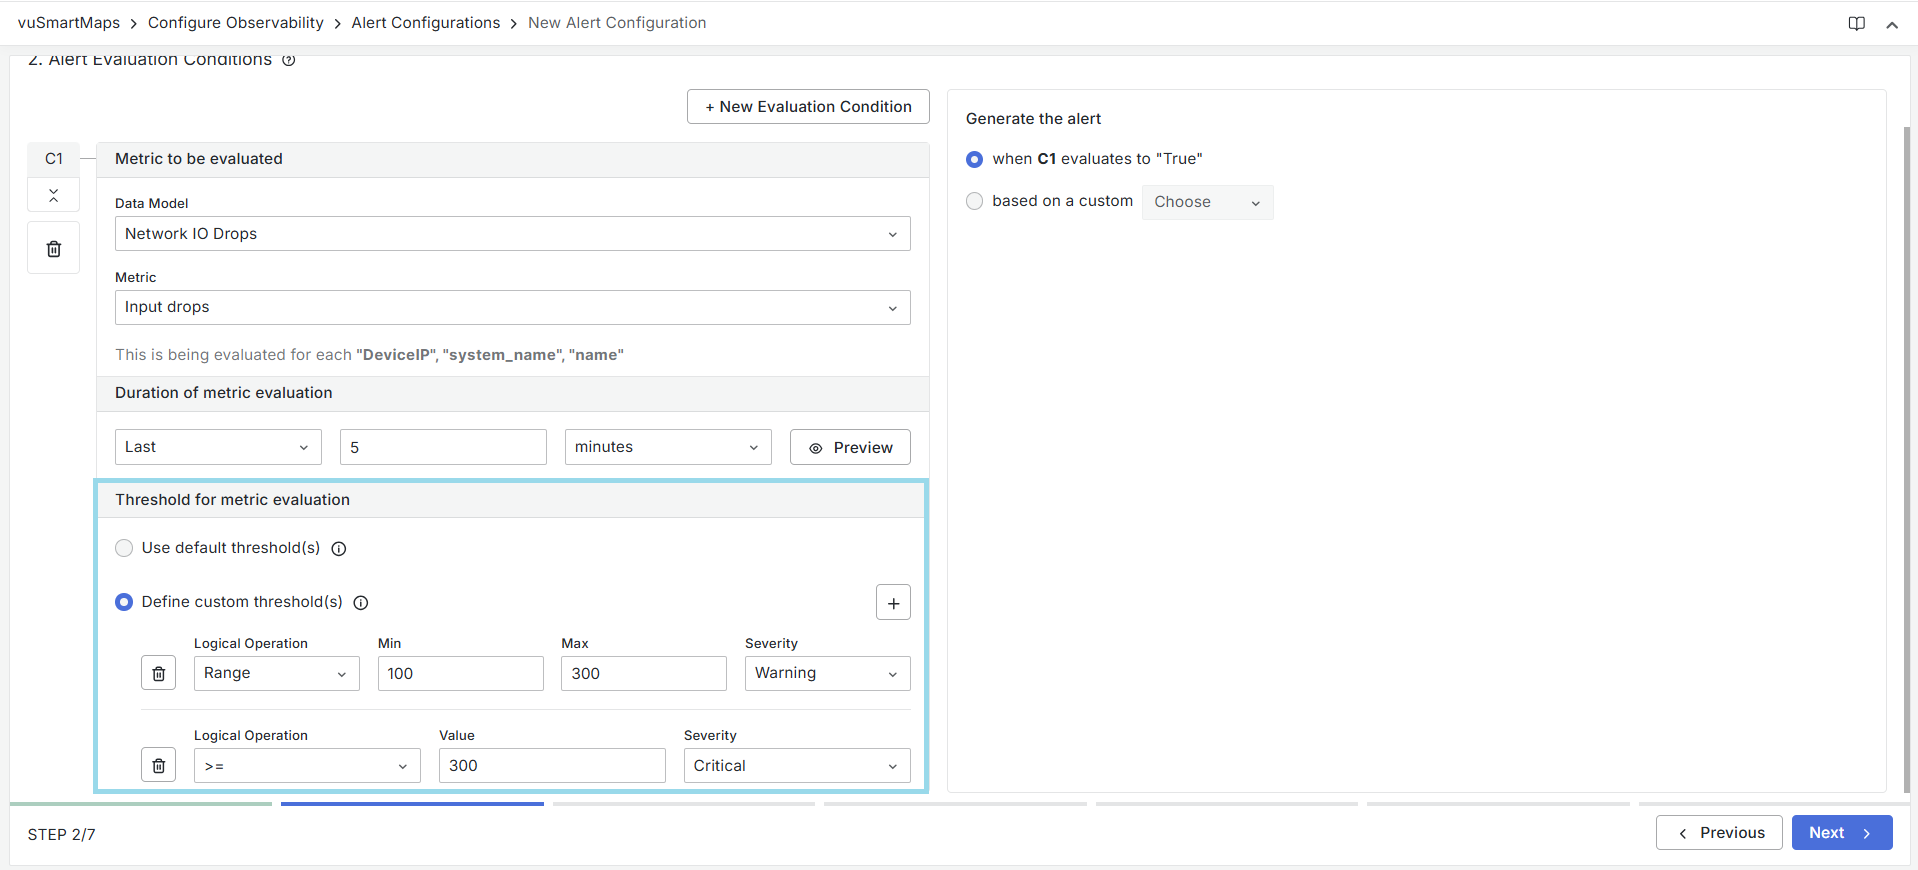
Use the ( + ) button to add additional threshold rows if needed.
Adding an Evaluation Condition
To define multiple conditions:
- Click + New Evaluation Condition at the top of the section.
- Each new condition will appear as a block (C1, C2, C3, etc.).
- Each block can independently have its own Data Model, Metric, Duration, and Threshold.
Generate the Alert
This section controls how the alert is triggered based on your conditions. Options vary depending on whether there is one or multiple evaluation conditions configured.
Pre-defined Alert Generation Types
- Single Evaluation Condition
- The alert is triggered when the condition evaluates to True.
- Multiple Evaluation Conditions
- When ALL conditions evaluate to True
- When ANY condition evaluates to True
Based on a Custom Expression
This option allows you to define logical expressions that control when an alert is triggered using the results of one or more evaluation conditions. Expressions are constructed using evaluation condition results (C1, C2, …), operators, constants, and parentheses, and must evaluate to a Boolean value (true or false).
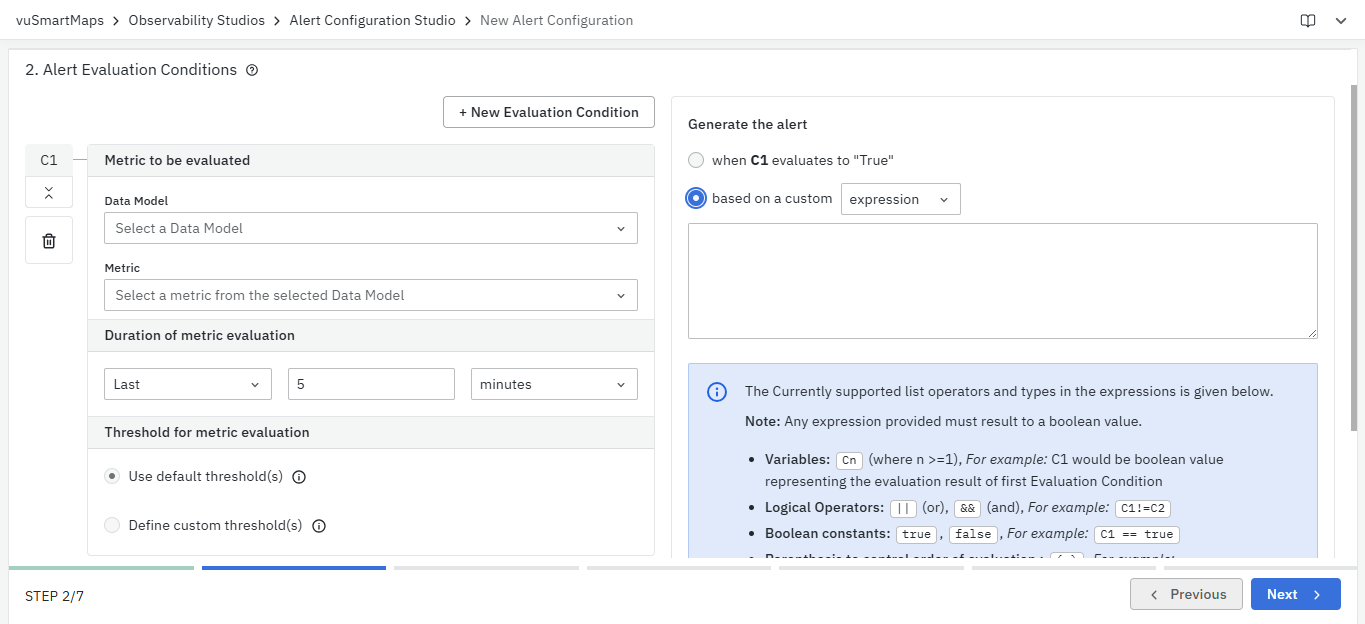
Any expression defined in this section must evaluate to a boolean value (true or false). These expressions determine whether an alert condition is satisfied and whether an alert should be generated.
Expression Syntax and Supported Elements
Alert evaluation expressions allow you to construct advanced alert logic using evaluation condition results, operators, and constants. All expressions must ultimately evaluate to a Boolean value (true or false) to determine whether an alert is triggered.
Evaluation Condition Variables
C1represents the Boolean result of the first evaluation condition.C2,C3, and subsequent variables represent additional evaluation conditions.- These variables are used to combine multiple evaluation results into a single logical expression.
Example:
C1 && C2
The expression evaluates to true only if both conditions are satisfied.
Comparators
Numeric and String Comparators
Supported operators:
> < >= <= == !=
-
If both operands are numeric, numeric comparison is applied.
-
If both operands are strings, lexicographic comparison is applied.
Examples:
cpu_usage > 80

status == 'DOWN'
Regex Comparators
Supported operators:
=~ !~
- These operators use Go’s standard regular expression syntax.
=~checks if the left-hand string matches the regex pattern.!~checks if the left-hand string does not match the pattern.
Examples:
interface_name =~ '^eth[0-9]+'

error_message !~ 'timeout'
Logical Operators
Supported logical operators:
&& ||
&&represents logical AND||represents logical OR- Logical operators use short-circuit evaluation
Examples:
C1 && C2

C1 || C3

(C1 && C2) || C3
Arithmetic Operators
Supported arithmetic operators:
+ - * / % **
**represents exponentiation- Both operands must be numeric
- The result is numeric
Examples:
latency_avg > (baseline * 1.5)

3 ** 4 == 81
Addition and Concatenation (+)
- If either operand is a string, the
+operator performs string concatenation - If both operands are numeric, it performs numeric addition
- Any other combination is invalid
Examples:
'CPU usage is ' + 'high'

error_count + warning_count > 100
Bitwise Operators
Supported operators:
>> << | & ^
- Operate on numeric values
- Internally, values are converted to
int64for the operation
Examples:
flags & 4 > 0

value << 2 > 100
Prefix Operators
Supported prefix operators:
!→ Logical NOT-→ Numeric negation~→ Bitwise NOT
Examples:
!C1

-(error_rate) > -10

~mask > 0
Constants
Numeric Constants
- Represented as 64-bit floating-point values
- Support both integer and decimal values
Example:
response_time >= 250.5
String Constants
- Must be enclosed in single quotes
Example:
region == 'us-east'
Boolean Constants
- Supported values:
true,false
Example:
C1 == true
Parentheses
Parentheses () are used to group expressions and control evaluation order.
Example:
(C1 && C2) || (C3 && !C4)
Ternary Conditional Operators
True Ternary (?)
- Checks if the left-hand condition is true
- If true, returns the right-hand value
- If false, returns
nil
False Ternary (:)
- Checks if the left-hand value is
nil - If so, returns the right-hand value
- Otherwise, returns the left-hand value
Example:
C1 ? severity : 'INFO'
Null Coalescence Operator (??)
- Returns the left-hand value if it is non-null
- Otherwise returns the right-hand value
Example:
custom_severity ?? 'WARNING'
Example: Combined Expression
(C1 && cpu_usage > 80) || (C2 && error_rate >= 5)
This expression evaluates to true when:
- Condition 1 is met and CPU usage is high, or
- Condition 2 is met and the error rate exceeds the defined threshold
- vuSmartMaps strongly recommends using Evaluation Conditions and Custom Expressions to define alert logic wherever possible. These approaches are simpler to configure, easier to understand, and more maintainable over time.
- Custom Scripts should be used only when the required logic cannot be expressed using conditions or expressions.
Evaluation Script (Starlark)
Switch to Custom Script mode to define advanced alert-evaluation logic using the Starlark scripting language.
The evaluation script must be written in Starlark.
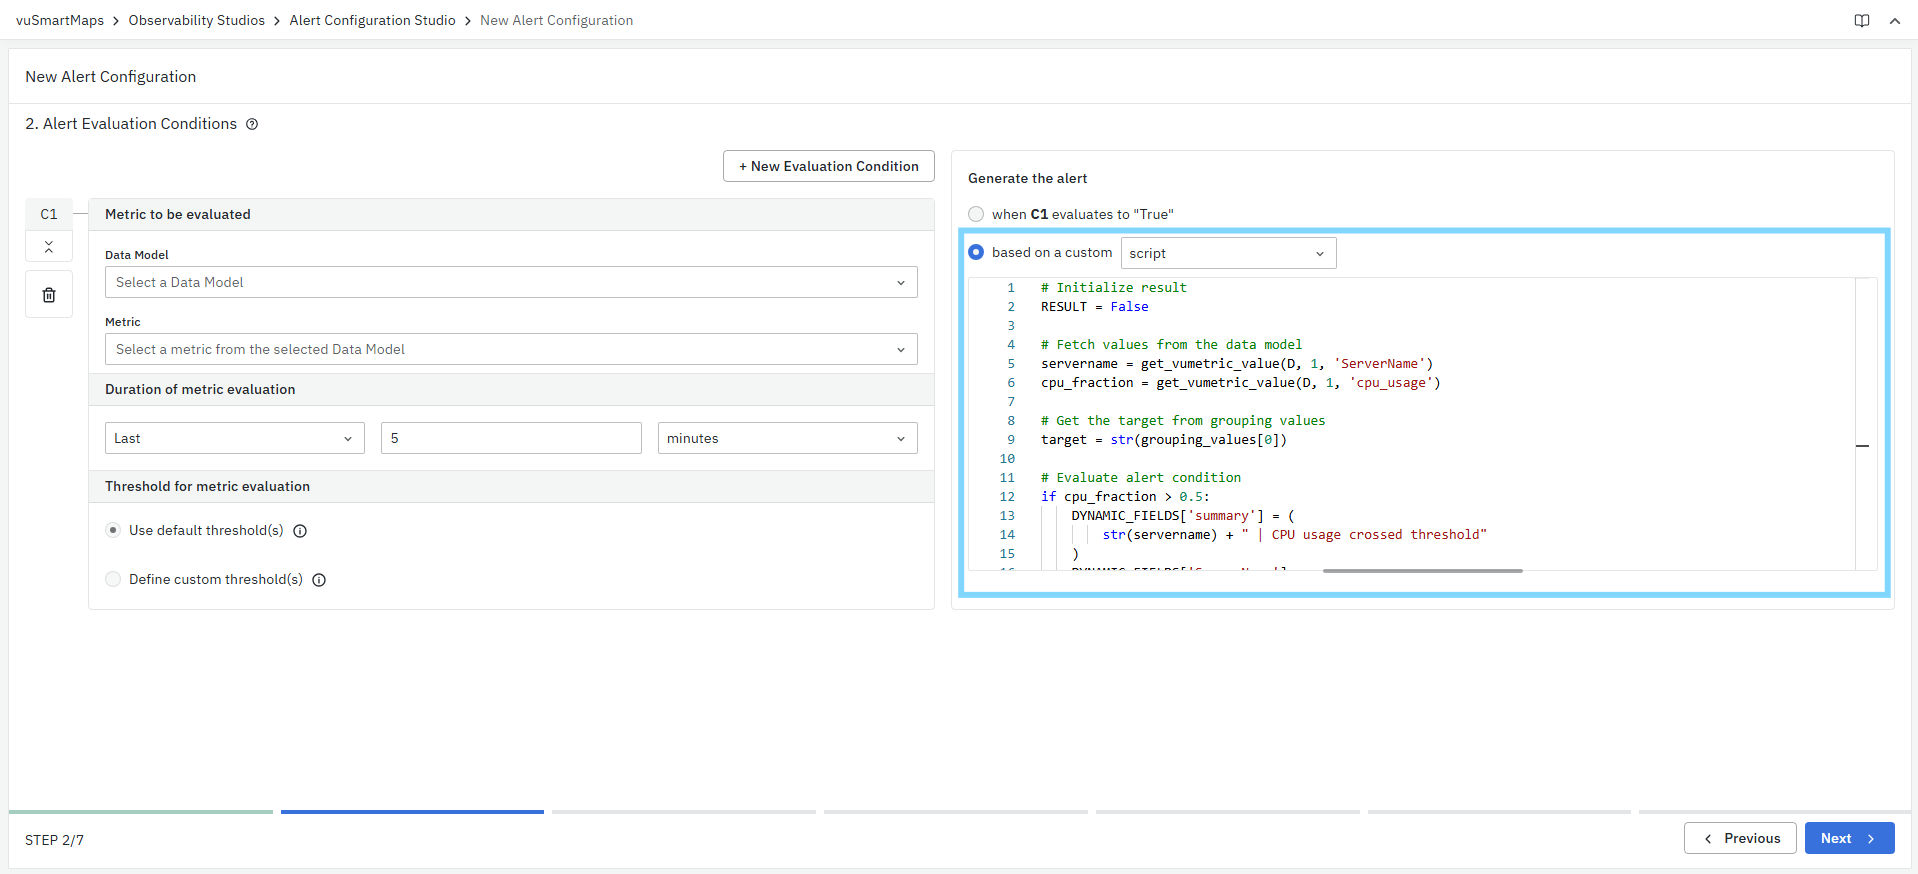
- Example Script: The following sample script demonstrates how to evaluate alert conditions and dynamically enrich alert content using Starlark. This script is provided as a reference placeholder in the module.
# Initialize result
RESULT = False

# Fetch values from the data model
servername = get_vumetric_value(D, 1, 'ServerName')
cpu_fraction = get_vumetric_value(D, 1, 'cpu_usage')

# Get the target from grouping values
target = str(grouping_values[0])

# Evaluate alert condition
if cpu_fraction > 0.5:
    DYNAMIC_FIELDS['summary'] = (
        str(servername) + " | CPU usage crossed threshold"
    )
    DYNAMIC_FIELDS['ServerName'] = servername
    DYNAMIC_FIELDS['target'] = target
    DYNAMIC_FIELDS['severity'] = 'warning'
    RESULT = True
elif cpu_fraction > 0.8:
    DYNAMIC_FIELDS['severity'] = 'error'
    RESULT = True
Refer to the Alert Evaluation Script section for more details.
-
To learn more about the Starlark language, click here.
-
For more details on language syntax and specifications, click here.
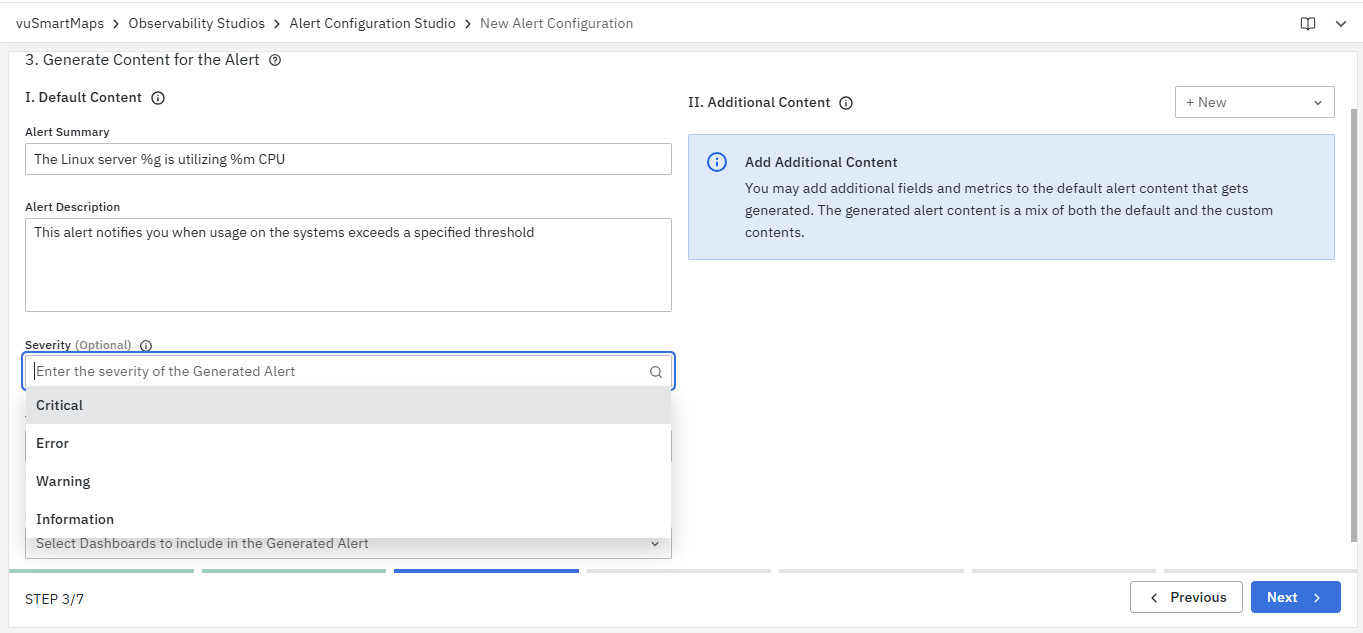
Step 3. Generate Content for the Alert
This step defines what information will be included in the alert notifications generated by the system. The alert content is made up of two parts:
- Default Content – Information that is always included in every alert document.
- Additional Content – Information that can be optionally added when specific conditions are met.
Default Content
Alert Summary
The summary acts as the subject line in the alert channels and the title in the alert notification. It should briefly describe the issue that triggered the alert.

- Example:
- “The Linux Server %g is utilizing %m CPU”
Keep the summary concise and meaningful so users can quickly understand the alert’s purpose.
Alert Description
The description provides more details about the issue and recommended actions. It helps users understand the impact and next steps to resolve the alert.
- Example: “This server is experiencing heavy load for an extended period. Please check the services or processes running on the system. If the issue continues, consider optimizing resource usage or increasing the CPU/memory capacity.”
Use this section to include troubleshooting guidance or escalation steps that help resolve the issue faster.
Dynamic Content Formation
You can make parts of the Summary and Description dynamic by using format specifiers. These placeholders are automatically replaced with real-time values from the alert when it is generated. Supported Format Specifiers:
| Specifier | Description | Example Configuration | Result in Notification |
|---|---|---|---|
| %G | Adds Group-by parameters and their values | “Alert observed for %G” | “Alert observed for process:apache of host:micmac” |
| %g | Adds only Group-by parameter values | “Alert observed for %g” | “Alert observed for apache of micmac” |
| %M | Adds monitoring parameters and their values | “Monitoring parameter %M” | “Monitoring parameter cpu_usage:18.2” |
| %m | Adds only monitoring parameter values | “Monitoring parameter value observed=%m” | “Monitoring parameter value observed=18.2” |
| %S | Adds severity level information | “%S: CPU Usage High” | “Critical: CPU Usage High” |
These specifiers make alert messages more informative and context-aware, automatically including relevant metric or host information without manual input.
- Example: configuring Summary as "Server CPU usage is now %m for %G" will result in alert notification to contain summary as "Server CPU usage is now 76% for host:1.1.1.1"
Severity (optional)
This field allows you to optionally define an alert-level severity override. When specified, the selected severity is applied to all alert occurrences, regardless of the metric threshold severities configured in Step 2.
If this field is left unset, the alert severity is determined based on the default or custom threshold severities defined during metric evaluation.
Severity Override Behavior & Precedence
Severity is applied in the following order of precedence:
- Evaluation Script Severity – If an evaluation script is configured, the severity returned by the script takes highest precedence.
- Alert-level Severity Override (this step) – If a severity is selected here, it overrides the default or custom threshold severities defined in Step 2.
- Metric Threshold Severity – If neither of the above is configured, severity is derived from the default or custom metric thresholds.
Available Severity Levels
- Critical – Requires immediate attention.
- Error – Indicates a fault that may affect functionality.
- Warning – Highlights potential issues that should be monitored.
- Information – Provides general status or informational updates.
This field is optional. Configure it only when a fixed severity is required for all alert instances.
Tags (Optional)
Tags allow you to add contextual metadata to alerts, making them easier to categorize, identify, and manage. You can specify multiple tags as comma-separated values.
Tags are included in alert notifications and help with searching, grouping, and organizing alerts in the Alert Console.
Tags can also be used to represent meaningful classifications such as:
- Type of observability source (for example, metrics, logs, traces)
- Name of the observability source or monitored entity
- Technology, environment, or functional category (for example,
linux,cpu,prod)
Tags are designed to support not only alert categorization but also future capabilities for filtering and segregating entities such as alerts, dashboards, and related resources based on common tags.
Example: linux, cpu, metrics
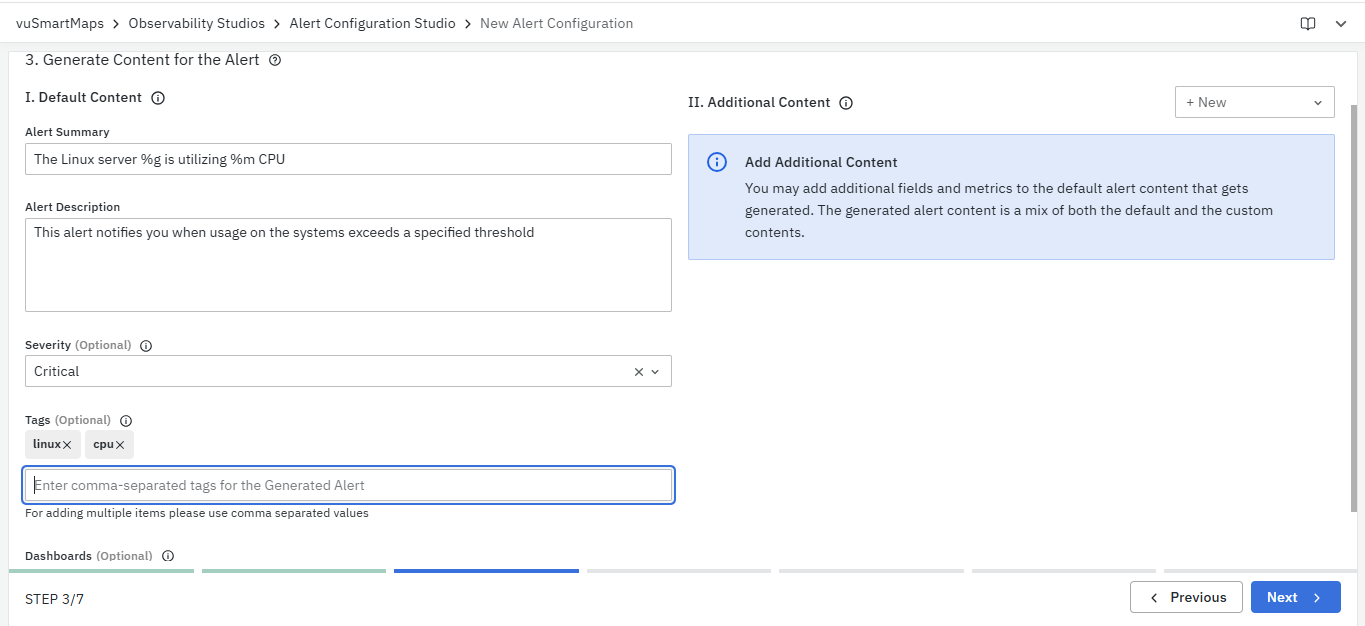
Dashboards (Optional)
- You can associate one or more dashboards with an alert to provide quick access to relevant visualizations for deeper analysis. When an alert is triggered, users can directly navigate from the alert to the linked dashboards, helping them understand the context and impact of the issue.
- Select the required dashboards from the dropdown list to associate them with the alert. Linked dashboards can be accessed from the Alert Console under the Related Dashboards tab within the alert details view.
To learn how to create a dashboard, refer to the Dashboard Creation Section.
Additional Content
The Additional Content section allows you to extend the default alert details by adding information metrics or additional information. These additions help provide more visibility into the condition that triggered the alert, such as related metrics or supplementary data points.
- You can configure additional content by clicking the + New button at the top of this section.

- Upon clicking, two options appear:
- Add Metrics
- Add/Remove Fields
- Each of these options allows you to define custom content that will appear in the final alert.
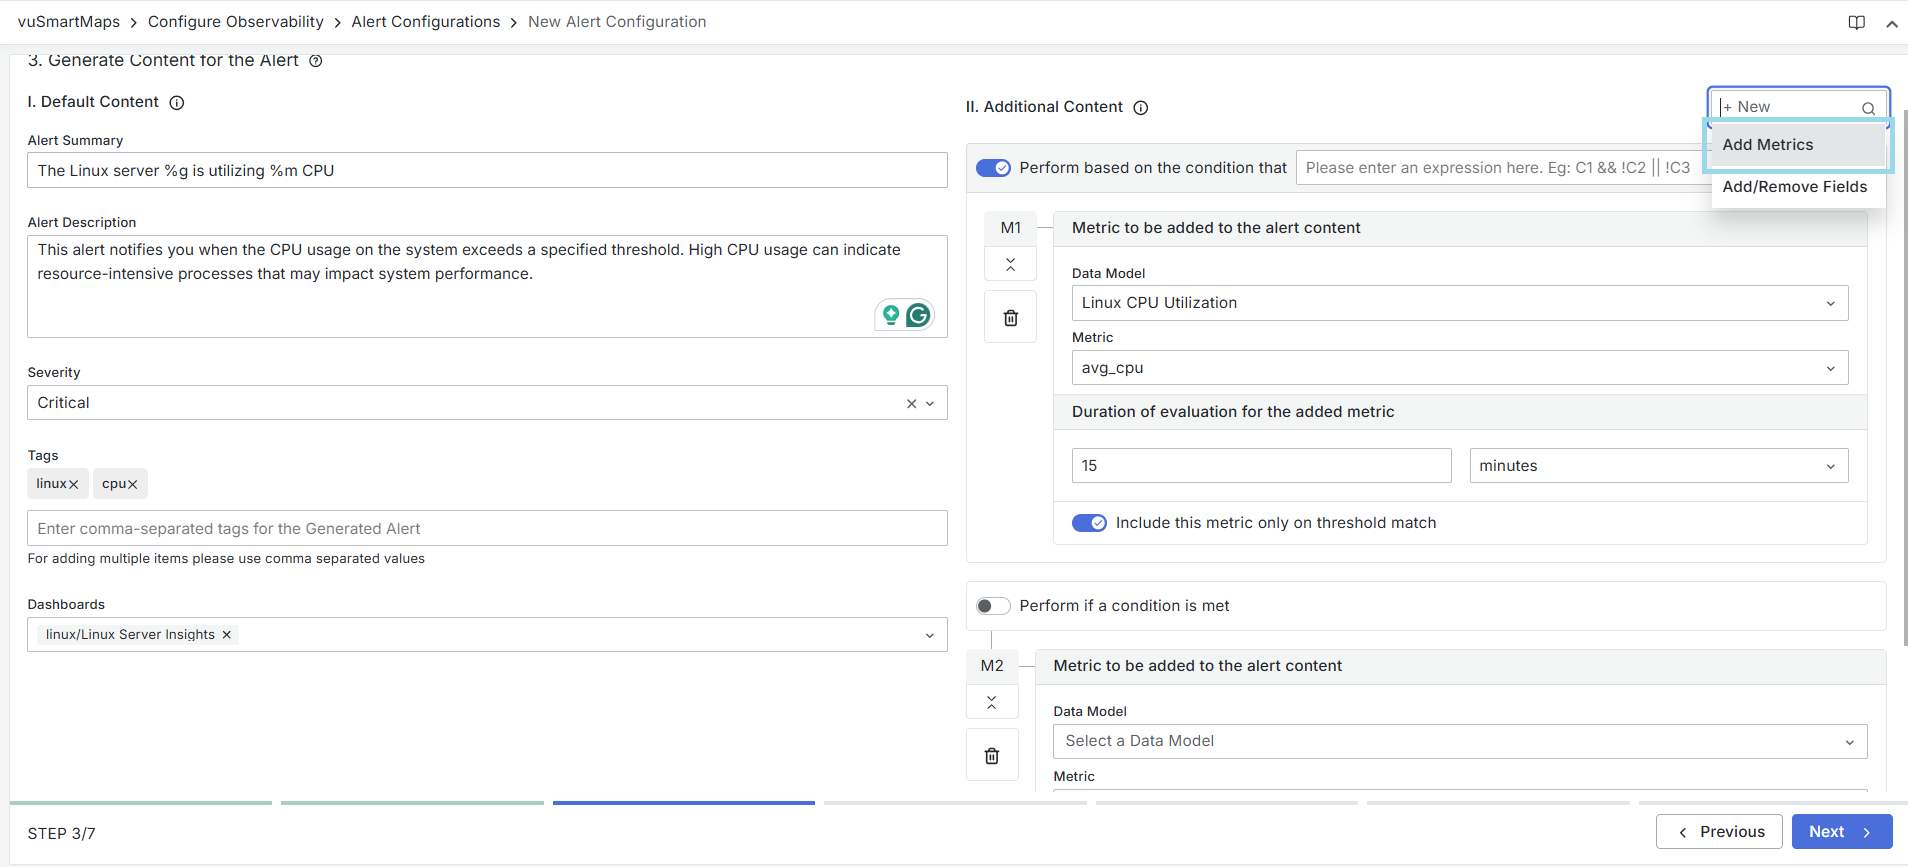
Add Metrics
Add Metrics option lets you include one or more metrics from existing data models in the generated alert. It helps provide supporting metric details related to the main alert trigger.
Fields and Options:
-
Enable Conditional Execution (toggle)
- The Enable Conditional Execution option lets you control when a configuration is applied based on alert evaluation results. When enabled, the system checks a logical expression and applies the configuration only if the expression evaluates to
true. - This helps you apply actions or settings only for specific alert scenarios, instead of always executing them.
- Supported Expression Elements:
- Variables:
C1,C2,C3, … (evaluation condition results) - Logical Operators:
&&(AND)||(OR)
- Boolean Constants:
true,false - Parentheses:
( )to control evaluation order - Prefix Operator:
!(NOT) - Ternary Operator:
? :for conditional logic
- Variables:
- The Enable Conditional Execution option lets you control when a configuration is applied based on alert evaluation results. When enabled, the system checks a logical expression and applies the configuration only if the expression evaluates to
-
Metric to be added to the alert content
- Data Model: Select the Data Model that contains the metric you want to add.
- Metric: Choose a specific metric from the selected Data Model.
- Example: Selecting CPU Utilization displays metrics such as avg_cpu.
-
Duration of evaluation for the added metric
- Specify the duration over which the above metric should be evaluated.
- Default value: 5 minutes
- You can change the duration using the dropdown menu (e.g., 1 hour).

-
Include this metric only on threshold match (toggle)
- This option controls when the selected information metric is included in the alert content.
- When the toggle is enabled, the information metric is included only if the threshold configured for the selected Data Model and Metric is breached.
- When the toggle is disabled, the information metric is included for every alert occurrence, regardless of whether the threshold is breached.
- This option controls when the selected information metric is included in the alert content.
-
Use this option to include additional metrics only when they are relevant to the alert condition and avoid unnecessary information in alert notifications.
-
Adding Multiple Metrics
- Click + New > Add Metrics again to add more metrics if needed. Each new metric block (M1, M2, etc.) can have its own configuration.
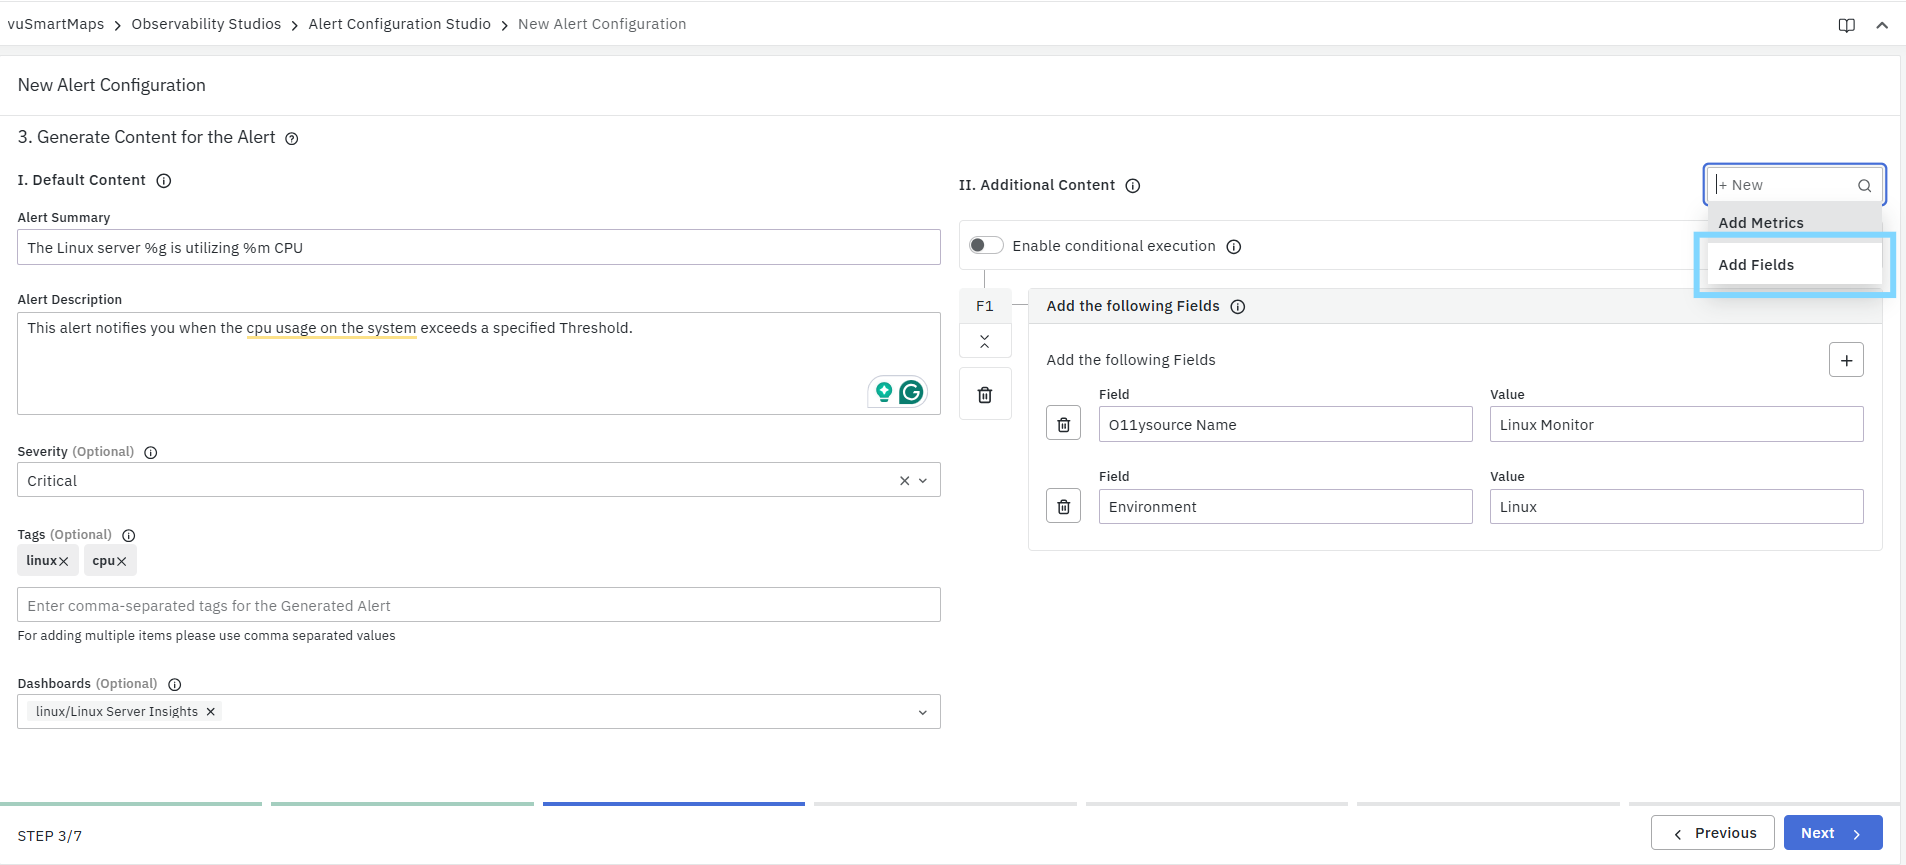
Add Fields
The Add Fields option allows you to include additional static key–value pairs in the final alert data. These fields help enrich alerts with business or operational information that may not be part of the default alert content.
Key–Value Fields and Alert Console Mapping
Fields added in this section can also be mapped to columns in the Alert Console, provided valid keys are used.
- With the new alert configuration, static fields added here can also be mapped directly to Alert Console fields, without requiring an evaluation script.
- This simplifies alert enrichment while still ensuring visibility in the Alert Console.
To ensure a field appears as a column in the Alert Console, users must use a supported key name. Only predefined keys are eligible for console mapping.
Refer to the supported key list defined in the DynamicFields mapping
Field Configuration
- Field (Key):
- Enter the name of the field you want to add.
- This represents the column name that may appear in the Alert Console if the key is supported.
- Value:
- Enter the value to associate with the field.
- Only static values can be added in this section.
Example:
Field: environment
Value: Production
-
Supported & Unsupported Keys
- If the field (key) belongs to the set of supported alert console fields, it will also be visible directly in the Alert Console.
- If the field is not part of the supported list, it will not appear in the console UI, but it will still be:
- Stored in the alert notification document
- Available for dashboards, API queries, and advanced processing
- Helpful for downstream automation or enrichment
- In addition to adding key–value pairs to the alert table, you can use the Evaluation Script (DynamicFields) to map specific static fields directly to columns in the Alert Console for better visibility and organization.
- For more information on mapping fields using the Evaluation Script (DynamicFields) to Alert Console columns, refer to this section
-
Use the + icon to add multiple key–value pairs.
-
Use the delete icon to remove any field entry.
You can add as many fields as needed to enhance alert clarity and add important business attributes.

-
Perform based on the condition (toggle)
- This option allows you to make the addition of fields conditional, meaning they will only be included in the alert content when specific alert conditions are met.
- When this toggle is turned on, you can define a logical expression that determines when this part of the configuration should be applied.
- Example: An expression such as C1 && !C2 || !C3 tells the system to include the field only if C1 is true and either C2 is false or C3 is false.
-
Adding Multiple Field Blocks
- You can add multiple field modification blocks (F1, F2, etc.) if you want to handle different scenarios separately.
Once the Additional Content is configured, click on the Next button at the bottom-right corner to proceed to Step 4 – Alert Notification Channels.
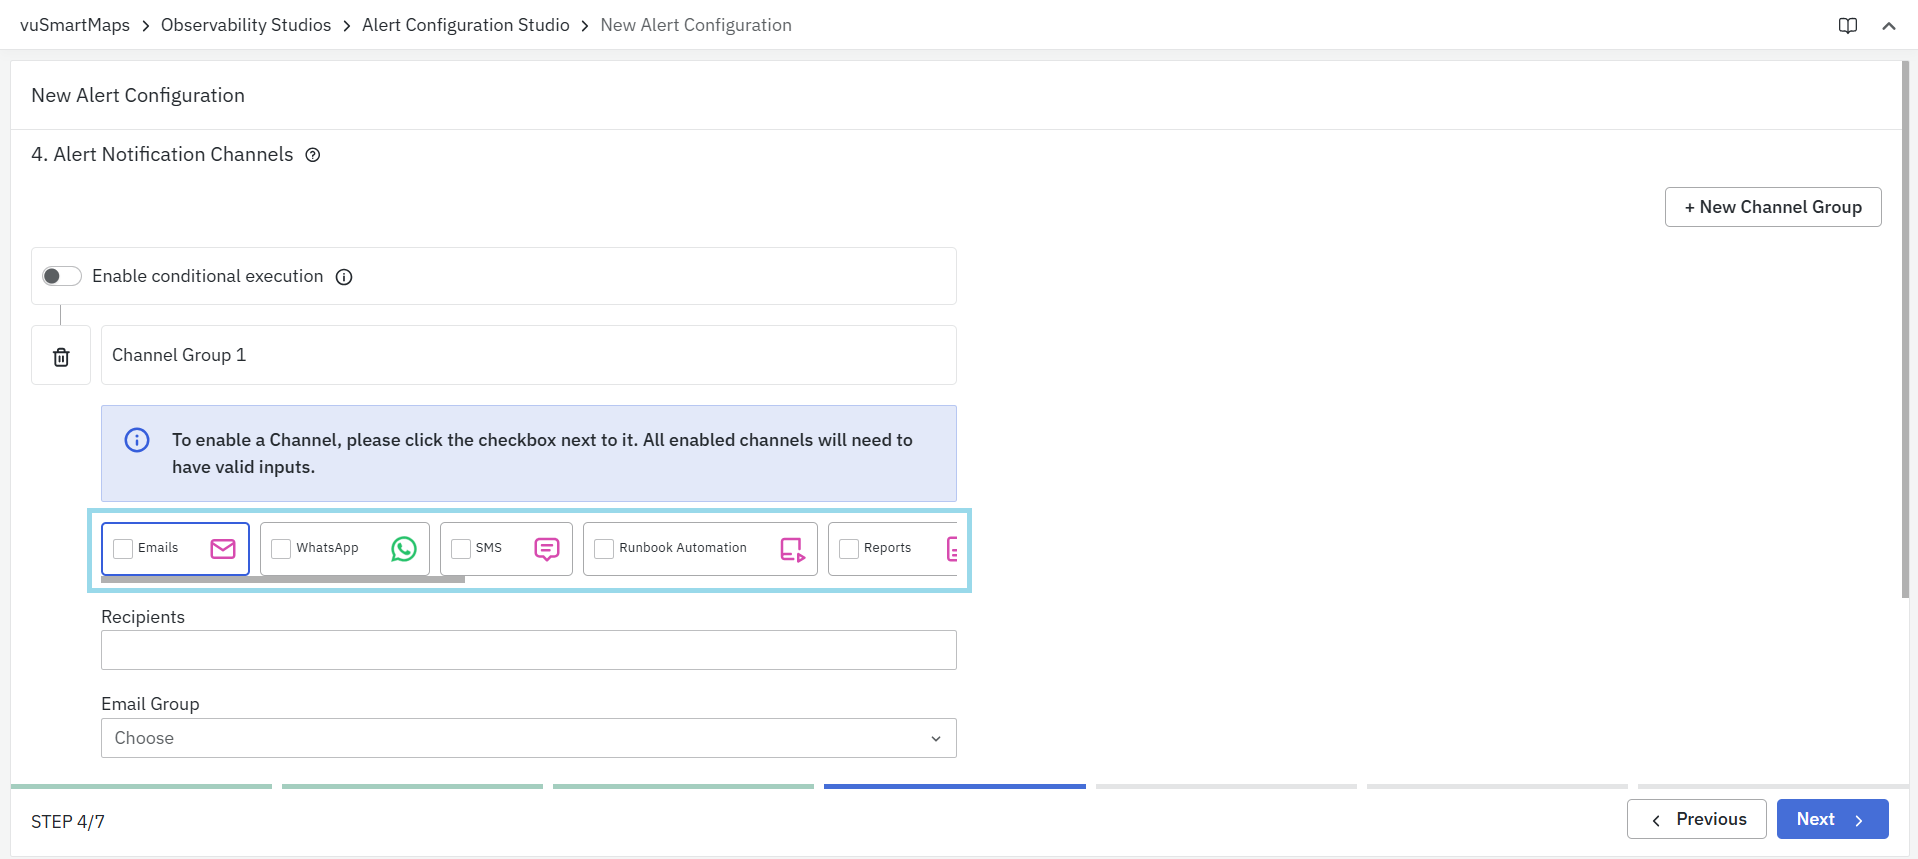
Step 4. Alert Notification Channels
This step defines how alert notifications are delivered when an alert condition is met. While alerts are triggered and tracked within the vuSmartMaps platform, critical or time-sensitive issues often require users to be notified outside the product interface.
To address this, vuSmartMaps supports alert notifications through widely used industry channels, ensuring that the right users or systems are informed promptly through their preferred communication mechanisms. You can configure one or more notification channels based on the alert’s criticality and operational requirements.
Add a Notification Channel Group
- A Notification Channel Group allows you to group one or more notification channels together and control when and how notifications are sent. Channel groups are especially useful when you want to route alerts through different channels based on different alert conditions.
- By using multiple channel groups with conditional execution, you can define flexible notification strategies—for example, sending alerts to one set of channels for critical conditions and a different set for other scenarios.
- Click + New Channel Group to create a channel group. Each group can contain one or more channels through which notifications will be delivered. After creating a group (for example, Channel Group 1), enable and configure the required channels within that group.

Perform Based on the Condition (Toggle)
This toggle controls when a specific channel group is used.
- When enabled, you can define a logical expression using evaluation conditions (C1, C2, etc.) to determine whether notifications from this channel group should be sent.
- This allows different channel groups to be triggered for different alert scenarios.
Example: C1 && C2
- Notifications are sent only when both Condition 1 and Condition 2 are true.
- Another group can be configured with a different condition (for example,
C1 && !C2) to route notifications through a separate set of channels.
Prerequisites for Notification Channels
- Before configuring alert notifications, ensure that the required notification channels are configured and enabled in the Platform Configurations page. Only channels that are set up and active at the platform level will be available for selection during alert configuration.
- For many notification channels, the notification message body and formatting can also be customized from the Platform Configurations page.
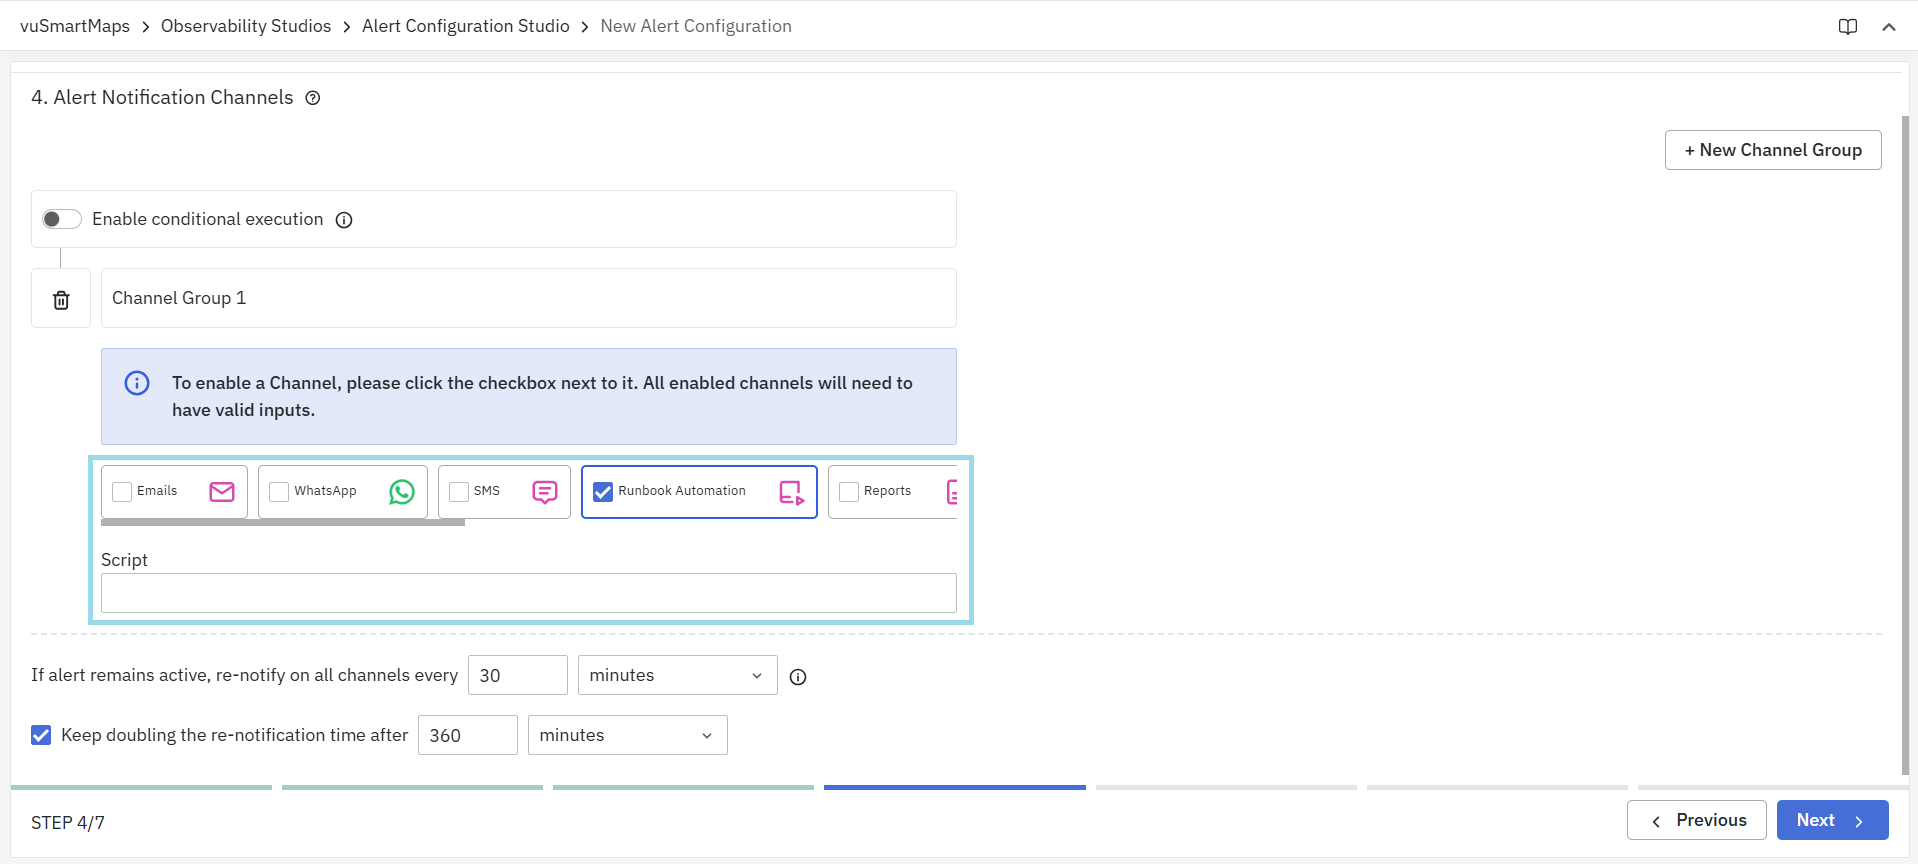
Enable Channels
Each available channel can be turned on or off using the checkbox. When you enable a channel, make sure all its required input fields are valid. Supported notification channels include:
- SMS
- Runbook Automation
- Tickets
- Mobile Push Notifications
- Microsoft Teams
- Slack
- Zoho Cliq
You can enable multiple channels at once so that critical alerts reach users through several platforms simultaneously.
Re-Notification Settings
Re-notification allows users to receive periodic updates for alerts that remain active over time. In Alarm mode, notifications are sent when an alert transitions to an active state and are not repeatedly sent while the alert remains active. By enabling re-notification, users can customize when notifications should be resent even if the alert is still in an active (alarm) state. This helps ensure that long-running or unresolved issues continue to receive attention without generating unnecessary noise.

Re-notify on All Channels Every
This option defines how often the system should send reminder notifications for an alert that hasn’t cleared yet.
- Use this to make sure long-running issues aren’t forgotten.
- Choose the frequency and time unit (seconds, minutes, hours, etc.) from the dropdown list.
- Minimum interval: The re-notification time must be at least 30 minutes.
- Example: If you set this to 30 minutes, the alert will resend notifications every 30 minutes until the issue is resolved or cleared.
Keep Doubling the Re-Notification Time After
Enable this checkbox if you want the system to gradually increase the time between notifications after a certain period.
- You can set when the doubling should start and select the time unit (for example, minutes or hours).
- Once enabled, the interval between reminders will double automatically after the specified time.
- Example:
- Re-notification interval: 30 minutes
- Start doubling after: 80 minutes
- Initial alert triggered at: 1:00 PM
Notifications are sent every 30 minutes while the alert remains active:
- 1:00 PM: Initial alert notification
- 1:30 PM: Re-notification
- 2:00 PM: Re-notification
- 2:30 PM: Re-notification
After the doubling threshold is reached, the re-notification interval starts increasing:
- 3:30 PM – Interval doubled to 60 minutes
- 5:30 PM – Interval doubled to 120 minutes
- And so on, with the interval continuing to double for subsequent notifications.
Email
The Email channel sends alert notifications directly to users through email when an alert condition is met. You can configure individual recipients or use predefined email groups for quick setup.
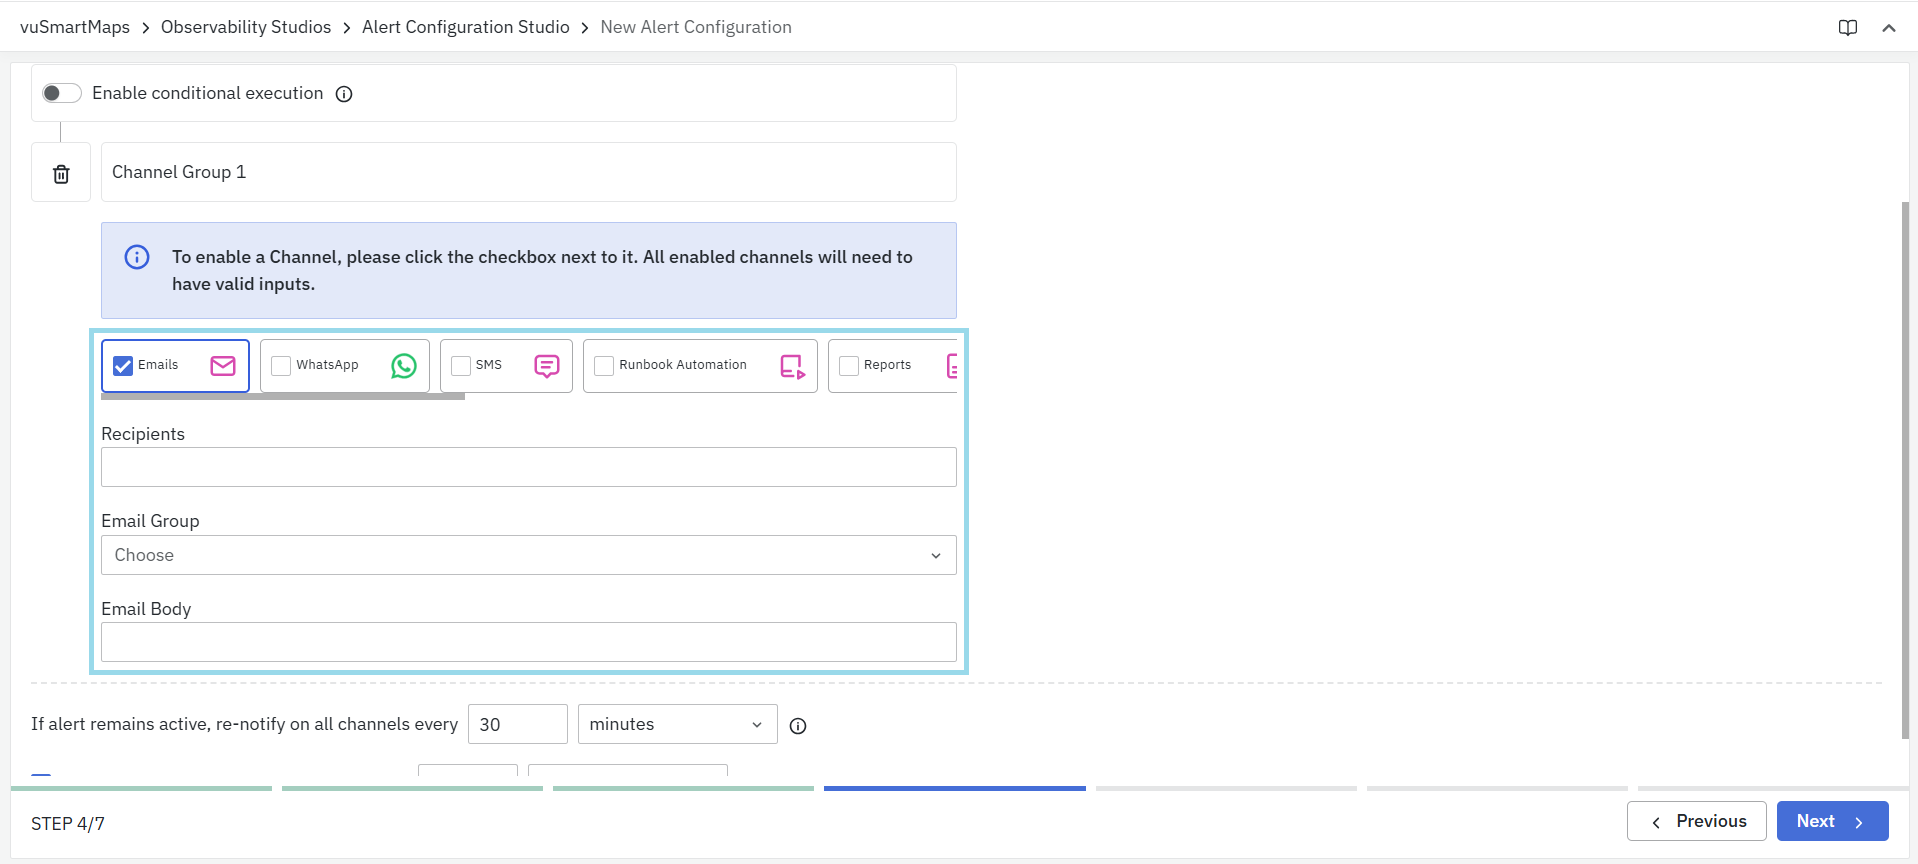
Configuration Steps
- Enable Email Channel:
- Click the checkbox beside Email to activate it. The Email tab will be highlighted once enabled.
- Enter Details
- Recipients: Add one or more email addresses, separated by commas.
- Example:
ops@vunetsystems.com, admin@vunetsystems.com
- Example:
- Email Group: Select a predefined email group from the dropdown. For more details on creating Email Group Navigate to Platform Settings > Definitions > Email Groups
- Email Body: Add a custom message if required. The system uses a default email format that includes alert name, severity, summary, and description.
- Recipients: Add one or more email addresses, separated by commas.
If you provide a custom message it will override the entire default body of the email.
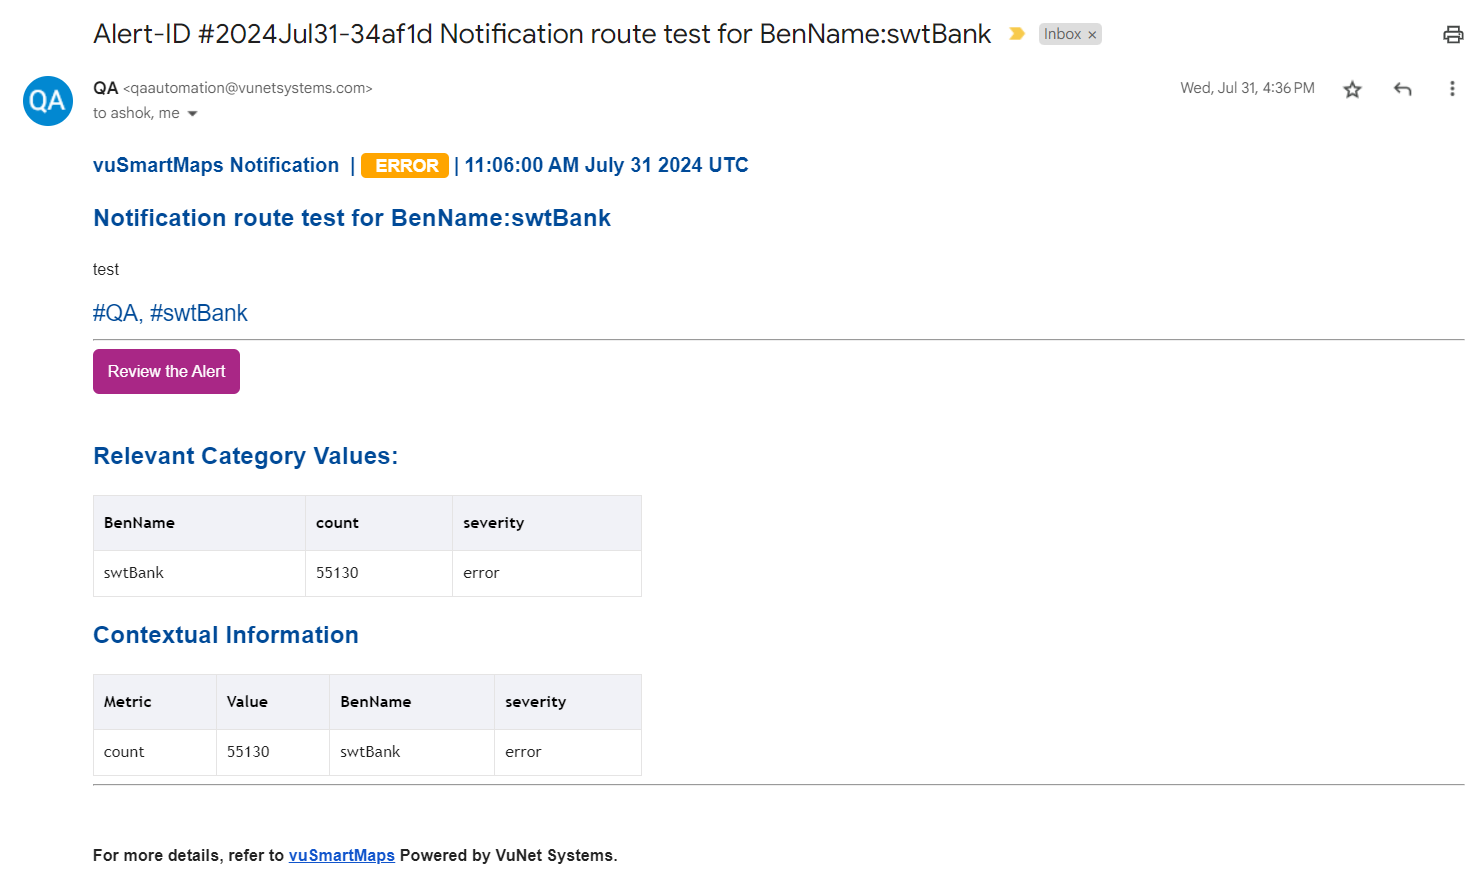
Error Notification
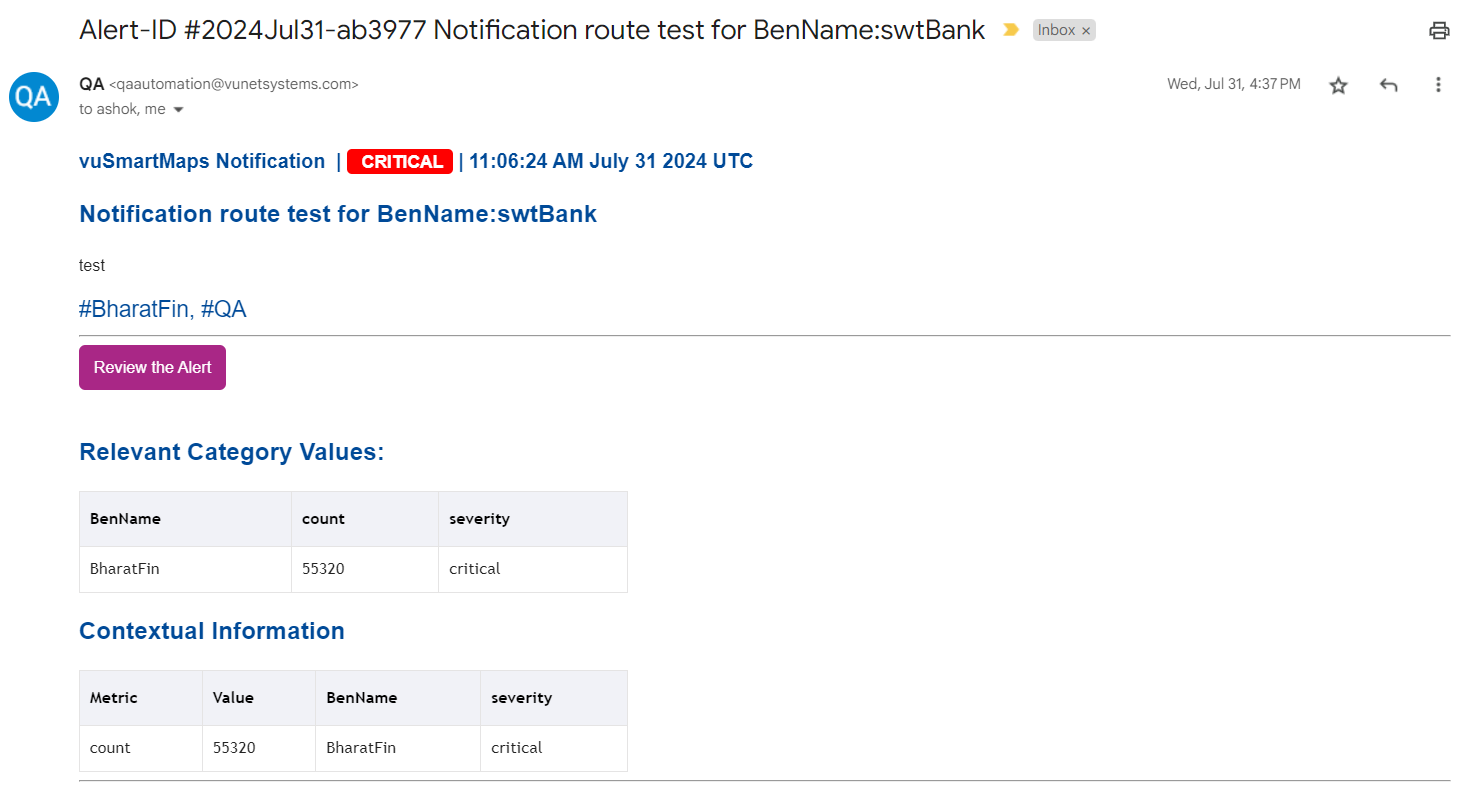
Critical Notification
- Ensure all recipient emails or selected groups are valid.
- You can replace the default email content by adding your own text in the Email Body field.
WhatsApp
The WhatsApp channel allows vuSmartMaps to send alert notifications directly to users through WhatsApp. This helps ensure important alerts are delivered instantly, even when users are away from their email or dashboards.

Configuration Steps
- Enable WhatsApp Channel
- Select the checkbox beside WhatsApp to activate it.
- Add Recipients
- Enter the mobile numbers of the users who should receive alerts.
- You can enter multiple numbers separated by commas or select from a predefined Mobile Group.
- For more details on creating Mobile Group Navigate to Platform Settings > Definitions > Mobile Groups.
WhatsApp alerts require Business API activation in your vuSmartMaps installation. Please contact the VuNet support team to enable this feature before using the channel.
SMS
The SMS channel allows vuSmartMaps to send alert notifications as text messages to configured users. This ensures quick visibility of alerts, even when users are not connected to email or dashboards.
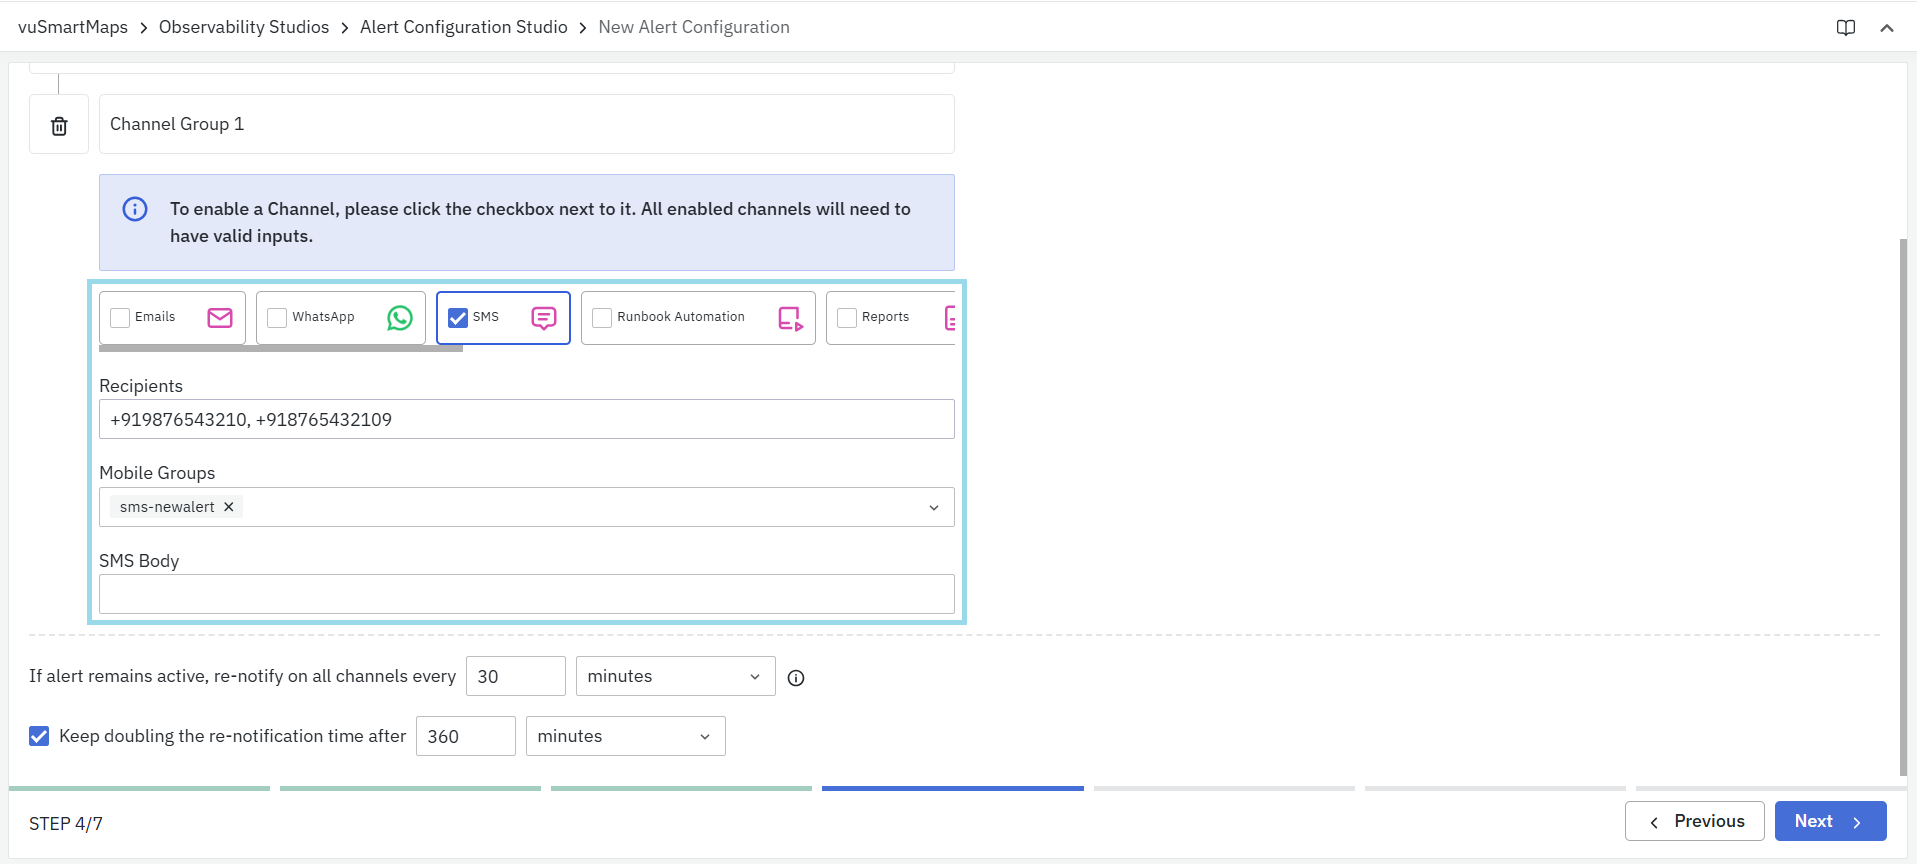
Configuration Steps
- Enable SMS Channel
- Select the checkbox beside SMS to activate it.
- Add Recipients
- Enter the mobile numbers of users who should receive SMS alerts.
- You can add multiple numbers separated by commas.
- Example:
+919876543210, +918765432109
- Example:
- You can also configure Mobile Groups, similar to how they are created for WhatsApp.
- For more details on creating Mobile Group Navigate to Platform Settings > Definitions > Mobile Groups.
Default SMS Content
When configured, the system sends a default SMS notification containing:
- The summary of the alert
- Any tags related to the alert
- The severity of the alert
- Example: CPU Utilization for Host_Name:IHYDIBMPF-C1B5-CL6, Touch_Point: xMobile #DAQ #Server Health. The severity of Alert - Warning
Custom SMS Message Format
You can customize the SMS content using the alert format string. This allows you to control what information appears in the SMS and how it is displayed.
- Example: vuSmartMaps Alert APP - UPI KPI-Technical Decline TH:0.5% ACT - 0.52% Details - FailedAt: XYZ RespCode: U48 AlertTime: 22.06.2020 08:35:33 IST ActiveSince: 12 Hour(s) and 30 min(s) Past Incidents Today - 7 incident(s) spanning 45 minutes
The alert document contents can be viewed on the Search page by selecting the notification index.
It lists all fields that can be used in the SMS format.
Available Placeholders for Customization
You can use placeholders from the alert document to dynamically insert details into the SMS message.
Header Section
{{header>Alert-Rule-Name}}– Name of the alert{{header>severity}}– Severity level{{header>summary}}– Alert summary{{header>type}}– Type of alert{{header>description}}– Alert description{{header>duration}}– Duration of the alert{{header>start_time}}– Start time of the alert{{header>@timestamp}}– Time when the alert was triggered{{header>tags}}– Tags associated with the alert
History Section
{{History>Today}}– Past incidents for today{{History>Last 7 Days}}– Incidents in the last 7 days{{History>Last 1 Month}}– Incidents in the last month
Rule Metrics
{{R1>M1}}– Metric value from the first rule{{R1>M1>average_rtt}}– Specific metric field from a rule{{R2>Information[1]>M1}}– Access information metrics from another rule
To use SMS as an alert notification channel, you must activate SMS APIs and SMS Gateways in your vuSmartMaps installation. For detailed setup steps, refer to the SMS Alert Script Guide.
Runbook Automation
The Runbook Automation channel allows you to automatically trigger predefined scripts when an alert condition is met. These scripts can perform actions such as remediation, system restarts, data collection, or sending custom notifications helping to reduce manual intervention.
How It Works
When an alert is triggered, vuSmartMaps can execute a custom Starlark script. The script receives two key inputs:
- The Alert Document (containing real-time alert details).
- The Alert Configuration (containing rule-level settings and parameters).
This allows the script to make automated decisions based on alert data for example, restarting a service, sending a secondary email, or collecting diagnostic data.
Example Use Case
For example, if a router interface goes Down, a runbook script can be used to automatically restart that interface or collect interface logs before notifying the network team.
Sample Script Template
if __name__ == "__main__":
   try:
       opts, args = getopt.getopt(sys.argv[1:], "", [])
   except getopt.GetoptError:
       sys.exit(1)

   # Collecting arguments
   alert_document = json.loads(args[0])
   alert_configuration = json.loads(args[1])
   mobile_number = alert_configuration.get('mobile_sms', None)
   sms_content = alert_configuration.get('sms_content', None)

   print(mobile_number)

   sms_list = _prepare_sms_body(
       alert_document, alert_configuration, mobile_number, sms_content)
This example shows how the script retrieves alert details and configuration parameters for use during execution.
A typical alert document passed to the script is shown below:
{
    "History": {
      "Today": {
        "Event Count": 19,
        "Active For": 26745.087917
      },
      "Last 7 Days": {
        "Event Count": 78,
        "Active For": 211002.844929
      },
      "Last 1 Month": {
        "Event Count": 238,
        "Active For": 1702128.547532
      }
    },
    "Alert-Rule-Evaluation-Duration": "12 Minutes",
    "duration": 300,
    "alert_id": "3275183",
    "timestamp": "2020-06-14 06:21:51",
    "R1": {
      "name": "BMV For Server CPU Utilization R1",
      "M1": {
        "value_for_eval_duration": "0.8537999987602234",
        "matched_threshold": "> 0.01",
        "field": "system.cpu.total.norm.pct",
        "color": "#05a608",
        "insights": "Looks all fine",
        "label": "SYSTEM.CPU.TOTAL.NORM.PCT",
        "formatted_value_for_eval_duration": "85.38%",
        "type": "number"
      },
      "status": "Available"
    },
    "severity": "warning",
    "summary": "CPU Utilization for target:10.121.9.56",
    "alarm_state": "Alarm New",
    "Alert-Rule-Name": "Server CPU Utilization",
    "group_values": "10.121.9.56",
    "target": "10.121.9.56",
    "tags": [
      "Server Health",
      "10.121.9.56",
      "DAQ"
    ],
    "start_time": "2020-06-14T06:16:51.000Z",
    "Type": "CPU Utilization",
    "@timestamp": "2020-06-14T06:21:51.000Z",
    "group_label": "Server CPU Utilization 10.121.9.56",
  }
This JSON contains details like severity, summary, timestamp, and related metrics that the script can use to make logical decisions.
A typical alert configuration is passed to the script is shown below:
{
 	"enableAlert": true,
 	"enableThrottle": true,
 	"alertByReport": false,
 	"activeStartTime": "00:00:00",
 	"alertEmailBody": "",
 	"alertByTicket": false,
 	"severity": "warning",
 	"advancedConfiguration": "\"tags\":\n  	- \"Server Health\"",
 	"throttleDuration": 2,
 	"description": "Process Memory Utilization for %g is %m",
 	"alertReportList": "[]",
 	"enable_ansible_playbook": false,
 	"ansible_playbook_name": "",
 	"summary": "Process Memory Utilization",
 	"throttleDurationType": "hour",
 	"alertEmailId": "",
 	"enable_runbook_automation": false,
 	"activeAlertCheck": "",
 	"alertEmailGroup": "",
 	"runbook_script": "",
 	"alertByEmail": false,
 	"ansible_playbook_options": "",
 	"ruleLevelThreshold": "",
 	"title": "Server Process Memory Utilization"
}
These parameters can be used within the script to control how the alert should behave or what response should be triggered.
Script Placement
Once the script is created, save it to the following directory on the shipper and restart the alert container for the changes to take effect:
/data/configs/vunet-scripts
This ensures the alert engine can access and execute the script when the corresponding alert condition is met.
Example Script (Sending an Email on Trigger)
import smtplib
import getopt
import sys
import json

if __name__ == "__main__":
    try:
        opts, args = getopt.getopt(sys.argv[1:], "", [])
    except getopt.GetoptError:
        sys.exit(1)

    alert_document = json.loads(args[0])
    alert_configuration = json.loads(args[1])

    alarm_state = alert_document.get("alarm_state")
    alert_id = alert_document.get("alert_id")
    alert_name = alert_document.get("Alert-Rule-Name")

    if alarm_state != "Alarm New":
        sys.exit(1)

    server = smtplib.SMTP("smtp.example.com", 587)
    server.starttls()
    server.login("username@example.com", "password")

    msg = (
        "Hello, this is a test email for an alarm notification.\n"
        f"Alert Name: {alert_name}\nAlert ID: {alert_id}"
    )

    server.sendmail("sender@example.com", "recipient@example.com", msg)
    server.quit()
    sys.exit(1)
This example shows how the script connects to an email server and sends a custom notification when a new alert is triggered.
- Make sure the script path and permissions are correctly set.
- Always validate your script logic in a test environment before using it in production.
- Scripts can use alert details and configuration data to trigger external tools or automation systems.
Mobile Push Notification
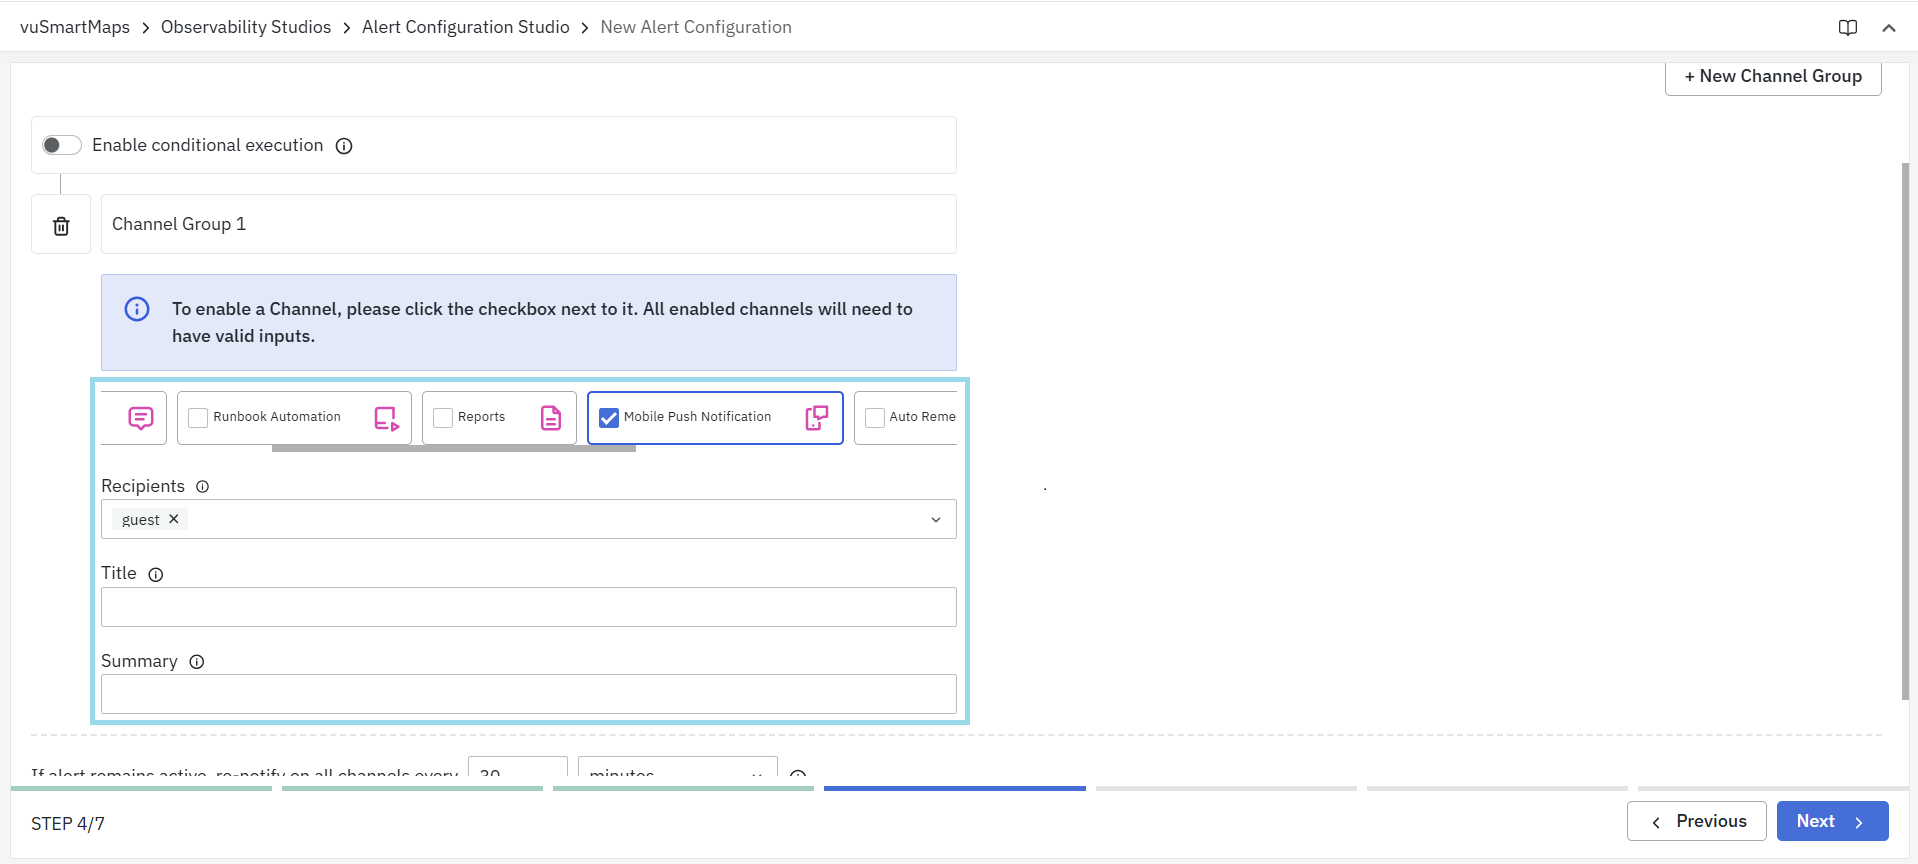
To configure Mobile Push Notification:
- Select the Mobile Push Notification option.
- Recipients:
- Select recipients from the list.
- Use the dropdown to choose the users who should receive push notifications.
- If no users are selected, notifications will be sent to all users.
- Title and Summary:
- Keep both fields short (under 40 characters).
- You can optionally enter a Notification Title and Body.
- If left blank, the alert rule’s title and summary will be used.
Microsoft Teams
vuSmartMaps platform can notify users through Teams Channels. Recipient phone numbers are to be configured here.
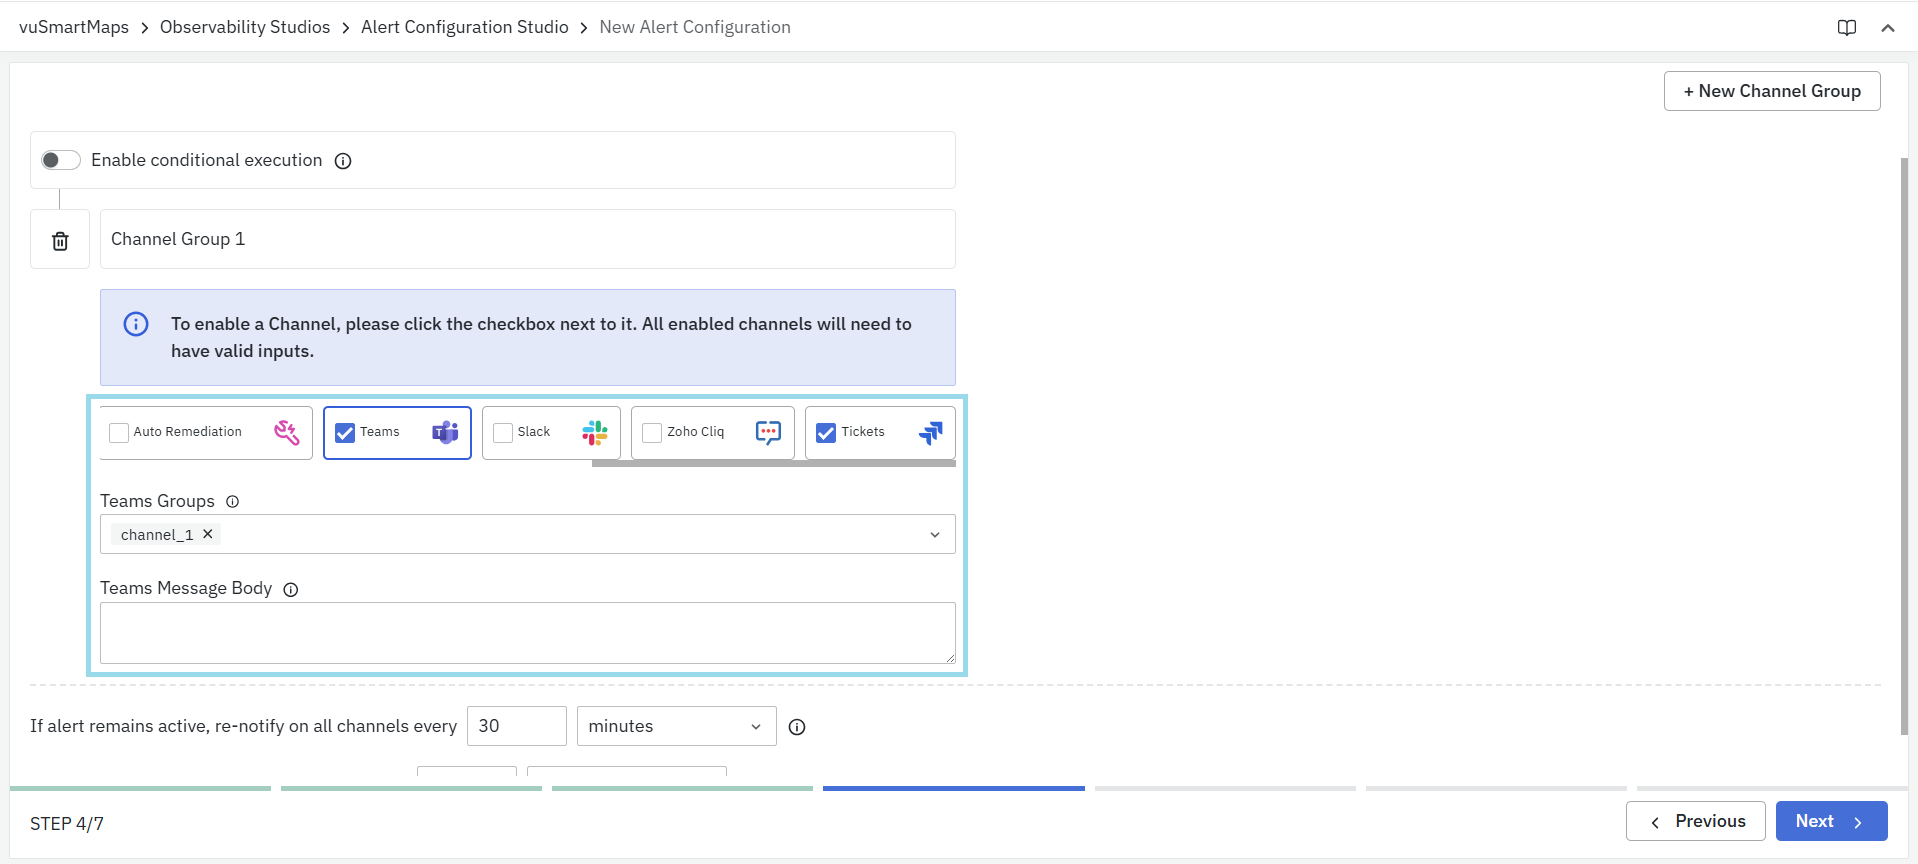
-
Team Groups: Select Microsoft Teams channels from the dropdown list. The list includes channels added in the Preference Section.
-
Team Message Body: Add content that needs to be sent as a message. Eg: Alert_Name:
{{Alert-Rule-Name}}and Severity:{{severity}}. The variable inside the brackets will be substituted with values in real time.
Example Fields for Alert Messages
-
Header Section
{{header>Alert-Rule-Name}}- Name of the alert
-
{{header>severity}}- Severity of the Alert -
{{header>summary}}- Summary of the alert -
{{header>type}}- Alert Type -
{{header>description}}- Alert description -
{{header>duration}}- Duration of the alert alarm -
{{header>start_time}}- Time at which the alert started -
{{header>@timestamp}}- Time at which the current alert got triggered -
{{header>tags}}- Tags attached to the alert -
History Section
{{History>Today}}- Information about past incidents today
-
{{History>Last 7 Days}}- Information about past incidents in last 7 days -
{{History>Last 1 Month}}- Information about past incidents in the last month -
Rule Metrics
-
{{R1>M1}}- A formatted value of the first metric of the first rule -
{{R1>M1>average_rtt}}- If there are any additional fields in any metric, they can be accessed this way. -
{{R2>Information[1]>M1}}- If the rule is an Information rule, users can access metric data in such a way. In this example, the user is accessing the top value of the first metric from the second rule which is an information rule behind the scenes of the SMS Alert Channel.
The use of Microsoft Teams as an alert notification requires a special activation in the vuSmartMaps installation to enable Business APIs for Microsoft Teams. Please contact the support team for more details on this.
Slack
vuSmartMaps platform can notify users through Recipient Slack Channels.
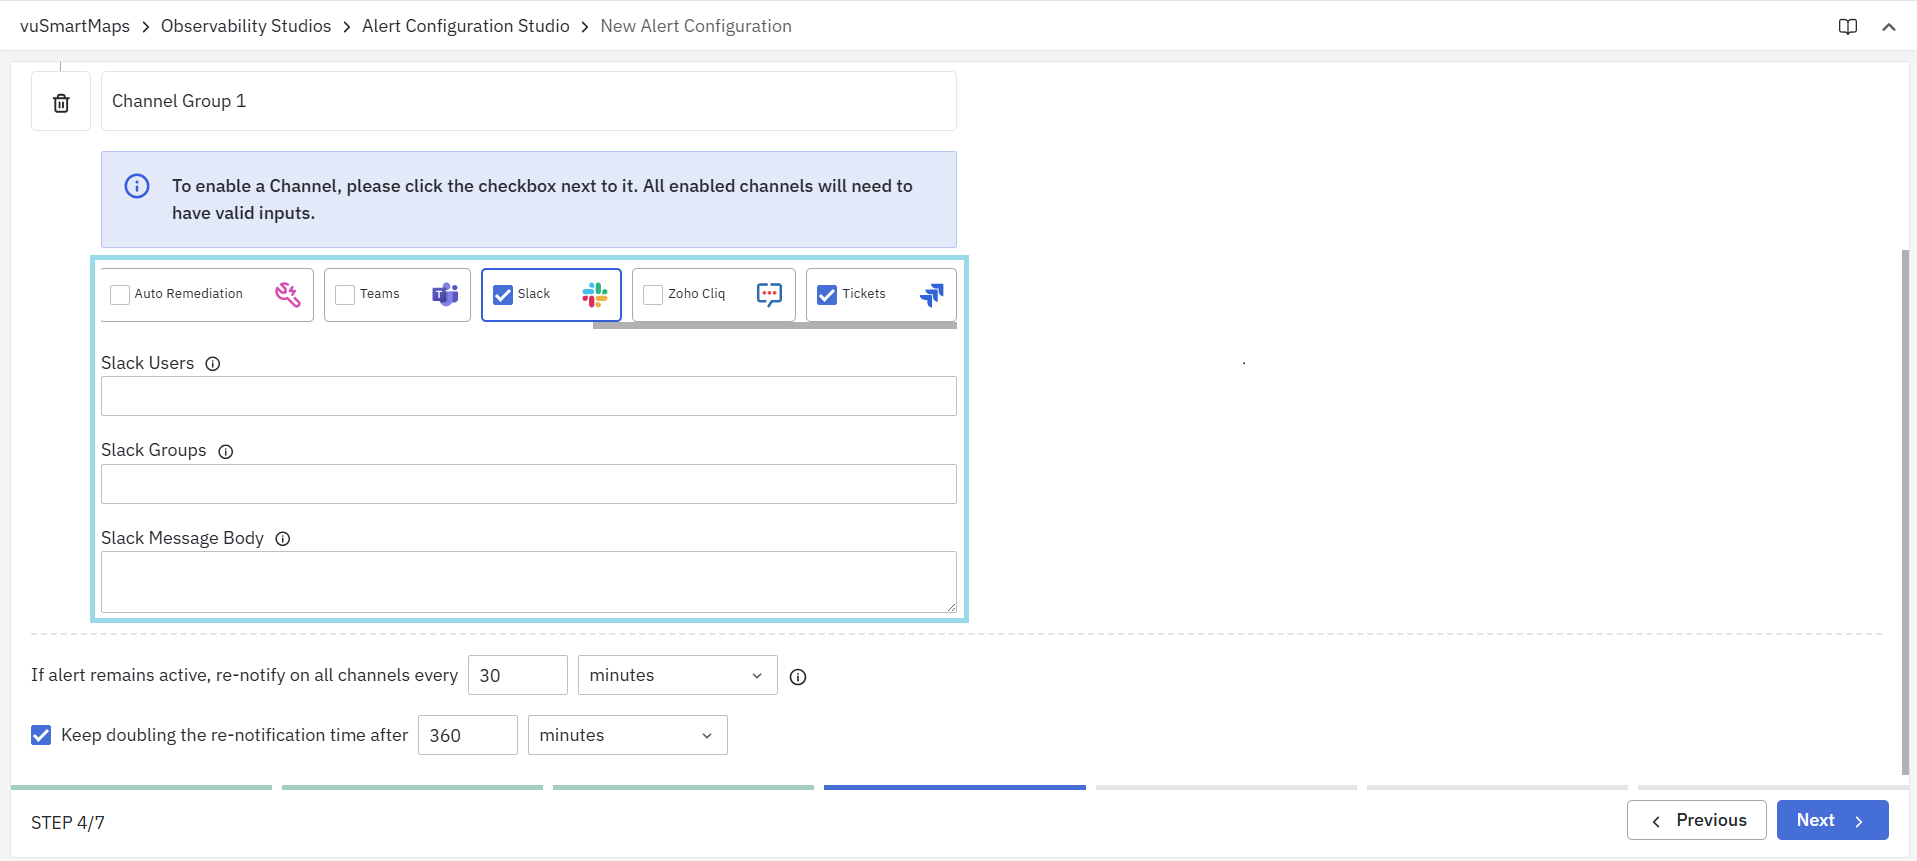
- Slack Users: Enter Slack User IDs by separating them with commas.
- Slack Groups: Enter Slack Channel IDs or names by separating them with commas. The channels that are configured in the Preference Section must be entered here.
- Slack Message Body: Add content that needs to be sent as a message. Eg: Alert_Name:
{{Alert-Rule-Name}}and Severity:{{severity}}. The variable inside the brackets will be substituted with values in real-time. - For the list of fields used in alert messages, please refer to the "Example Fields for Alert Messages" section.
The use of Slack as an alert notification requires a special activation in the vuSmartMaps installation to enable Business APIs for Slack. Please contact the support team for more details on this.
Zoho Cliq
vuSmartMaps platform can notify users through Zoho Cliq Channels.
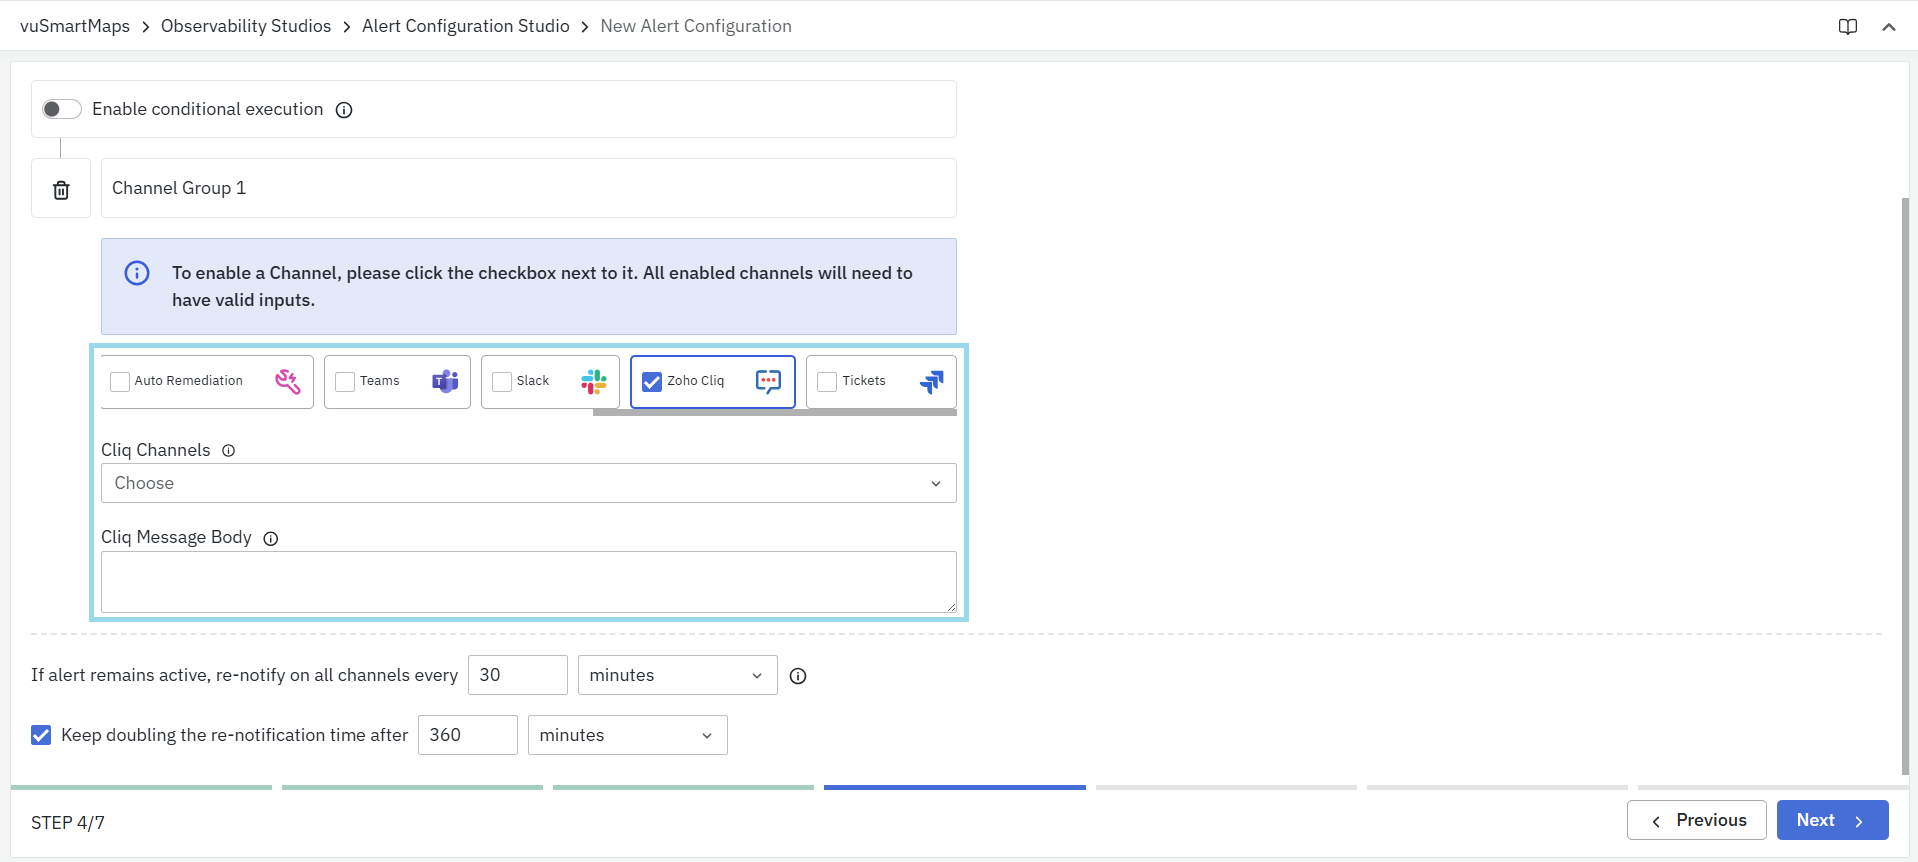
- Cliq Channels: Select the channel name from the dropdown, and the corresponding URL for the channel will be configured in the Platform Configurations section.
- Cliq Message Body: Add content that needs to be sent as a message. Eg: Alert_Name:
{{Alert-Rule-Name}}and Severity:{{severity}}. The variable inside the brackets will be substituted with values in real time. - For the list of fields used in alert messages, please refer to the "Example Fields for Alert Messages" section.
Tickets
The system connects to the configured ITSM system and updates a ticket when alert conditions turn active.
Ticket Description Template: This allows you to define the message content for tickets using dynamic placeholders. These placeholders pull real-time values from the alert document.
- Use
{(field_name_from_alert_doc)}to insert alert-specific details automatically. - When a ticket is created, these placeholders are replaced with actual alert values.
- Example Template:
Alert Name : {(Alert-Rule-Name)}
Severity : {(severity)}
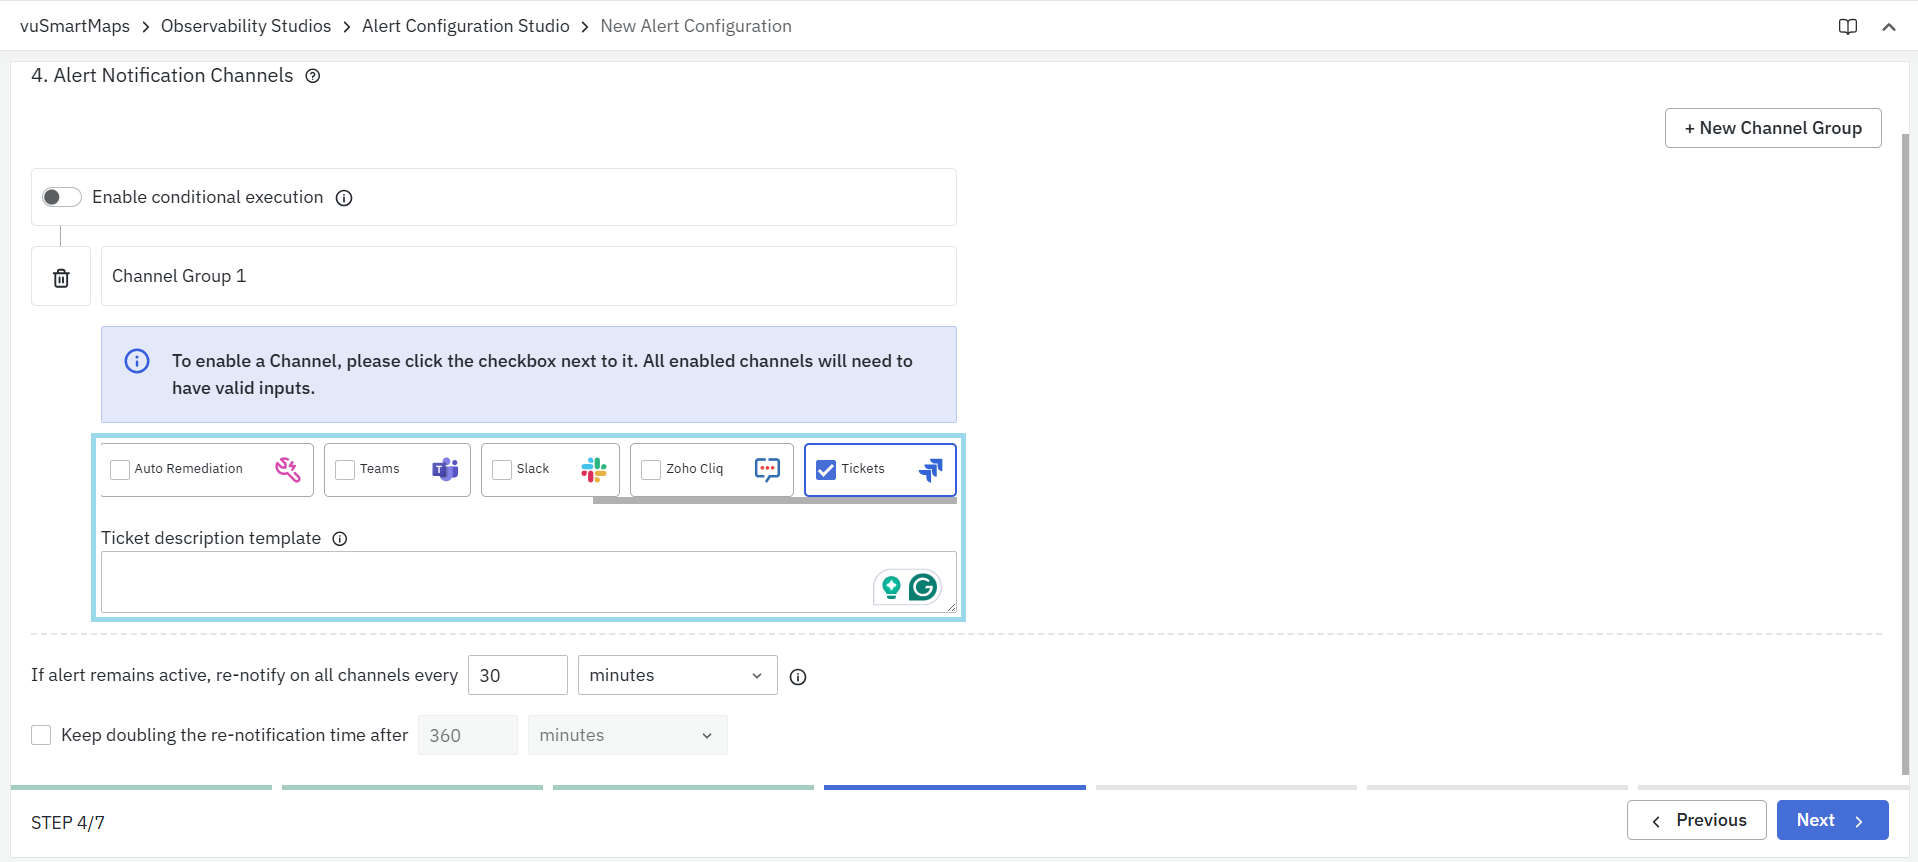
Configure the ITSM system and its access details in the ITSM preferences located in the Platform Configurations section of vuSmartMaps.
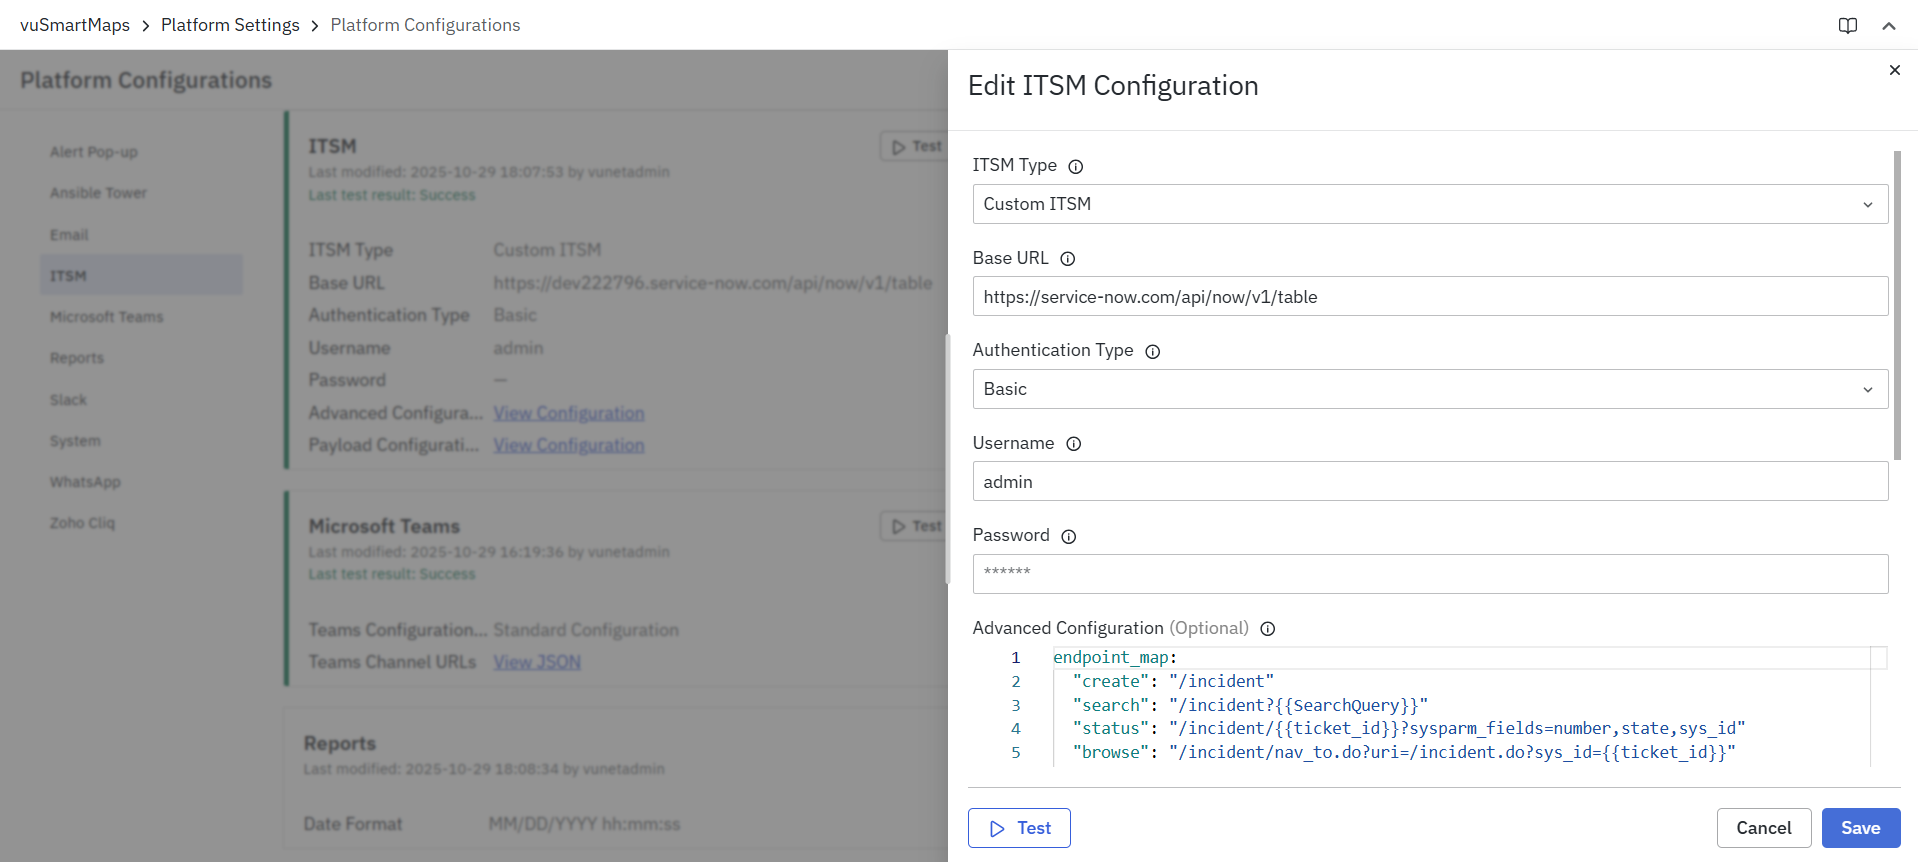
Usually, when an alarm condition becomes active, vuSmartMaps automatically creates a new ticket in the ITSM system. If the same condition repeats quickly, vuSmartMaps may update the existing ticket with more information.
Step 5. Additional controls
The Additional Controls section defines how often the alert is evaluated and how notifications are managed. This step allows you to control alert execution frequency and advanced configurations for custom requirements.
Alert Execution Settings
This section determines how frequently the system evaluates the alert configuration.
Execution Frequency
You can choose between two scheduling options:
System-defined schedule
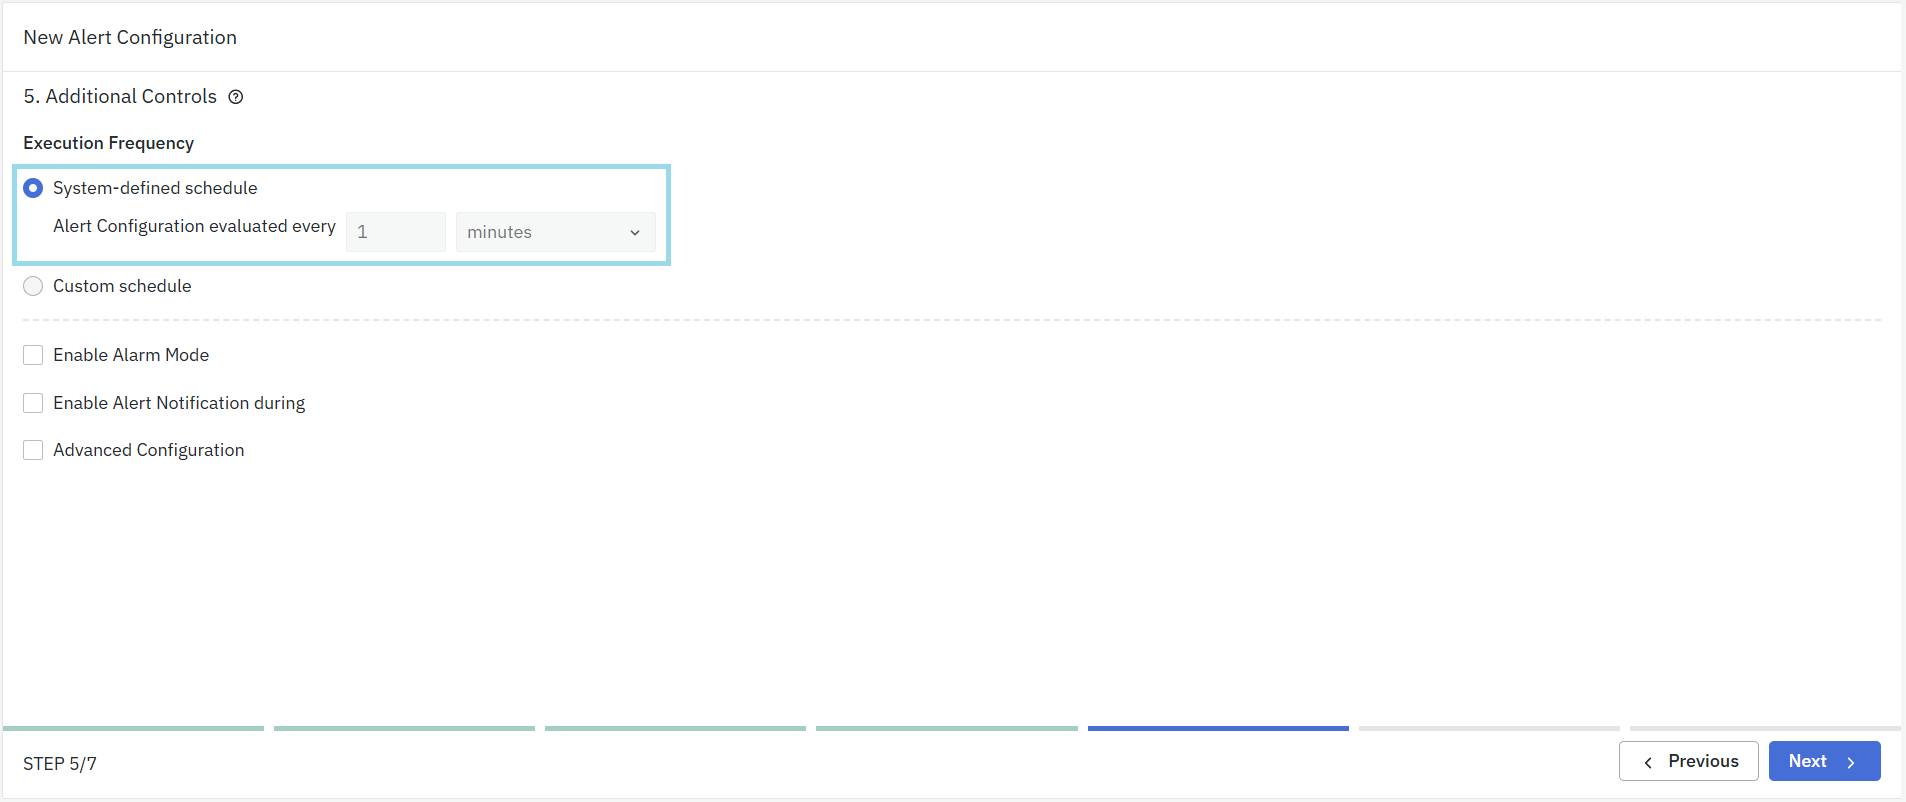
- The system automatically sets the evaluation frequency.
- By default, the alert configuration is evaluated every 1 minute.
Custom schedule
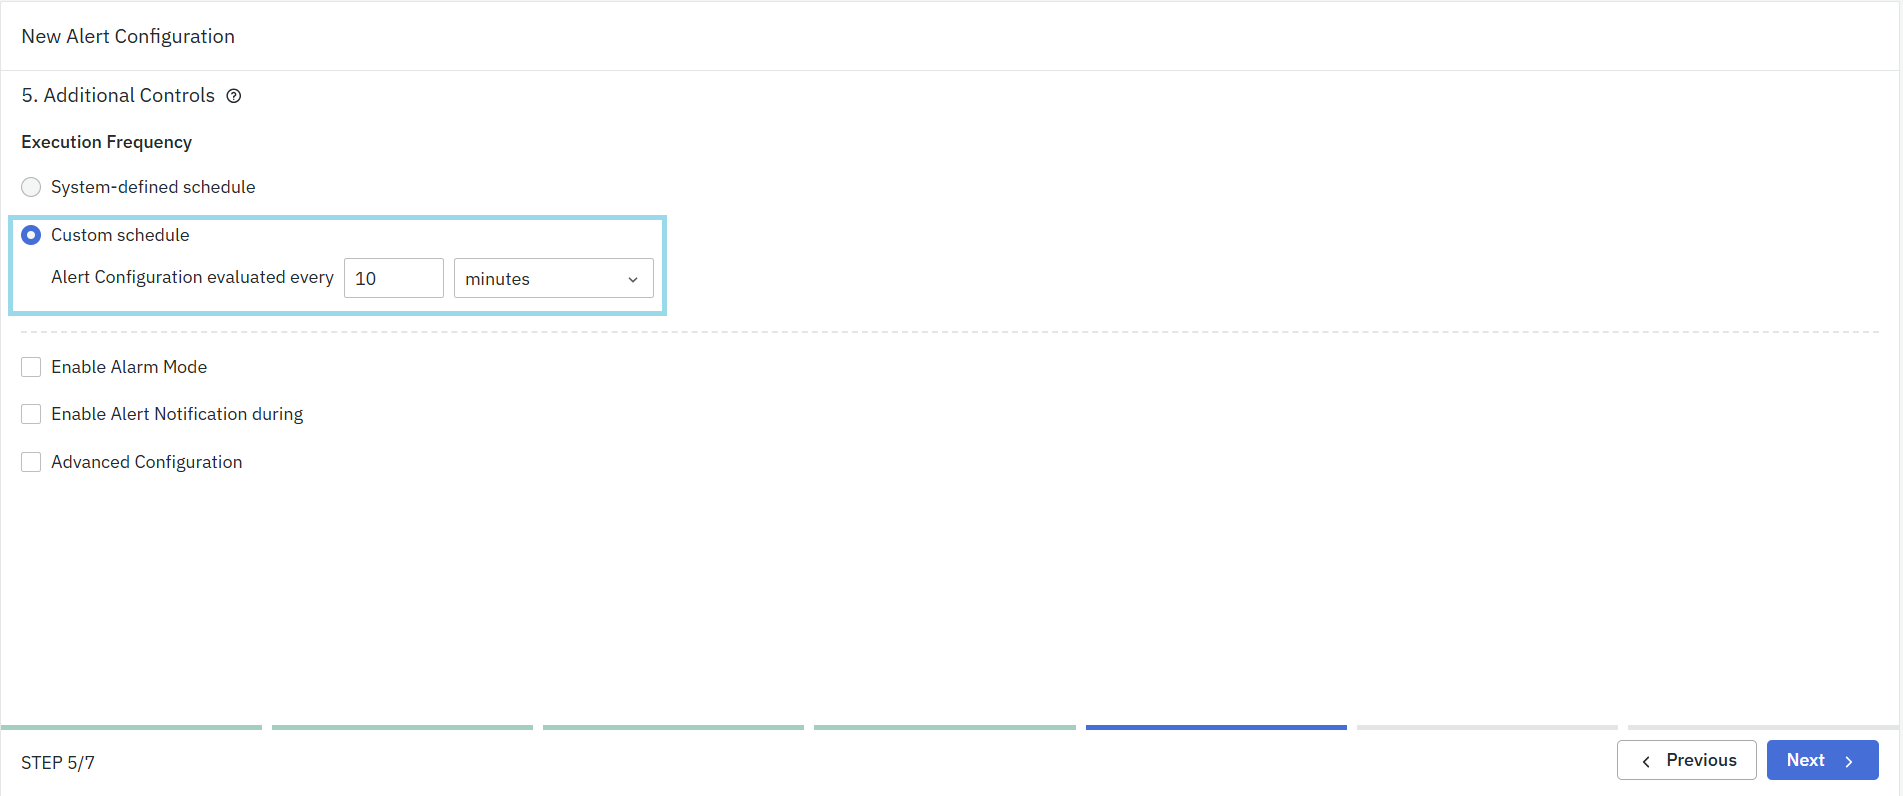
- Select this option if you want to define a custom evaluation interval.
- You can specify how often the alert configuration should be evaluated, such as every 5 minutes or 10 minutes, depending on your requirements.
Enable Alarm Mode

- When enabled, the system tracks the state of an alarm. Notifications are generated when the alert condition turns active or when the condition gets cleared. In the intermediate period, when the condition continues to be active, no further notifications are generated. Enable mode is the default state. For detailed information on Alarm Mode, refer to the Alarm Mode section.
- When disabled, notifications are generated at regular intervals as decided in the ‘Execution Frequency’. In this case, the system does not track the state of the alert and no clear notifications will be generated.
Enable Alert Notification During
This configuration is handy for avoiding notifications during periods of lower activity, such as weekends or non-business hours, ensuring that you only receive notifications when it’s most relevant.
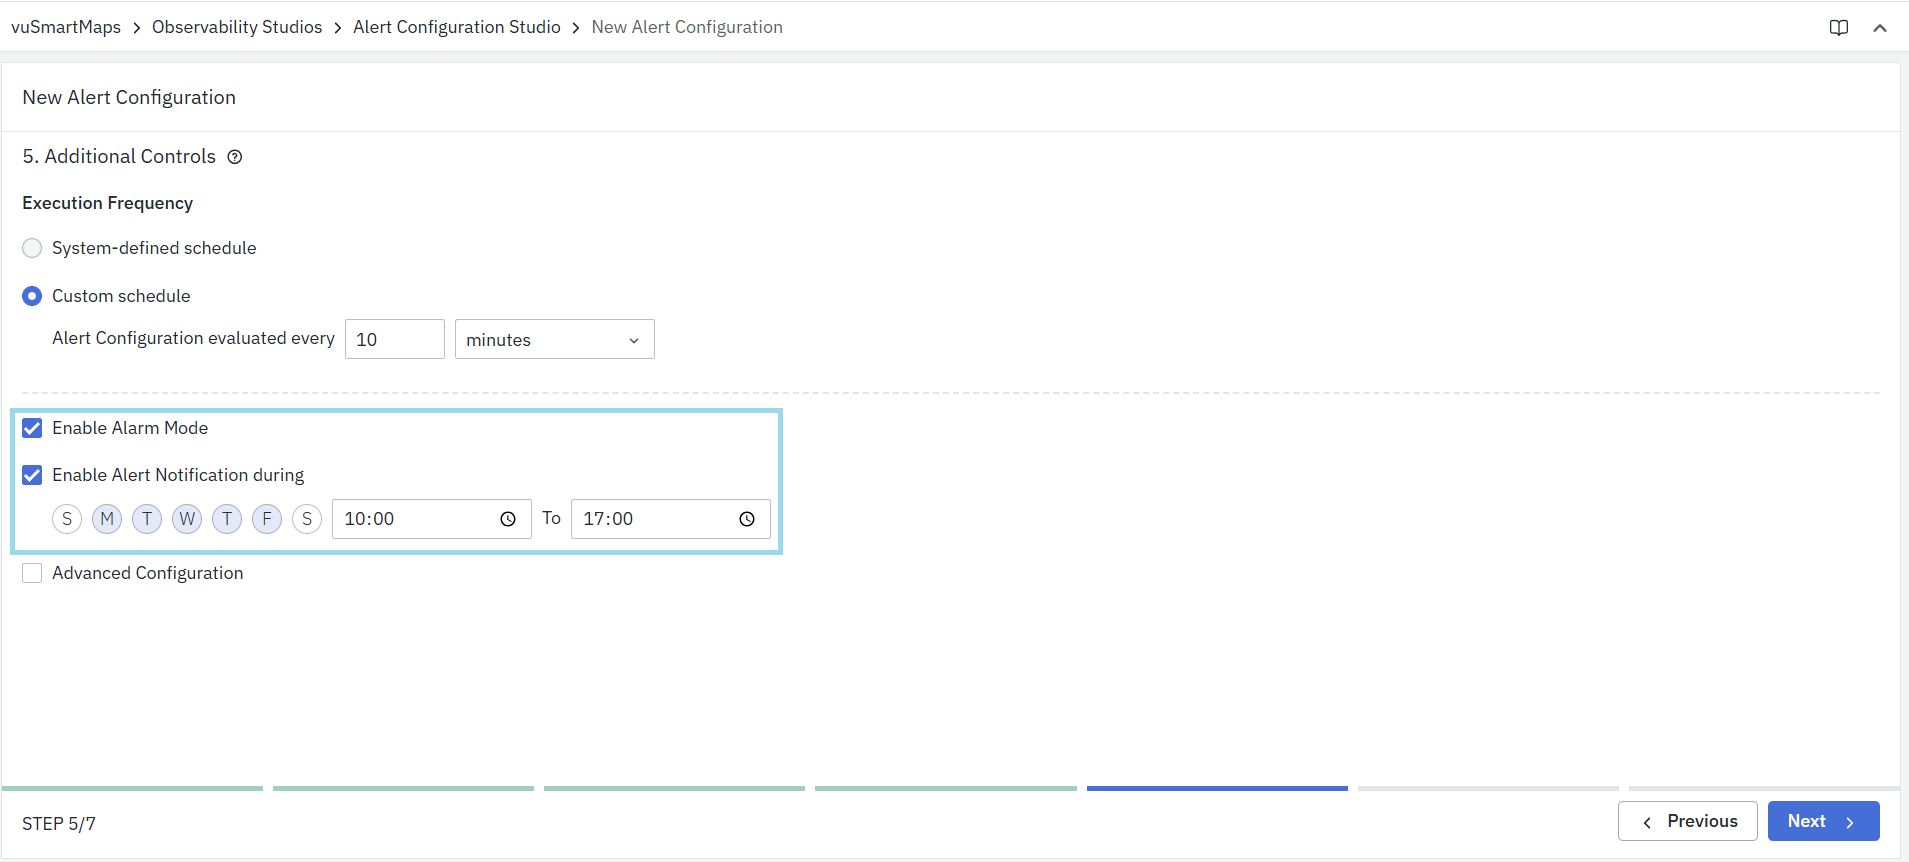
Example: Enable notifications from 10:00 AM to 5:00 PM, Monday to Friday, to avoid alerts outside business hours.
You can specify an alert's active period to prevent it from triggering alerts during planned maintenance activities. During this period, the rule won't generate alert notifications, but you can still access them in the Events section for reference.
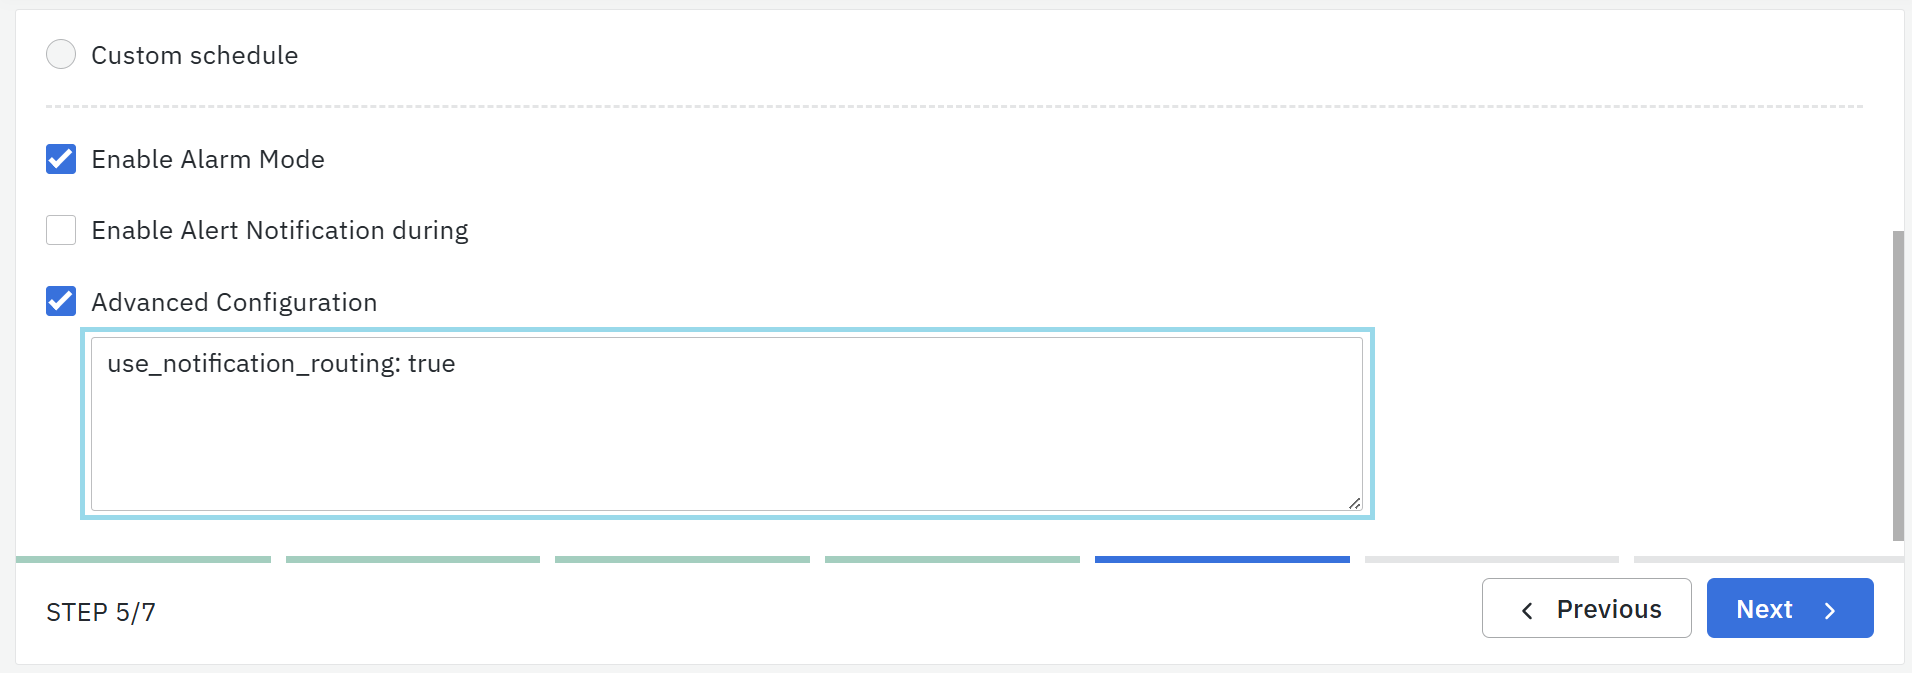
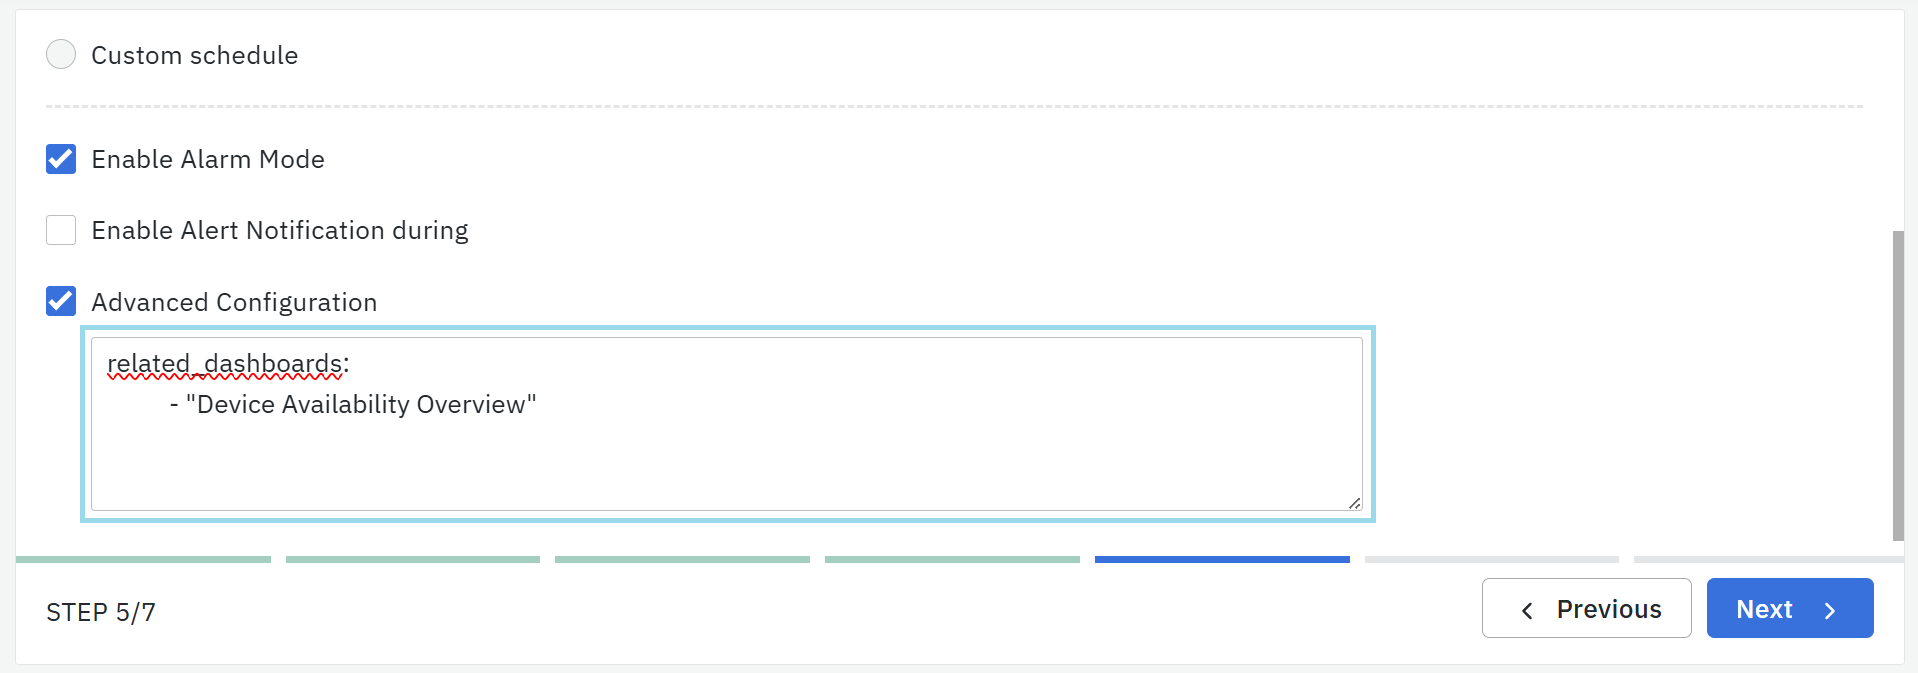
Advanced Configuration
Experts configure the more advanced settings. This is sometimes also used by the Software development team to extend Alert functionality without changing the User Interface.
- You can use the Advanced Configuration for adding new functionalities to alert rules through a YAML interface.
- It's a way to configure features that may not be available through the regular menu options.
- For instance, you can configure the alert notification level using this interface by specifying it in the advanced configuration text area.
notification_level: 0
Only YAML syntax is supported in this field.
Activate Notification Management Routing
You can configure and activate the Notification Management routing alerts by specifying them in the Advanced Configuration. Please note that all other Notification Channels configurations will be invalid once this is activated. And, notifications will happen based on the configuration in the Notification Management.
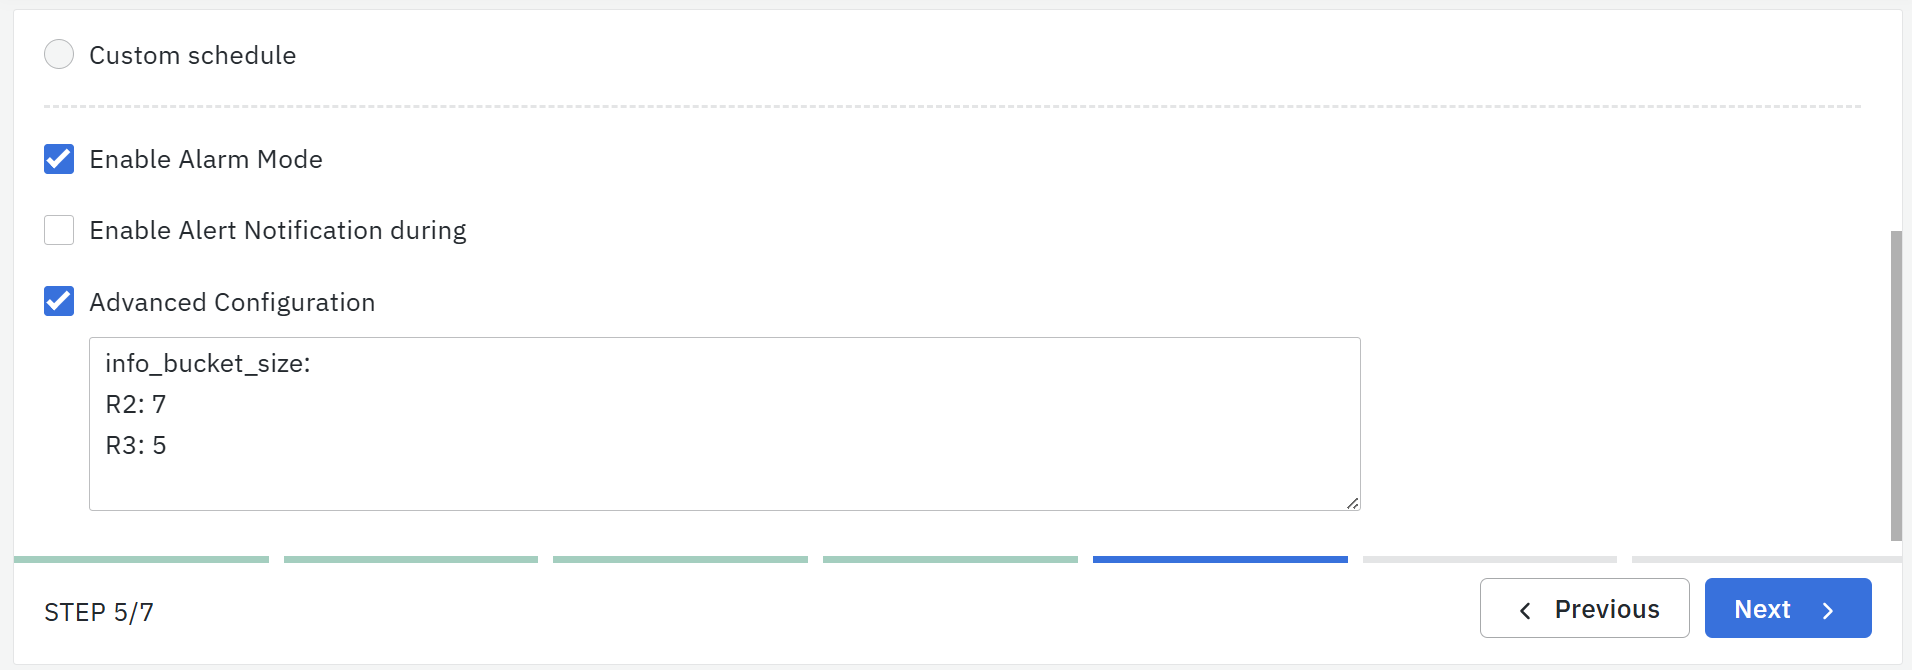
Advanced Configuration for Max Bucket Size
Recognizing the need for flexibility, we've introduced an advanced configuration option. This feature empowers users to override the max bucket size for any information rule within an alert. With customization at the forefront, this update allows for individualized settings across all information rules while maintaining a default value of 5. This enhancement is a step forward in offering our users the control they require to tailor the system to their specific needs.
Related Dashboards
To configure Related dashboards of an alert, use the YAML configuration as shown below. “Device Availability Overview” is the name of the dashboard which is preconfigured and called here.
The output of this configuration is seen in the ‘detailed view’ of the Alerts on the Alert Console.
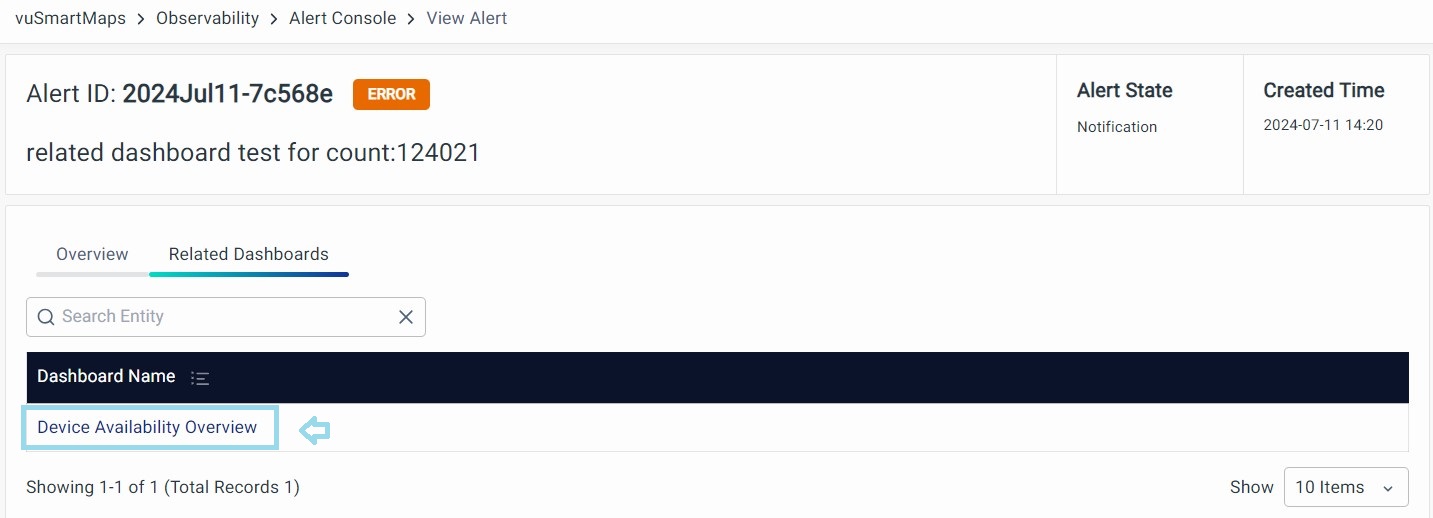
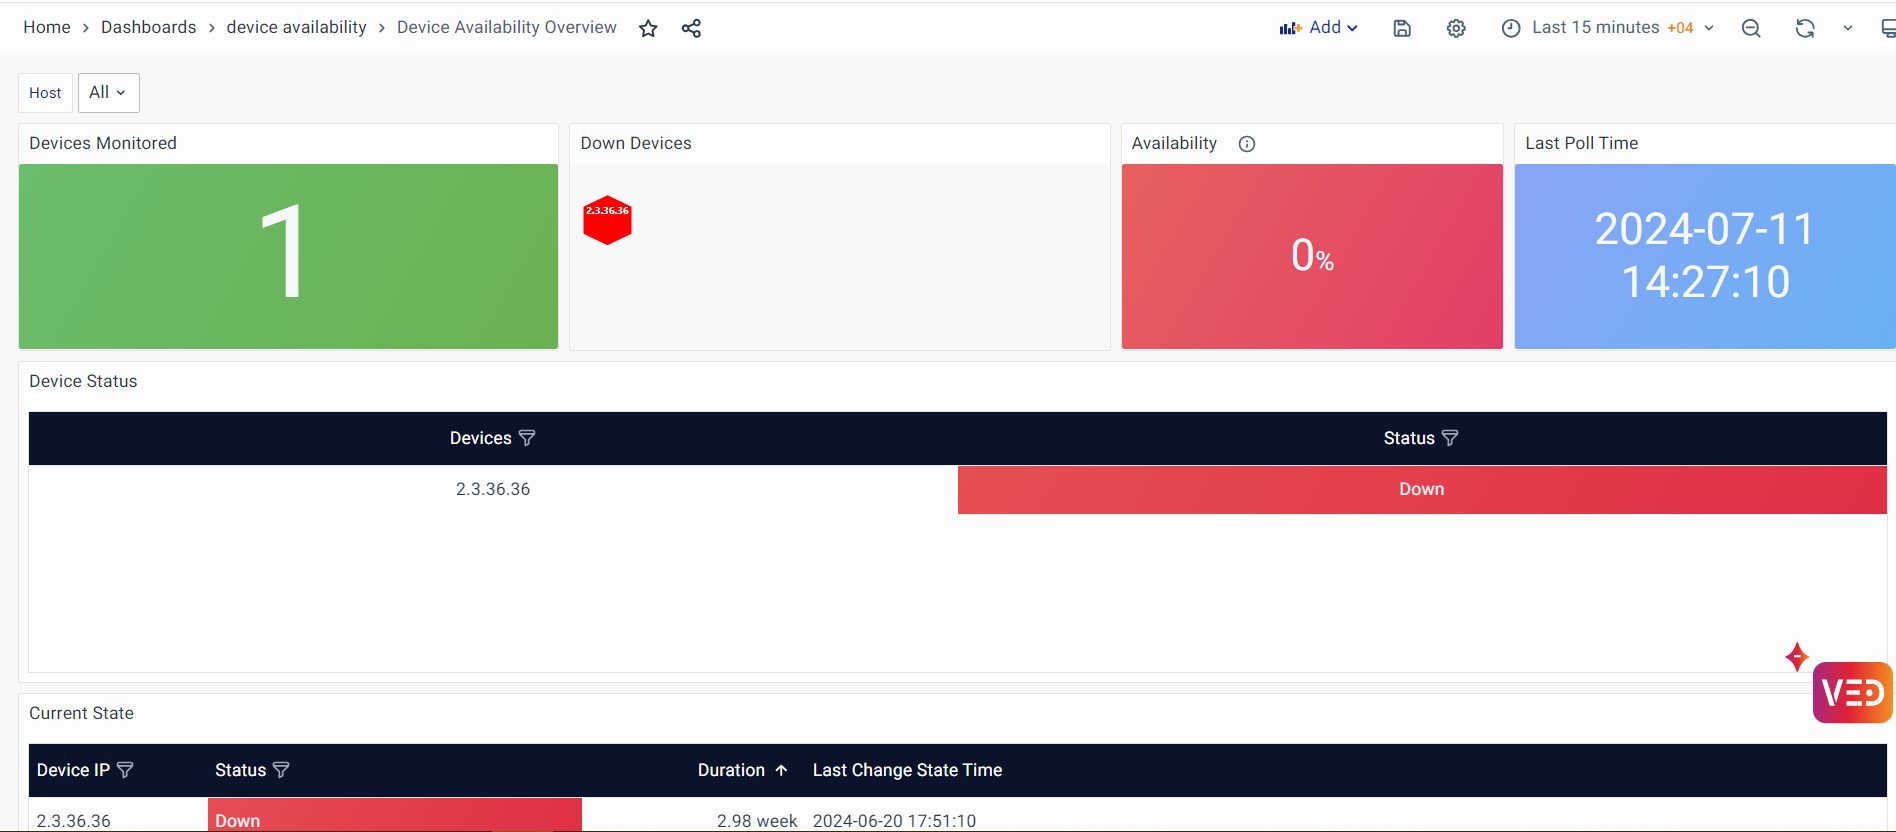
Click on the name of the dashboard highlighted and the respective dashboard will be displayed.
Related Dashboards feature is now available directly through the vuSmartMaps user interface, check here for more details.
Tags
To add tags during Alert configuration, enable the Advanced Configuration section and use a YAML script like the one shown in the attached snapshot below.
Tags feature is now available directly through the vuSmartMaps user interface, check here for more details.

Step 6 Test Execution
The Test Execution step allows you to validate the alert configuration before finalizing it. You can execute the alert either on live data or for a specific historical time range, to ensure that the alert logic and thresholds are working as expected.
Execution Options
You can choose one of the following options:
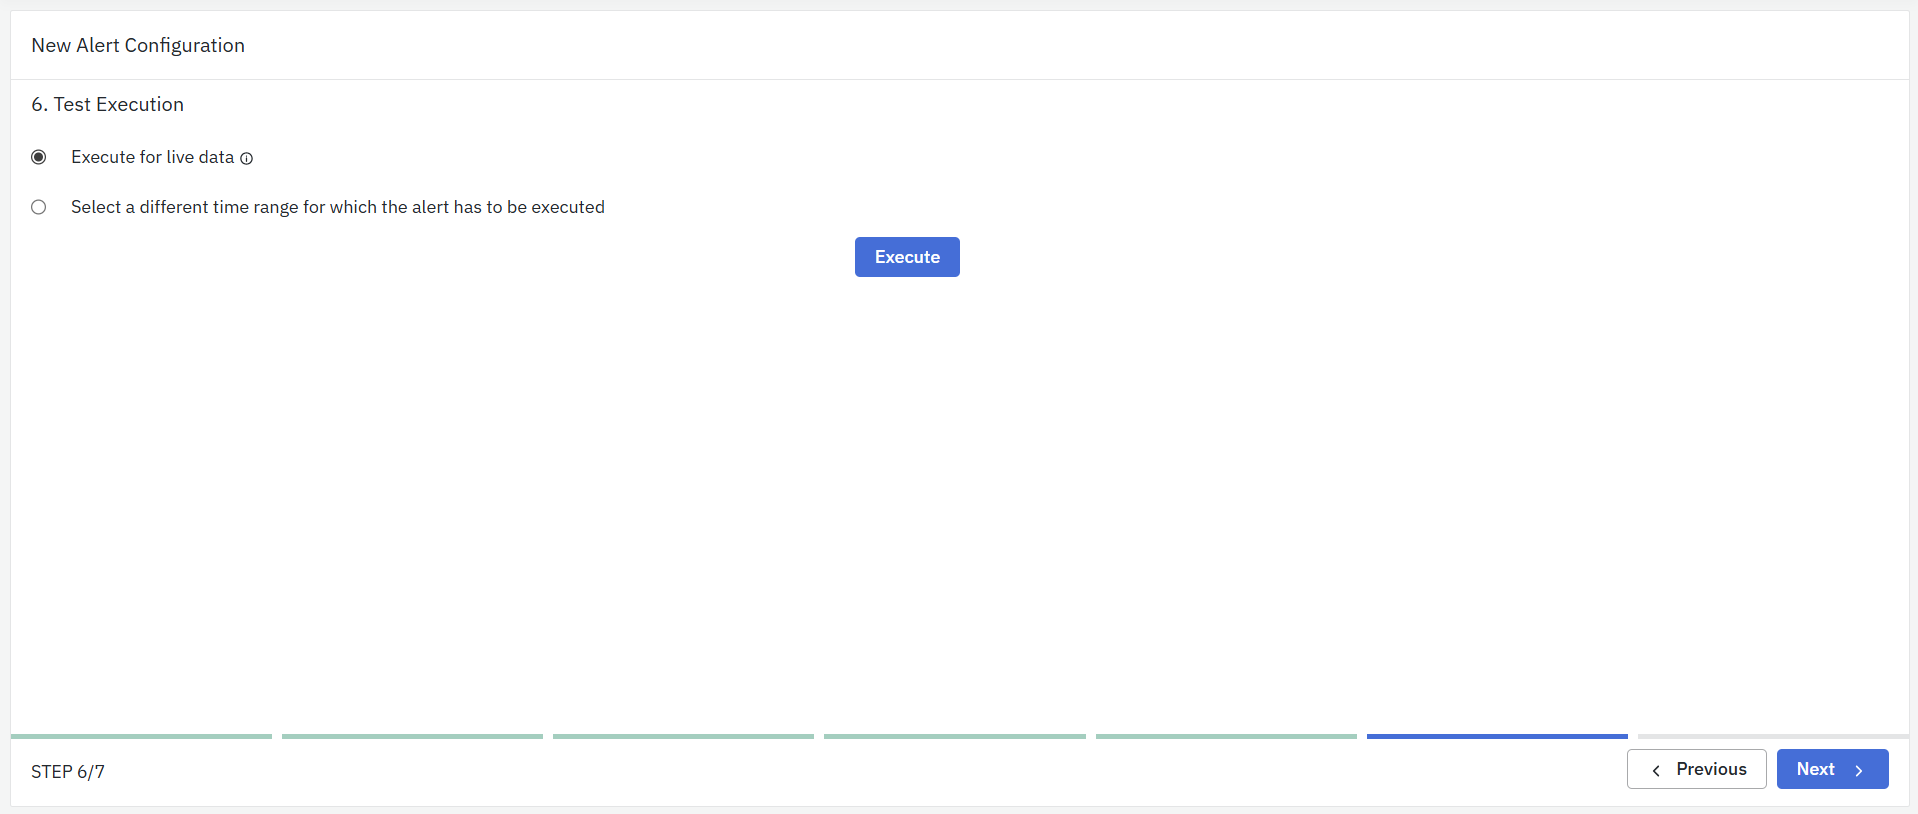
- Execute for Live Data
- Select this option to test the alert rule on the most recent live data.
- The system uses the same data range defined in the “Data Models to be Alerted On” section for evaluating the rule.
- This helps confirm that the alert behaves correctly with the latest available data.
- Select a Different Time Range
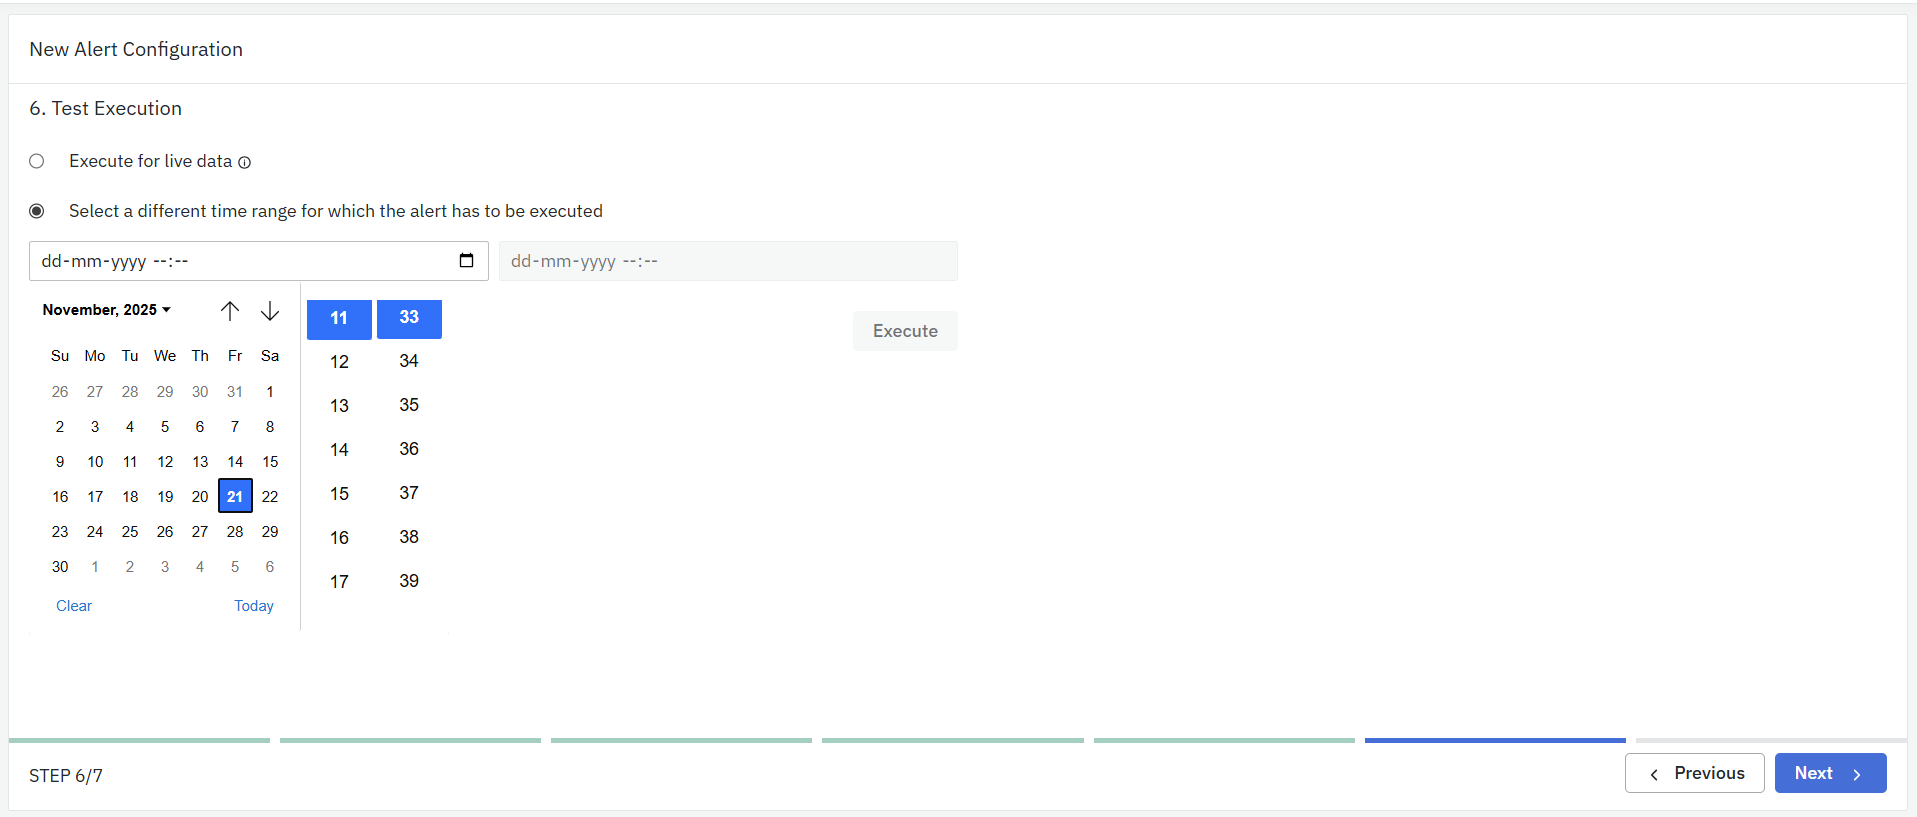
- Choose this option to test the alert configuration for a custom time range instead of using live data.
2. Use the date and time pickers to specify a start and end time.
3. The alert will be evaluated based on data available within the selected period.
Ensure that the start time precedes both the end time and the current time, as shown in the validation message in the screenshot.
Executing the Test
- After selecting the desired option and time range, click Execute to run the alert test.
- The system will process the alert rule and generate results based on the selected data range, helping you verify whether the alert triggers as expected.
Alert rules executed from this test step are for validation purposes only. Alerts generated during test execution do not appear in the Alert Console and do not create active alerts.
Step 7. Enable Alert
This is the final step in creating the alert configuration. Here, you decide whether the alert rule should be activated immediately after creation.

Enable Alert
- Use the toggle to turn the alert ON or OFF.
- When enabled, the system will start evaluating this alert according to the execution frequency defined in the previous steps.
- When disabled, the alert configuration is saved but will not run until you enable it later.
- In addition to configuring alerts, users can enable or disable alerts directly from the Alert listing page for quick control.
This gives you the flexibility to create alert rules in advance and activate them whenever you are ready. After setting the toggle, click Finish to complete the alert setup.
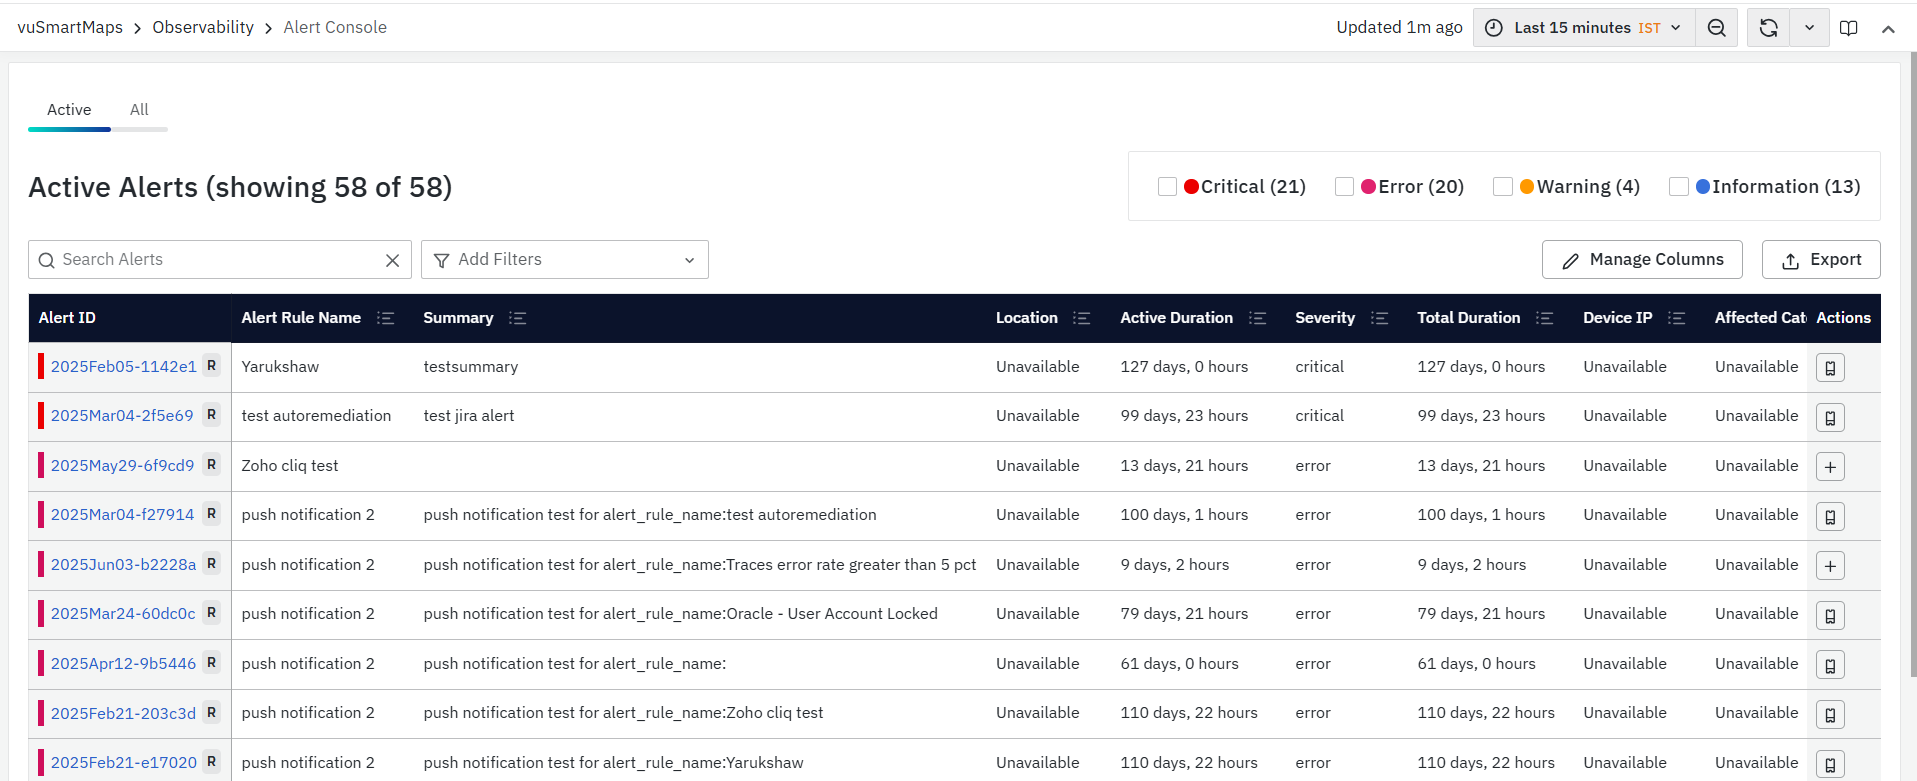
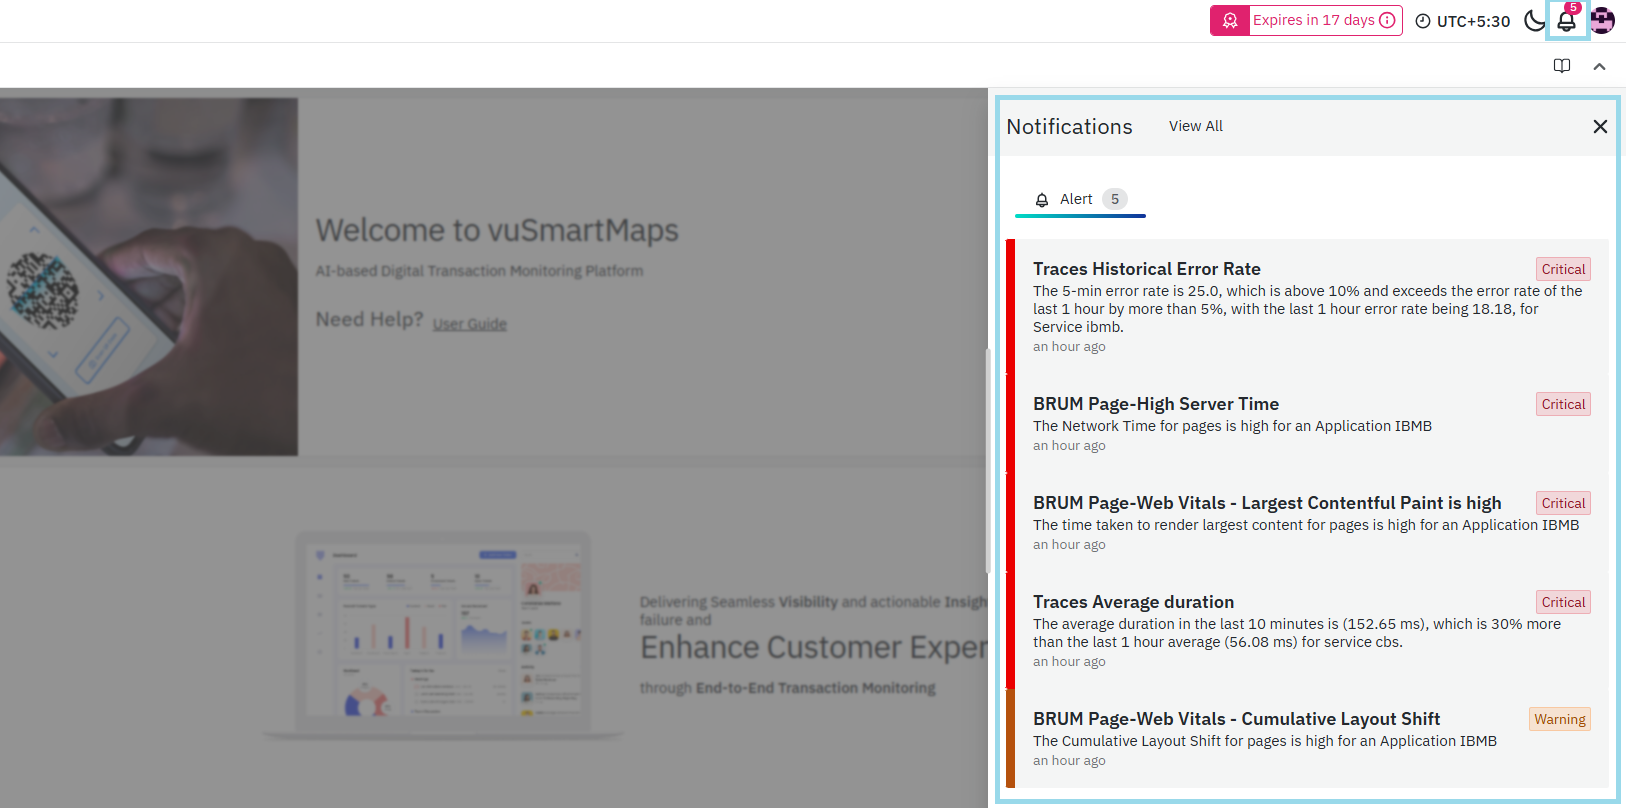
View Generated Alerts
You can view notifications generated by vuSmartMaps through the user interface in three different ways.
1. Bell button notification area
You'll find this bell-shaped notification icon in the top right corner of all vuSmartMaps pages. It shows recently generated notifications when you're logged in. New notifications are indicated by a red notification count on the bell button. It always shows the most recent 5 alerts and once you open the notification by clicking the bell icon, you can go to Alert Console to check the specific alert or all alerts.
2. Alert Console
Click the Bell Notification button, and then select View All at the top right of the page. In the Alert Console, you'll find a list of notifications generated by the system, with detailed information about each event, including associated metrics and historical data.
Additionally, the Alert Console can be accessed by navigating from the left navigation menu (Observability > Alert Console).