Data Explorer
Introduction
Data Explorer on the vuSmarMaps platform empowers users to explore, analyze, and visualize logs and data across applications, including those from various banking systems. Previously known as Log Analytics, this module has been enhanced to support all types of tables, not just log data. With its intuitive interface and advanced querying capabilities, Data Explorer allows users to efficiently retrieve data, identify trends, and gain actionable insights from vast volumes of information.
Data Explorer now supports three distinct table types:
- Log tables: Traditional log data with full analytics capabilities
- Data tables with timestamp column: Structured data with time-based analysis
- Data tables without a timestamp column: Static datasets for general analysis
The module optimizes data ingestion by focusing on relevant information and leveraging data compression to primarily reduce storage costs. Additionally, it provides the flexibility to drop data by context streams, further reducing costs and enhancing system performance. Compatible with S3 API-based object storage, Data Explorer also supports flexible object storage with the option to retrieve data on demand, ensuring that users can access historical information whenever needed. Role-based access control (RBAC) ensures secure access, allowing only authorized users to view sensitive logs at both the dashboard and Data Explorer module levels. Data masking further enhances data privacy and compliance by concealing sensitive information in logs (refer to this section for more details on data masking).
To streamline querying, Data Explorer features Vunet Query Language (VQL), enabling users to build complex queries quickly and conduct precise, effective searches. This combination of features allows for rapid root cause analysis (RCA) within seconds, driving faster issue resolution and minimizing downtime.
From interactive visualizations to powerful search and filtering options, Data Explorer on vuSmarMaps provides a robust solution for streamlined data management, empowering teams to make informed, data-driven decisions with ease.
Getting Started
Accessing Data Explorer
- The Data Explorer page can be accessed from the platform's left navigation menu by navigating to Observability Hub -> Data Explorer.
- When you click on Data Explorer, you will be directed to the following landing page.
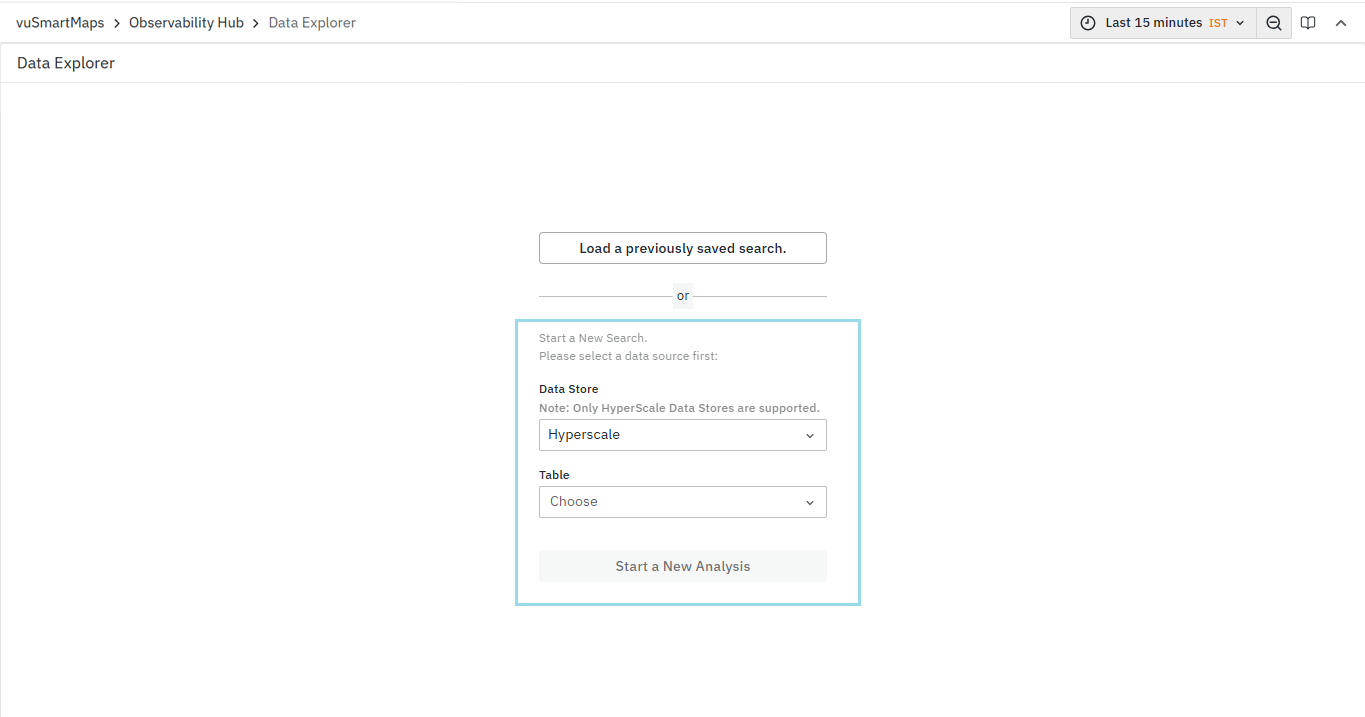
Table Types Overview
Data Explorer accommodates three distinct table categories, each tailored to specific data analysis scenarios:
- Log Tables
These tables preserve traditional log analytics capabilities, including comprehensive filtering on designated columns, time-based trend visualization, and access to contextual log entries via the Surrounding Logs feature. An Actions column provides additional row-level operations.
- Data Tables with Timestamp Column
Designed for datasets containing time information, these tables enable filtering across all columns, not just predefined fields. Every column supports a Top 5 Values summary. By default, the timestamp column appears first, with remaining columns sorted alphabetically. Instead of an Actions column, each row features a View Details button in the first column, which opens a drawer displaying the complete record. Time filtering and the Live Data toggle remain enabled for up-to-the-moment insights.
- Data Tables without Timestamp Column
Data Tables without a Timestamp Column focus exclusively on static data, so time filters, the Live Data toggle, and trend charts are disabled. You retain the ability to filter on any field and instantly see the Top 5 values for each column, which are presented alphabetically. Each row includes a View Details button in the first column; clicking it opens a drawer with the full record, allowing in-depth inspection of any entry.
User Interface Overview
At the landing page of Data Explorer, you have the provision to select the Data Store and Table to start the new analysis. Hyperscale is selected as the default data store.
-
Data Store allows you to choose the particular Data Store.
-
Table option allows you to choose from where you want to fetch the data.
Previously, all tables in the selected Data Store were listed on the Data Explorer page. Now, only the tables a given user has access to are displayed. For more details, refer to the User & Roles Guide.
The Data Stores are database connection instances configured in the data modeling workspace. Each Data Store defines a separate connection to a database instance, either internal or external, using which data analysis can be done. VuNet’s HyperScale database instances are the only types of Data Stores supported for data exploration. The default internal HyperScale Data Store instance will be available in all systems for use in Data Explorer.
Once the Data Store and Table are selected, the Data Explorer module provides a listing of matching data for the time selected, without any other filters.
To ensure the table appears in the Data Explorer table listing, it must contain the following fields: timestamp, message, log_uuid, and message_lower.
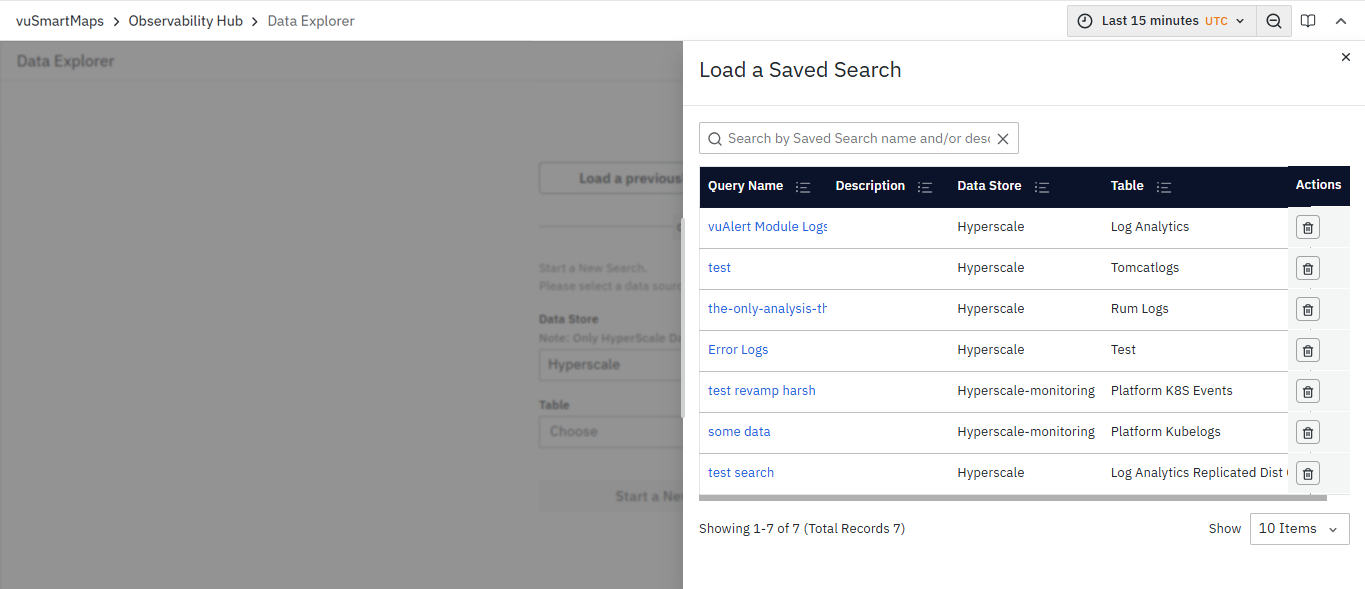
- Conversely, you have an option to load the previously saved search.
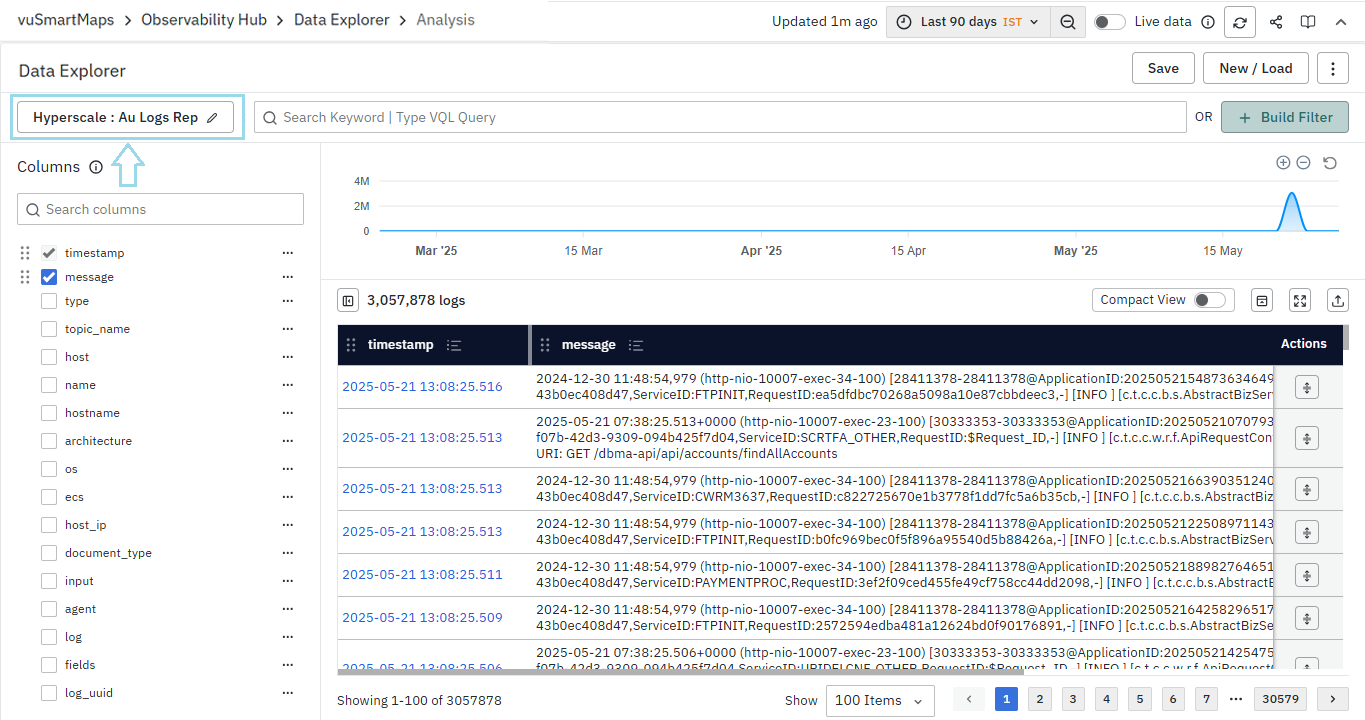
- Once the Data Store and Table are selected you will be landed on the following page.
- If you want to change the selected data store and table, click on the currently selected data store at the top left.
- You will be redirected to the page where you selected the Data Store and Table. Now, make the desired selections and click the Start a New Analysis button.
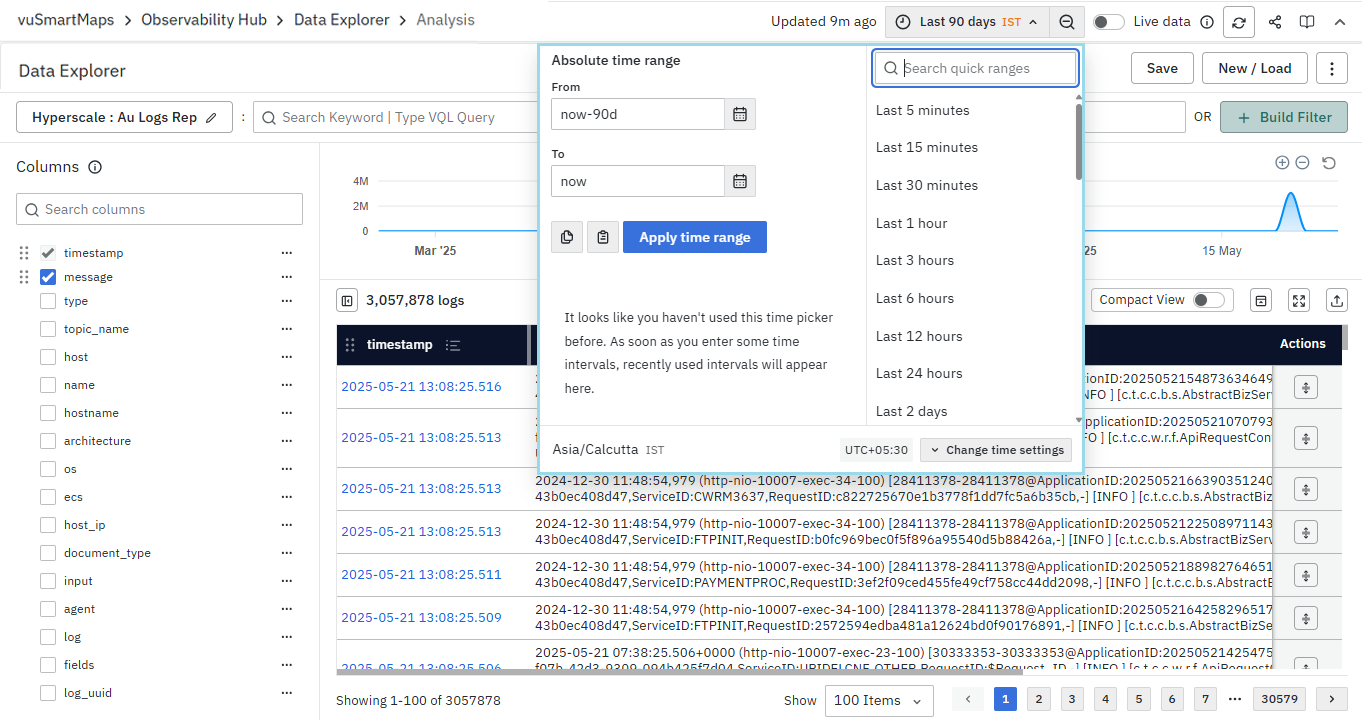
- At the top right corner, you’ll find the global time selector (available for tables with timestamp columns), allowing you to gain insight into data at a specific time range selected. Once a search is performed, a timestamp appears, such as "Updated 1m ago," to indicate when the data was last refreshed.
- Besides the time filter, there's a Live data toggle button that, when enabled, provides the user with the real-time display of the most recent 500 records from the last five minutes, automatically refreshing every 10 seconds. This feature is only available for tables with timestamp columns.
- The refresh button beside the Live data toggle enables data refresh.
- A Share button is also available, allowing you to generate a direct link to share both saved searches and the current search query, and the User Guide tab redirects you to the Data Explorer User Guide.
Below are the action buttons, each serving a specific purpose:
- Save: Clicking the button opens a context menu with two options. For new search, the Save option is disabled; you need to use ‘Save as’. For a saved search, use ‘Save’. In an already saved search, ‘Save As’ functions like a clone.
- New/Load: This button allows you to initiate a new search or access previously saved searches.
- More Actions: Here, users can grant permissions on saved searches.
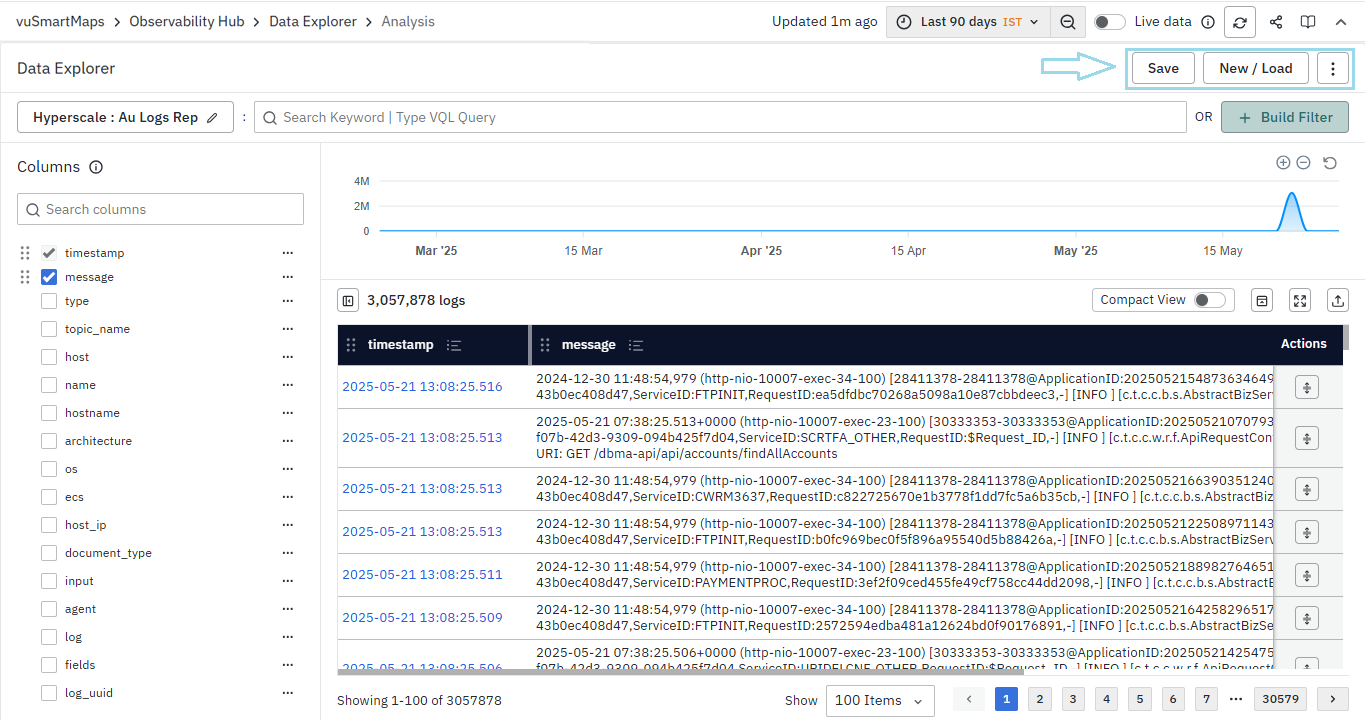
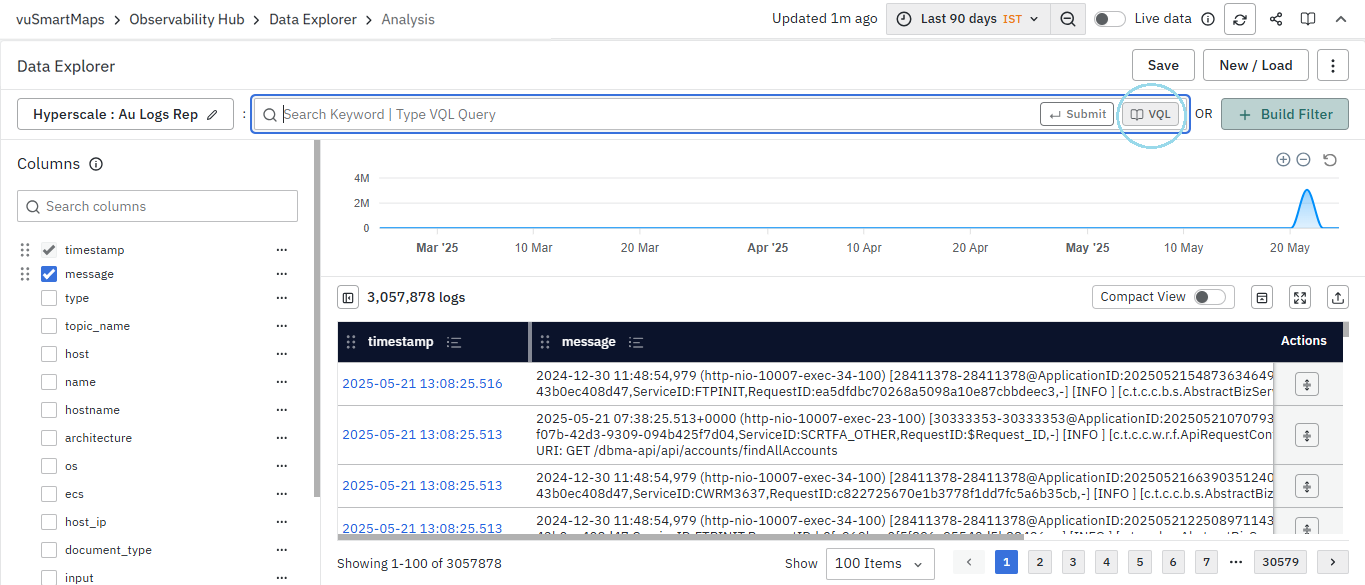
- The search query field allows you to input VQL-based text queries to retrieve specific records from the Table.
- Clicking the VQL button on the search bar opens the VQL help section documentation in a new tab.

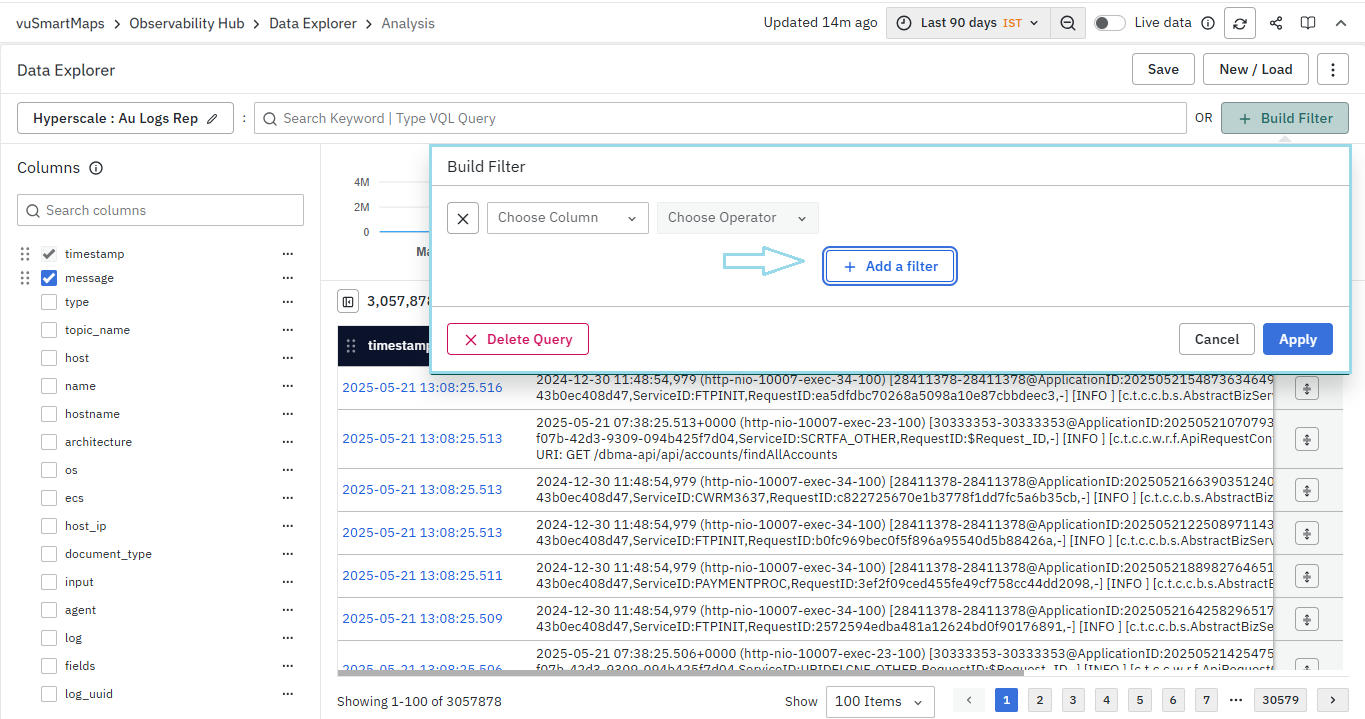
- The Build Filter option located next to the search box allows you to add filters. By clicking 'Add Filter,' you can select columns and operators to filter out specific logs in the table.
- The Columns option on the left enables you to choose which columns are displayed in the Table. For data tables, the first four columns (alphabetically) are selected by default as visible columns.
Column options may vary depending on the Data Store and selected Table. A maximum of twenty-five columns can be selected at a time.

On the right-hand side, the area chart and log table are displayed based on the selected Data Store, Table, and time range. This enables you to visualize trends and analyze log data precisely tailored to the chosen parameters, enhancing the effectiveness of the data exploration and analysis within the platform.
For further details on how to effectively analyze and visualize log data, refer to the Exploring Log Data page.
FAQs
How can I quickly search for logs containing specific keywords?
To search for logs with specific keywords:
- Use the search query field on the Log Analytics page.
- Enter your keywords to display matching logs.
- For advanced searches (case-sensitive, composite queries), refer to the Using Text Queries section.
How do I save my search queries for future use?
To save a search query:
- Click on More Actions.
- Select Save and provide a name and description.
- Access saved searches by clicking Open.
For step-by-step instructions, refer to the Saving and Reusing a Search section.
How can I identify logs that do not contain a specific keyword?
Use the negate operator (~) to exclude specific keywords.
- Example:
~Errorfinds logs not containing "Error".
Refer to the Negate the Operation section for more details.
Can I control access permissions for saved searches?
Yes, you can assign access permissions to different user roles.
- Navigate to More Actions > Permissions while saving a search.
- Control who can view or modify saved searches.
Detailed instructions are available in the Access Permissions of Saved Search section.
How can I perform complex log searches using multiple conditions?
Construct complex queries using logical operators AND, OR, and field conditions.
- Example:
error + Serverfinds logs containing both "Error" and "Server".
Refer to the Searching Multiple Keywords section for more examples.
How does the customization of columns in Log Analytics enhance data analysis?
Customizing columns allows users to:
- Focus on relevant data points.
- Identify trends and anomalies more easily.
- Conduct precise and meaningful analyses.
