vuSmartMaps Mobile App
Overview
The vuSmartMaps Mobile App allows users to access vuSmartMaps dashboards, visualizations, insights, alerts, and profile details from a mobile device. It helps users check their environments quickly and in real time while they are away from the web console. The mobile app supports Android and iOS devices. Users can log in using the vuSmartMaps server address, username, and password. After login, users can view configured mobile dashboards under Storyboards, review alerts under Alerts, and access user details from Profile.
The mobile app is mainly used for viewing and monitoring. Storyboards and mobile dashboards are configured from the vuSmartMaps web console. The mobile app displays those configured dashboards and allows users to interact with the available visualizations.
Why This Feature Is Useful
In banking and payment operations, users may need to check critical system health, alerts, and business metrics while they are away from their workstation. The vuSmartMaps Mobile App is useful because it helps teams:
- Monitor dashboards on a mobile device.
- View KPIs, tables, charts, insights, and trend charts.
- Receive proactive alert notifications.
- Check alerts in a centralized mobile alert section.
- Review dashboard and alert data for a selected time range.
- Access profile details and log out of the app.
- Configure log levels to help diagnose mobile app issues.
This is useful for operations teams, monitoring teams, and support engineers who need quick access to platform information while on the move.
Example Scenario
A payment operations engineer receives a critical alert related to a payment journey while away from the monitoring desk. The engineer opens the vuSmartMaps Mobile App, logs in, and checks the Alerts section. The critical alert is highlighted using color coding. The engineer taps the alert to view its details. The engineer can then use the related mobile Storyboard to review KPIs, tables, charts, and trend information for the selected time range.If the mobile app has an issue during this process, the engineer can go to Profile > Debug Settings > Log Level and set the required log level. The generated log file can then be shared for debugging, if requested.
When to Use This Feature
Use the vuSmartMaps Mobile App when:
- Dashboard data must be checked from a mobile device.
- Users need to monitor environments in real time while away from the web console.
- Users need to view mobile Storyboards.
- Users need to check KPIs, insights, tables, and trend charts.
- Users need to review alerts and alert details.
- Users need to receive alert notifications on mobile.
- Users need to change the dashboard or alert time range.
- Users need to access profile details.
- Users need to log out of the mobile app.
- Support teams request mobile app logs for troubleshooting.

Comprehensive Understanding
The vuSmartMaps Mobile App allows users to access configured mobile dashboards, alerts, profile details, time selection, and debugging options from a mobile device. The mobile app includes the following main areas:
- Accessing the App
- Login Page
- Main App Sections
- Storyboards
- Time Selector
- Alerts
- Profile
- Log Level
Accessing the App
The vuSmartMaps Mobile App is available for Android and iOS devices. The source document provides download links for Google Play and the Apple App Store.
Android app download link:
https://play.google.com/store/apps/details?id=io.vunet
iOS app download link:
https://apps.apple.com/app/vusmartmaps/id1570764953
https://apps.apple.com/app/vusmartmaps/id1570764953
Login Page
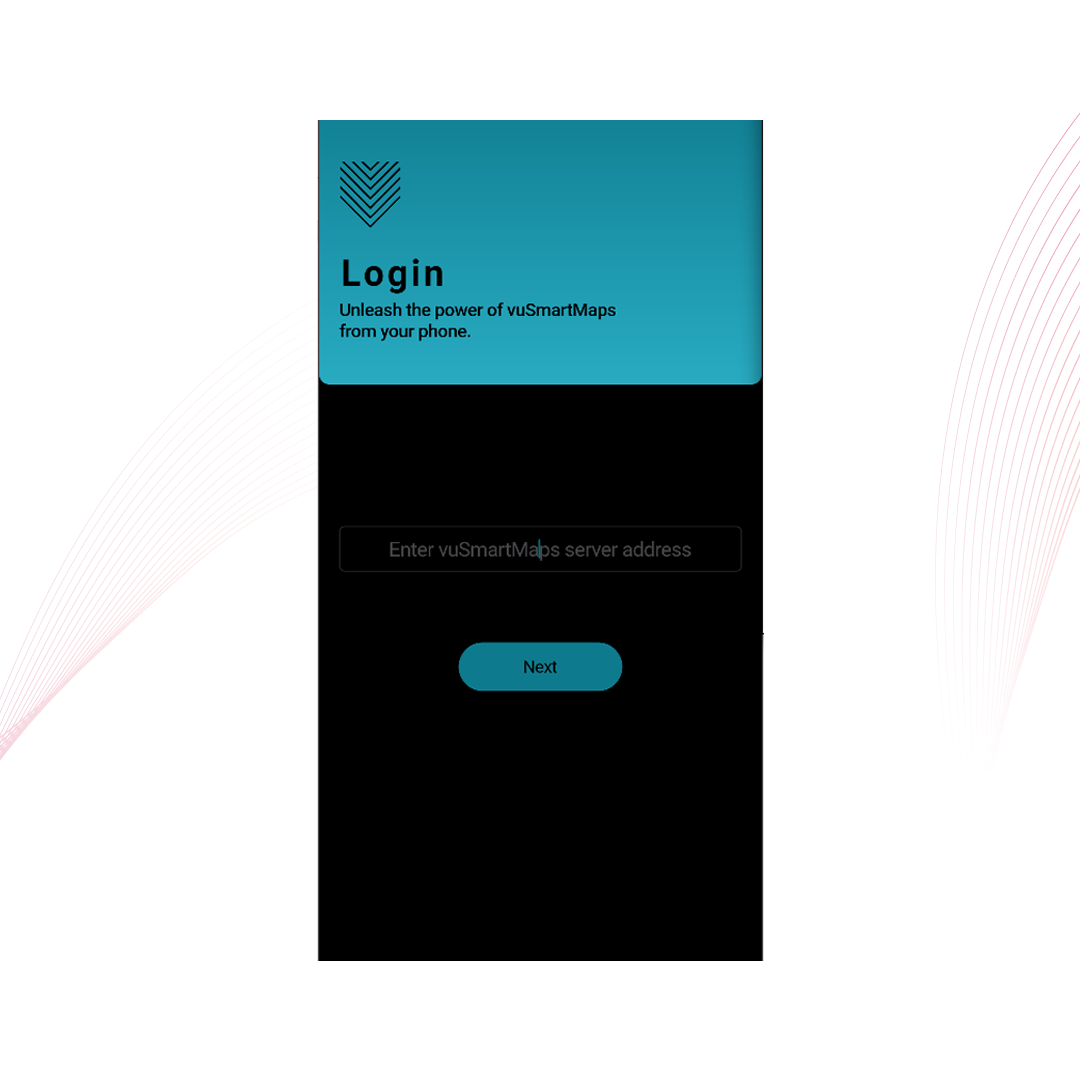
After installing and opening the app, the login flow starts. The first login screen asks for the vuSmartMaps server address. After entering the server address, users tap Next.
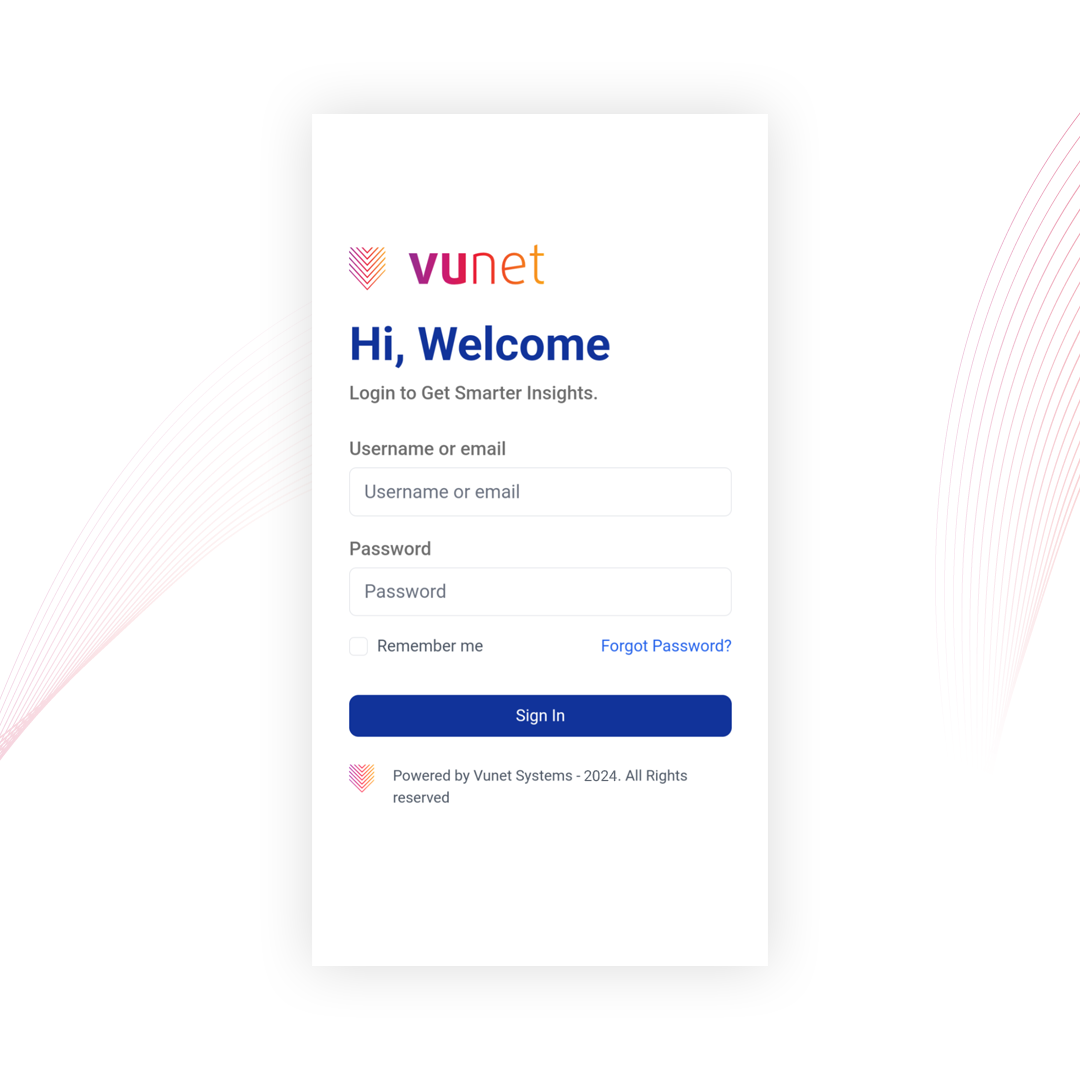
The next login screen asks for:
- Username
- Password
Users tap Sign in to access the mobile app.
Main App Sections
The vuSmartMaps Mobile App has three main sections:
- Storyboards
- Alerts
- Profile
These sections are available from the bottom navigation area of the mobile app.
Storyboards
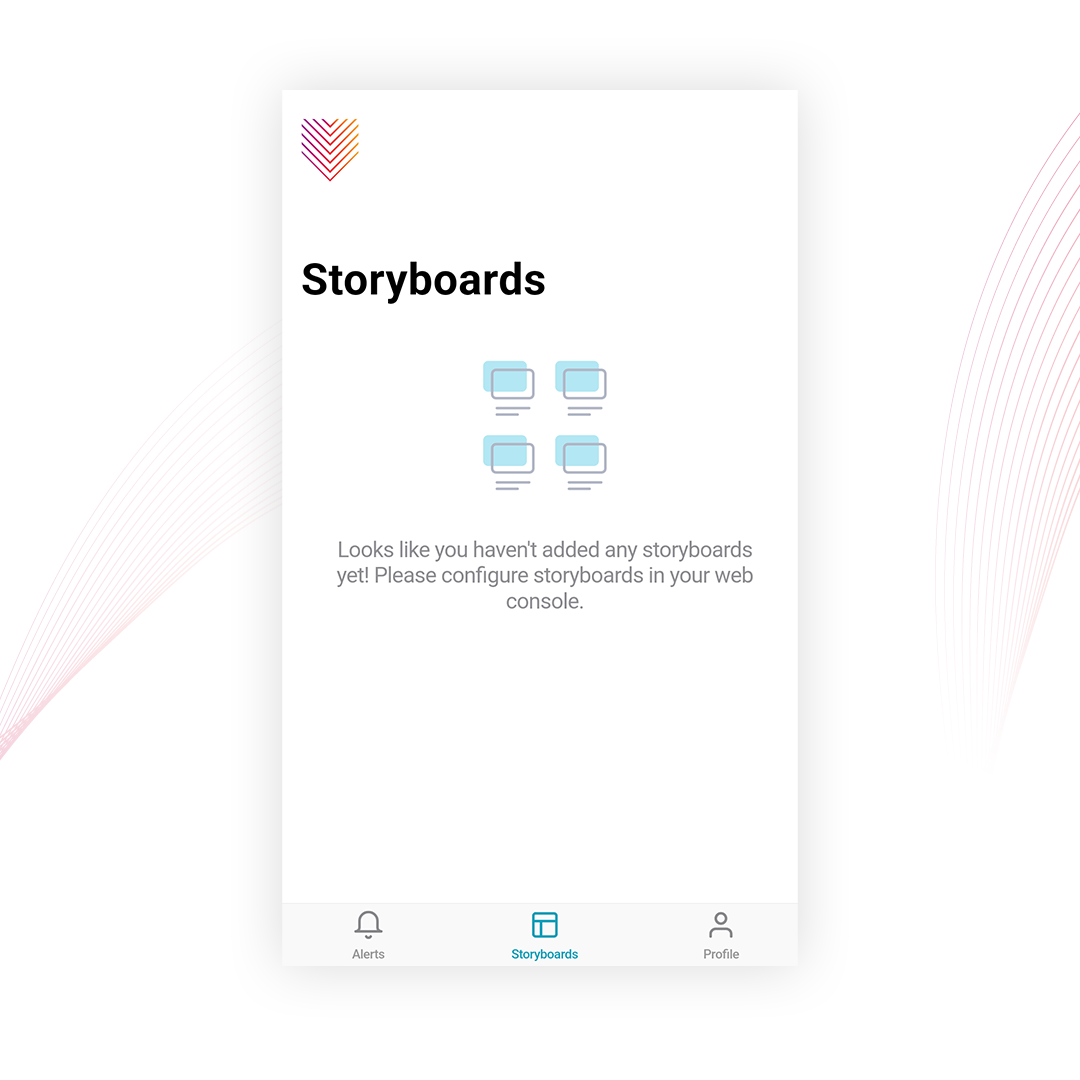
The Storyboards section displays mobile dashboards and insights. Storyboards and dashboards are created and configured in the vuSmartMaps web console. The mobile app is used only to visualize them.The source document states that mobile dashboards are configured differently from web dashboards. It refers users to Mobile Dashboard Configurations for more details. After mobile dashboards are created and permissions are assigned to specific users or user roles, the app homepage displays the main Storyboard. Users can browse Storyboards to get more insights. When users tap a KPI or visualization, it expands to show a more detailed view.
Time Selector

The Time Selector controls the time range for dashboard and alert data.
It appears:
- At the bottom of each dashboard screen.
- On the Alerts screen.
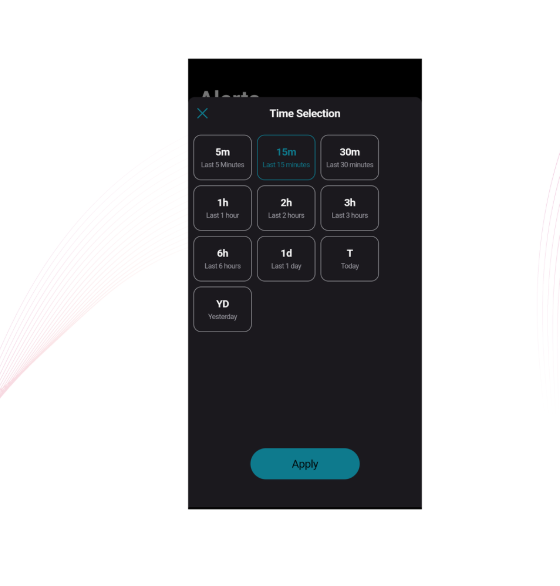
When users tap the time selector bar, a pop-up appears with a list of time ranges. After selecting and applying a time range, dashboard and alert screens retrieve data only for that selected time range.
Alerts
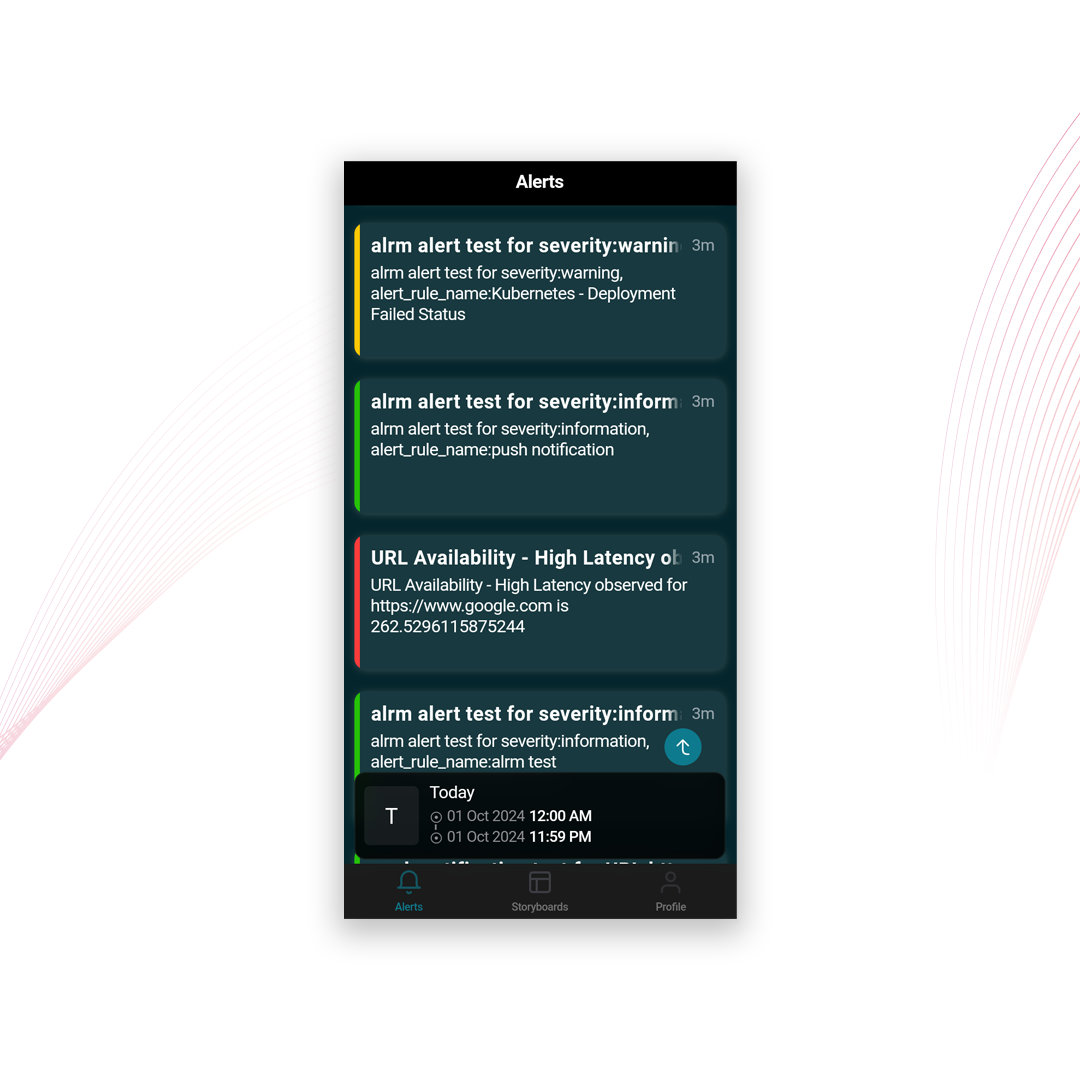
The Alerts section acts as a centralized hub for alerts and notifications.Alerts are color-coded. For example, a critical condition, such as a value exceeding its normal range, is highlighted in red to show severity. Users can tap an alert to view related details. All generated alerts within the selected time range are listed in this section. The source document also states that push notifications can be enabled for specific alerts in the vuSmartMaps Mobile App. Without push notifications, users must manually check the Alerts section. Notifications can be received when the app is closed, in the background, or in the foreground.
Profile
The Profile section allows users to view their profile details in the vuSmartMaps Mobile App. Users can also tap Logout to log out of the app.
Log Level
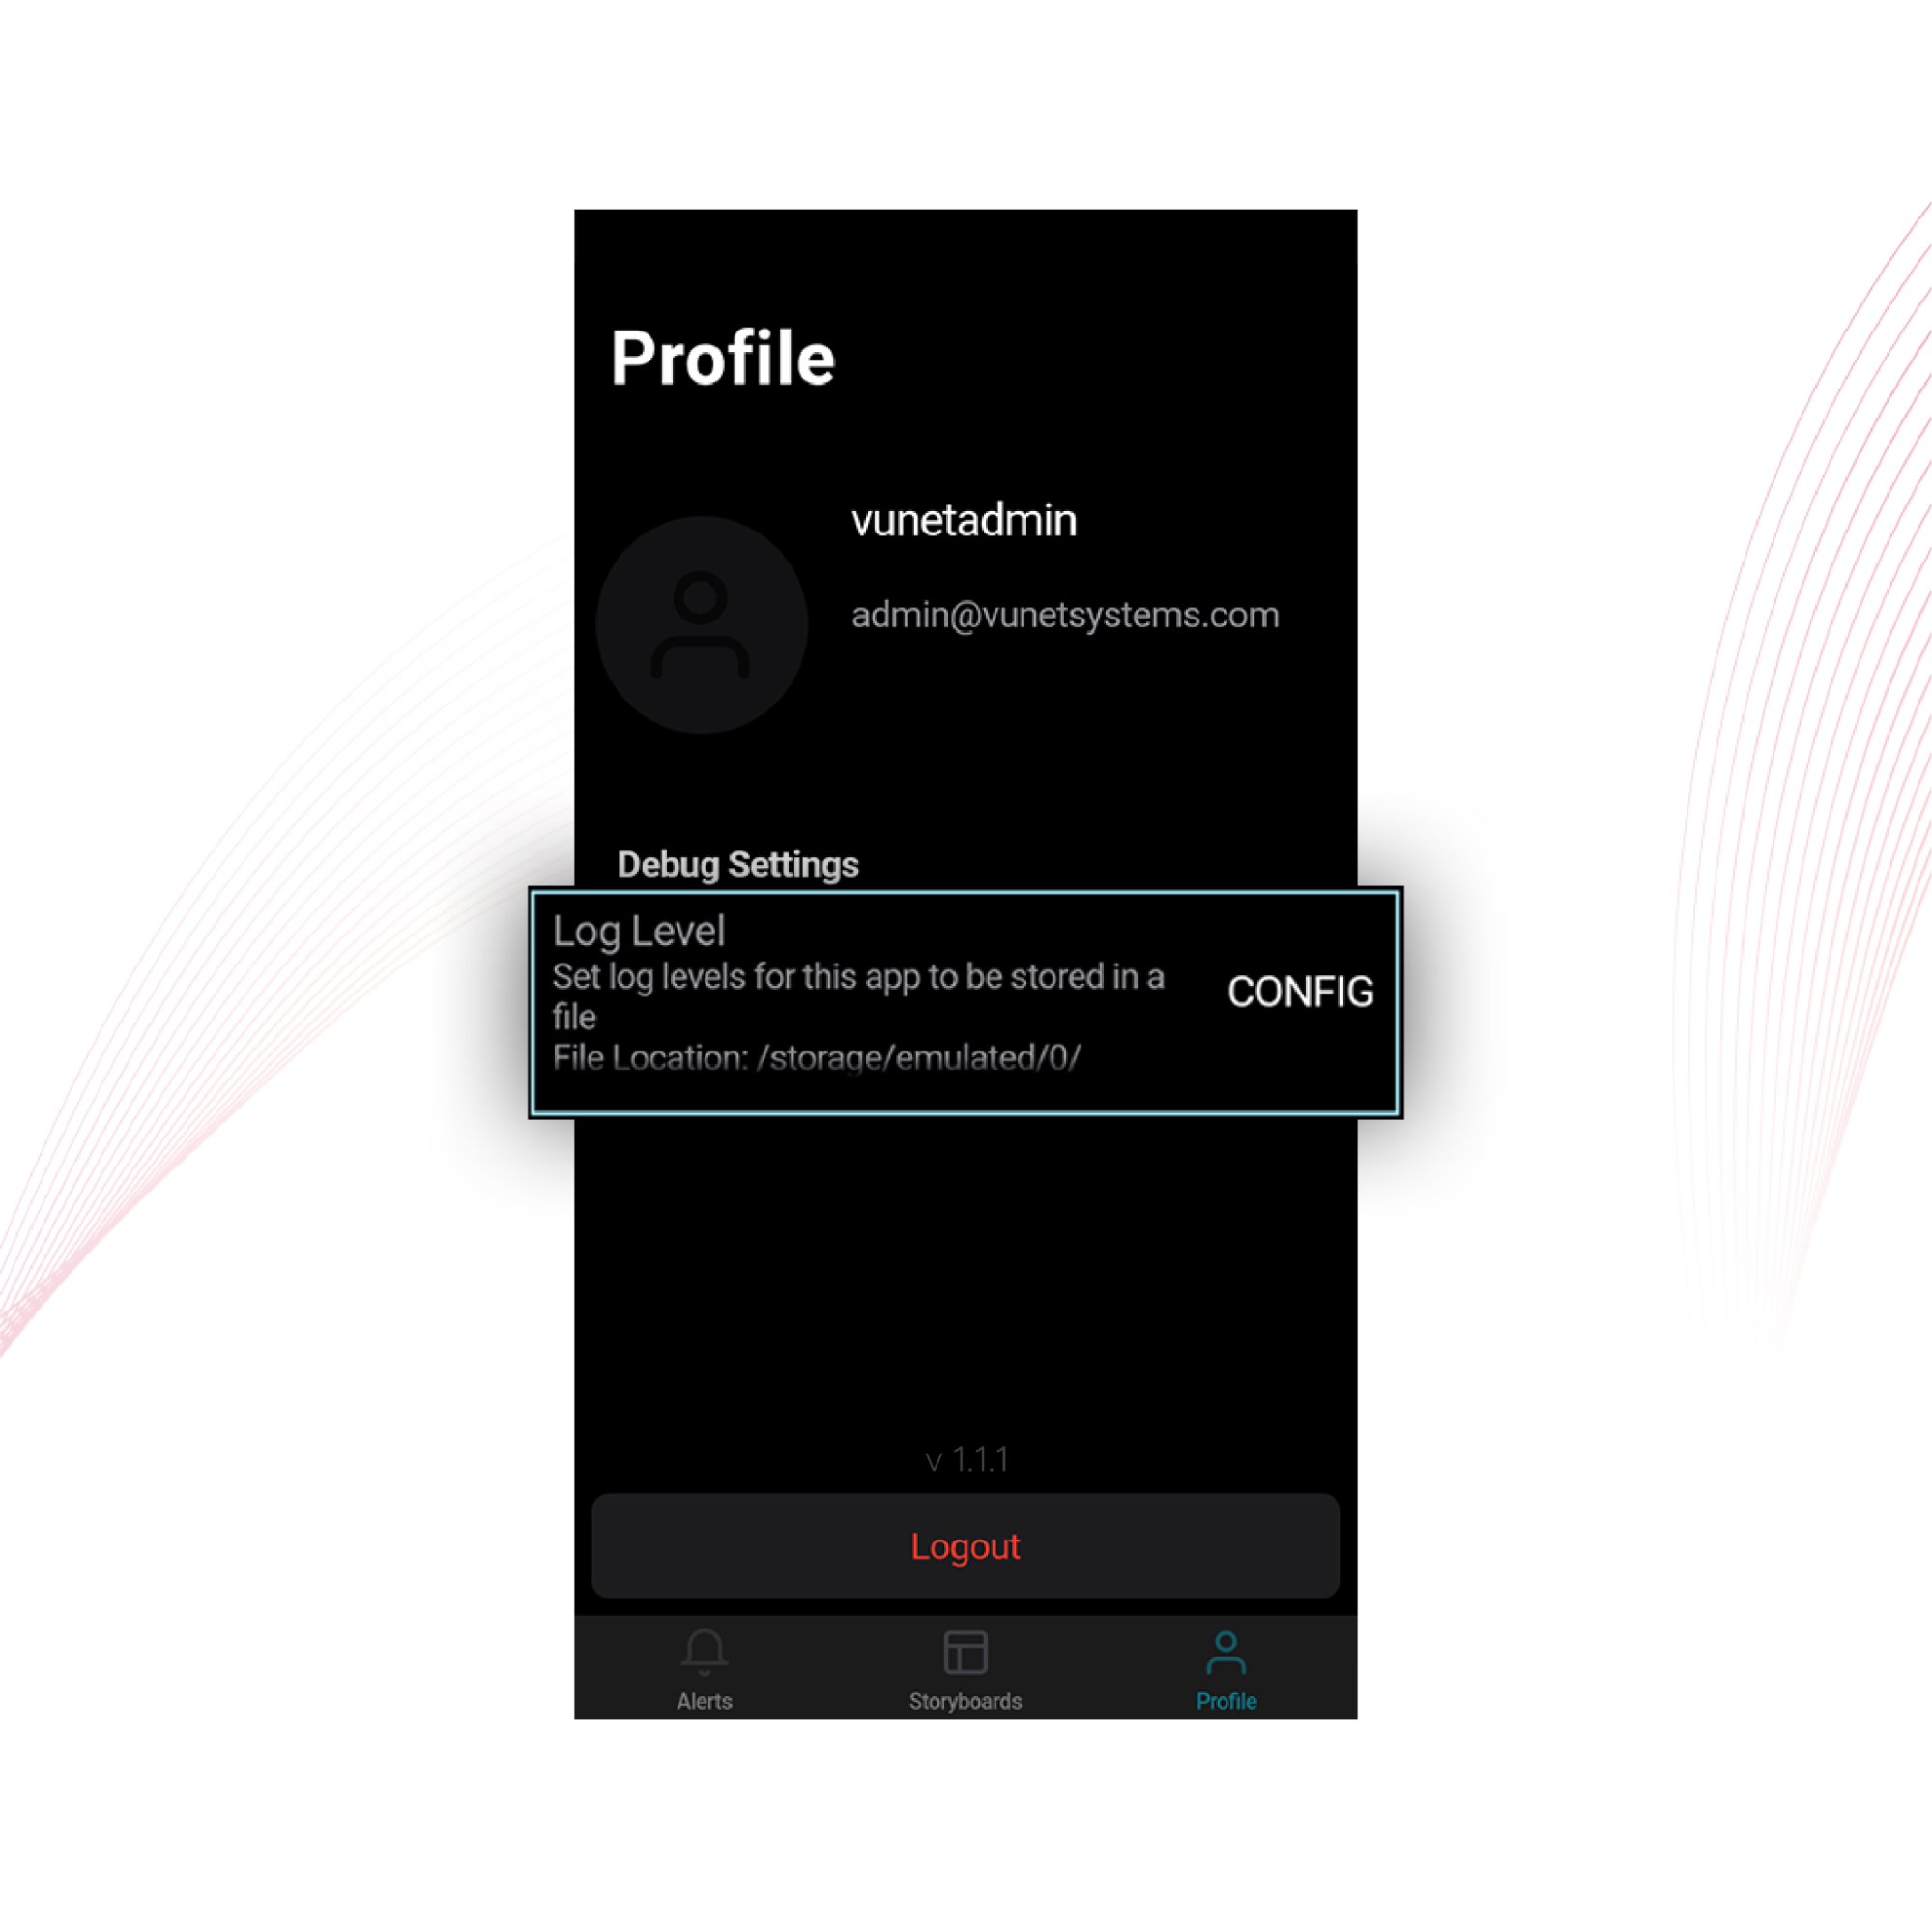
The Log Level option is available under Profile > Debug Settings. It controls the level of mobile application logs stored in the log file. By default, the log level is set to CONFIG. These logs are used for debugging mobile app issues. If a user faces a problem in the app, they may be asked to share the log file.
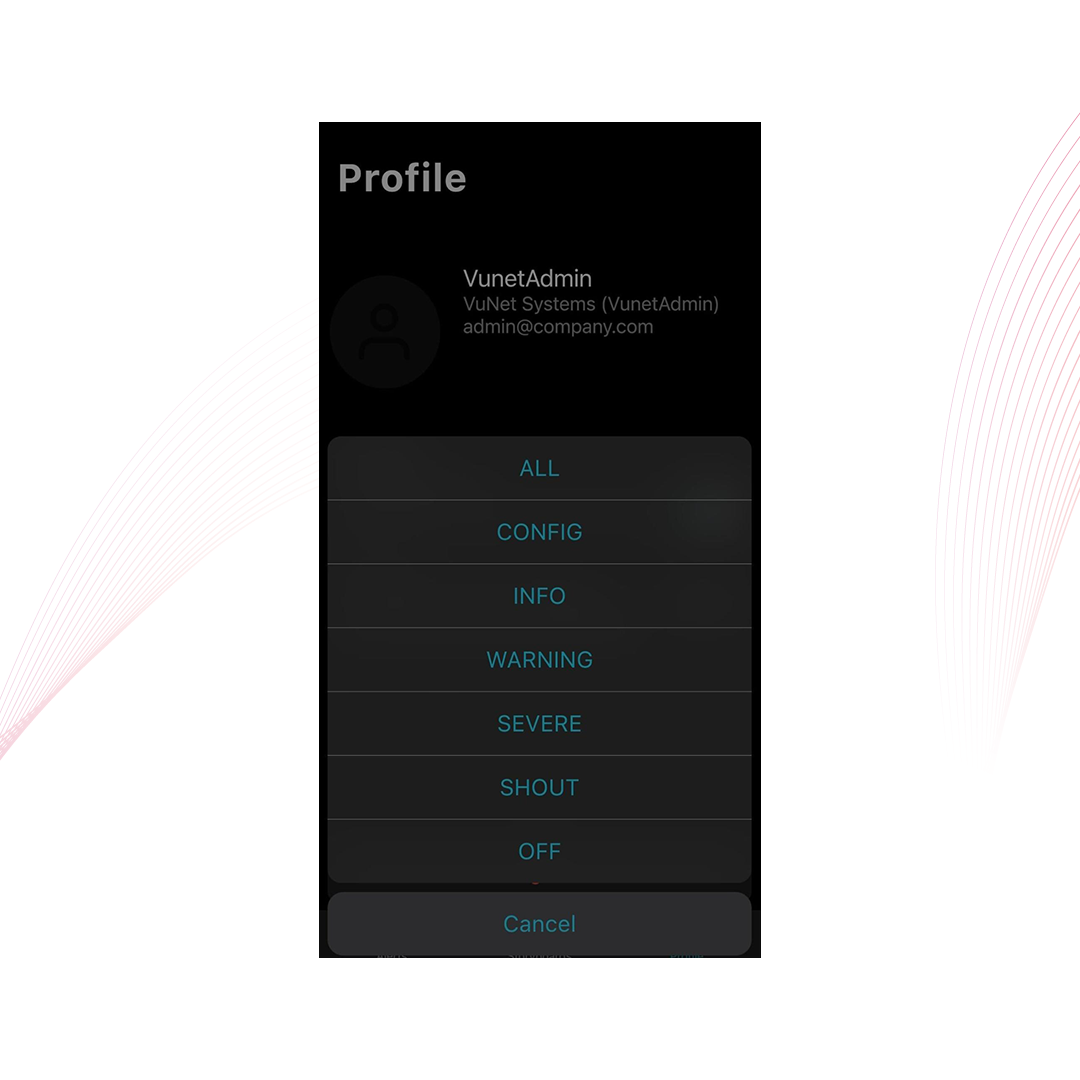
Available log level options are:
- ALL
- CONFIG
- INFO
- WARNING
- SEVERE
- SHOUT
- OFF
Step-by-Step Instructions
Download the Mobile App
- Open the Google Play Store or Apple App Store.
- Search for vuSmartMaps.
- Download and install the app.
- Open the app after installation.
The source document provides separate download links for Android and iOS devices.
Log In to the App
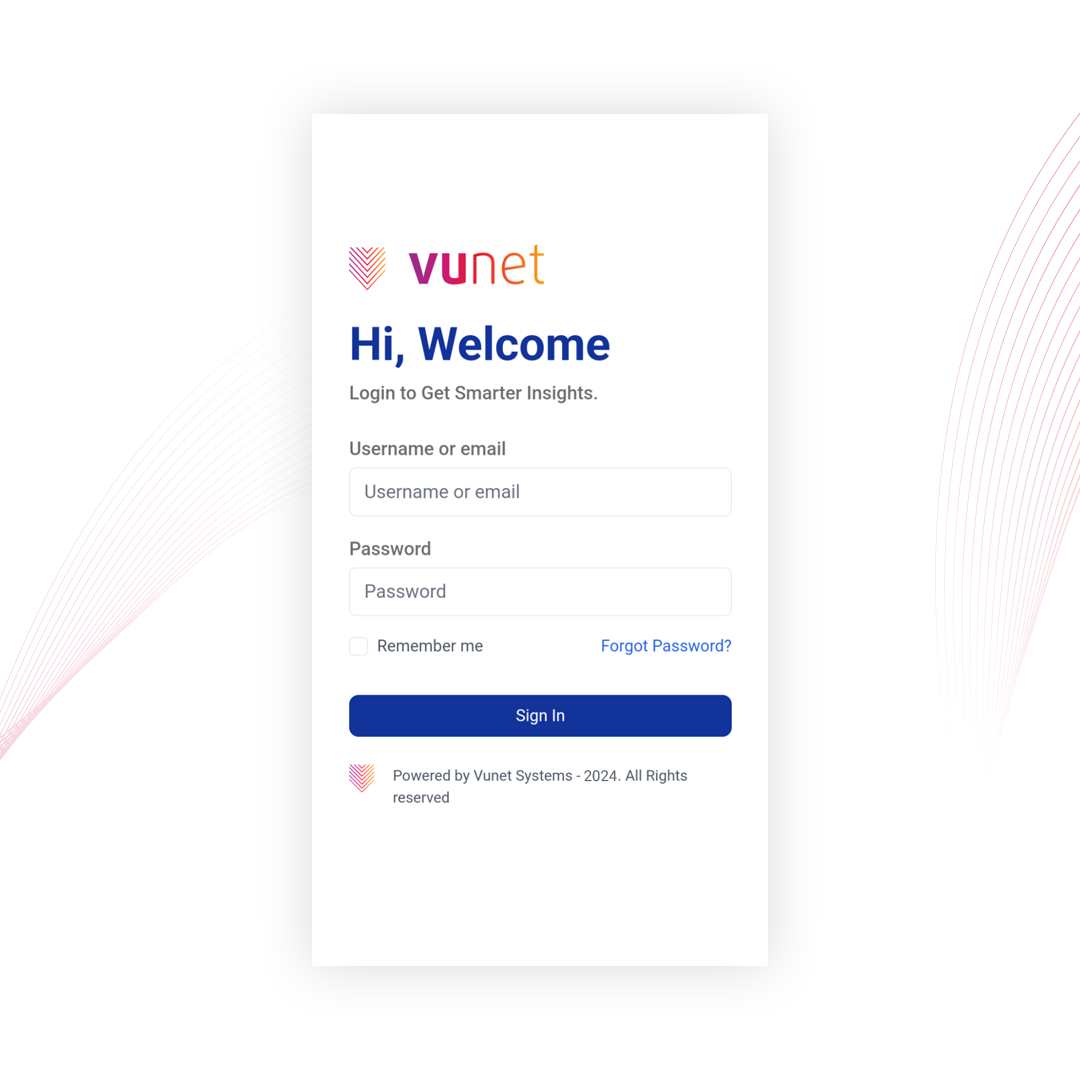
- Open the vuSmartMaps Mobile App.
- On the login page, enter the vuSmartMaps server address.
- Tap Next.
- Enter the Username.
- Enter the Password.
- Tap Sign in.
- The main vuSmartMaps Mobile App screen opens.
Use the Main App Sections
- After login, view the main app screen.
- Use the bottom navigation to open:
- Storyboards
- Alerts
- Profile
- Select the required section based on the task.
View Storyboards
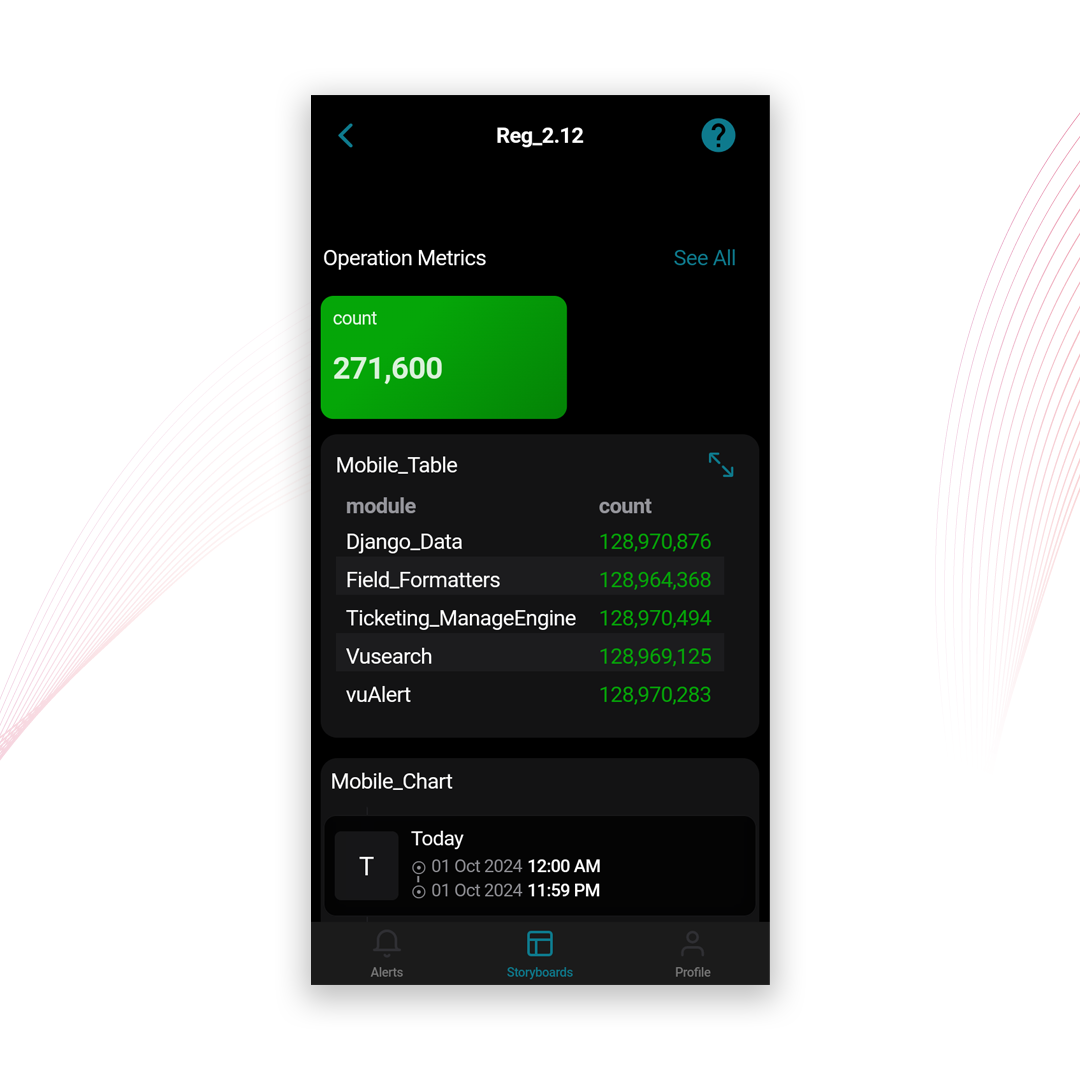
- Open the Storyboards section.
- Browse the available mobile Storyboards.
- Open the required Storyboard.
- Review KPIs, tables, charts, trend charts, and insights.
- Tap a KPI or visualization to expand it.
- Review the detailed view.
Storyboards and mobile dashboards must be created and configured in the web console. The mobile app only displays them.
Configure Mobile Dashboards in the Web Console
The source document states that Storyboards can be configured in the web console. For mobile dashboard configuration:
- Add dashboards in the web version.
- Refer to Mobile Dashboard Configurations.
- Set up permissions for specific users or user roles so they can access mobile dashboards.
The detailed step-by-step process for configuring mobile dashboards in the web console is not included in the source document.
Use the Time Selector
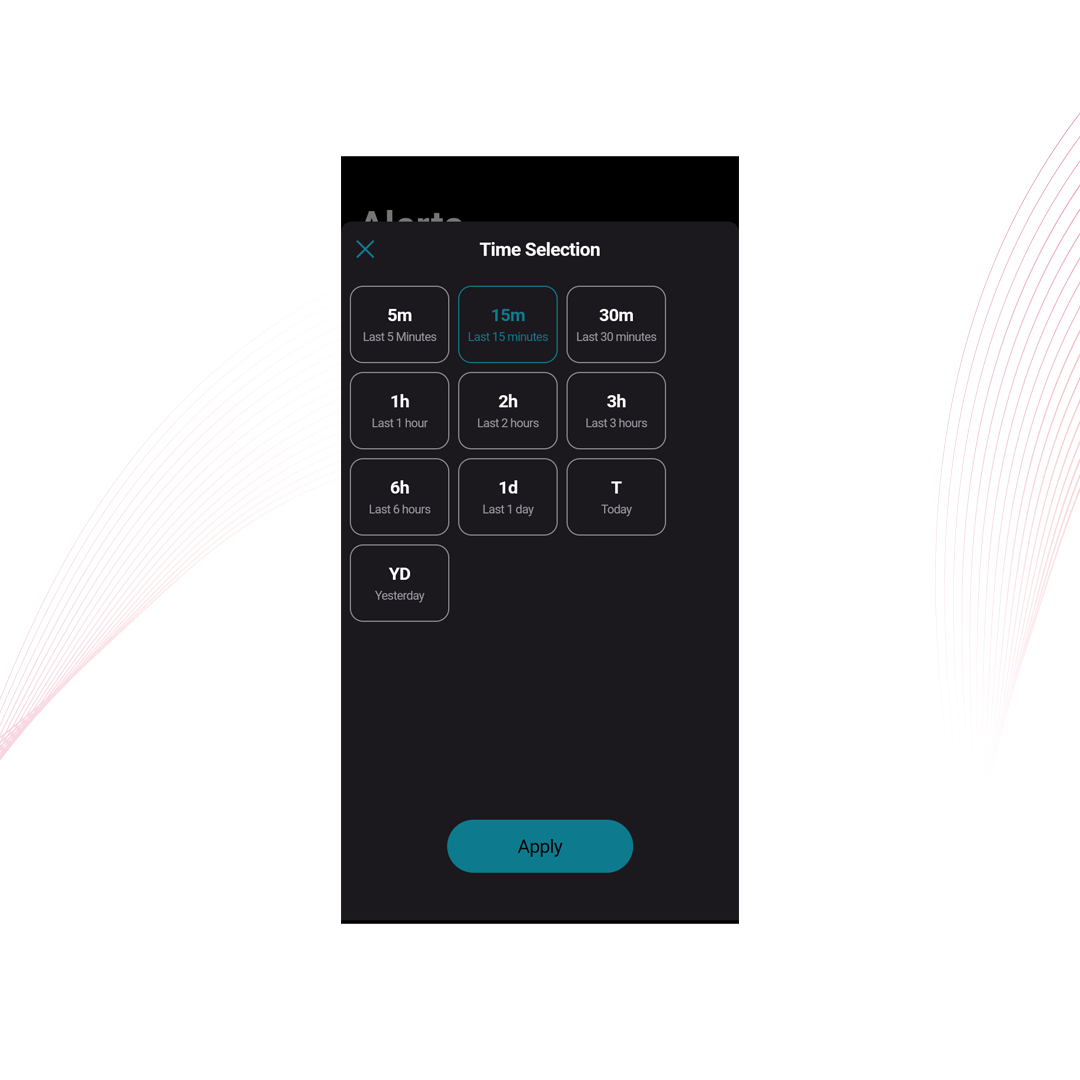
- Open a dashboard screen or the Alerts screen.
- Locate the time selector at the bottom of the screen.
- Tap the time selector bar.
- Select the required time range from the pop-up.
- Tap Apply.
- The dashboard and alert screens reload data for the selected time range.
View Alerts
- Open the Alerts section.
- Review the list of alerts generated within the selected time range.
- Check the alert color to understand severity.
- Tap an alert to view its related details.
- Review the alert information displayed on the details screen.
Use Push Notifications
The source document states that push notifications can be enabled for specific alerts. When enabled, notifications can be received when:
- The app is closed.
- The app is running in the background.
- The app is open in the foreground.
Without push notifications, users must manually check the Alerts section.
The detailed configuration steps for enabling push notifications are not included in the source document.
View Profile Details
- Open the Profile section.
- Review the profile details shown on the screen.
- Use the available options as needed.
Log Out of the App
- Open the Profile section.
- Tap Logout.
- The user is logged out of the mobile app.
Configure Log Level
- Open the Profile section.
- Go to Debug Settings.
- Open Log Level.
- Select the required log level:
- ALL
- CONFIG
- INFO
- WARNING
- SEVERE
- SHOUT
- OFF
- The selected log level controls the level of detail stored in the mobile app log file.
The default log level is CONFIG.
What Happens After the Steps
After installing and logging in, the user can access the main vuSmartMaps Mobile App screen. From there:
- Storyboards display mobile dashboards and insights configured from the web console.
- Alerts display generated alerts for the selected time range.
- Profile displays profile details, debug settings, and logout option.
- The Time Selector controls the data range shown in dashboards and alerts.
- Tapping a KPI or visualization opens a more detailed view.
- Tapping an alert opens related alert details.
- Changing the log level controls the details stored in the mobile app log file.
Tips / Best Practices
- Configure Storyboards and mobile dashboards in the web console before checking them in the mobile app.
- Assign permissions to specific users or user roles so that the required mobile dashboards are visible.
- Use the Time Selector to make sure dashboard and alert data is reviewed for the correct time range.
- Use the Alerts section to review alert details from a mobile device.
- Enable push notifications for alerts that need immediate attention.
- Use color coding in alerts to quickly understand alert severity.
- Tap KPIs or visualizations when a more detailed view is required.
- Use the Profile section to review user details or log out of the app.
- Change Log Level only when debugging is required.
- Use OFF when logging needs to be stopped.
Troubleshooting
-
Issue: No Storyboards are visible in the mobile app.
- Possible Cause: Storyboards or mobile dashboards may not be configured in the web console.
- Solution: Configure Storyboards in the web console and add dashboards in the web version for mobile dashboard configuration.
-
Issue: User cannot access a mobile dashboard.
- Possible Cause: Permissions may not be assigned to the user or user role.
- Solution: After creating mobile dashboards, set up permissions for specific users or user roles.
-
Issue: User needs to troubleshoot a mobile app problem.
- Possible Cause: Mobile app logs may be required for diagnosis.
- Solution: Go to Profile > Debug Settings > Log Level and set the required log level. If requested, share the log file with the support team.
FAQs
What is the vuSmartMaps Mobile App used for?
The vuSmartMaps Mobile App is used to access dashboards, visualizations, insights, and alerts from the VuNet platform on a mobile device. It helps users monitor environments quickly while they are on the move.
Where can I download the vuSmartMaps Mobile App?
The app is available for both Android and iOS devices. It can be downloaded from the Google Play Store and Apple App Store.
What details are required to log in?
Users need to enter the vuSmartMaps server address, then provide their username and password to sign in.
What are the main sections in the mobile app?
The mobile app has three main sections: Storyboards, Alerts, and Profile.
Can I create Storyboards from the mobile app?
No. Storyboards and mobile dashboards are created and configured in the vuSmartMaps web console. The mobile app only displays them.
Why are Storyboards not visible in my mobile app?
Storyboards may not be configured in the web console, or the required permissions may not be assigned to the user or user role.
What is the Time Selector used for?
The Time Selector is used to choose the time range for dashboard and alert data. It is available at the bottom of each dashboard screen and on the Alerts screen.
What does the Alerts section show?
The Alerts section shows generated alerts and notifications for the selected time range. Users can tap any alert to view its details.
Can the mobile app receive push notifications?
Yes. Push notifications can be enabled for specific alerts. Notifications can be received when the app is closed, running in the background, or open in the foreground.
What is Log Level used for?
Log Level controls the level of mobile app logs stored for debugging. The default log level is CONFIG. Available options are ALL, CONFIG, INFO, WARNING, SEVERE, SHOUT, and OFF.
