Exploring Data

- To visualize the data, start by selecting the Data Store and Table you intend to analyze from the dropdown menu, and click on the Start a New Analysis button.
Instead of displaying raw table names on the log analytics pages, the system now displays user-friendly labels for better readability.
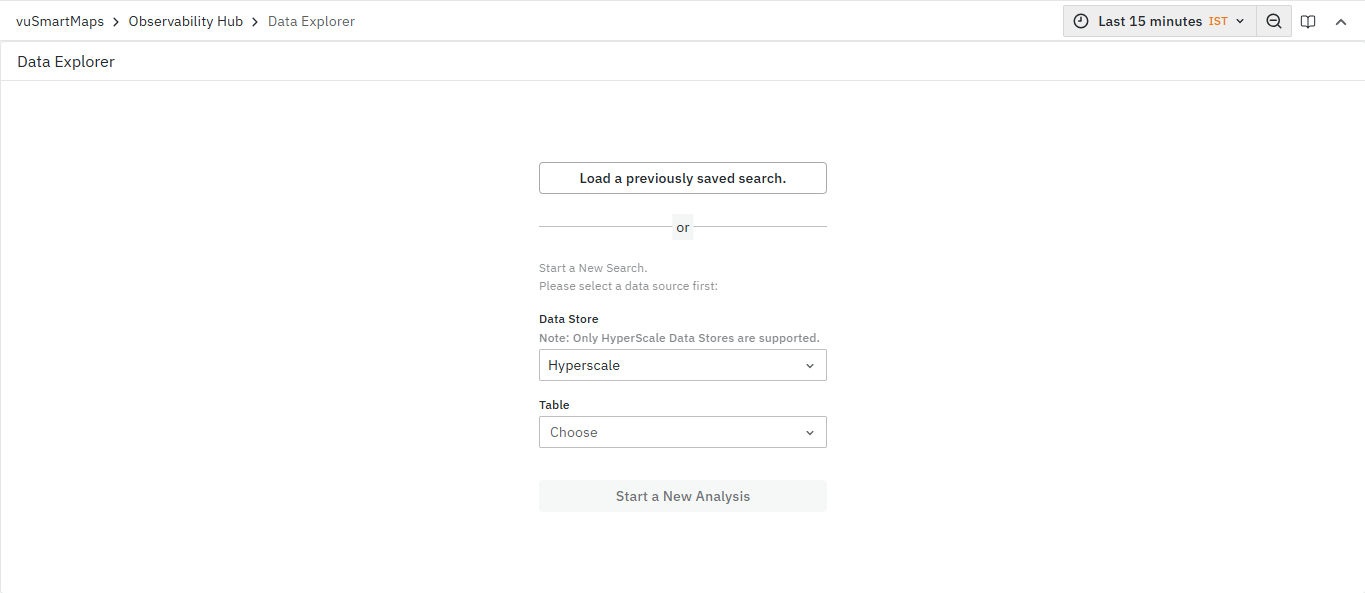
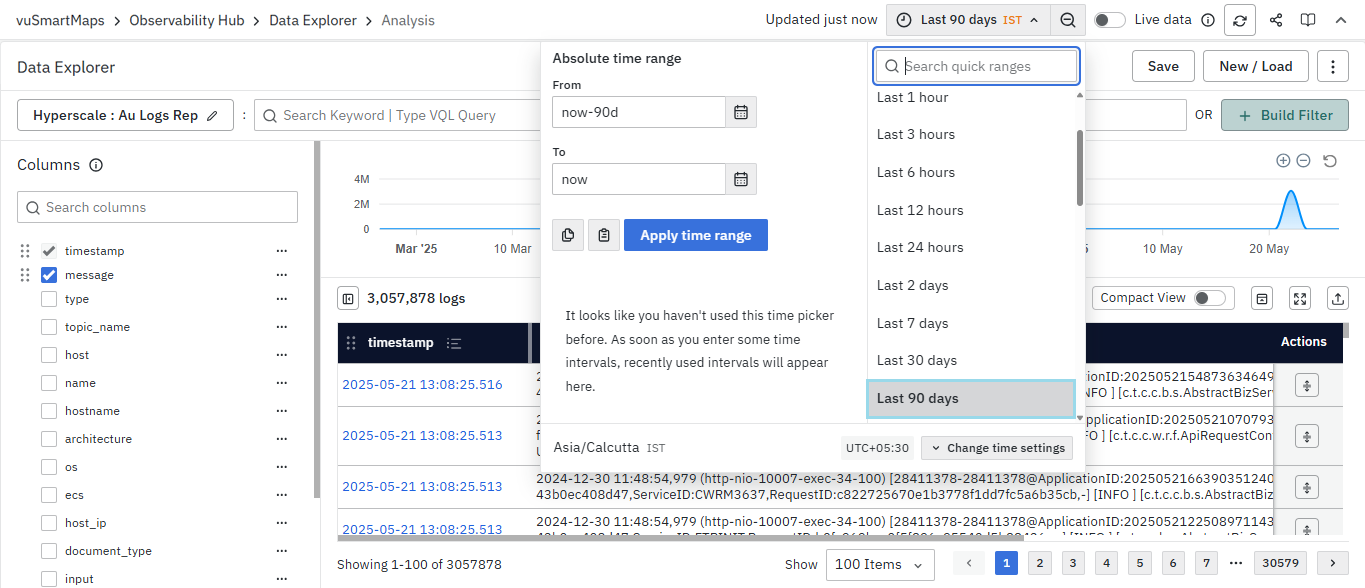
- Now, you can choose the time range. By default, it will show data for the last 15 minutes for timestamp-enabled tables.
- For example, let’s select the time range of the Last 90 days.
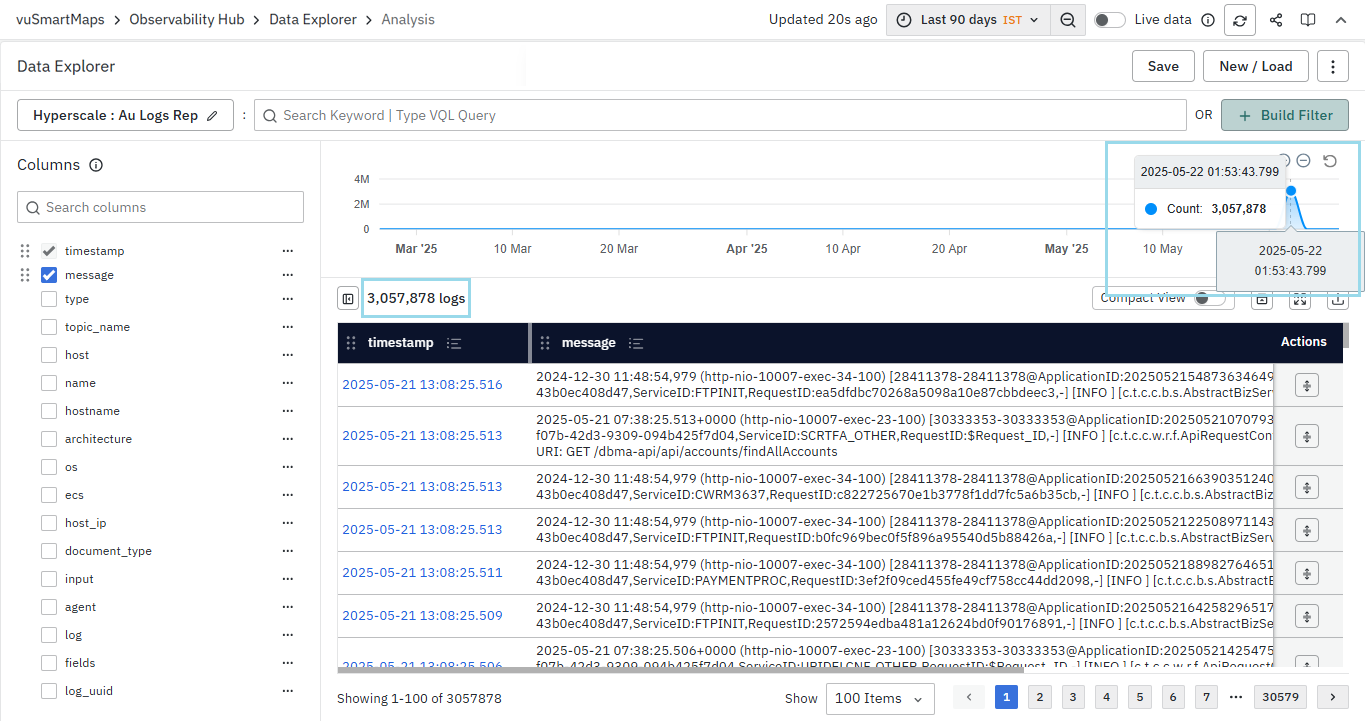
- Once these selections are made, the trend chart (if available) and table on the right-hand side of the screen will display values based on the chosen time range
- Alternatively, if we toggle the live data (timestamp tables), it will showcase the latest 500 records from the last 5 minutes.
Data Table Specific Features
Enhanced Filtering Capabilities
Unlike log tables, where filtering is limited to certain columns, data tables allow filtering on any column. This provides much greater flexibility for data analysis and exploration.
Universal Top 5 Values
In data tables, every column supports the Top 5 values feature, unlike log tables where this functionality is restricted. This allows you to quickly identify the most frequent values in any column for better data understanding.
Column Ordering
Data table columns follow a specific ordering system:
- Timestamp column appears first (if present)
- All other columns are arranged alphabetically
- This consistent ordering makes it easier to locate specific columns in large datasets
View Details Functionality
Data tables include a View Details button in the first column of each row. Clicking this button opens a drawer displaying all column values for that specific row, providing a comprehensive view of the complete record.
This feature is particularly useful for:
-
Examining records with many columns
-
Viewing full content that may be truncated in the table view
-
Getting detailed insights into specific data points
Visualizing Data and Patterns
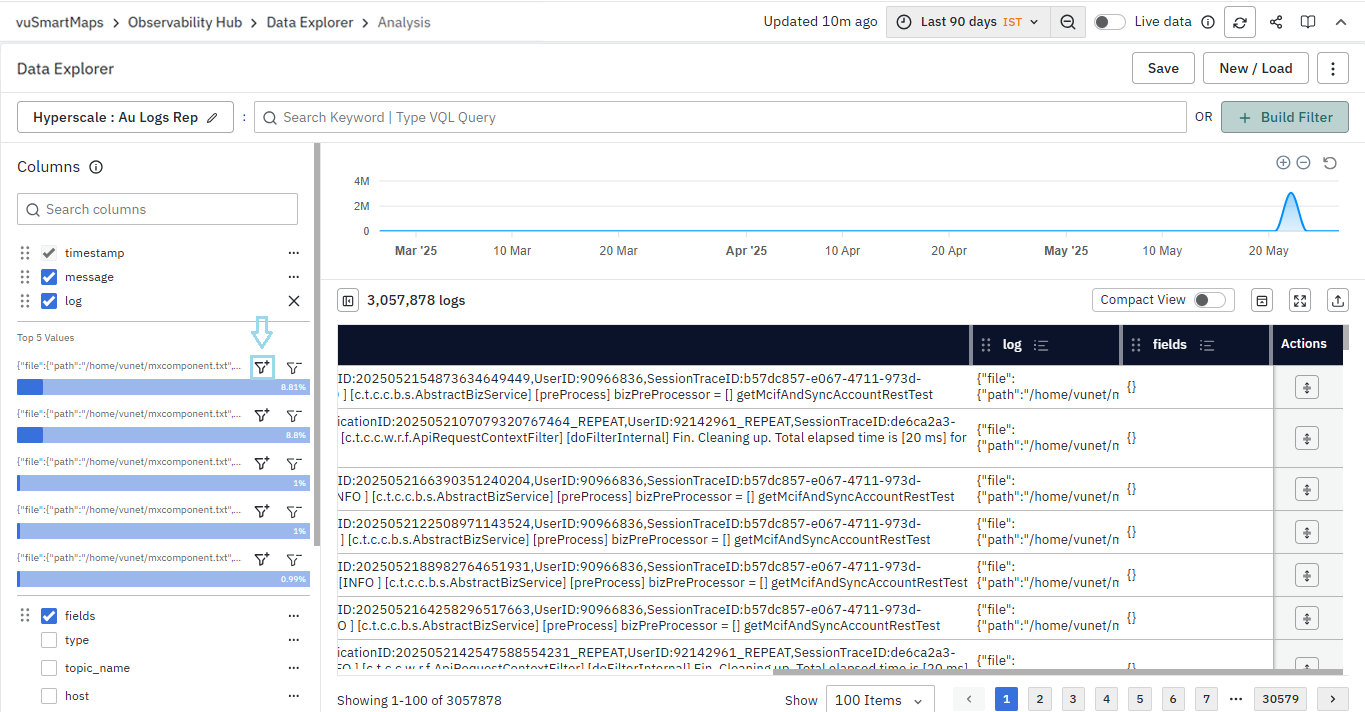
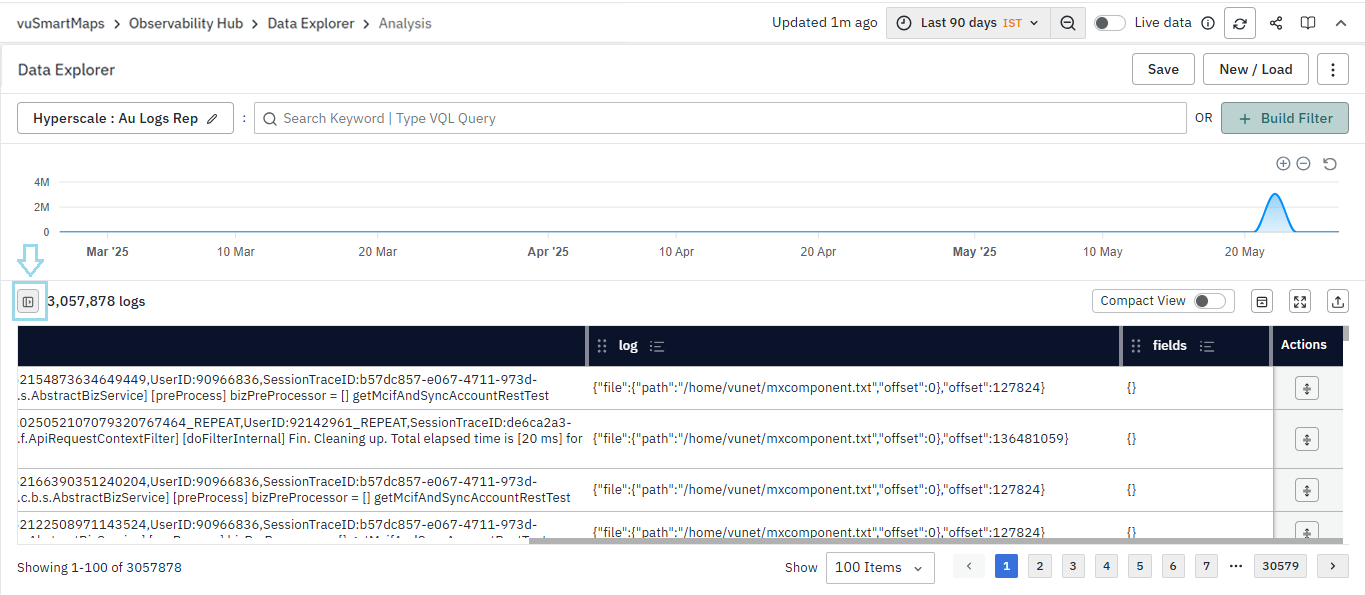
If we look closely at the table, at the top-left, it represents the total number of records present in the table in the selected time range (for timestamp tables) i.e., Document Count Trend. The Area Chart component (when available) enhances the ability to dissect data directly from the graph.
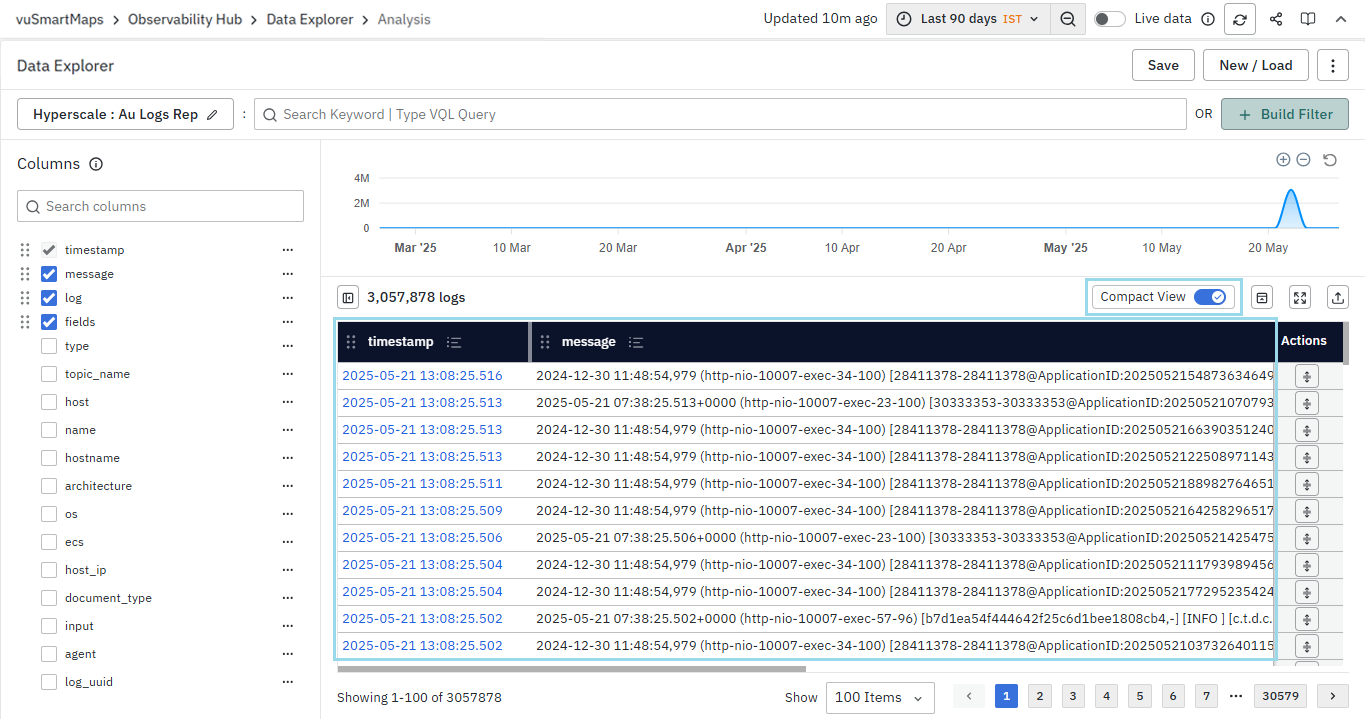
Under the Columns section, select the desired columns to be displayed on the table, it will be reflected on the table.
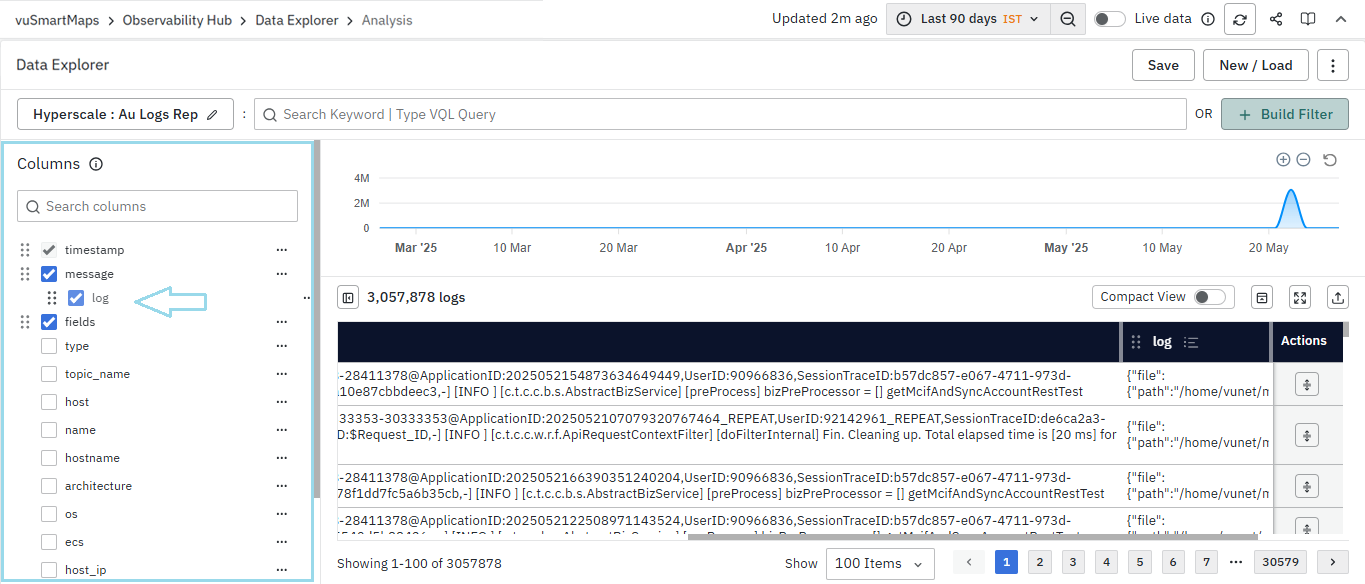
In addition, columns can be easily rearranged by dragging them once they have been selected. Alternatively, you can also rearrange columns directly from the table itself. Columns can be resized by dragging their edges, allowing you to adjust the column width as needed for better visibility.
Enhanced Table Resizing
Data Explorer includes improved table column management:
- Auto-layout adjustment: When columns are added or removed, the table automatically adjusts to fit the available space
- Manual resizing memory: Once you manually resize any column, the system remembers your preferences
- Minimum column width: New columns default to a minimum width of 150 pixels for optimal readability
- Space distribution: When columns are removed, the freed space is intelligently distributed to the remaining columns
To check the most frequent values of a particular field in the column, click on the horizontal ellipsis associated with the specific field listed in the Columns section.
On clicking, it will showcase the top five values in that column. For data tables, this feature is available for all columns. Each value shows the numerical frequency along with the total percentage of that value in the column.
Column section expansion can be done for all the fields except message because it is unique, descriptive, and unquantified.

-
You can utilize both the filter and filter-out options for any specific value to refine the values within the column.
- Filter for value: This allows you to show the filtered value in the columns. For instance, if you want to filter specific logs in the log field, you can click on the Filter for value option.
- Filter out value: This feature enables you to display all values except the filtered one in the columns. For example, if you wish to exclude certain logs from the log field, you can select the Filter out value option.


Querying For Data
There are two methods available for searching and querying logs:
- Using VQL-based Text Queries in Search Bar: You can enter VQL (Vunet Query Language) based text queries directly into the search bar to retrieve specific logs matching your criteria.
- Using Filter Operations in Filter Menu: Alternatively, utilize the Build filter menu to construct queries using filter operations. This method allows you to incrementally build simple or compound queries, providing a robust interface for log analysis.
In both cases, these methods enable the creation of powerful queries that facilitate detailed log analysis.
Build Filters
The Build Filter option located next to the search box allows you to add filters. By clicking 'Add Filter,' you can select columns and operators to filter specific records in the table.
For data tables, you can apply filters to any column.
You can add multiple filters at a time by clicking on 'Add Filter' more than once. Additionally, even if the columns are not selected in the table, you can still run the search for the particular columns.
- Please note that the log_uuid filter is no longer supported.
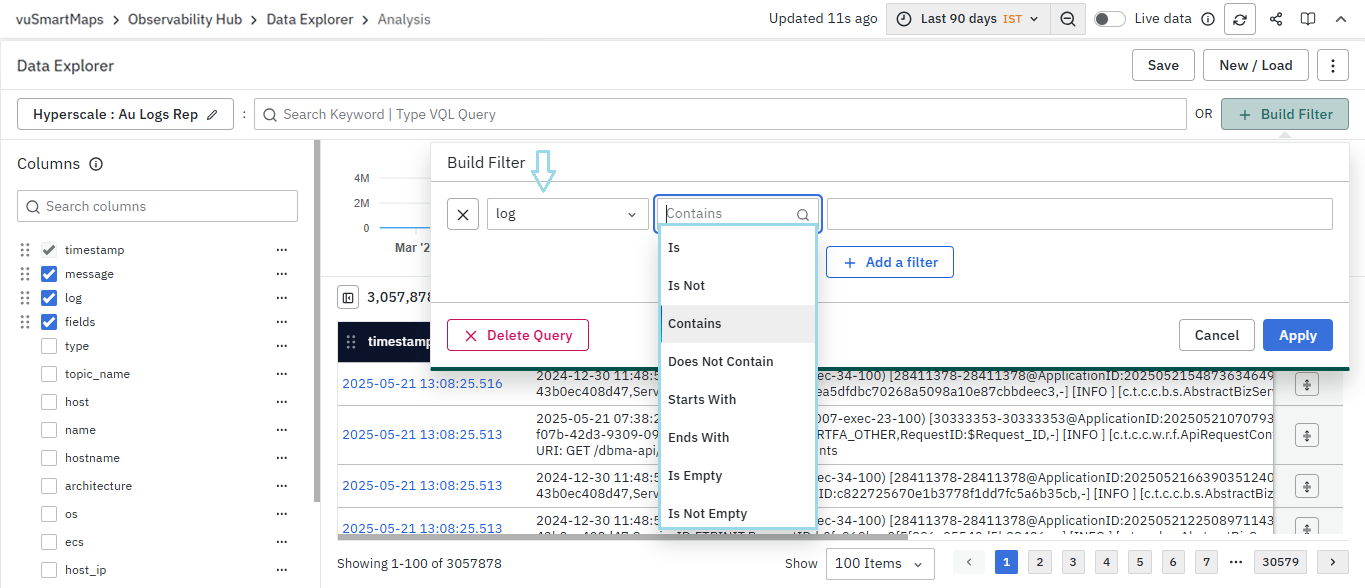
- For instance, you can search a string-type field such as 'log', choose the operator 'Contains', specify the term, and then click on Apply.
- The filter will be applied successfully and will be visible at the top left below the search bar.
- You can add multiple filters simultaneously, and each filter will display alongside the others.
If multiple filters are added simultaneously, they will operate as an AND operation. Similarly, if you add multiple filters and use VQL separately, the combined filters and VQL will also operate as an AND operation. Additionally, each filter or action performed is recorded in the browser history, allowing you to use the back/forward buttons to navigate through previous states.
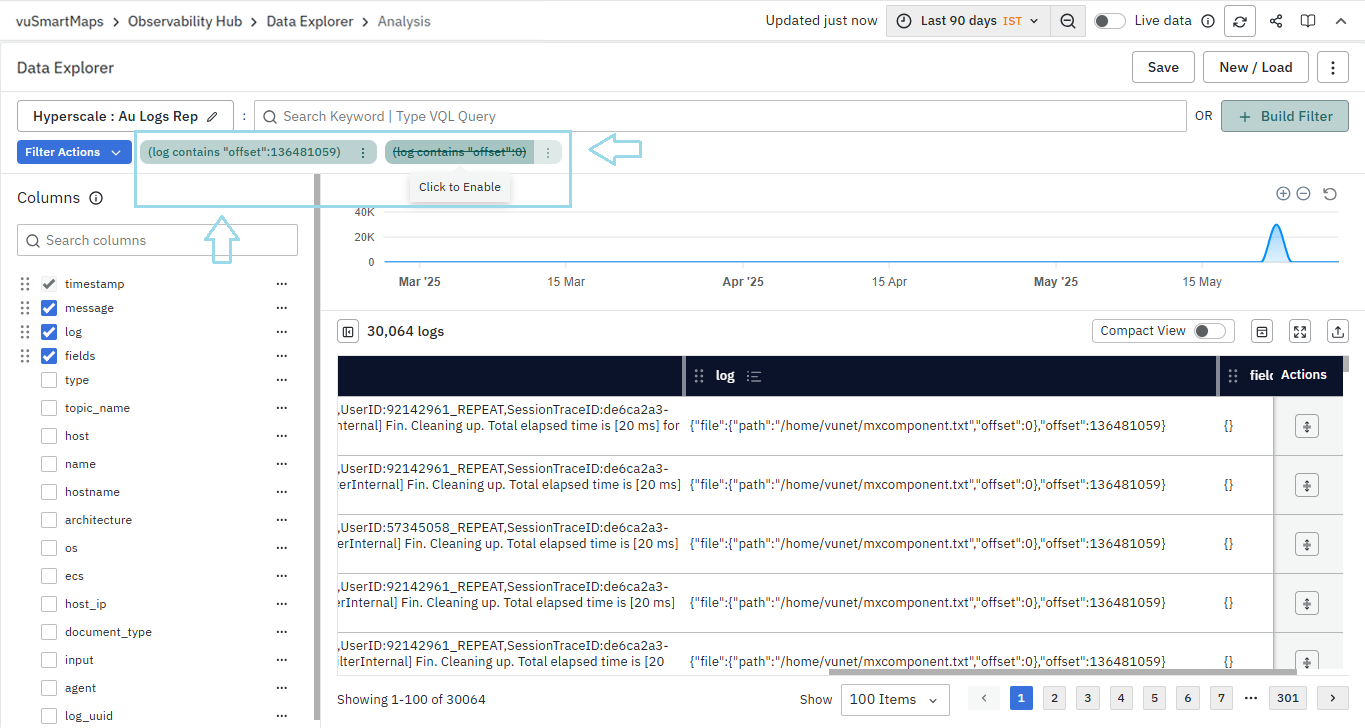
- By clicking on a specific filter, you can temporarily enable or disable the query. By clicking on 'More Actions', you can modify its configuration and delete the query.
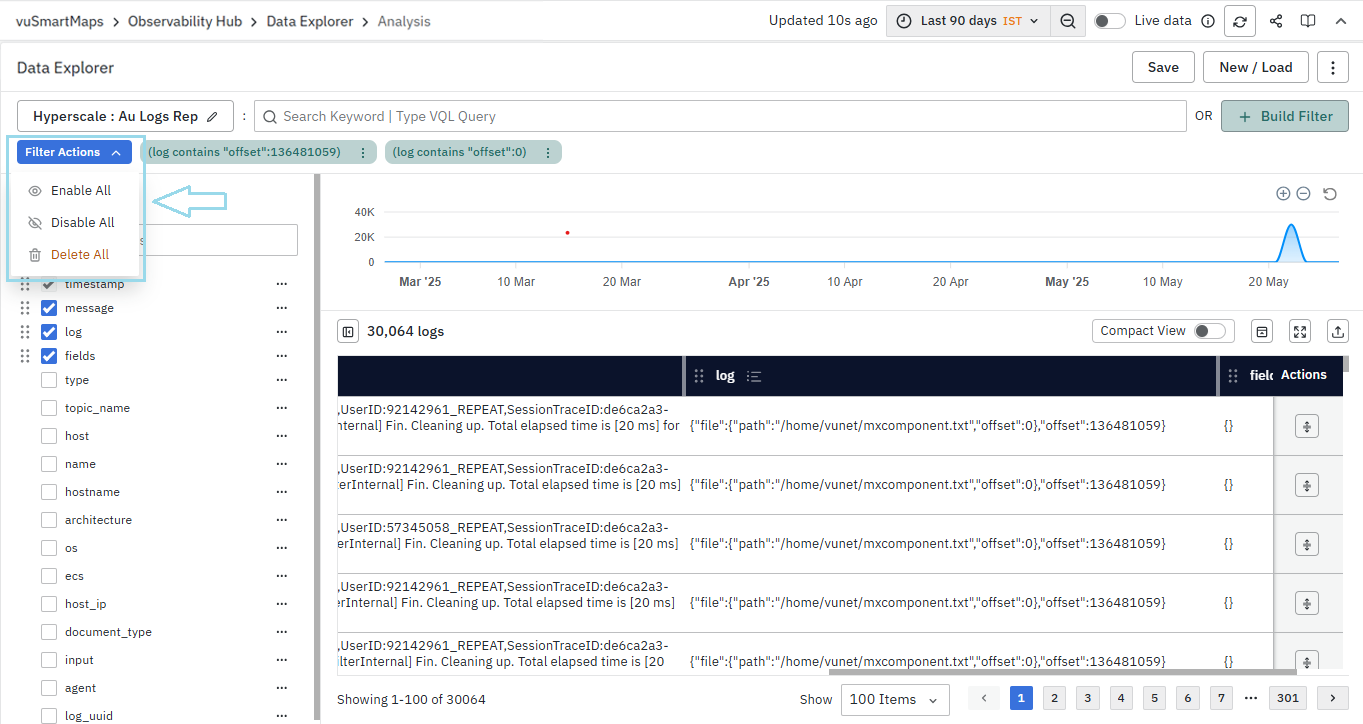
- The Filter Actions button on the left allows you to enable, disable, or delete all filters directly.
Using Text Queries in the Search Box
- Text-based query syntax can be used in the search box to interact with the system for analytics.
- Users can type in VQL-based text queries in the search box, and the system will display matching patterns.
- The search box is designed to provide suggestions based on the user's search history. It will display the ten most recent searches to assist users in finding relevant information quickly.

- In addition, the platform supports additional query syntax including compound expressions to interact with the data.
- For more detailed information, please refer to the VQL page.
Filter applied to the message field will be visually highlighted in the resulting table column.
Table Display Options
Columns Sidebar Toggle
The Columns toggle allows you to control the visibility of the sidebar. By default, the sidebar is visible when the page loads unless there is a specific reason to hide it. The Columns toggle lets users hide the sidebar for a more streamlined view.
Compact View
Multiline data, such as log messages, is displayed within cells by default, with a maximum of eight lines shown per message. However, messages longer than approximately eight lines may be truncated for readability. When the Compact View toggle is enabled, messages are flattened into a single line, offering a more concise and space-efficient layout.
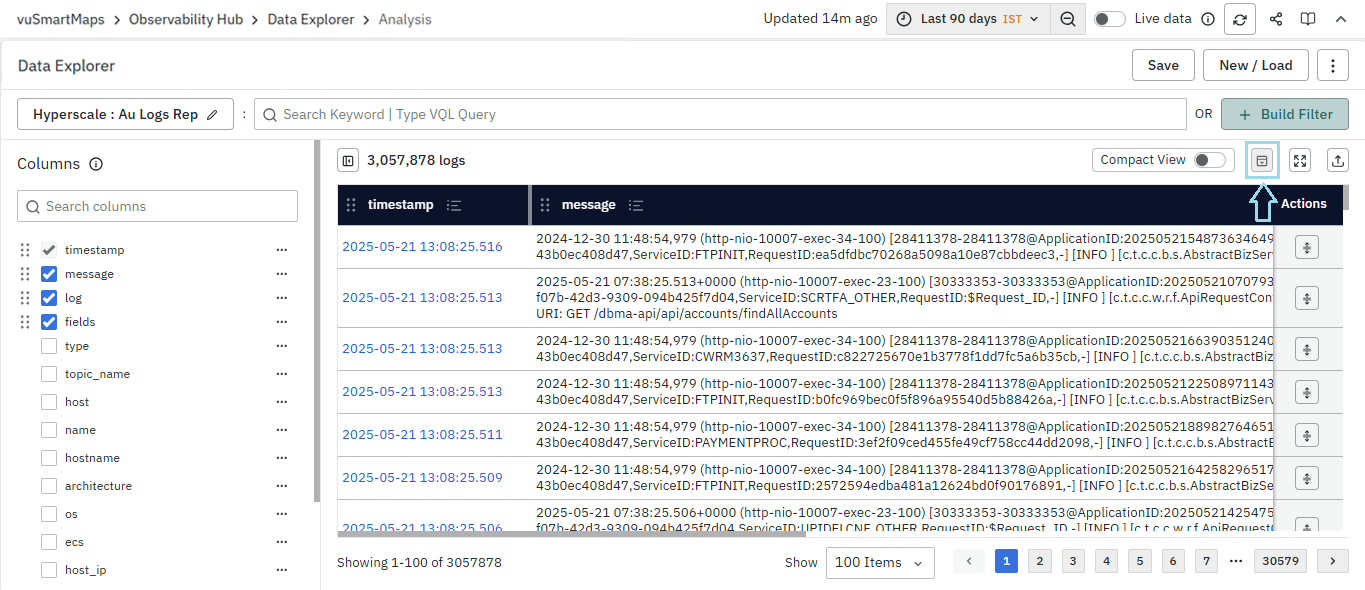
Toggle Trend Chart
The Toggle Trend Chart button allows you to hide or show the trend chart above the table (available only for tables with timestamp columns). When the chart is hidden, the table expands to use the full available space for a better viewing experience.
Maximize View
The Maximize button expands the table to full-screen mode, allowing you to focus entirely on the data. Clicking the button again restores the view to its default layout.
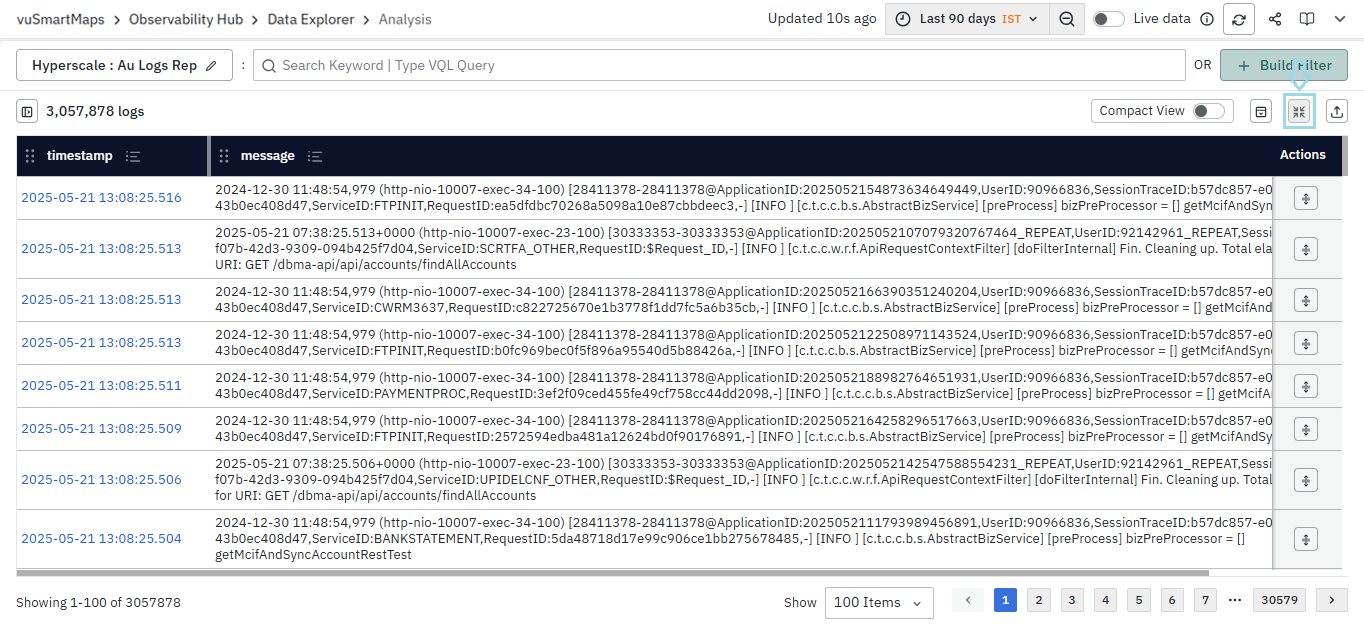
Table Type Specific Behaviors
Log Tables
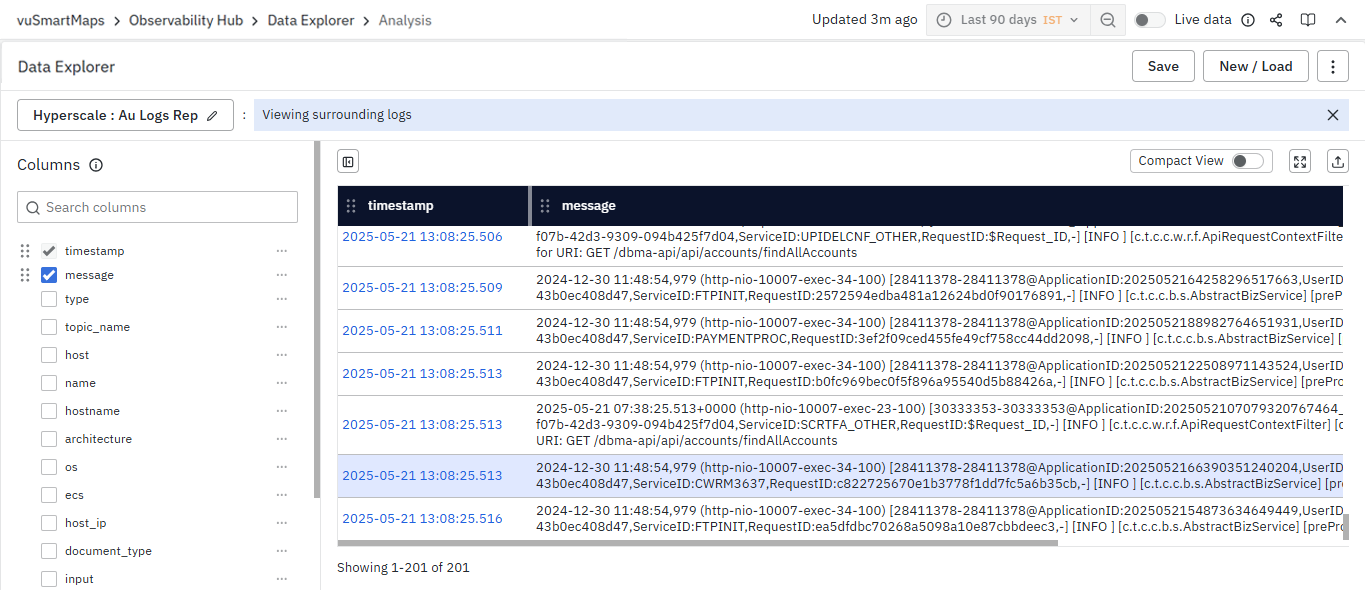
Log tables maintain the traditional Surrounding Logs functionality:
When you click the 'Surrounding Logs' button in the Actions column for a specific log in the table, it displays logs that surround the selected log. This includes the hundred log lines chronologically preceding and following the selected log.
Any applied filter will be automatically disabled when checking the surrounding logs.
The surrounding logs are located by:
- Temporarily disabling any filters applied.
- Locating 100 log lines chronologically preceding and succeeding the log line selected
- While locating the surrounding log lines, the system preserves any table-level filters applied.
If all applied filters are disabled when viewing surrounding logs, users can still mute/unmute existing filter pills by clicking on them.
- Additionally, in surrounding logs, you can’t add or edit any filters. Please be aware that any changes to columns selected to be shown on the table from the left side will not be preserved when returning to the main page from the surrounding logs view.
Data Tables
Data tables focus on individual record analysis rather than contextual log sequences, so you won't find the Surrounding Logs option here. Instead, use the View Details button in the first column to open a comprehensive view of any record, giving you complete access to all field values in an easy-to-read format.
For details on saving, sharing, and exporting searches in Log Analytics, please refer to the Saving and Sharing Searches section