OmniAgent Management Console
The OmniAgent Management Console provides a centralized interface within vuSmartMaps to manage and monitor all OmniAgent deployments across your environment. It allows administrators to view the health of hosts and probes, track reporting status, and perform key actions such as starting, stopping, restarting, or upgrading probes. With built-in filters, bulk operations, and direct download options for the OmniAgent package, the console enables easy oversight of probe activity and ensures all components are functioning correctly, and allows for quick resolution of any reporting or configuration issues.
Accessing OmniAgent Management Console
The OmniAgent Management Console is available within vuSmartMaps under the Data Management section. To access it:
- Log in to vuSmartMaps with your user credentials.
- From the left navigation panel, go to Data Studio > OmniAgent
- The console will open, showing the OmniAgent landing page with two tabs:
Landing Page

Hosts
Each row in the table represents a server (host) where OmniAgent is installed. The table includes the following fields:
- Hostname: The name of the server (clickable for more details).
- Host IP: The IP address of the server.
- Health + Particulars: Shows the current health status of the OmniAgent service (e.g., Healthy, OA Not Reporting).
- Probes: Number of probes installed on that host.
- Last Reported: Time since the host last sent data (e.g., less than a minute ago, 2 days ago).
- Created At: Timestamp when the OmniAgent service was first registered.
- O11ySources Monitored: Lists the O11ySources linked to this host.
Hosts Filter
The Filter Section allows you to control which hosts are displayed in the table. Instead of viewing all hosts at once, you can apply filters to focus only on those that need attention. Users can also search for specific hosts by host name or host IP for quicker access.
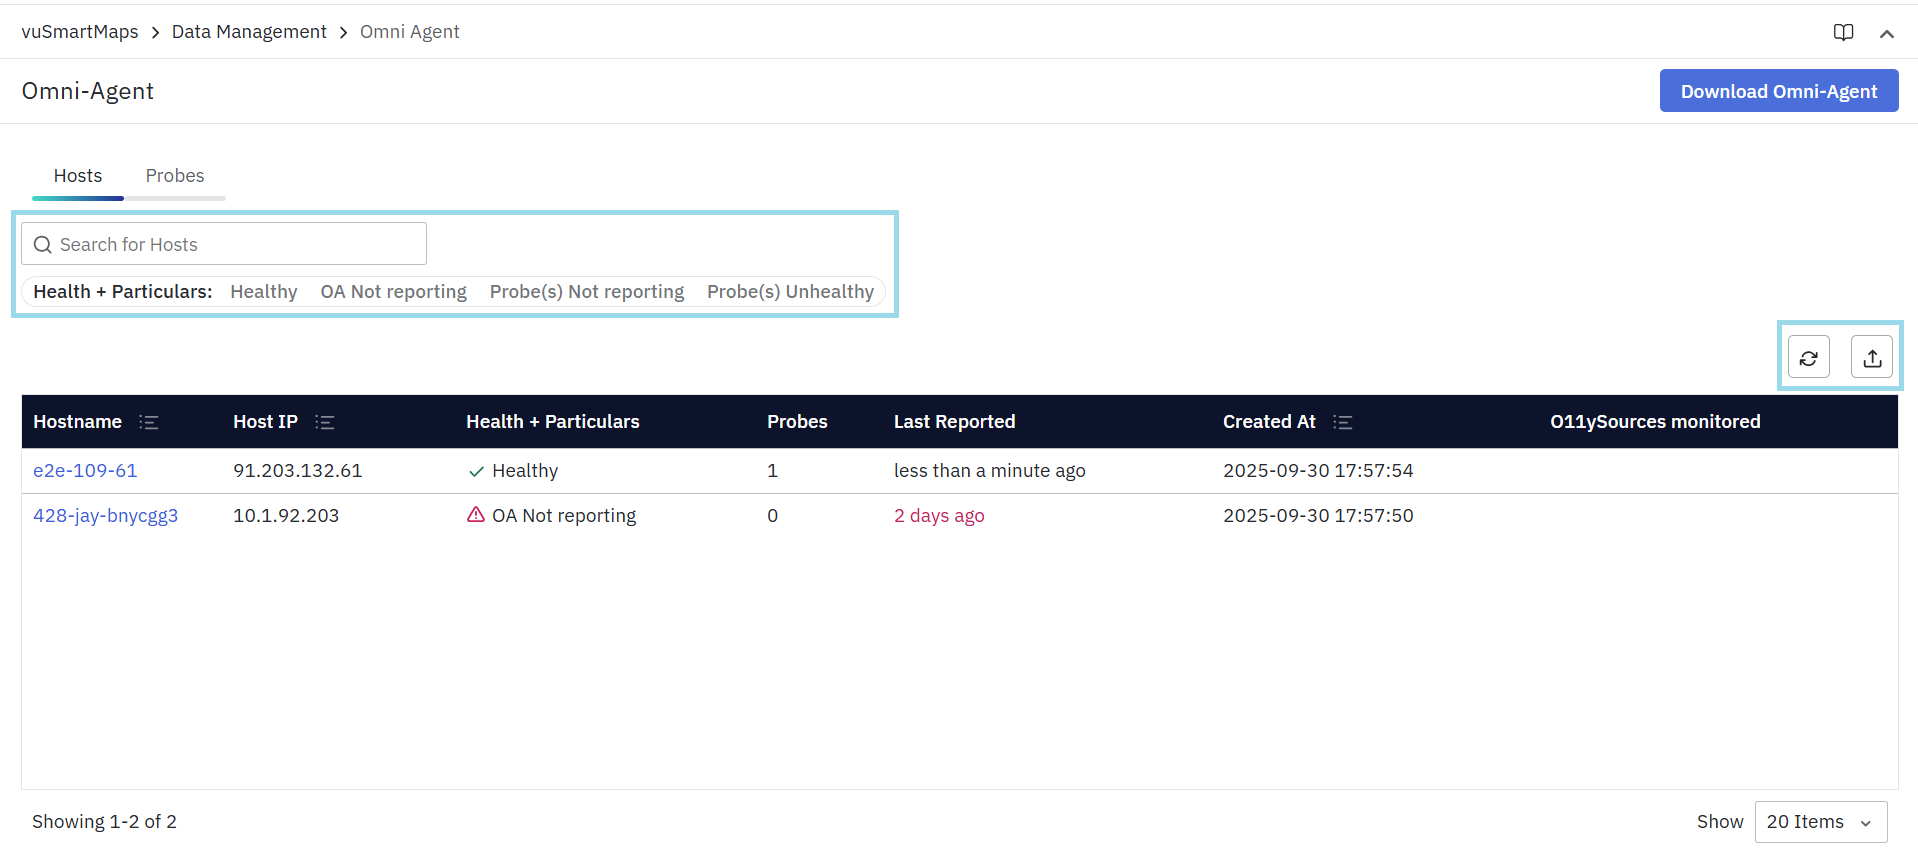
- Healthy: Shows only the hosts where OmniAgent is running properly and reporting data without issues.
- OA Not Reporting: Displays hosts where the OmniAgent itself has stopped sending data to the system.
- Probe(s) Not Reporting: Highlights hosts where one or more probes installed under the OmniAgent have stopped reporting.
- Probe(s) Unhealthy: Shows hosts where probes are still running but are facing errors or performance issues.
Hosts Actions
- Refresh: Reload the data to view the latest status of all hosts and probes.
- Export: Download the list of hosts and their probe details in a report format (CSV/Excel).
Sorting in Hosts View
-
The Hosts table supports column-based sorting to help organize host information quickly.
-
You can sort hosts by clicking the sort icon in the column header. Clicking again toggles between ascending and descending order.
-
Users can sort hosts using the following columns:
- Host IP – Sort hosts by their IP addresses.
- Hostname – Sort hosts alphabetically by host name.
- Created At – Sort hosts based on when the OmniAgent was first registered on the host.
-
Sorting works in combination with filters and search, helping users quickly locate hosts based on time of onboarding, naming patterns, or network grouping.
Probes
The Probes Tab provides details of every probe installed on the hosts. Each row in the table corresponds to one probe.
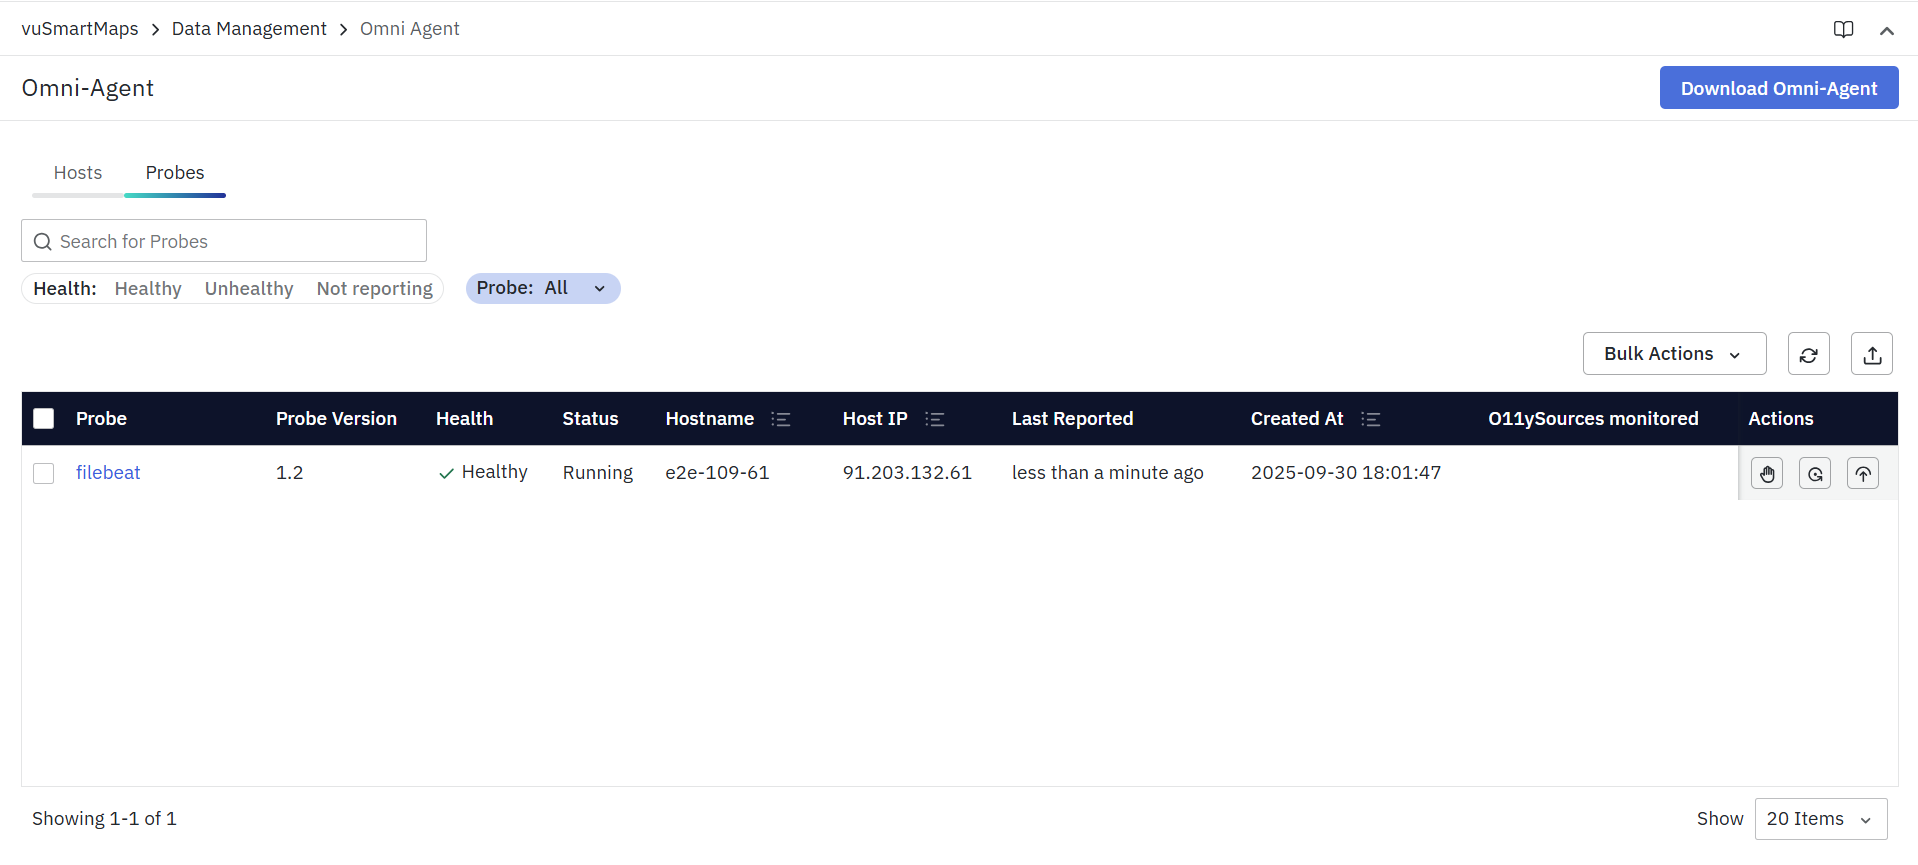
- Probe: Name of the probe (clickable for more details).
- Probe Version: Version of the installed probe (e.g., 1.2).
- Health: Current health status (Healthy, Unhealthy, Not Reporting).
- Status: Running state of the probe (Running, Stopped).
- Hostname: The server/host where the probe is installed.
- Host IP: IP address of the server.
- Last Reported: Timestamp showing when the probe last sent data.
- Created At: The date and time the probe was first registered.
- O11ySources Monitored: Displays the O11ySources associated with this probe.
- Actions: On the right-hand side of each row, actions are available for managing the probe:
- Start/Stop Probe: Manually control the probe’s activity.
- Restart Probe: Restart a probe if it’s unresponsive or needs to reload its configuration.
- Upgrade Probe: Update the probe to the latest version if available.
Selecting a probe opens its detailed information panel on the right as shown below.

Probes Filter
The Filter Section helps you narrow down the list of probes shown in the table. Instead of scrolling through all probes, you can apply filters to view only what you need.
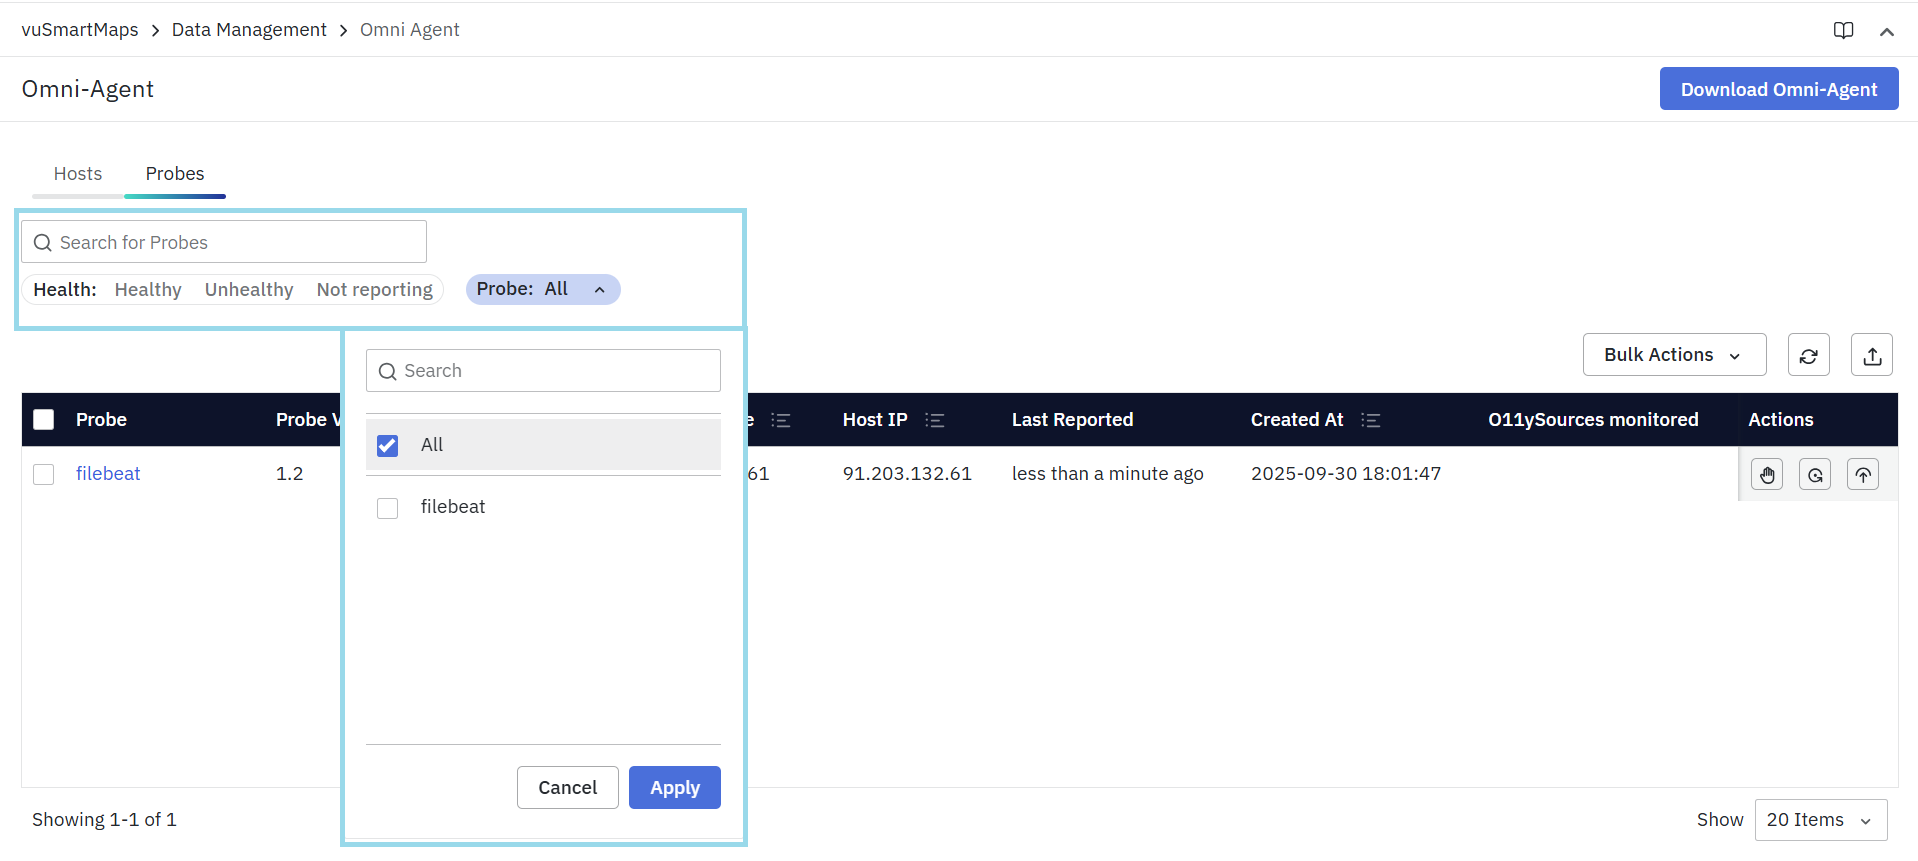
- Search for Probes
- Enter the name of a probe (e.g., filebeat) to quickly locate it in the table.
- Health Filters
- Narrow down the list of probes by health condition:
- Healthy – Only show probes that are running correctly.
- Unhealthy – Show probes with errors or issues.
- Not Reporting – Show probes that have stopped sending data.
- Narrow down the list of probes by health condition:
- Probe Filter
- A drop-down menu to control which types of probes are displayed.
- Options include:
- All – Show every probe installed.
- Specific probe types:
- Healthbeat
- Logbeat
- Vuappagent
- Vuhealthagent
- Vulogagent
- telegraf
Probes Actions
Bulk Actions in Probes
The Bulk Actions dropdown allows administrators to manage multiple probes at once, instead of performing actions individually. This is especially useful when the same task must be applied to multiple probes across different hosts.
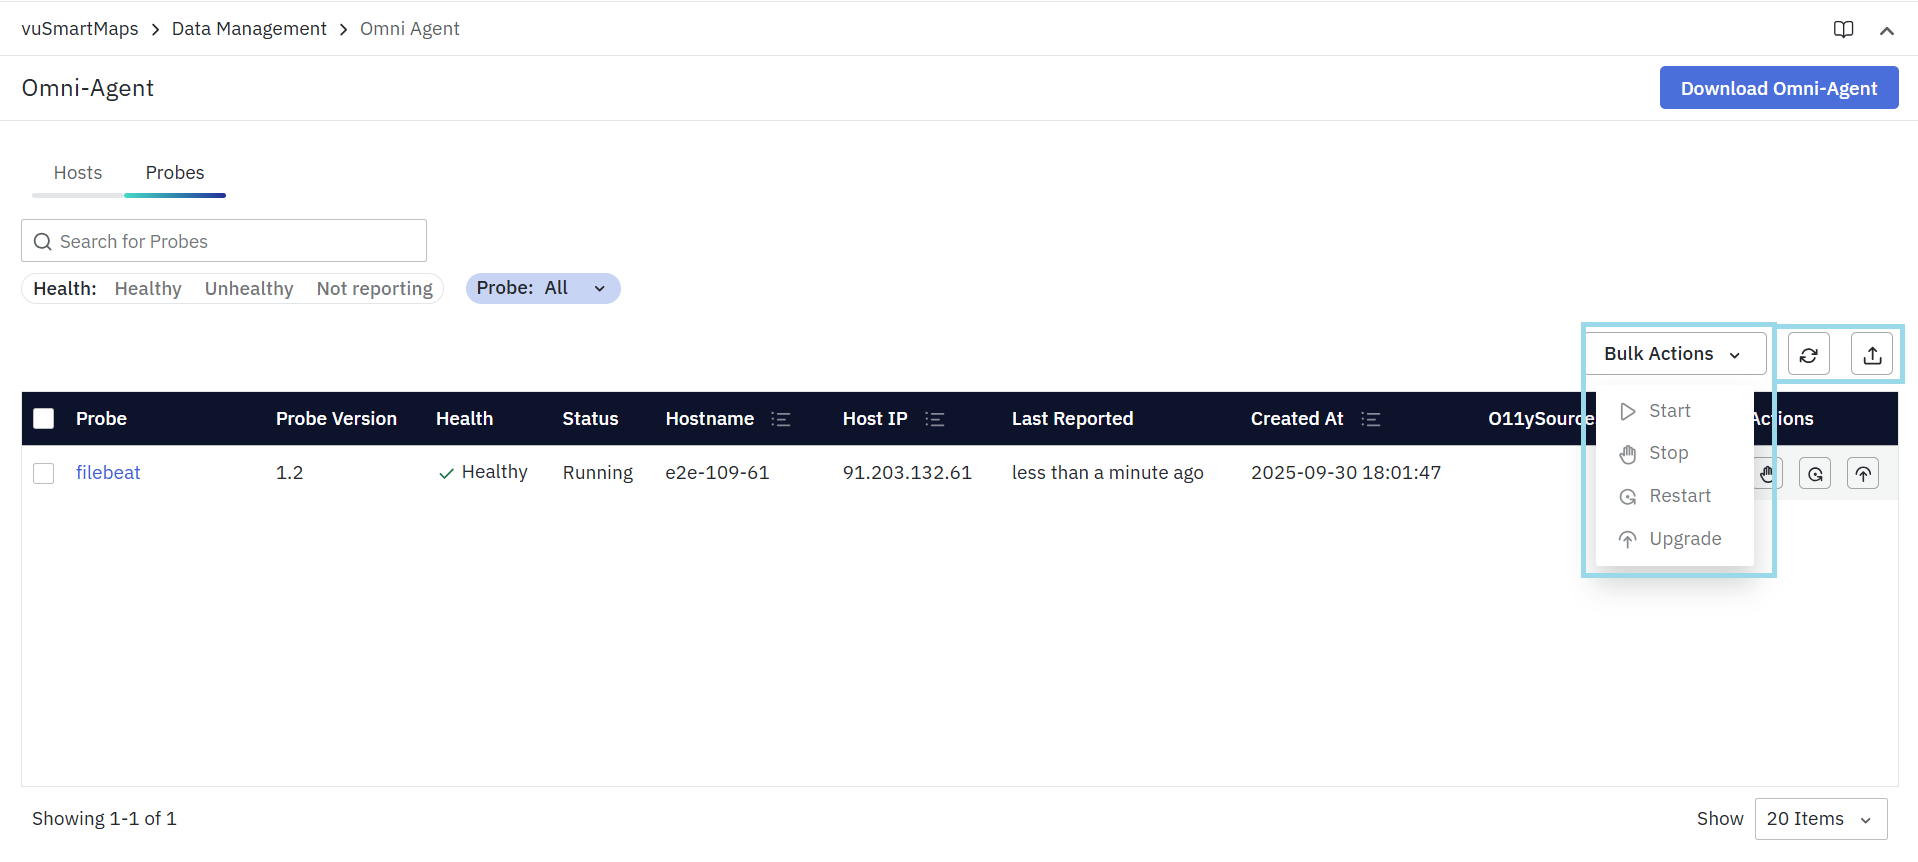
- Start Probes
- Start all selected probes that are currently stopped.
- Stop Probes
- Stops the selected probes from running.
- Useful for temporarily disabling monitoring.
- Restart Probes
- Restarts the selected probes.
- Typically used if a probe is unresponsive or if updated configurations need to be applied.
- Upgrade Probes
- Upgrades the selected probes to the latest available version.
- Ensures probes are running with the latest features and fixes.
Refresh
- Reload the data to view the latest status of all probes.
Export
- Download the list of probes in a report format (CSV/Excel).
Sorting in Probes View
- The Probes table also supports column-based sorting for easier analysis.
- Click the sort icon in a column header to sort probe entries. Click again to reverse the order.
- Users can sort probes using the following columns:
- Hostname – Sort probes based on the host on which they are installed.
- Host IP – Sort probes by the IP address of the host.
- Created At – Sort probes by the time they were registered or created.
- Sorting can be combined with health filters, probe-type filters, and search, making it easier to analyze probe distribution, onboarding timelines, and host-level grouping.
Downloading OmniAgent
The Download OmniAgent button, located in the top-right corner of the Management Console, allows administrators to download the OmniAgent installation package. This package is required to deploy OmniAgent on new hosts or to reinstall it on existing ones.
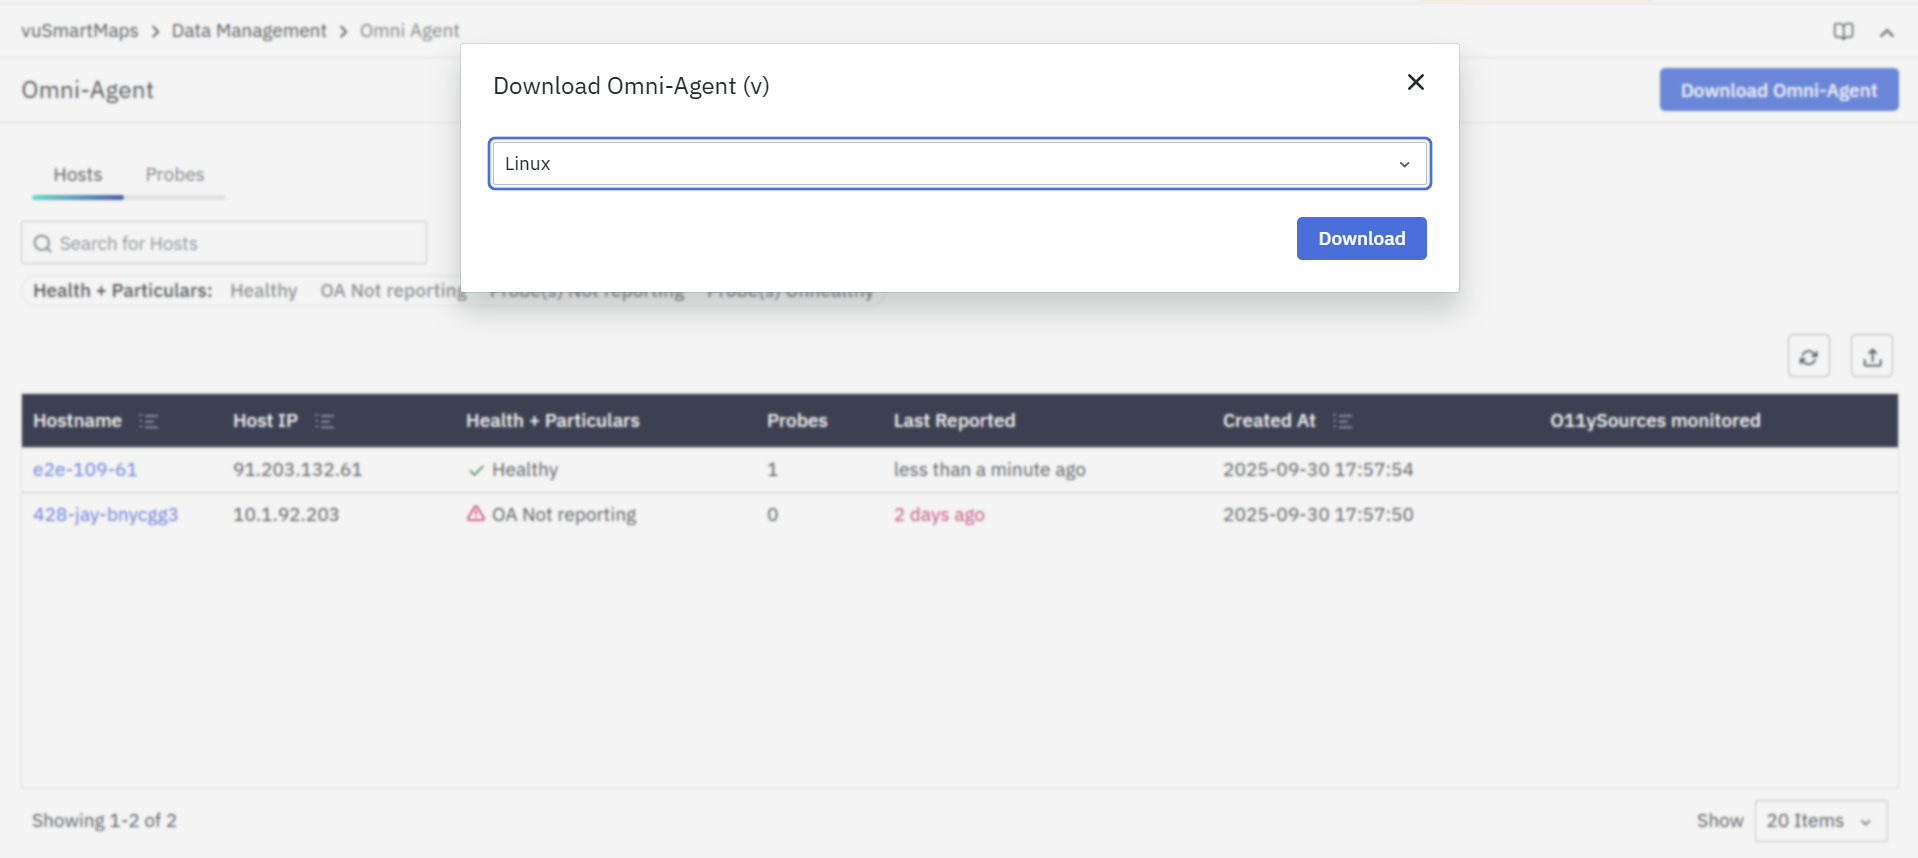
Steps to Download OmniAgent
- In the top-right corner of the Management console landing page, click Download OmniAgent.
- Choose the package version based on the operating system or environment (e.g., Linux, Windows)
- Click the Download button to save the installation package to your local machine.
- Once downloaded, you can follow the steps in the OmniAgent Installation Guide to install it on the target host.
