Data Sources
Overview
Data Sources in vuSmartMaps allow users to connect the platform with different databases and systems. After a data source is configured, users can query, explore, and visualize the data in vuSmartMaps. Each data source has a query editor designed for that specific source structure, making it easier to create configurable queries.
In the current version, vuSmartMaps supports three data source types:
- Elasticsearch
- PostgreSQL
- HyperScale
Data Sources are mainly used for two operations:
- Querying data using Explore
- Visualizing data in Dashboards
Why This Feature Is Useful
In banking and payment environments, teams often need to analyze data from multiple systems. This data may come from logs, metrics, databases, APIs, or backend systems. Data Sources help teams connect vuSmartMaps to these systems and use the data for analysis and visualization.
This is useful because users can:
- Explore data without creating a dashboard.
- View query results as both graphs and tables.
- Build dashboard panels from configured data sources.
- Create visualizations for operational monitoring.
- Use different source types based on the data storage system.
- Manage multiple data sources from a single page.
- Search and sort data sources for easier administration.
Example Scenario
A payment operations team wants to analyze transaction logs and visualize trends. The administrator first adds the required data source in vuSmartMaps. If the logs are stored in Elasticsearch, the administrator configures an Elasticsearch data source. If the data is stored in PostgreSQL or HyperScale, the administrator configures the relevant source.
After the data source is configured, users can open Explore to query the data interactively. They can view the results as a graph and a table. If the same data must be monitored regularly, users can select Build a Dashboard and create dashboard panels using the configured data source. This helps operations teams analyze trends, review details, and build visual monitoring views from the connected data.
When to Use This Feature
Use Data Sources when:
- A database or system must be connected to vuSmartMaps.
- Users need to query data using Explore.
- Users need to create dashboards from stored data.
- Data must be visualized as panels.
- Administrators need to manage available data sources.
- Users need to configure Elasticsearch, PostgreSQL, or HyperScale as a source.
- Users need to search or sort existing data sources.
- A configured source must be used for graphs, tables, and dashboard visualizations.

Comprehensive Understanding
Navigation Path
To open the Data Sources page, go to: Data Studio > Data Source This page is used by administrators to manage data sources.
Data Sources Landing Page
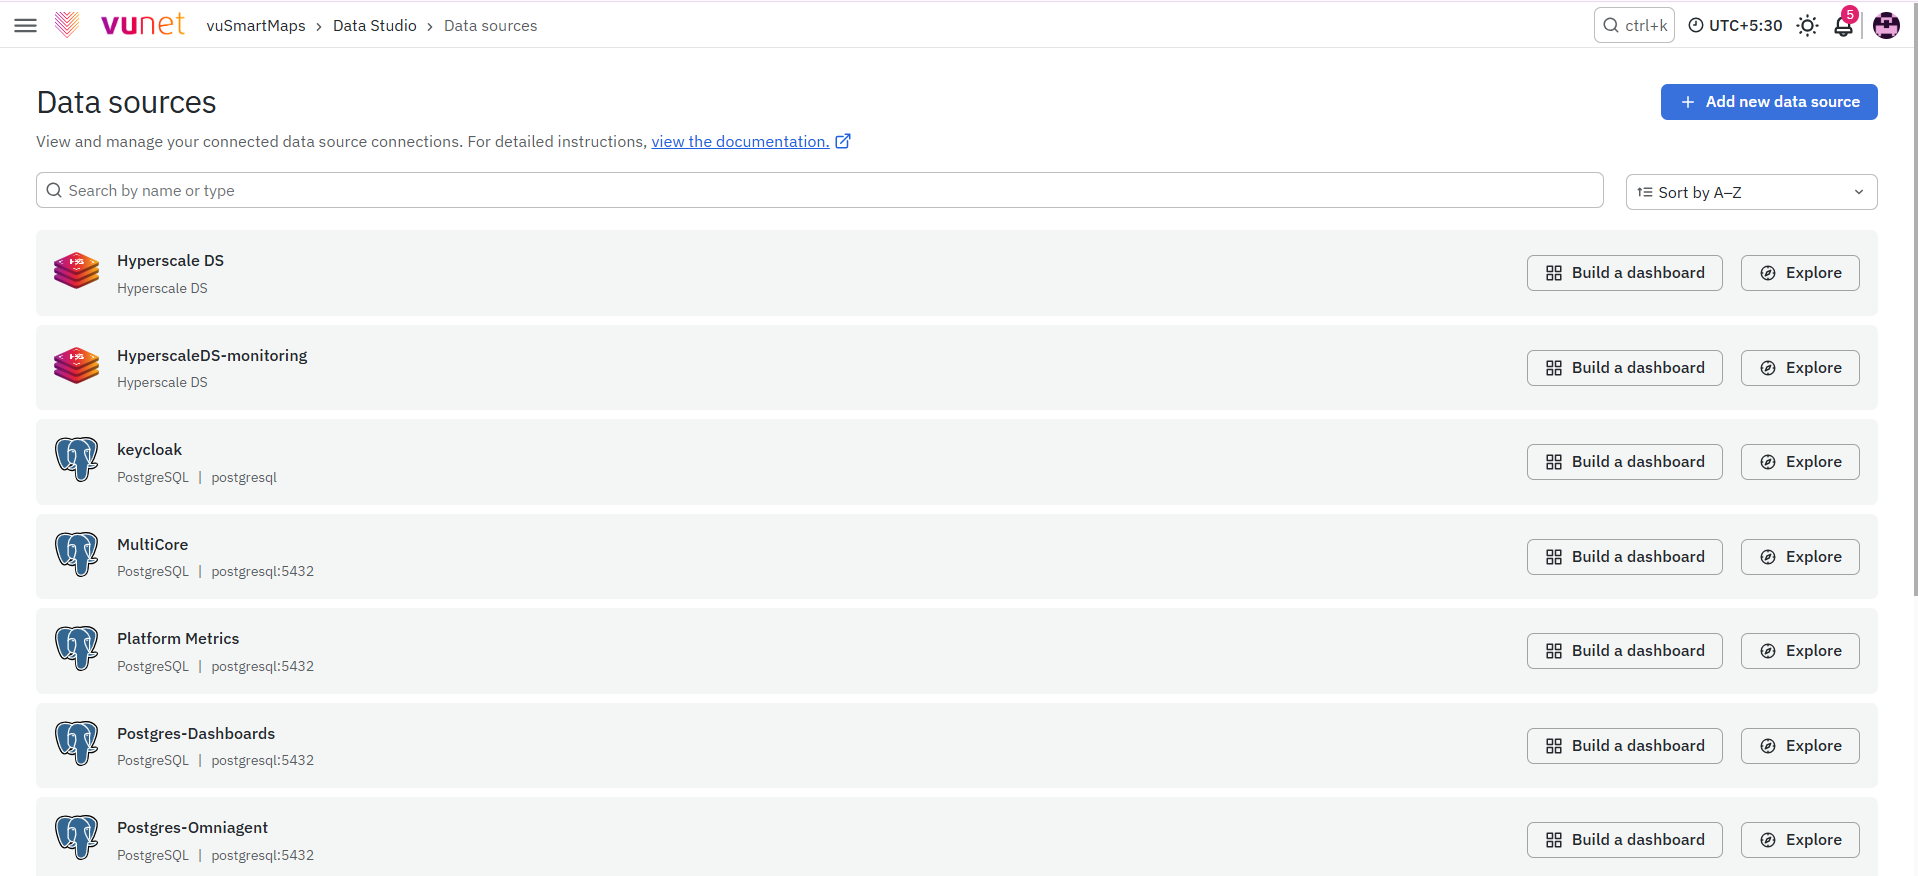
The landing page shows a list of all added data sources in the vuSmartMaps instance. This page helps administrators view and manage available data sources. It includes:
- A list of configured data sources.
- Add new data source button.
- Explore option for each data source.
- Build a Dashboard option for each data source.
- Search functionality.
- Sort functionality.
Add New Data Source
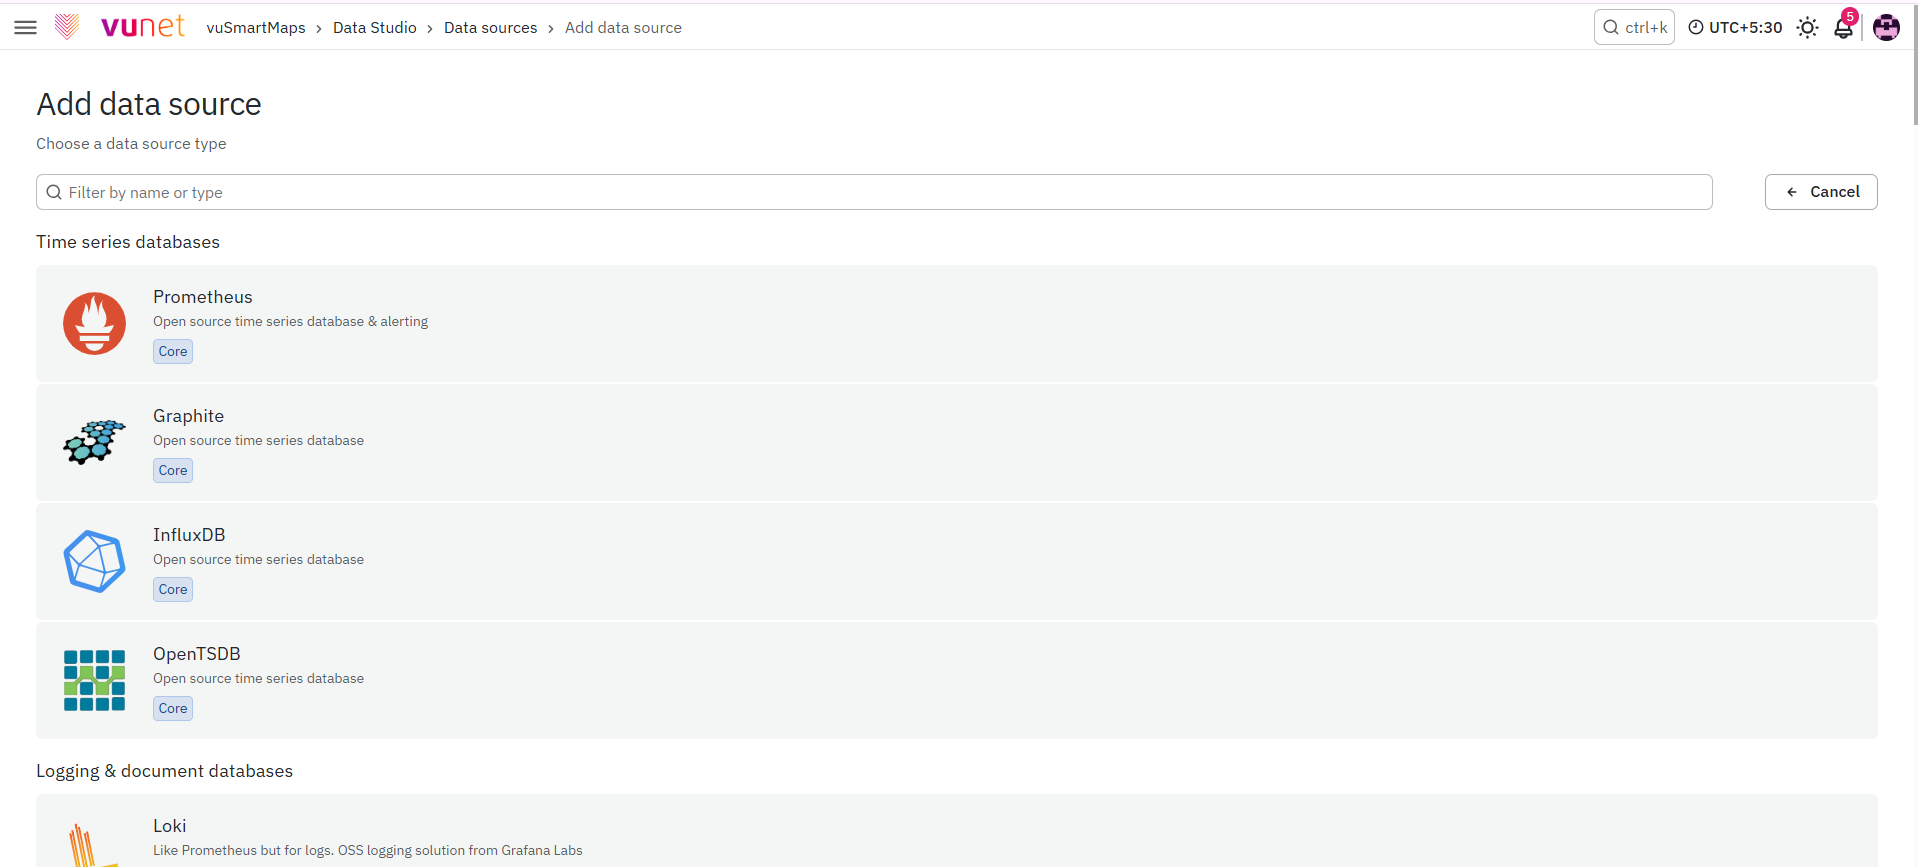
The Add new data source button starts the process of adding a new data source. After clicking the button, a search dialog appears. Users can enter the name of the required data source and filter the available options.
Explore
The Explore option allows users to interactively explore data without creating a dashboard. Explore displays results as:
- Graph
- Table
This helps users analyze trends and details together.
Build a Dashboard
The Build a Dashboard option allows users to create dashboards using data from the selected data source. Panels are the basic building blocks for visualizations in vuSmartMaps.
Search and Sort
The Data Sources page includes search and sort features. These help administrators quickly locate and organize data sources in the list.
Step-by-Step Instructions
Open the Data Sources Page
- Open the left navigation menu.
- Go to Data Studio > Data Source.
- The Data Sources landing page opens.
- Review the list of configured data sources.
Explore Data from an Existing Data Source
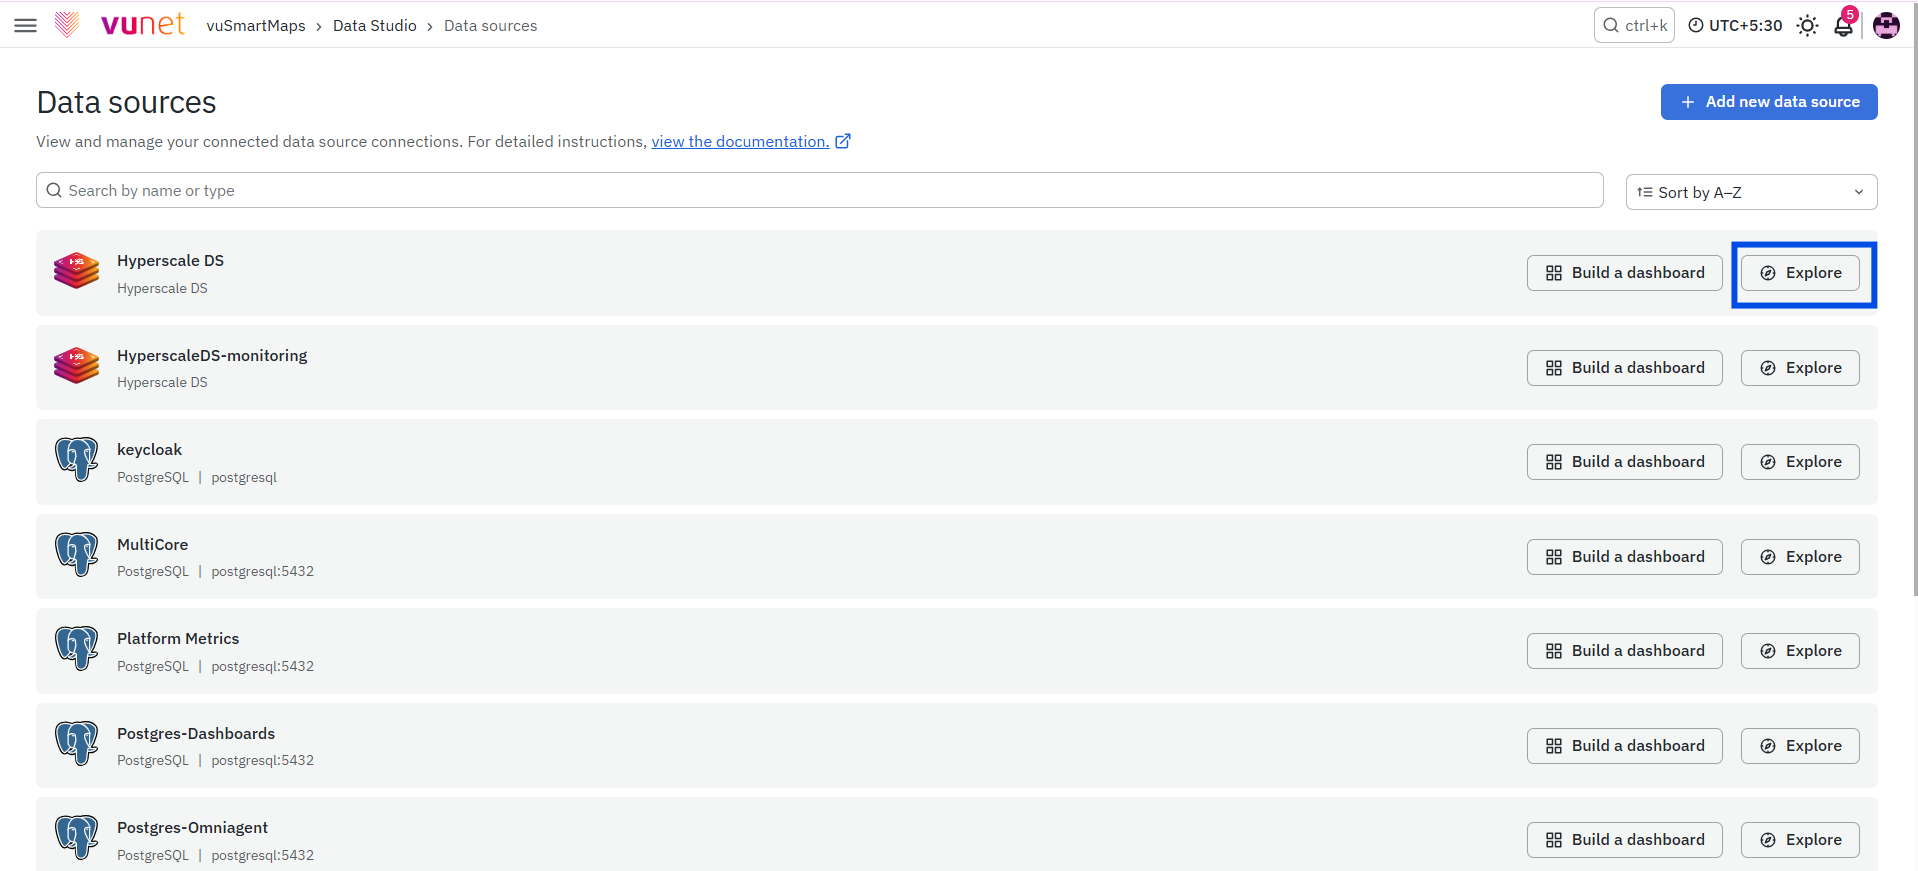
- Open Data Studio > Data Source.
- Find the required data source in the list.
- Click Explore for that data source.
- Use the query editor to query the data.
- Review the output as a graph and a table.
Build a Dashboard from a Data Source
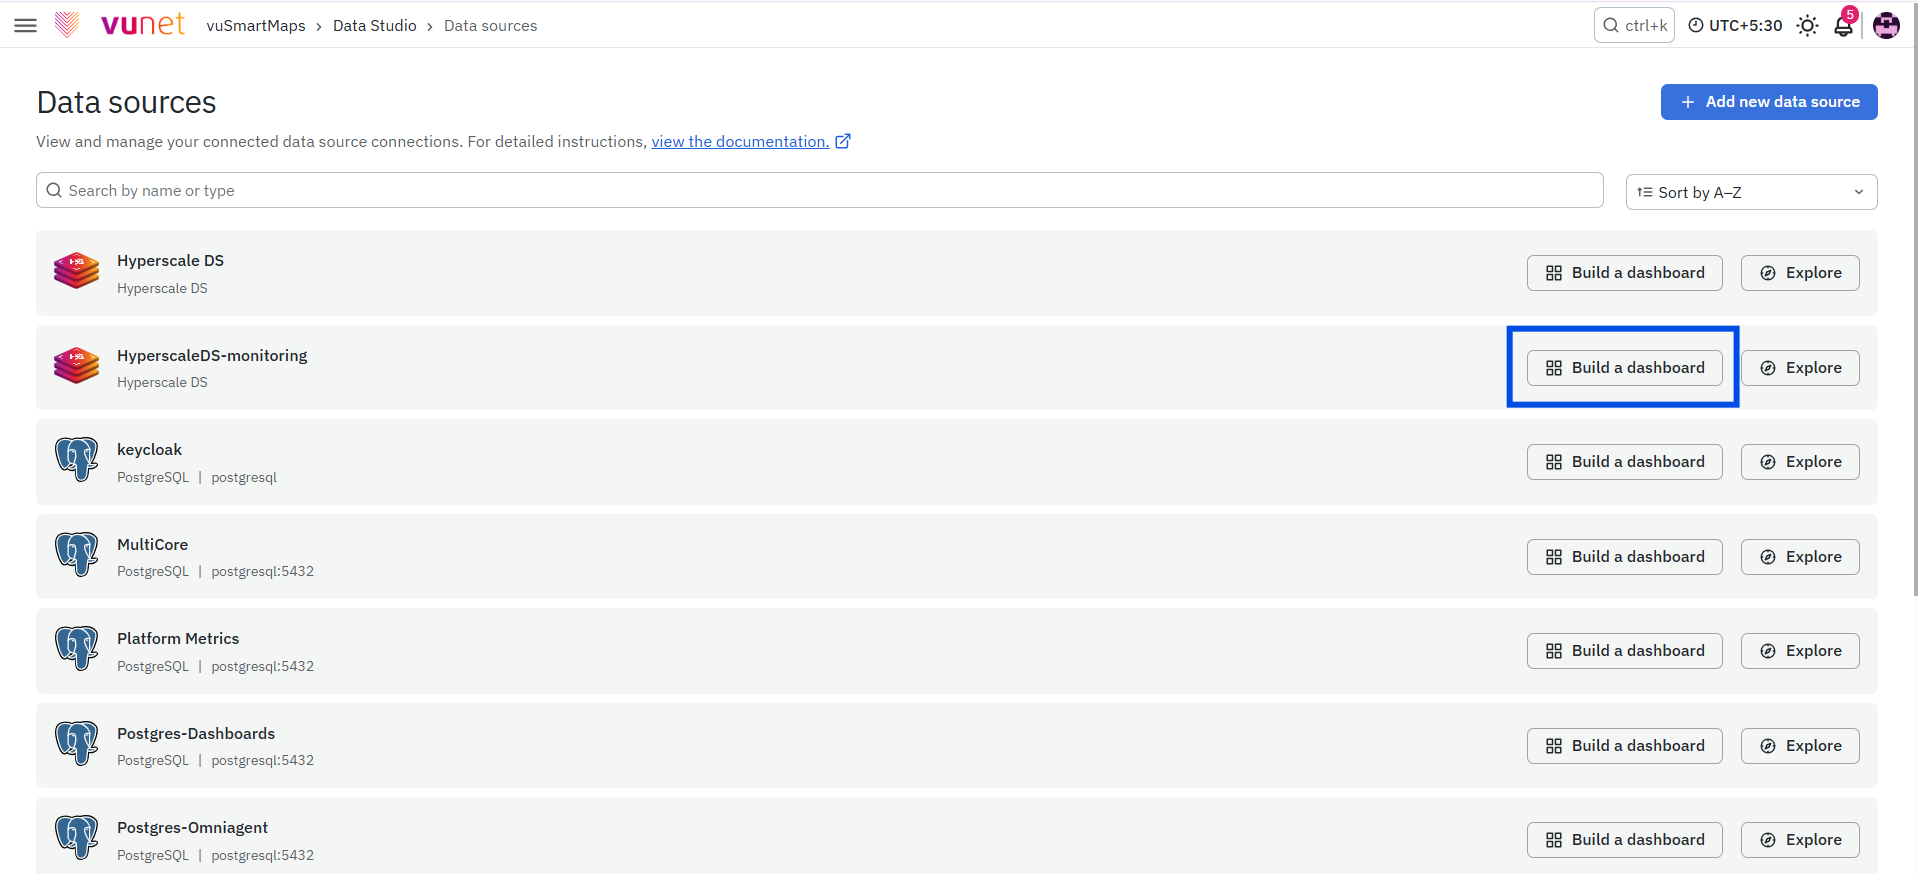
- Open Data Studio > Data Source.
- Find the required data source.
- Click Build a Dashboard.
- Use the selected data source to create dashboard panels.
- Build visualizations using the data retrieved from the source.
For more details on creating dashboards using configured data sources, refer to the Dashboards section in the user guide.
Add a New Data Source
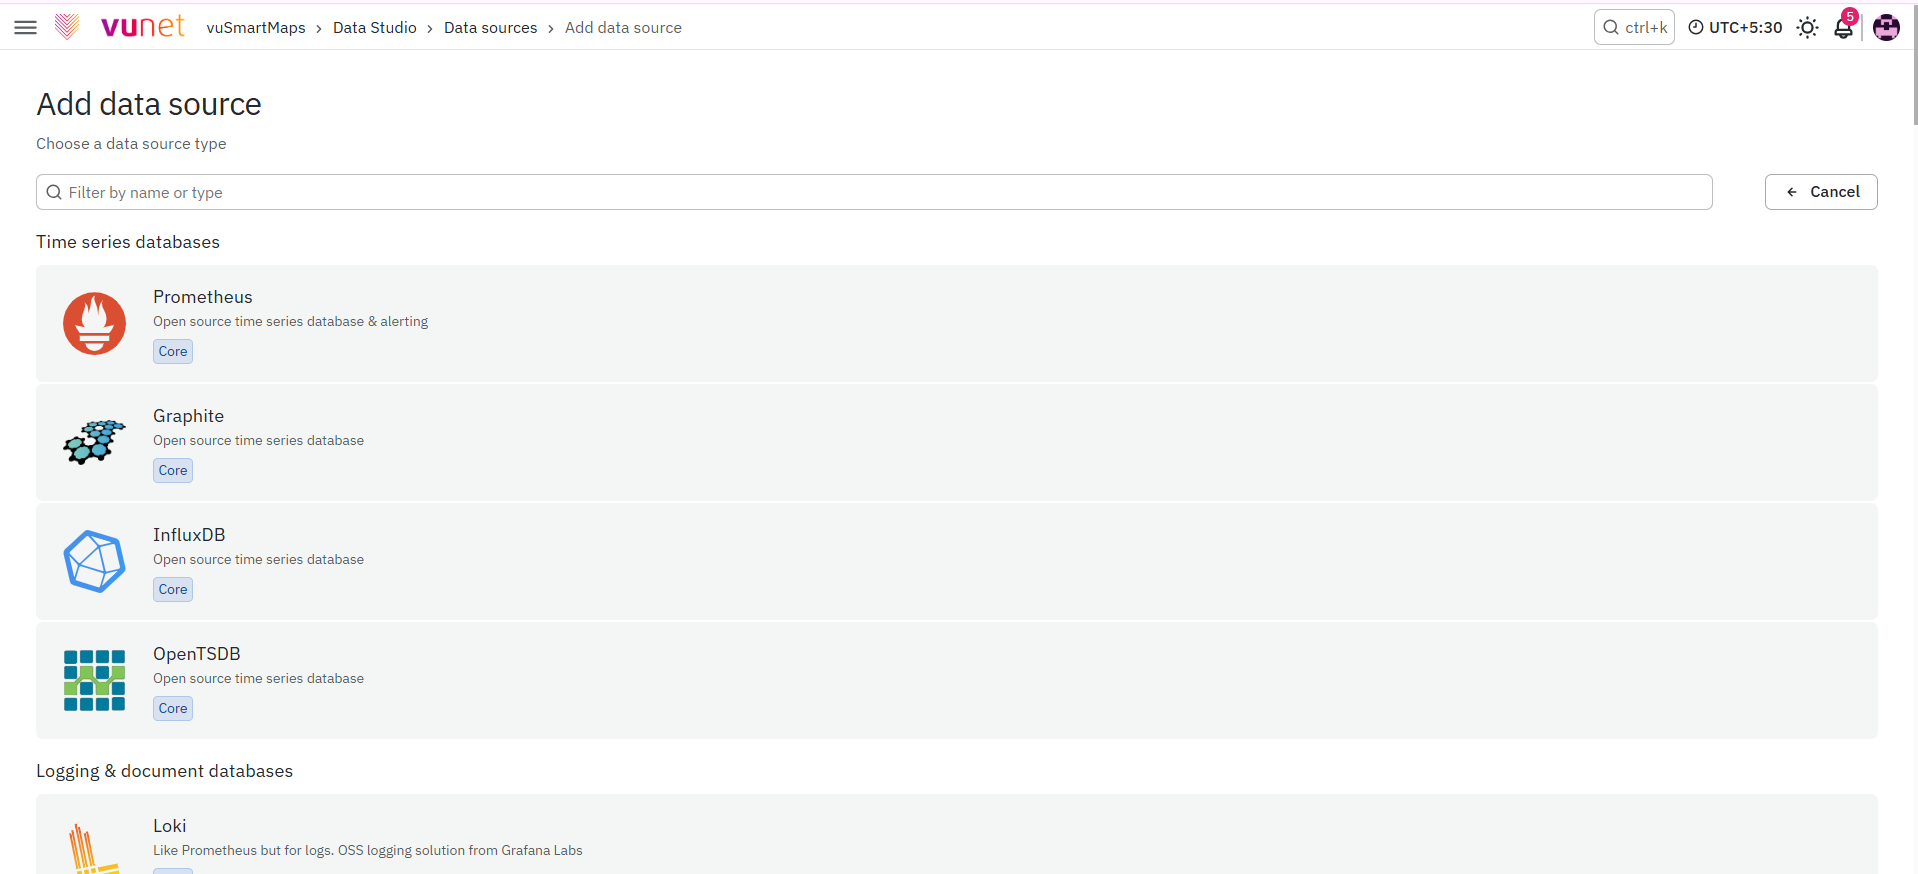
- Open the Data Sources landing page.
- Click Add new data source.
- In the search dialog, enter the name of the data source.
- Filter the options by data source, if required.
- Select the required data source.
- Configure the selected data source using its specific configuration fields.
- Save the data source configuration.
For specific setup instructions, refer to the relevant data source section: Elasticsearch, PostgreSQL, or HyperScale.
Configure an Elasticsearch Data Source
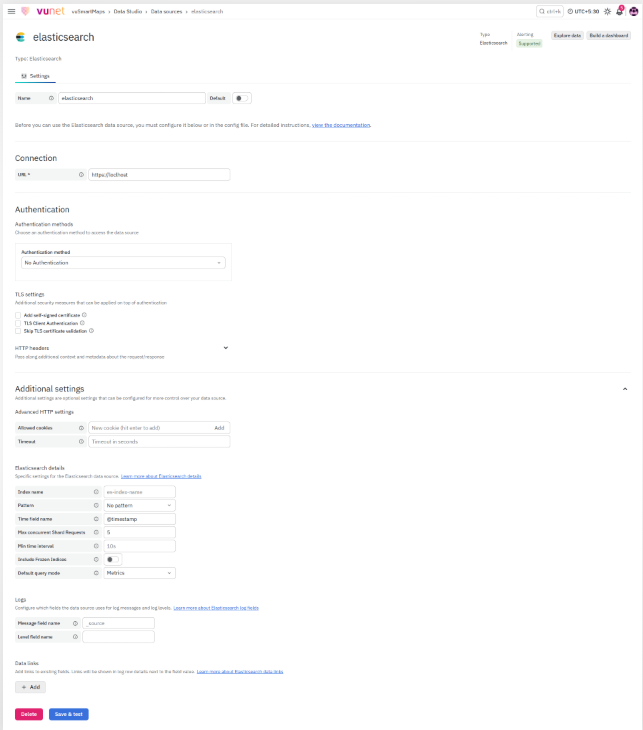
Use Elasticsearch when logs or metrics are stored in Elasticsearch and need to be queried or visualized in vuSmartMaps.
- Select Elasticsearch while adding a new data source.
- Enter the Name of the data source. This name is used in panels and queries. Examples include
elastic-1andElasticsearch_metrics. - Use the Default toggle if this should be the default data source for panels or Explore.
- Enter the URL of the Elasticsearch server.
- For a local server, use
http://localhost:9200. - For a network server, enter the server URL with the port, for example
http://Elasticsearch.example.orgname:9200.
- For a local server, use
- Select the required Authentication method from the available authentication options.
- Add HTTP headers if required.
- Click + Add header.
- Enter the Header.
- Enter the Value.
- Configure Elasticsearch details.
- Enter the Index name.
- Select the Pattern.
- Enter the Time field name.
- Configure Max concurrent shard requests.
- Configure Min time interval.
- Enable X-Pack enabled, if required.
- Configure Logs.
- Enter the Message field name.
- Enter the Level field name.
- Configure Data links, if required.
- Click + Add.
- Enter the Field.
- Enter the URL/query.
- Enter the optional URL Label.
- Enable Internal link, if required.
- Save the configuration.
- The Index name can use a time pattern or wildcard.
- A time pattern example is
logs-YYYY.MM.DDfor indices such aslogs-2023.01.01. - A wildcard example is
logs-*for indices such aslogs-v1,logs-v2, and similar names. - Pattern options include no pattern, hourly, daily, weekly, monthly, and yearly.
- The default time field name is
@timestamp. - The default value for Max concurrent shard requests is 5.
- X-Pack enabled provides additional aggregations such as Rate and Top Metrics in the query editor.
- If a log level label is configured, that label is used to determine the log level and color of each log line.
- If no level label is available, vuSmartMaps tries to infer the log level from supported expressions.
- The first matching expression determines the log level.
- If vuSmartMaps cannot infer the log level, the log is shown with an unknown log level.
- Internal data links support only tracing data sources.
Configure a PostgreSQL Data Source
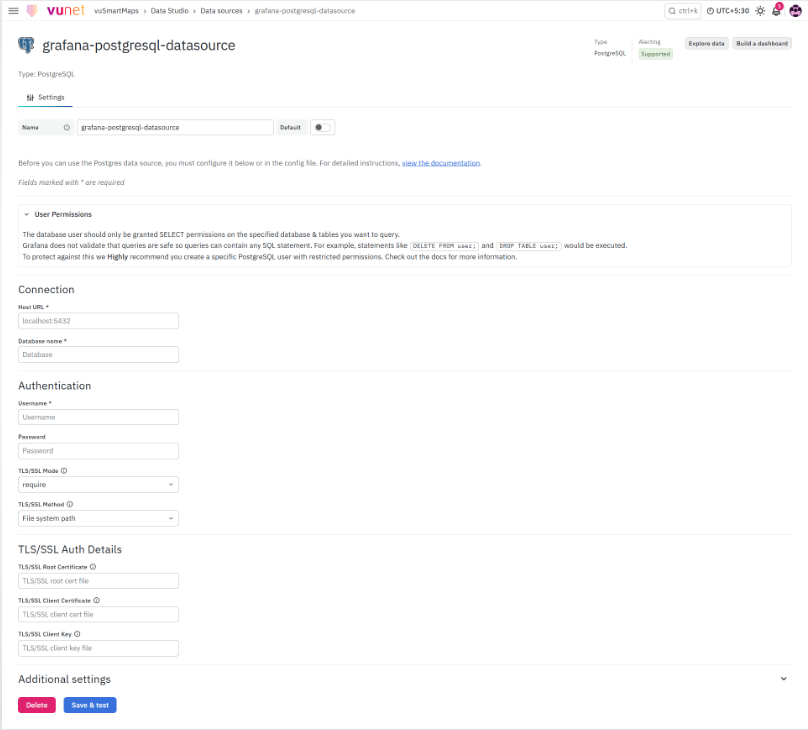
Use PostgreSQL when users need to query and visualize data from a PostgreSQL-compatible database.
- Select PostgreSQL while adding a new data source.
- Enter the Name of the data source. This name is used in panels and queries.
- Use the Default toggle if this should be the default data source for panels or Explore.
- Configure PostgreSQL Connection details.
- Enter the Host. This is the IP address or hostname and optional port. Do not include the database name.
- Enter the Database name.
- Enter the User.
- Enter the Password.
- Select TLS/SSL Mode.
- Configure Connection limits.
- Set Max open connections. Default is 100.
- Set Max idle connections. Default is 100.
- Use Auto (max idle) if the maximum idle connections should be set to the maximum open connections. Default is true.
- Set Max lifetime. Default is 14400 seconds, or 4 hours.
- Configure PostgreSQL details.
- Select the Version.
- Enable TimescaleDB, if required.
- Set Min time interval.
- Save the configuration.
- TLS/SSL Mode controls how a secure TLS/SSL TCP/IP connection is negotiated with the server.
- Version determines the functions available in the query builder.
- TimescaleDB is a time-series database built as a PostgreSQL extension.
- When TimescaleDB is enabled, vuSmartMaps displays TimescaleDB-specific aggregate functions in the query builder.
- Min time interval is a lower limit for automatic group-by time interval.
- The source document recommends setting Min time interval to the write frequency. For example, use
1mif data is written every minute.
Configure a HyperScale Data Source
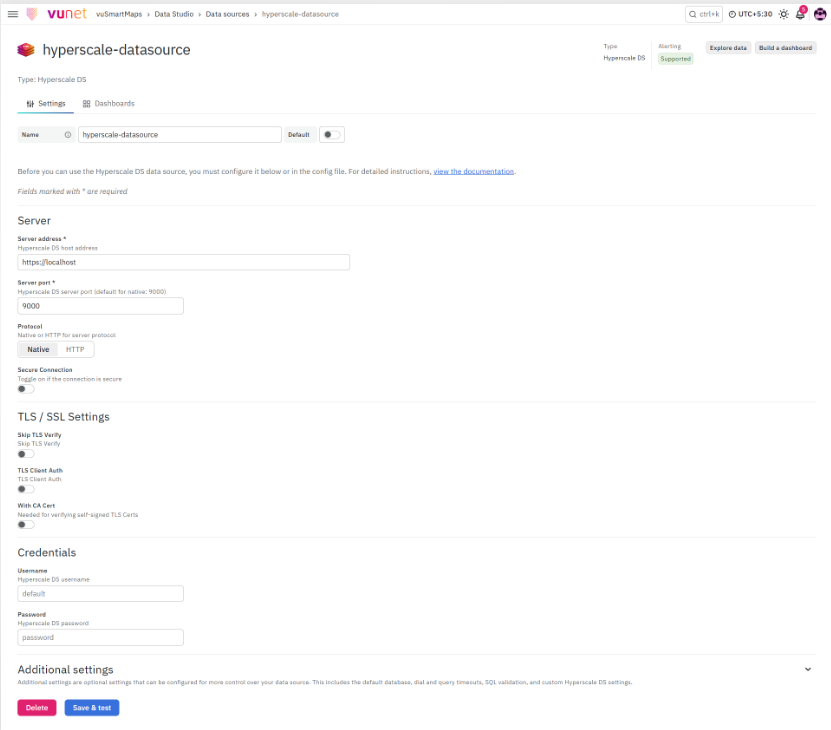
Use HyperScale when users need a high-performance columnar backend database for real-time analytics and reporting on large datasets.
- Select HyperScale while adding a new data source.
- Enter the Name of the data source. This name is used in panels and queries.
- Use the Default toggle if this should be the default data source for panels or Explore.
- Configure Server details.
- Enter the Server Address.
- Enter the Server Port.
- Select the Protocol.
- Enable Secure Connection, if required.
- Enter the HTTP URL Path, if required.
- Add HTTP headers if required.
- Click + Add header.
- Enter the Header.
- Enter the Value.
- Configure TLS/SSL Settings.
- Enable Skip TLS Verify, if required.
- Enable TLS Client Auth, if required.
- Provide Client Cert.
- Provide Client Key.
- Enable With CA Cert, if required.
- Provide CA Cert.
- Configure Credentials.
- Enter the Username.
- Enter the Password.
- Configure Additional settings, if required.
- Set Default database.
- Set Default table.
- Set Dial Timeout (seconds).
- Set Query Timeout (seconds).
- Enable Validate SQL, if required.
- Configure Logs configuration, if required.
- Set Default log database.
- Set Default log table.
- Set Default columns.
- Enable Use OTel, if required.
- Set Time column.
- Set Log Level column.
- Set Log Message column.
- Configure Traces configuration, if required.
- Set Default trace database.
- Set Default trace table.
- Set Default columns.
- Enable Use OTel, if required.
- Set Trace ID column.
- Set Span ID column.
- Set Operation Name column.
- Set Parent Span ID column.
- Set Service Name column.
- Set Duration Time column.
- Set Duration Unit.
- Set Start Time column.
- Set Tags column.
- Set Service Tags column.
- Configure Custom Settings, if required.
- Click + Add custom setting.
- Enter Setting.
- Enter Value.
- Save the configuration.
- Server Port can be
8123for HTTP protocol or9000for other protocol. - Protocol can be Native or HTTP.
- Secure Connection should be enabled when the connection is secure.
- HTTP headers pass additional context and metadata about the request or response.
- Additional settings are optional and provide more control over the data source.
- Default columns for log queries can be left empty to disable them.
- Default columns for trace queries can be left empty to disable them.
- Use OTel enables OpenTelemetry schema versioning.
What Happens After the Steps
After a data source is configured, it becomes available in vuSmartMaps. Users can then:
- Use Explore to query the data interactively.
- View Explore results as a graph and a table.
- Use Build a Dashboard to create dashboard panels.
- Use the data source in visualizations.
- Search and sort configured data sources from the landing page.
- Select a configured data source while creating panels or using Explore.
- Use the default data source automatically when configured as default.
Configured data sources help users integrate, query, and visualize data from Elasticsearch, PostgreSQL, and HyperScale.
Troubleshooting
-
Issue: Data source is difficult to find
- Possible cause: Many data sources may be configured.
- Solution: Use the search and sort functionality on the Data Sources landing page.
-
Issue: User cannot visualize data in dashboards
- Possible cause: A data source may not be configured yet.
- Solution: Add and configure the required data source before creating dashboards.
-
Issue: Explore does not show expected data
- Possible cause: The query or data source configuration may not match the source structure
- Solution: Review the data source configuration and use the query editor designed for that source.
-
Issue: Elasticsearch index data is not found
- Possible cause: The index name, time pattern, wildcard, or pattern setting may not match the actual Elasticsearch indices.
- Solution: Check the index naming pattern. Use a time pattern such as
logs-YYYY.MM.DDfor daily indices, or a wildcard such aslogs-*for a consistent prefix.
-
Issue: Elasticsearch logs show unknown log level
- Possible cause: The level field name may not be configured, or vuSmartMaps cannot infer the log level from supported expressions.
- Solution: Configure the Level field name with the correct log level or severity field.
-
Issue: PostgreSQL connection fails
- Possible cause: Host, database, user, password, or TLS/SSL mode may be incorrect.
- Solution: Review PostgreSQL connection details. Ensure the Host contains only the IP address or hostname and optional port, without the database name.
-
Issue: PostgreSQL query builder does not show expected functions
- Possible cause: PostgreSQL version or TimescaleDB setting may not be configured correctly
- Solution: Check the Version setting. Enable TimescaleDB if TimescaleDB-specific aggregate functions are required.
-
Issue: HyperScale connection does not work
- Possible cause: Server address, port, protocol, secure connection, credentials, or TLS/SSL settings may be incorrect.
- Solution: Verify the HyperScale server details. Use port
8123for HTTP protocol or9000for other protocol, based on the source document.
-
Issue: HyperScale logs or traces do not appear as expected
- Possible cause: Default log or trace database, table, or columns may not be configured
- Solution: Review the logs and traces configuration. Configure the required default database, table, and columns. Leave default columns empty only when disabling the setting is intended.
FAQs
What are Data Sources in vuSmartMaps?
Data Sources allow vuSmartMaps to connect with different databases and systems so users can query, explore, and visualize data. Each data source has a query editor designed for that source type.
Which data source types are supported?
The current version supports three data source types:
- Elasticsearch
- PostgreSQL
- HyperScale
What can I do after configuring a data source?
After configuring a data source, users can use Explore to query data interactively and view results as a graph and table. Users can also build dashboard panels using data from the configured source.
Where can I manage Data Sources?
Data Sources can be managed from: Data Studio > Data Source
The page shows all configured data sources and provides options such as Add new data source, Explore, Build a Dashboard, search, and sort.
What is the difference between Explore and Build a Dashboard?
Explore is used for quick, interactive data analysis without creating a dashboard. Build a Dashboard is used when users want to create dashboard panels and visualizations from the selected data source.
