NG 2.15
Overview
The NG 2.15.0 release introduces new O11ySources, expanded observability capabilities, and key platform enhancements to improve monitoring, security, and user experience. Alert Pop-Ups and WhatsApp integrations now offer customizable notifications and alerts. For ITSM and MS Teams integrations, we now support multiple authentication methods, including OAuth2, Basic Auth, and No Auth, providing greater flexibility for integration setups. Browser RUM for monitoring real user experience and Synthetic Monitoring to improve performance baseline tracking. Hyperscale updates bring better transaction summarization and JSON data handling, while UTM enhancements now preserve node layouts during upgrades. Application vulnerability fixes enhance security and compliance. User login tracking and APM improvements ensure better visibility and monitoring of applications and user activity. These updates make vuSmartMaps more secure, efficient, and intuitive, delivering enhanced observability and proactive issue resolution across all critical areas.
Key Highlights
- Alert Pop-up: A new pop-up option is now available for alerts. Users can configure specific rules to trigger on-screen notifications, enabling immediate awareness and faster action. These rules can be set at system level (Global setting) and can be overridden by the user with user-specific pop-up settings in the profile section.
- Configurations & Preferences: Configurations & Preferences Enhancements: Configuring global alert pop-up settings, support for WhatsApp custom integrations along with existing official Meta-API, OAuth2 support for Jira and ServiceNow integrations, and MS Teams integration with OAuth for seamless connectivity.
- Accessing vuSmartMaps - Logging in: Multi-Factor Authentication (MFA) support is now available in NG. This enhances login security with OTP verification via SMS, email, or authenticator apps.
- Summary Storyboard: Provides CXO and IT Ops teams with a high-level view of Journey, Application, Infrastructure, and Network performance, featuring summary cards, business insights, and the vuRI Score for proactive alert management.
- Definitions: Support for monitoring Oracle Cloud Infrastructure (OCI) has been introduced, bringing an OCI Credentials section in Definitions. This enables users to centrally manage and integrate OCI credentials in vuSmartMaps, enhancing security, efficiency, and observability without manual configurations.
- ContextStreams: ContextStreams debugging now offers improved log visibility with reverse ordering and color-coded log levels. Pipeline management has been enhanced with an Edit Pipeline button, Start/Stop controls, and critical bug fixes for better usability.
- vuApp360: vuApp360 now offers enhanced application observability with automatic multi-service detection in a single JVM, enriched trace context through HTTP header capture, and configurable noise reduction to focus on critical traces and optimize performance analysis.
- Browser RUM: This provides real-time insights into user interactions, tracking page load times, API performance, and Web Vitals to enable proactive issue detection and performance optimization for a seamless digital experience.
- Synthetic Browser Journey Monitoring: Synthetic Browser Journey Monitoring simulates user interactions to track performance, errors, and response times, helping teams identify issues, optimize workflows, and ensure a seamless digital experience.
- Alerts: Alerts notification channels will now use the System Default timezone (configured in the About page) instead of UTC, ensuring alert details are displayed in the customer-specific timezone for easier interpretation.
- UTM: UTM now preserves node positions during upgrades and prevents graph resets when adding new nodes, ensuring a consistent layout and easier management of complex configurations.
- O11ySource - Seamless Upgrades (Phase 1): Each O11ySource now displays a version number to help users easily track updates and changes.
- WhatsApp Chatbot Integration: Enhancements to the WhatsApp Chatbot Integration now enable users to receive real-time transaction queries, dynamic responses, and alert analysis, ensuring faster insights and a better user experience.
- Hyperscale: Hyperscale Enhancements improve transaction summarization with better duration and status tracking, while JSON data type support simplifies dynamic data storage and management for greater efficiency.
- User Login Tracking Dashboard: This now includes detailed user activity insights, providing a comprehensive view of logins for better monitoring and management.
- App Sec Vulnerabilities: This improves security and stability by upgrading Kubernetes and migrating key services to RHEL.
O11ySources Highlights
New O11ySources
We continue to expand our observability capabilities with new out-of-the-box O11ySources in NG 2.15.0, enhancing support for a wide range of use cases. These additions ensure comprehensive monitoring and data collection, providing deeper insights and improved visibility across diverse environments.
The new O11ySources include:
-
Apache HDFS: Apache Hadoop Distributed File System (HDFS) is a scalable, fault-tolerant storage system that handles large datasets across multiple machines. It ensures high-throughput data access, making it ideal for big data processing and analytics. With built-in data distribution and replication, HDFS improves performance, reliability, and seamless integration with monitoring tools.
-
Radware Load Balancer (SNMP): Radware Load Balancer is a network traffic management solution designed to optimize application delivery by distributing traffic across multiple servers. It supports SNMP (Simple Network Management Protocol) for monitoring performance, tracking real-time traffic statistics, and managing network events. This ensures high availability, load optimization, and improved fault tolerance in distributed environments.
-
Azure Load Balancer: Azure Load Balancer is a high-performance, scalable service that efficiently distributes incoming traffic across multiple virtual machines (VMs) or backend resources. It enhances high availability, reliability, and fault tolerance, ensuring seamless load distribution and optimized network performance for applications running in the cloud.
-
OCI API Gateway: OCI API Gateway is a fully managed, scalable, and secure service for exposing, managing, and monitoring APIs in Oracle Cloud Infrastructure (OCI). It supports routing, authentication, authorization, rate limiting, and logging, making it easier to integrate services and applications while ensuring security and performance optimization.
-
Browser RUM: Browser RUM provides full visibility into user interactions and digital transactions, helping businesses analyze user experience and real-time business impact. Capturing performance metrics across web applications enables teams to identify issues, optimize performance, and ensure a seamless user journey.
-
Synthetic Browser Journey Monitoring: Synthetic Browser Monitoring automatically simulates how a user interacts with a website. It runs pre-recorded actions at regular intervals to check how the site performs. It tracks things like loading speed, errors, and screenshots, and sends this information for analysis and display on dashboards.
Complete list of O11ySources available in NG 2.15.0
| Active Directory | AIX Monitor | Amazon RDS | Apache |
| AWS ALB | AWS API Gateway | AWS Classic ELB | AWS CloudFront |
| AWS ElastiCache | AWS Network Firewall | AWS NLB | AWS Route53 |
| AWS S3 | AWS Transit Gateway | AWS VPC | AWS WAF |
| Azure API Management | Azure App Gateway | Azure EventHub | Cassandra |
| Cisco Firewall | Cisco Router | Cisco Switch | Dell Switch |
| Device Availability | DNS Monitoring | F5 Load Balancer | Fortinet Firewall |
| GKE | HAProxy | HPUX Monitor | HTTP Poller |
| IBM HTTP Server | IBM MQ | IBM WAS | IIS |
| JBoss | JVM Monitor | Kafka | Keycloak |
| KeyDB | Kong API Gateway | Kubernetes | Linux Monitor |
| Log Collector | MariaDB | MicroSoft DFS | MongoDB |
| MSSQL | MYSQL | NetFlow | Nginx |
| Nutanix | OHS | Oracle | Palo Alto Firewall |
| PostgreSQL | RabbitMQ | Rancher | Redis |
| Service Availability | Service Monitor | SFTP Monitor | SNMP Polling |
| Solaris Monitor | SQL Data Collector | SSL Certificate Monitor | Syslog |
| Task Scheduler | Tomcat | Traces | URL Availability |
| Vault | vSphere | Weblogic | Windows Events Logs |
| Windows Monitor | |||
New O11ySources in NG 2.15.0 | |||
| Apache HDFS | Azure Load Balancer | Browser RUM | OCI API Gateway |
| Radware Load Balancer | Synthetic Browser Journey Monitoring | ||
Enhancements to Existing O11ySources
- IBM MQ 1.1: Log collection is now supported using vulogagent, which works better in setups that have more than one agent.
- Linux Monitor 1: We improved how system metrics are handled and added new dashboard panels to show CPU idle time and IO wait time more clearly.
- OHS 2: Switched to a new agent (vuappagent) for better data collection. Also added log collection using Logbeat and made changes to work with agent version 3.0.6.
- Log Collector 2: Now supports collecting logs from AIX and Solaris systems using vulogagent. This also supports multiple agents working together.
- WebLogic 2: Started collecting logs for error and performance tracking. New metrics and dashboards have been added. Log data handling is also improved for better insights.
- Nginx 1: The setup guide was updated with simpler and clearer steps to help with data collection and firewall settings.
- General – Vublock Script: The create_vublock.py script is updated to support multiple agents. It now shows agent versions clearly and follows the latest config format.
- Synthetic Monitor 1.2: We removed extra Kafka topics that were not needed. This helps reduce the system’s load and keeps things cleaner during setup.
- Oracle 1: We updated the Oracle database driver to work better. Also made some queries faster and added support for multiple log paths to collect more data.
- Kafka 1: Added new metrics to help monitor Kafka data and message flow better.
- Apache HDFS 1: Improved the setup script and updated the master sheet to reflect those changes.
- MSSQL 1: Removed some faulty CPU alerts and panels that were showing wrong data.
- Browser RUM 1: Updated the dashboards, alerts, and data tables to give a better view of how users are experiencing your app or website.
- Windows Monitor 1: Changed how alerts work—from checking at the service level to checking at the server level—so alerts are now more accurate.
- General – Vublock-store Enhancements: Optional fields are now handled better in reports. Unused data sources (like Service Availability) were removed. The function to create an O11ySource was improved to track versions and support multiple agents.
- Beta Tag Updates: Updated the beta labels for:
- Nginx
- MongoDB
- Microsoft DFS
- JBoss
Bug Fixes in O11ySources
- IIS 1.1: Fixed the log time by adding the missing timezone. Improved how logs and metrics are handled. Dashboard panels were updated, and the 'message' field was kept to ensure logs show correctly. Changes were added to the master sheet.
- WebLogic 2: Extra spaces in the data were causing problems, so we added a fix to clean up the data.
- Windows Monitor 1.1: When viewing over 12 hours, some server names appeared more than once. We fixed it so each server shows only once now.
- General – Vublock-store: We fixed an issue where it expected setup files for agents not even in use. Now it only picks what’s needed. Also fixed some chart and vublock creation bugs.
- MSSQL 1: Changed dashboard folder names to capital letters. Fixed panels that showed "NaN" when data wasn’t available. Also corrected a small query error.
- Synthetic Monitor 1.1: Now shows the correct screenshot path depending on the environment. Dashboard name was changed to something clearer, and default time range is now 6 hours instead of 30 days.
- Synthetic Monitor 1.2: Improved how we identify probes. Now we don’t rely on fixed names, so data is more accurate. No changes were needed in dashboards or alerts.
- URL Availability 1: Fixed a small issue in the setup file. Also, the "+" button that was missing from the UI is now visible and working.
- OCI API Gateway 1: Fixed a mistake where the wrong key was used in the setup file. It's now corrected.
- Traces 1: Made the final setup changes and fixed a small issue with how trace maps display data.
- Kubernetes 1.0, 1.1: Fixed mismatched CPU and memory numbers in dashboards. The agent now works with secure (SSL) Kafka connections.
- Oracle 1: Some panel numbers were wrong because of how grouping was done. We fixed this so that total values and counts are shown correctly.
- Syslog 1: The table name used for saving logs was incorrect. It has now been corrected to match the final version.
Improvements/Technology Upgrades in the Release
Configurations & Preferences
Alert Pop-Up Configuration
Global Alert Pop-Up Configuration
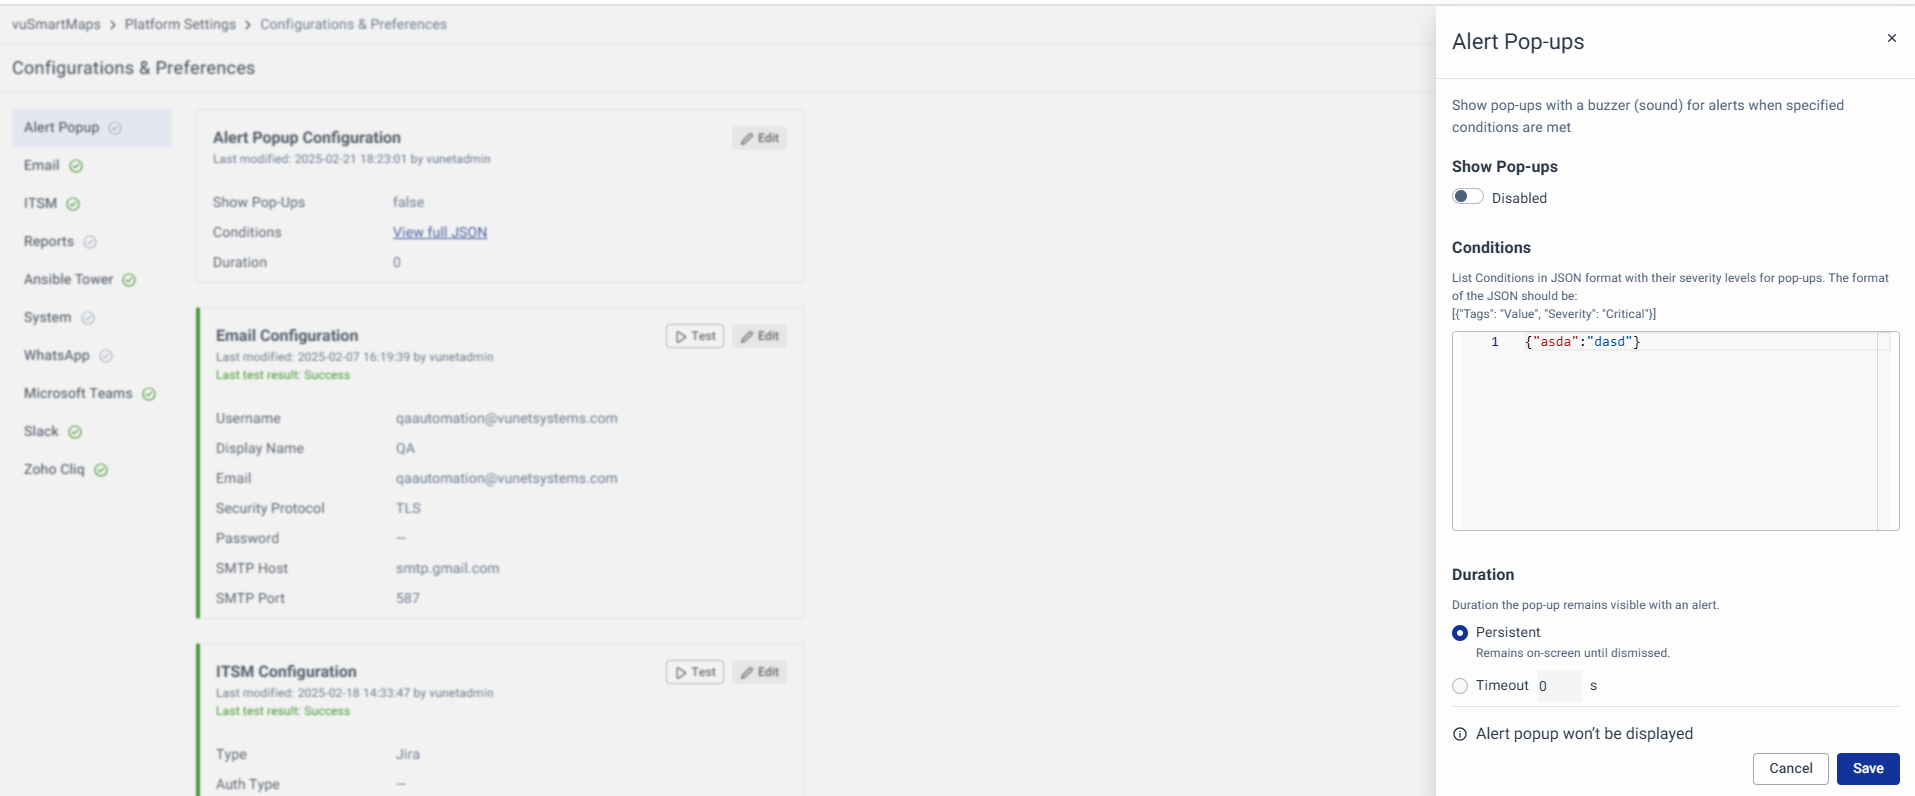
Administrators can now configure system-wide alert notifications and buzzer sounds for all users with the required permissions. Alerts can be categorized by severity, defined using JSON-based conditions, and set to appear persistently or for a custom duration, ensuring a consistent and efficient alerting system. Learn more about this in Configurations & Preferences - Alert Pop-ups Section.
Alert Pop-Up (User-Specific) Configuration
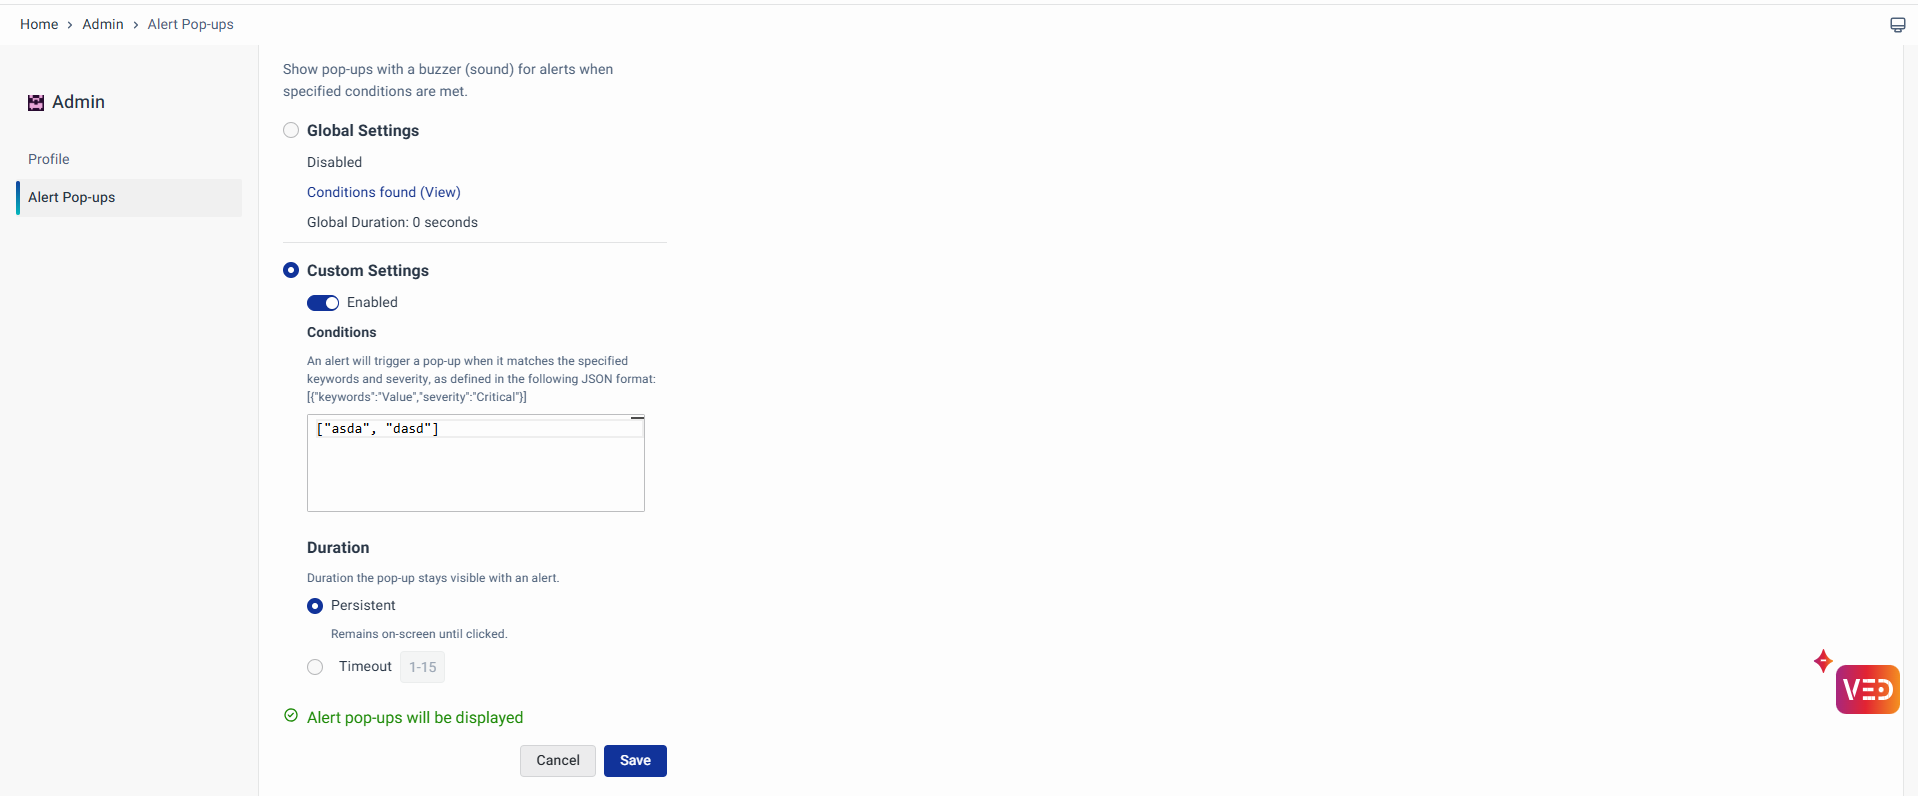
Users can now customize alert pop-ups with real-time notifications and buzzer sounds. Alerts can be tailored by severity, configured using JSON conditions, and set to appear persistently or for a defined duration, ensuring that important alerts are never missed. Learn more in the Accessing vuSmartMaps - Alert Pop-ups Section.
Benefits
- Real-Time Awareness: Ensures timely alerts for critical system events.
- Customizable Alerts: Users can define severity-based conditions for notifications.
- Flexible Display Options: Choose between persistent or auto-closing pop-ups.
- Improved Monitoring: Helps users quickly identify and respond to important alerts.
WhatsApp Configuration
The WhatsApp integration in vuSmartMaps now supports both the official Meta API and a new Custom Configuration option for sending alerts and notifications. The official Meta API allows message delivery through WhatsApp’s Business API by configuring Phone Number ID, Access Token, and Template Details. The Custom Configuration enables integration with third-party providers, allowing users to define API endpoints, authentication types (including OAuth2), and message templates. Users can also use advanced settings to create custom scripts for API payloads and authentication, ensuring secure and efficient message delivery. These enhancements offer greater flexibility and ensure reliable and timely alerts. Learn more in the Configurations & Preferences - WhatsApp Configuration Section.

Benefits
- Increased Flexibility: Supports custom integration with third-party providers, allowing organizations to choose the setup that fits their needs best.
- Enhanced Security: Supports OAuth2 authentication for secure message delivery, reducing risks associated with unauthorized access.
- Customizable Messaging: Advanced settings and custom scripts enable users to define personalized message templates and payloads, improving communication effectiveness.
- Simplified Integration: Centralized configuration options in Configuration & Preferences make it easy to manage and update WhatsApp settings without complex setups.
ITSM Configuration
vuSmartMaps now supports OAuth2 authentication for ITSM integrations with Jira and ServiceNow, enhancing security and flexibility. Users can configure Client ID, Client Secret, Token URL, Grant Type, and Scope to enable secure API communication for ticket creation and management. This update allows organizations to integrate ITSM systems seamlessly while ensuring secure data exchange and efficient incident handling. Learn more in the Configurations & Preferences - ITSM Integration Section.

Benefits
- Enhanced Security: OAuth2 ensures secure authentication for ITSM integrations.
- Seamless Integration: This simplifies connecting Jira and ServiceNow to vuSmartMaps.
- Efficient Incident Management: Enables secure and automated ticket creation and updates.
MS Teams Configuration
vuSmartMaps now supports OAuth2 authentication for MS Teams, ensuring secure and seamless integration for alerts and notifications. Users can configure the Client ID, Client Secret, Token URL, and Grant Type for a safe and efficient authentication process. Along with OAuth2, vuSmartMaps also offers Standard (Channel URL) configurations and Custom configurations, allowing flexible alert management. Advanced YAML-based customization enables payload transformations, field mappings, and severity conversions for a tailored experience. Learn more in the Configurations & Preferences - MS Teams Configuration section.

Benefits
- Secure Authentication: OAuth2 ensures a safe and reliable connection with MS Teams.
- Flexible Integration: Supports Channel URL and Custom API configurations.
- Advanced Customization: YAML-based settings allow tailored alert processing.
Accessing vuSmartMaps - Logging in
vuSmartMaps now supports Multi-Factor Authentication (MFA) to enhance login security. After entering their credentials, users must verify their identity using an SMS/Email-based OTP or an Authenticator app OTP. Admins can configure OTP expiration time and retry limits. If OTP delivery fails due to server issues, users receive a notification and can retry. For more details, explore Accessing vuSmartMaps - Logging in and the MFA Configuration Document..

Benefits
- Enhanced Security: MFA, if enabled, adds an extra layer of protection for users.
- Customizable Settings: Admins can adjust OTP expiration and retry limits.
- Improved User Experience: Clear notifications for OTP issues and retry options.
Definitions
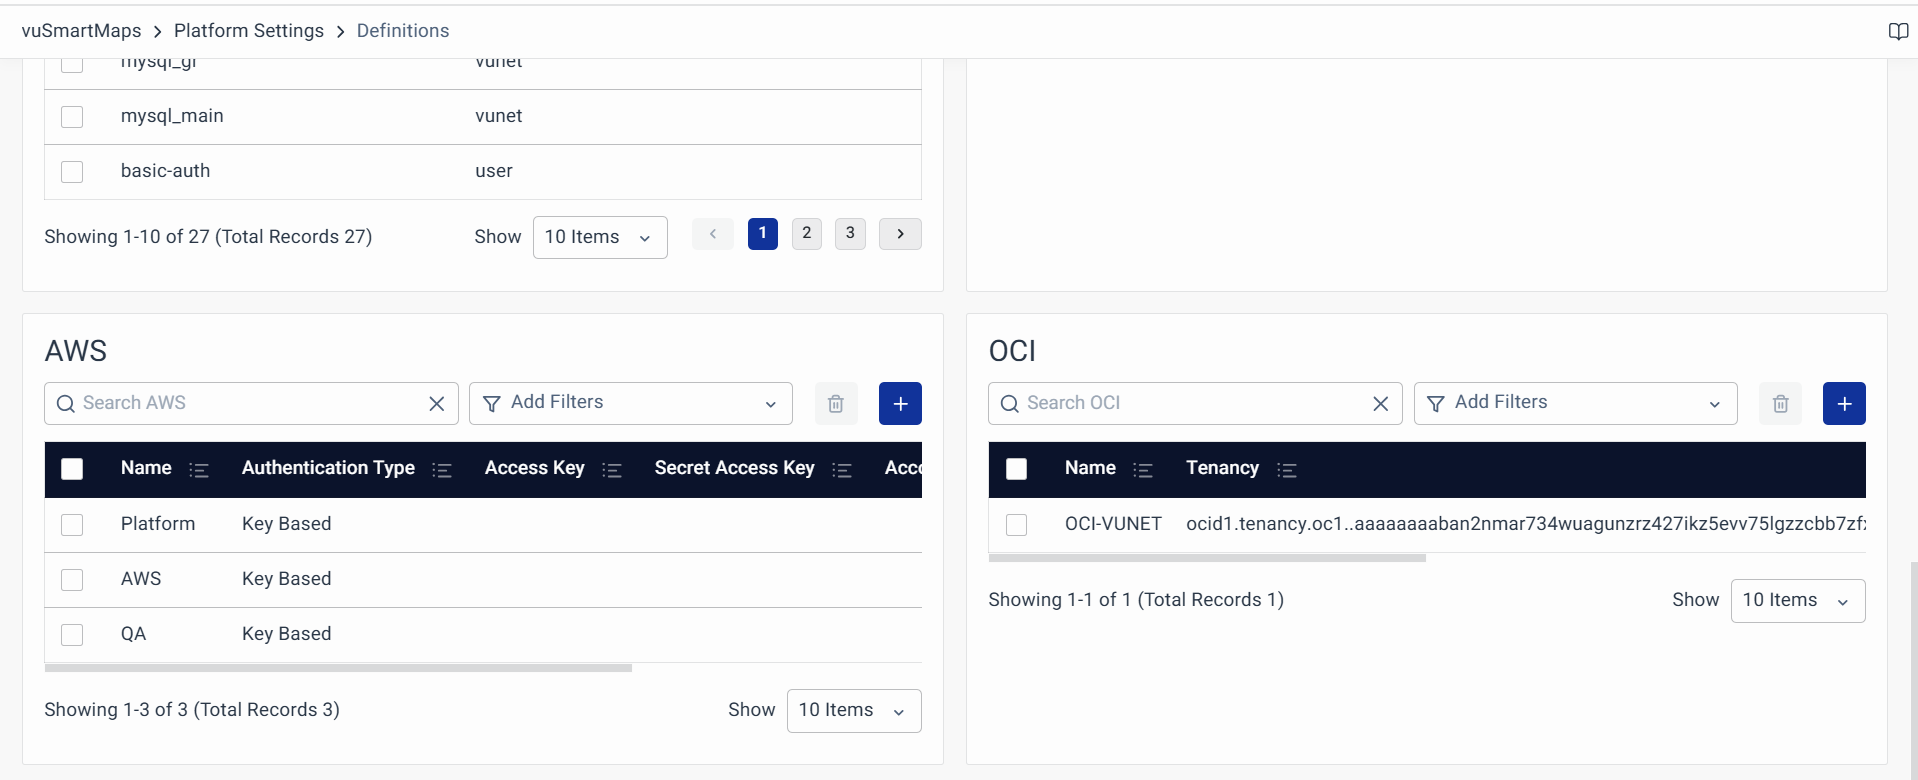
We have introduced Oracle Cloud Infrastructure (OCI) credentials support in vuSmartMaps as part of the Cloud Provider Credentials Management feature. This enhancement allows users to centrally store, manage, and utilize OCI credentials, ensuring a more secure and streamlined integration for Observability Sources (O11ySources) and storage-related configurations. Instead of manually configuring credentials each time, users can now define key OCI authentication parameters—such as Tenancy, User OCID, API Key Fingerprint, Private Key File, and Private Key Data—directly within vuSmartMaps. This simplifies credential handling, improves security, and reduces configuration efforts, allowing users to focus on observability and performance monitoring without worrying about manual setup complexities. For more details, explore the Definitions - Credentials.
Benefits
- Simplified Integration: Easily configure and manage OCI credentials within vuSmartMaps.
- Enhanced Security: Centralized storage minimizes security risks associated with manual credential handling.
- Reduced Manual Effort: Automates credential management, reducing time-consuming configurations.
- Improved Observability Setup: This ensures seamless monitoring of OCI-based infrastructure and storage.
ContextStreams
-
Enhanced Log Visibility
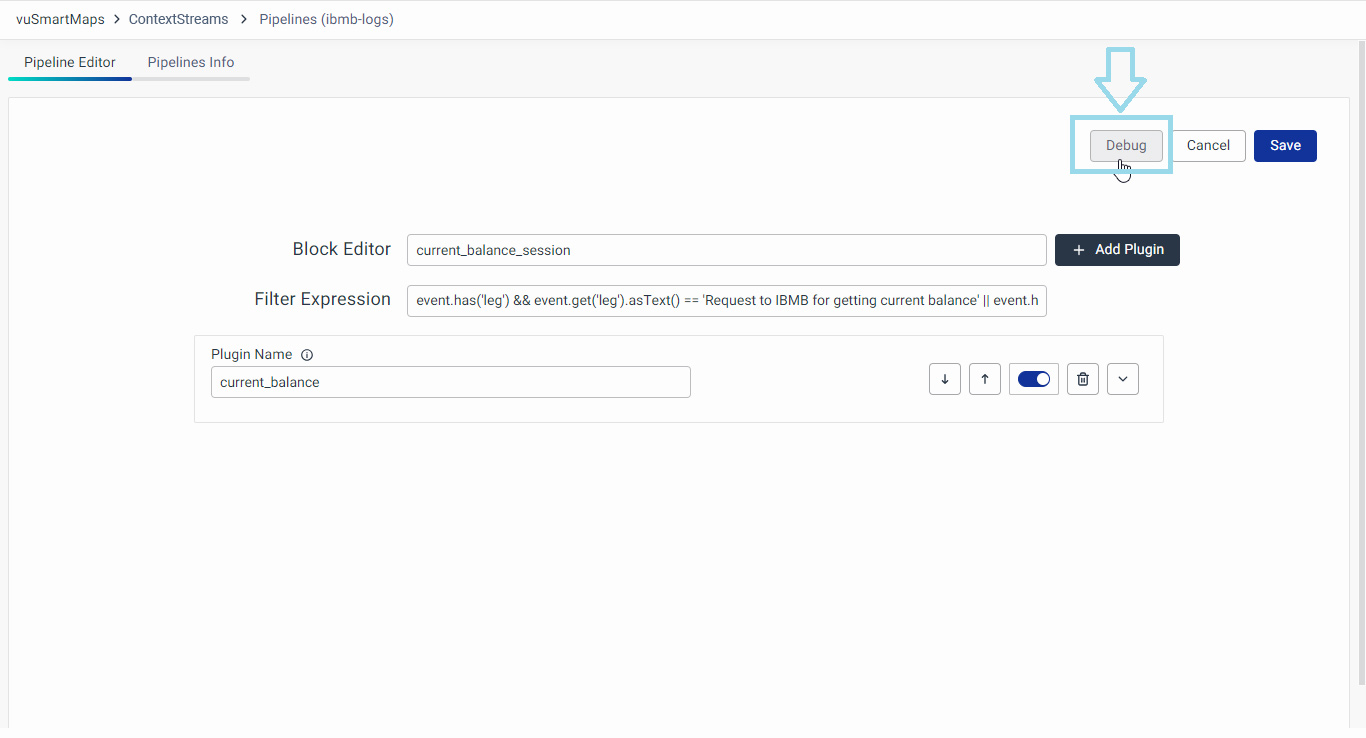
This update improves log management and readability in ContextStreams. Logs now appear in reverse order, showing the latest entries first for quick access. Additionally, color-coded log levels make it easier to track issues, with INFO logs in amber and ERROR logs in red for better visibility. Learn more about it in ContextStreams - Debugging ContextStreams.
- Improved Pipeline Management & Bug Fixes
Pipeline management is now more efficient, with a new Edit Pipeline button on the View Pipeline page for quick modifications and a Start/Stop button on the pipeline listing page for easy execution control. Additionally, a critical bug fix ensures error logs display correctly, improving log visibility and troubleshooting. These updates enhance usability, efficiency, and overall user experience in ContextStreams. Learn more about it in ContextStreams - Managing ContextStreams.

Benefits
- Improved Log Management: Logs are sorted first and color-coded with the latest entries for better readability.
- Enhanced Pipeline Control: Users can now edit pipelines directly and start/stop execution from the listing page.
- Increased Efficiency: Reduces the number of steps needed for common pipeline operations.
- Critical Bug Fixes: Ensures all error logs are correctly displayed, improving debugging and troubleshooting.
vuApp360
vuApp360 has been enhanced to offer deeper application observability and improved trace analysis, especially for complex environments with multiple services.
It now supports automatic detection of multiple services running within a single JVM, allowing each service to be tracked individually. Previously, all services were grouped under one name, making it hard to monitor and troubleshoot them separately. With this update, service names are automatically discovered and added as attributes, enabling better visibility and performance tracking for each service. For more details, explore vuApp360.
In addition, vuApp360 introduces Enhanced Trace Context and Noise Reduction features to sharpen observability:
-
You can now capture HTTP headers in traces, allowing key identifiers (like transaction or user IDs) to be extracted and used to correlate requests across services. This helps in tracing user journeys in distributed environments. For more details, explore vuApp360 documentation to capture HTTP Headers.
-
You can also exclude noisy or routine APIs (like health checks) from trace dashboards and ingestion. This can be configured using pre-sampling filters at the dashboard level or post-sampling in the O11ySource settings, reducing clutter and highlighting important traces. For more details, explore vuApp360-Dashboard documentation to understand how to exclude noise APIs.
These improvements make vuApp360 more powerful for analyzing, troubleshooting, and optimizing application performance.
Benefits
- Automatic Service Detection: Identifies and tracks multiple services within a JVM without manual setup.
- Improved Trace Clarity: Captures HTTP headers to correlate transactions and user sessions across services.
- Noise Reduction: Filters out routine API traces to keep dashboards clean and focused.
- Enhanced Visibility: Offers a clearer, more organized view of application behavior and performance.
- Simplified Troubleshooting: Speeds up root cause analysis by focusing on meaningful trace data.
Browser RUM (Real User Monitoring)
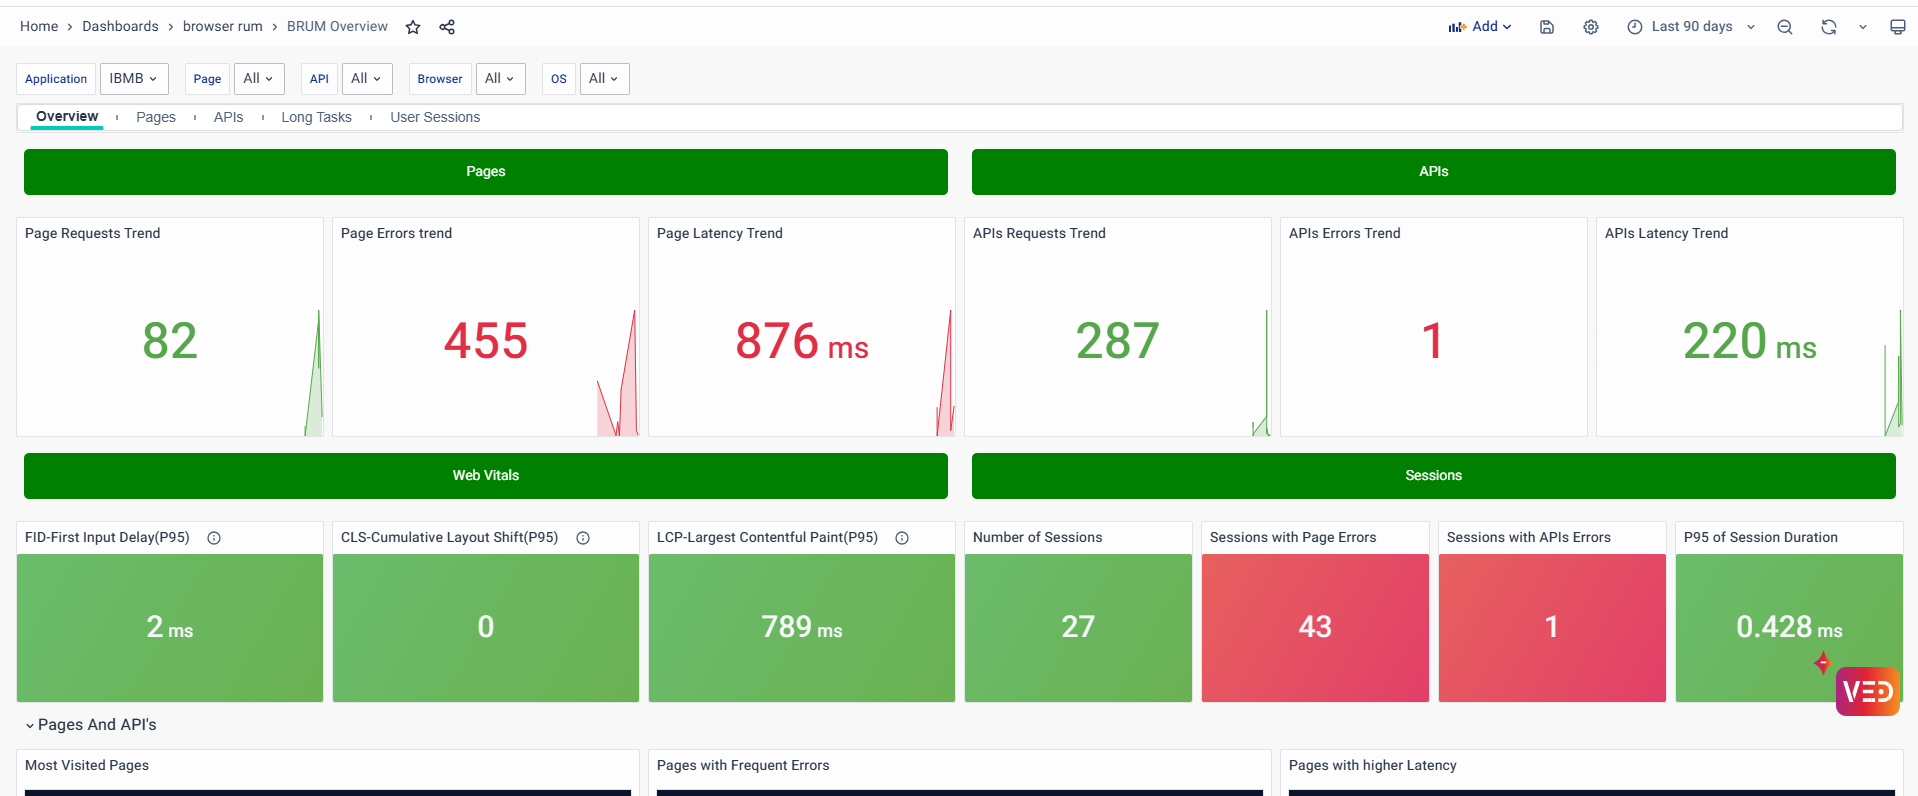
Browser RUM (Real User Monitoring) in vuSmartMaps provides real-time insights into user interactions, helping businesses track page load times, API performance, and key Web Vitals like LCP, FID, and CLS. It enables teams to quickly detect and resolve slow pages, API failures, and rendering delays, ensuring a seamless digital experience. With intuitive dashboards, real-time alerts, and seamless deployment across Host/VM, Docker, and Kubernetes, Browser RUM helps organizations shift from reactive troubleshooting to proactive performance optimization for a faster, more stable web experience. For more details, explore Browser RUM.
Benefits
- Real-Time Performance Insights: Monitor real user interactions and key performance metrics to ensure smooth web experiences.
- Faster Troubleshooting: Quickly detect and resolve performance issues such as high page load times, API failures, and rendering delays.
- Optimized User Experience: Track Web Vitals like LCP, FID, and CLS to enhance page responsiveness and stability.
- Comprehensive Dashboards: Gain visibility into application performance with session details, geographical trends, and API analytics.
Synthetic Browser Journey Monitoring
Synthetic Browser Journey Monitoring in vuSmartMaps enables proactive tracking of web application performance by simulating real user interactions. Executing synthetic journeys, it captures key performance metrics, errors, and response times, providing deep insights into application behavior. This monitoring ensures reliability, helping teams identify bottlenecks, detect failures, and optimize workflows before they impact actual users. With features like journey recording, real-time visualization, and customizable alerts, organizations can maintain seamless digital experiences, enhance operational efficiency, and ensure consistent application performance. For more details, explore Synthetic Browser Journey Monitoring.

Benefits
- Real-Time Observability: Live dashboards and alerts provide instant visibility into journey performance.
- Faster Issue Resolution: Actionable insights help reduce downtime and improve troubleshooting.
- Optimized Reliability: Ensures critical workflows function smoothly, enhancing application stability.
- Enhanced Decision-Making: Detailed analytics support informed optimizations and strategic planning.
Summary Storyboard
The Summary Storyboard provides CXO and IT Ops teams with a high-level view of Journey, Application, Infrastructure, and Network performance. It includes summary cards, detailed views, and business insights for efficient monitoring and issue detection. Key additions in Phase 1 include the vuSmartMaps Reliability Score (vuRI Score) for proactive alert management, along with insights from vuBJM, vuApp360, and Alert Summary Cards. This enhancement helps teams streamline decision-making and improve system reliability.
Benefits
- Comprehensive Overview: High-level insights across journeys, applications, infrastructure, and networks.
- Proactive Management: vuRI Score enables early detection of issues.
- Improved Decision-Making: Summary cards and insights simplify monitoring.
WhatsApp Chatbot Integration
The WhatsApp Chatbot has been upgraded to support real-time queries on transaction status and metrics from vuSmartMaps. Users can access information like transaction summaries, bank status, and trend comparisons directly through WhatsApp. The chatbot now supports a simplified login process, enhanced query handling, and dynamic responses based on user inputs. Additionally, it can analyze alert data and provide insights on trends, causes, and recommended actions without requiring manual steps. These enhancements ensure faster response times and a more intuitive user experience for users. For more details, explore WhatsApp Chatbot in NG.
Benefits
- Improved User Experience – Simplifies access to transaction and alert data through WhatsApp.
- Faster Responses – Real-time query handling and dynamic replies ensure quick information access.
- Deeper Insights – Provides detailed analysis of trends, alerts, and performance metrics.
Alerts
In Alerts, the Notification Channels will now use the System Default timezone instead of UTC to address customer feedback about the inconvenience of converting timezones manually. This change ensures that alerts are displayed in the local time of the system, making it easier for users to interpret and respond to notifications promptly.
Benefits
- Improved Usability: Eliminates the need for manual time zone conversions.
- Better User Experience: Alerts in the local system time for clarity.
- Efficient Monitoring: Helps users respond quickly to alerts.
UTM
The UTM has been improved to preserve node positions during environment upgrades and prevent graph resets when new nodes are added. Previously, user-arranged node layouts were lost during upgrades or when new nodes were included, causing inconvenience. The updated approach ensures that user-defined layouts are retained, making the management of large and complex configurations easier and more efficient.
Benefits
- Consistent Layouts: Prevents node positions from resetting during upgrades.
- Improved Usability: Saves time by eliminating the need to rearrange nodes manually.
- Efficient Management: Simplifies handling of large and complex configurations.
O11ySource - Seamless Upgrades (Phase 1)
O11ySources now show version numbers to help users track changes easily. This helps you know what changed during an upgrade, whether it’s a big update or a small one. The version number is shown clearly in the UI, and the system keeps track of these changes in the background.

Benefits
- Easy to Track Changes: Know what’s new or different after an upgrade.
- Clear Version Info: Each O11ySource shows a version number.
- Better Visibility: Understand if it’s a small update or a major change.
Hyperscale
Transaction Summarization in Hyperscale
The summarization process in Hyperscale has been improved with new fields to track transaction duration and status more accurately. A modified approach for summarizing stitched transactions has been introduced, making data analysis more reliable and efficient. Additionally, users can now choose between two methods for determining transaction status, offering greater flexibility.
Benefits
- Enhanced Accuracy: Provides more precise insights into transaction performance.
- Improved Efficiency: Optimizes data summarization for faster analysis.
- Greater Flexibility: It offers options for customizing how transaction status is determined.
JSON Data Type Support in Hyperscale
The new JSON data type in Hyperscale allows the storage of dynamic fields and values in a single column without needing to define all columns and their types in advance. This approach prevents issues like dense storage, excessive column files, and data type conflicts, making data management simpler and more efficient.
Benefits
- Simplified Data Management: Stores dynamic data without predefined columns.
- Efficient Storage: Prevents excessive storage use and file creation.
- Improved Compatibility: It handles different data types smoothly.
User Login Tracking Dashboard
The User Login Details Dashboard has been enhanced with additional information about user activity and will now be packaged with NG. It includes details such as first name, last name, email, username, and last login time, providing a comprehensive view of user access patterns. This improvement helps monitor and manage user activity effectively.
Benefits
- Enhanced Visibility: Offers detailed insights into user login activities.
- Improved Security: Helps track and manage access effectively.
- Simplified Monitoring: Centralizes user activity information for easy analysis.
App Sec Vulnerabilities
The Kubernetes (K8S) environment has been upgraded to improve security, and Redis, Telenode, and vuRcaAirflow have been migrated to RHEL. This transition to RHEL enhances security and stability, providing a more secure platform for managing applications and data.
Benefits
- Enhanced Security: Strengthens protection against vulnerabilities.
- Improved Stability: Ensures a reliable environment for applications.
- Better Compliance: Aligns with security best practices.
Known Issues
| S. No. | Ticket No. | Issue | Severity |
|---|---|---|---|
| 1 | 5231 | Kafka cluster id is different from the one from that of zookeeper | S1 |
| 2 | 5055 | CH TTL: TTL Is getting struck, and parts to do aren't getting updated | S2 |
| 3 | 4947 | User Management: Help text is not proper in User role | S2 |
| 4 | 5138 | Log Analytics: Save button should be disabled for the role who doesn't have access to the table | S2 |
| 5 | 5273 | User Management:Write access to a data model should not be downgraded by assigning read access to an alert | S2 |
| 6 | 5474 | ContextStreams Default Dashboard having errors. | S2 |
| 7 | 5468 | Failure of the View All button in the notification bell icon module. | S2 |
| 8 | 5452 | MS Teams and ITSM Preference (0Auth 2.0)- Test Failing & UI Error ('str' object has no attribute 'get') when Advanced Configuration contains random values. PFA for more details. | S2 |
| 9 | 5409 | Dashbords: Enable users to review detailed information on triggered alerts directly from the "Active Summary" panel to Alert console. | S2 |
| 10 | 5338 | Report Builder: Creating a Reports using Chart is failing | S2 |
| 11 | 5299 | Report: Sorting on Name column is not working properly. | S2 |
| 12 | 5334 | [Kafka-Perf] Kafka lag is observed in CH (For windows event logs) | S2 |
| 13 | 4963 | Alert Rules: The Auto Remediation column should be available in the Alert Console and all the Alert Channel details | S3 |
| 14 | 5132 | Dashboards: Shortened URL results in a "Page Not Found" error when accessed from the dashboard. | S3 |
| 15 | 5130 | UTM: The Non existing Data model still shows up in UTM | S3 |
| 16 | 5184 | ContextStream- Unable to navigate to particular data by specifying the data preview block number. | S3 |
| 17 | 5397 | P95 Latency block showing NaN in the AWS ALB Dashboard. | S3 |
| 18 | 5390 | P95 Latency block showing NaN in the AWS ALB Dashboard. | S3 |
| 19 | 5362 | LDAP configuration: Editing an LDAP-imported user role creates a new role instead of updating the existing one | S3 |
| 20 | 5313 | Report: Target and Avg_CPU name should be corrected in downloaded reports | S3 |
| 21 | 5312 | Data Model: Duplicate field names are appearing in the fields dropdown. | S3 |
| 22 | 5268 | Export All Functionality in Definitions > Email/Mobile Group Module Does Not Match Column Order Displayed in GUI | S3 |
| 23 | 5311 | Data Model: Not able to see full table name in table listing drop down | S4 |
| 24 | 5144 | Report Generation: There is no < / > / == / != filter for download count field in Generated Reports tab | S4 |
| 25 | 5452 | MS Teams and ITSM Preference (0Auth 2.0)- Test Failing & UI Error ('str' object has no attribute 'get') when Advanced Configuration contains random values. PFA for more details. | S4 |
| 26 | 5432 | Summary Dashboard: Triggered alerts are not shown under respective application | S4 |
| 27 | 5431 | Summary Dashboard: The Application Panel is not showing up the Application which are detected in vuapp360 Dashboard | S4 |
| 28 | 5430 | Summary Dashboard: The Application Panel is not showing up the Application which are detected in vuapp360 Dashboard | S4 |
| 29 | 5274 | License Management: User is able to access all the modules even if the license is expired | S4 |
*S5, S4, S3 & S2 issues will be prioritized in the NG 3.0 release. S1 - Critical. S2 - Major, S3 - Moderate, S4 - Minor, S5 - Cosmetic.
Issues Fixed
| S. No. | Ticket No. | Issue | Severity | Status |
|---|---|---|---|---|
| 1 | 5228 | ContextStreamDebug: Getting Error code "Request failed with status 422" while stop api being called & "An unexpected error happened" while navigating to tabs. | S2 | Fixed in NG 2.15.0 |
| 2 | 5281 | Sorting is not working on the Data Storage page, and multiple clicks throw a UI error. | S3 | Fixed in NG 2.15.0 |
| 3 | 5039 | [NG-UI] : Time changes are not reflecting, when a user changes the time zone. | S3 | Fixed in NG 2.15.0 |
| 4 | 5143 | Data store: Nothing is happening in UI if we click on the Detect Timezone button | S3 | Fixed in NG 2.15.0 |
| 5 | 4998 | Login and Forgot Password: Vunet logo is not appearing | S4 | Fixed in NG 2.15.0 |
| 6 | 5122 | Data Store: The "Created By" column on the listing page shows "service-account-denver-orchestration" for existing data stores. | S4 | Fixed in NG 2.15.0 |
The following issues have been fixed, but minor manual steps are required:
- VUQA-5480, VUQA-5479: Please delete and recreate the affected systems dashboards for the fixes to be reflected.
- VUQA-5405: To fix the issue, the data type of the column
system_process_cpu_start_timein the tablevmetrics_linux_monitor_process_metricswas changed fromFloat32toString. However, this change is not applied automatically during the upgrade, so users need to manually run anALTERcommand to update the column type.
Release Attributes
| Build/Module Name | NG 2.15.0 |
|---|---|
| User Guide | Configurations & Preferences - Alert Pop-ups Accessing vuSmartMaps - Alert Pop-ups Configurations & Preferences - WhatsApp Configuration Configurations & Preferences - ITSM Integration Configurations & Preferences - MS Teams Configuration Accessing vuSmartMaps - Logging in Definitions - Credentials ContextStreams - Debugging ContextStreams ContextStreams - Managing ContextStreams vuApp360 Capture HTTP Headers Removal of Noise APIs Brower RUM Synthetic Browser Journey Monitoring *All the user guide links in this document are up to date and align with NG 2.15.0 updates. |
| Filename | vuSmartMaps_offline_NG-2.15.tar.gz |
System Requirements
The supported browser version is Chrome & Version 109 or above.
Upcoming Release
We are excited to announce the next sprint release of vuSmartMaps NG 3.0, scheduled for 6th June 2025. This upcoming release will bring further enhancements and features to empower your observability experience. Stay tuned for the latest updates and continue to benefit from the continuous evolution of vuSmartMaps.
We are developing a migration plan for customers using versions 8.x or 9.x to transition them to the NG release.
