Root Cause Analysis for an Incident
After clicking on an incident card of interest, the detailed section at the bottom of the incidents screen will open, revealing four key sections tailored to that incident:
- RCA
- Summary

RCA
The Root Cause Analysis (RCA) displays Golden Signals, the probable root cause in plain language, along with components that could be responsible for the incident.
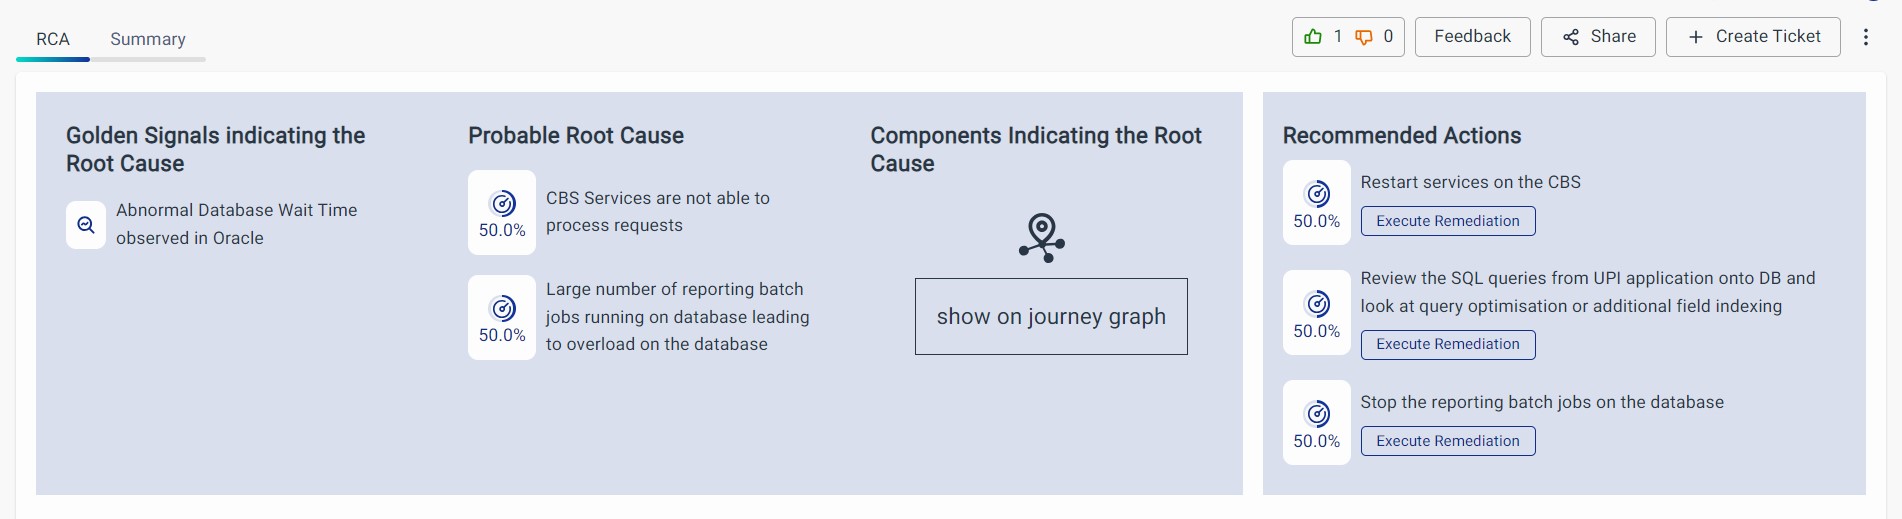
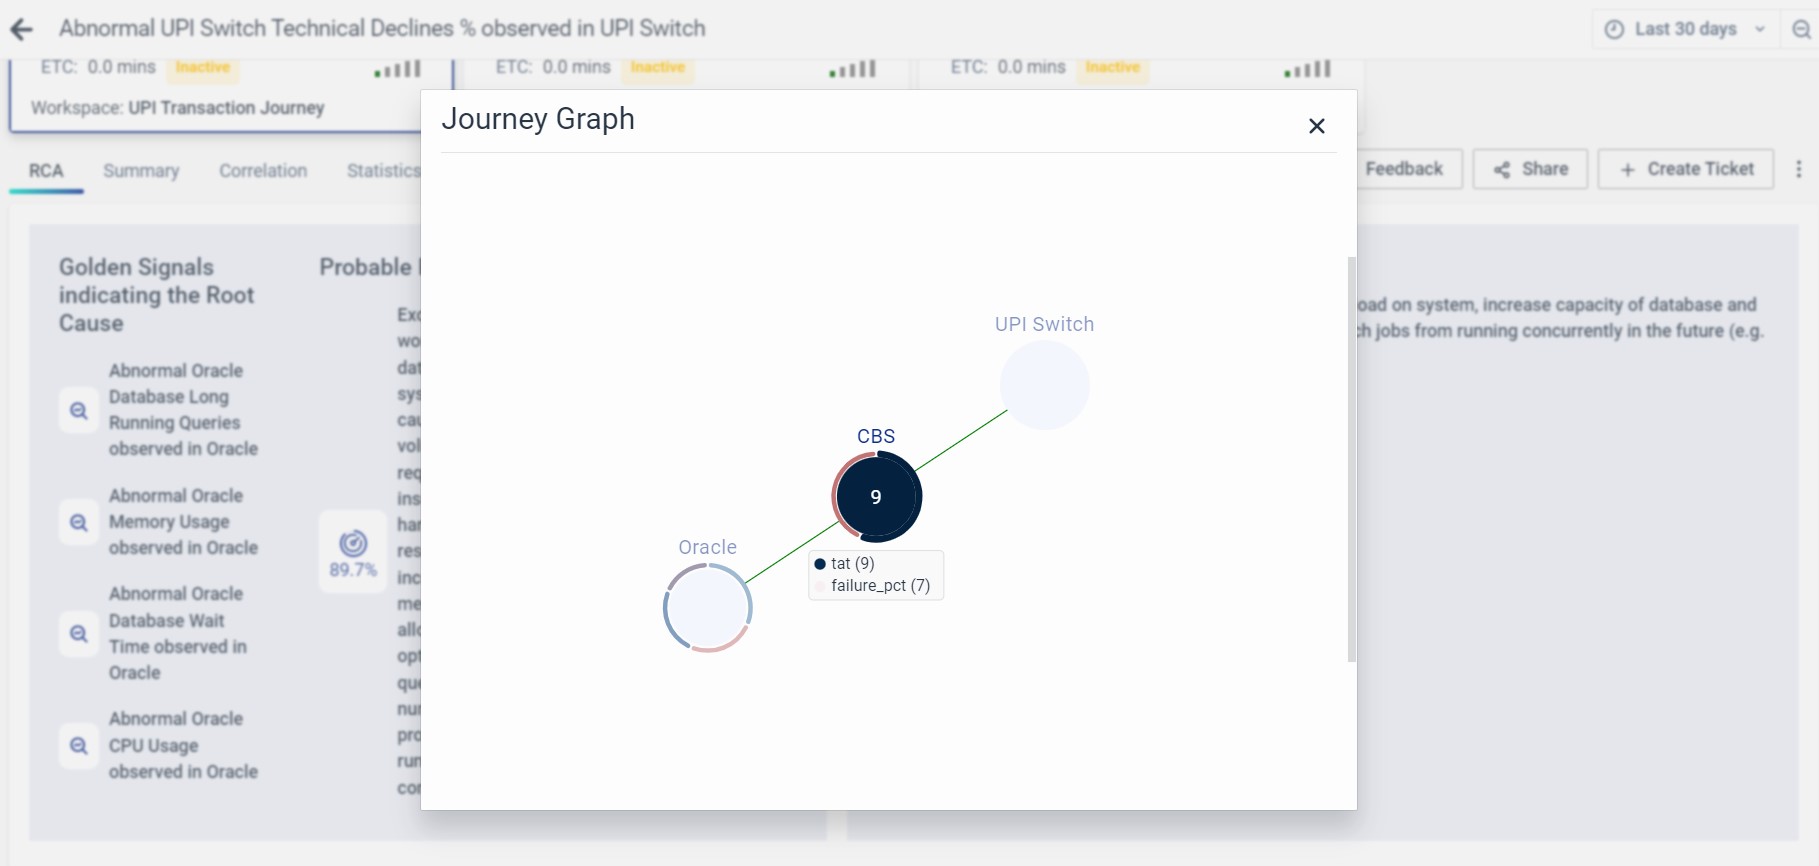
Clicking Show on Journey Graph displays the following journey statistics.
Recommended Actions: The "Recommended Actions" option suggests specific steps or measures based on identified issues within the network, aiming to address and resolve them effectively. Execute Remediation will be functional in the future releases.
The probable root cause is determined based on the schema's accuracy, so it's important that the schema accurately represents the business journey or system.
Summary
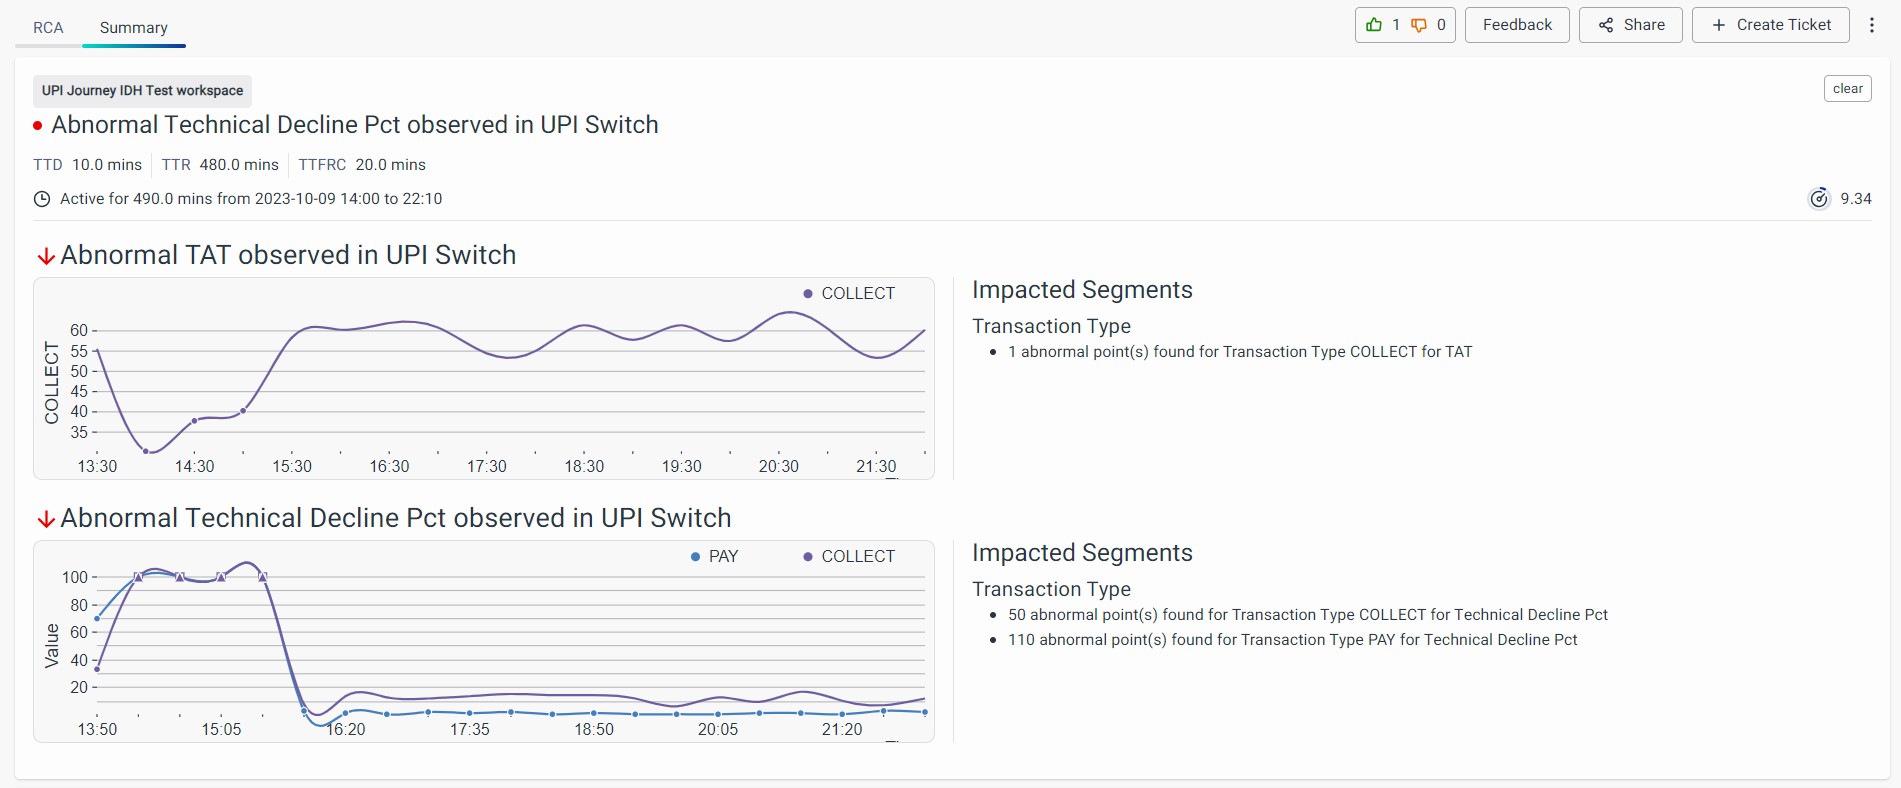
The summary provides in-depth information about the incident, including the components displaying abnormal behavior (where the probable root cause metrics are located). It also details the segments impacted by the incident and the metrics of abnormal components.
Impacted segments are based on the dimensions of the lead indicator metrics. For example, if the lead indicator is transaction volume with the dimension of transaction_type, the impacted segments will show the transaction types where incidents were observed.
If dimensions aren't available, it will display information without dimensions.
The time series in the detailed section includes all affected dimensions for the impacted lead indicator metric. Anomalous incident points are marked with circle or square symbols in the time series.
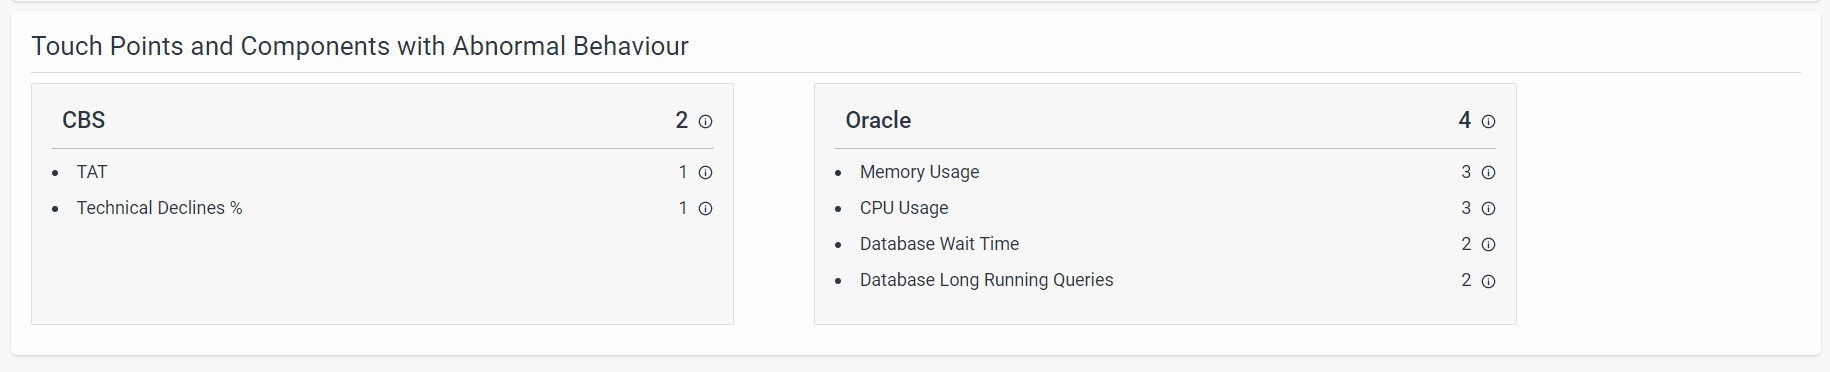
To explore further, click on the abnormal components to access detailed information about the probable root cause metrics. For each component, you'll find a table and time series.
The table displays average values for a specific dimension of that metric, while the time series includes all dimensions of that metric. Anomalous root cause points are marked with circles or squares for easy identification.

FAQs
How do I analyze the root cause of an incident?
Click an incident card, then scroll to the RCA section. You’ll find:
- Probable root causes in simple language
- Golden Signals
- Related components and metrics
- Recommended Actions
- Journey Graph view (for visual correlation)
What does the Summary tab show in Root Cause Analysis?
The Summary tab shows:
- Abnormal components and segments
- Impacted lead indicators
- Dimensional breakdown of anomalies
- Metric tables and time series for each component
How are anomalous segments represented in time series?
Anomalous data points in time series are marked with circles or squares, helping users visually identify when the issue occurred and in what segment.
