Mobile RUM Dashboards
Application Overview Dashboard
The Application Overview Dashboard gives a quick summary of how your mobile applications are performing. It helps you track user sessions, errors, and alerts across all monitored apps. You can use this dashboard to identify which applications need attention and dive deeper into specific issues.
MRUM App Catalog
The MRUM App Catalog shows all your monitored mobile applications in one place. It helps you quickly check the status and performance of each app.
App Listing
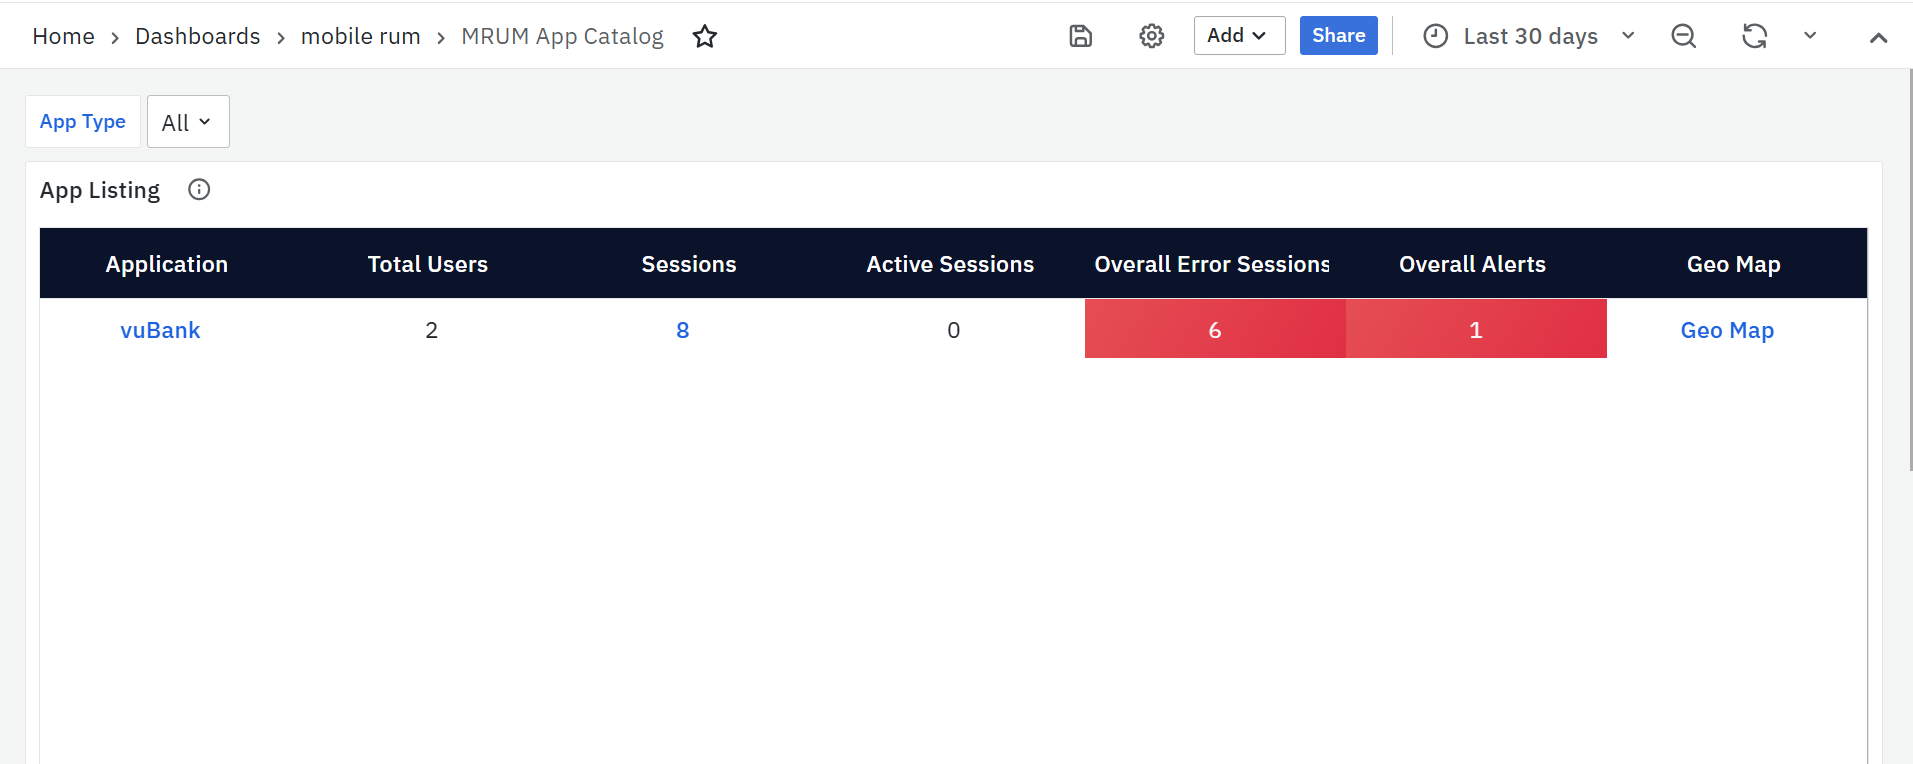
The App Listing panel is the primary and only panel available on the MRUM App Catalog screen. It offers a consolidated view of key metrics for all monitored mobile applications, allowing users to quickly assess application health, identify issues, and navigate to detailed dashboards for deeper analysis.
Each row represents a mobile application and displays the following details:
- Application
Displays the name of the monitored mobile application. Clicking the application name redirects you to the Mobile RUM Overview Dashboard, where you can explore detailed performance metrics, trends, and insights for the selected app. - Total Users
Shows the total number of unique users who accessed the application during the selected time range. - Sessions
Indicates the total number of user sessions for the application within the selected time period. A session includes user interactions such as screen views, taps, and API requests. This value is clickable and navigates to the Mobile RUM User Sessions Dashboard for detailed session-level analysis. - Active Sessions
Displays the number of user sessions that are currently active (ongoing) at the time the dashboard is viewed. - Overall Error Sessions
Represents the total number of sessions impacted by errors, including screen-related issues and API failures. This helps teams quickly understand the overall stability of the application. - Overall Alerts
Shows the total count of alerts triggered for the application, covering both screen performance and API-related issues. A higher value may indicate performance degradation or recurring problems requiring attention. - Geo Map
Provides a clickable link to the MRUM Geo Map Dashboard, which presents a geographical view of user sessions and performance metrics. This helps identify regions where users may be experiencing performance issues.
Detailed Application Metrics Dashboards
MRUM Overview
The MRUM Overview dashboard gives a quick summary of how your mobile app is performing. It includes several panels that show important metrics related to screens, APIs, performance, and sessions. Each panel also contains a small trend graph to help you spot changes over time.
To narrow down the data shown on this dashboard, you can use filters available at the top. Filters include Application, Screen, API, OS, App Type, and App Version. Each filter has a dropdown menu where you can choose specific values. This helps you focus on certain parts of the app and analyze performance more accurately.
MRUM Overview Panels
Sessions
The Sessions panel provides key insights into how users interact with your mobile app. It helps track usage trends, detect screen/API issues, and understand session duration patterns. The following metrics are included:
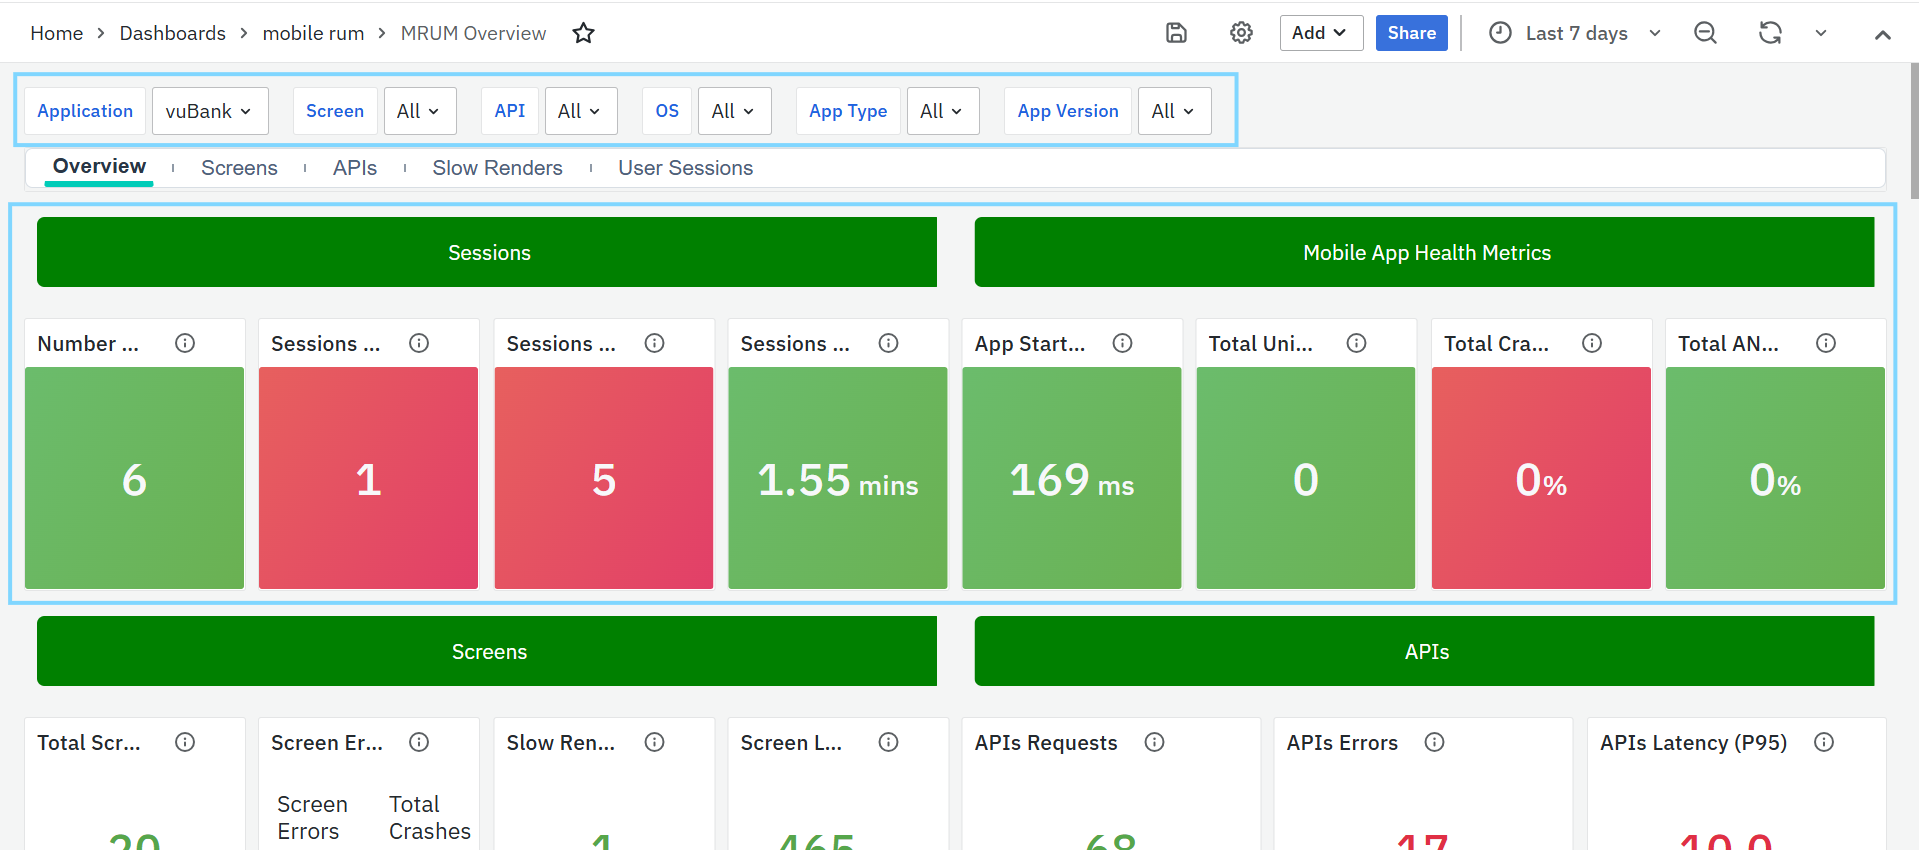
- Number of Sessions: Shows the total number of user sessions during the selected time range. A session includes screen views, taps, and API calls. This helps measure user engagement and app activity.
- Threshold: Highlighted as Critical (Red) if session count is greater than 0.
- Sessions with Screen Errors: Displays the number of sessions where users faced screen-related problems—like broken UI elements or slow screen loads. This helps identify screens that may need optimization.
- Sessions with API Errors: Shows how many sessions were affected by API issues such as timeouts or failures. Monitoring this helps assess backend stability and catch user-impacting problems early.
Sessions with Screen Errors & Sessions with API Errors is a clickable metric that redirects to the MRUM User Sessions Dashboard for detailed information.
- P50 of Session Duration: Indicates the median session duration (50th percentile), showing how long most users stay in the app. Sudden drops may suggest usability or performance issues.
Mobile App Health Metrics Panel
This panel gives a quick view of your app’s stability and startup performance. It helps identify crashes, ANRs, and startup delays affecting user experience.
- App Start Time (P95): Tracks how long the app takes to launch for most users (95th percentile). Use this to detect startup slowness or outliers.
- Total Unique Crashes: Shows the number of different types of crashes. Helps prioritize which crash patterns need immediate attention.
- Total Crash Rate: Percentage of sessions that ended in a crash. Useful to monitor app stability, especially after a new release.
Total Unique Crashes & Total Crash Rate is a clickable metric that redirects to the MRUM Screens for detailed information.
- Total ANR Rate: Shows the percentage of sessions affected by Application Not Responding (ANR) errors. Helps detect UI freezing issues that impact user experience.
Screens
The Screens panel helps track how different app screens are used and how well they perform across devices and OS versions.
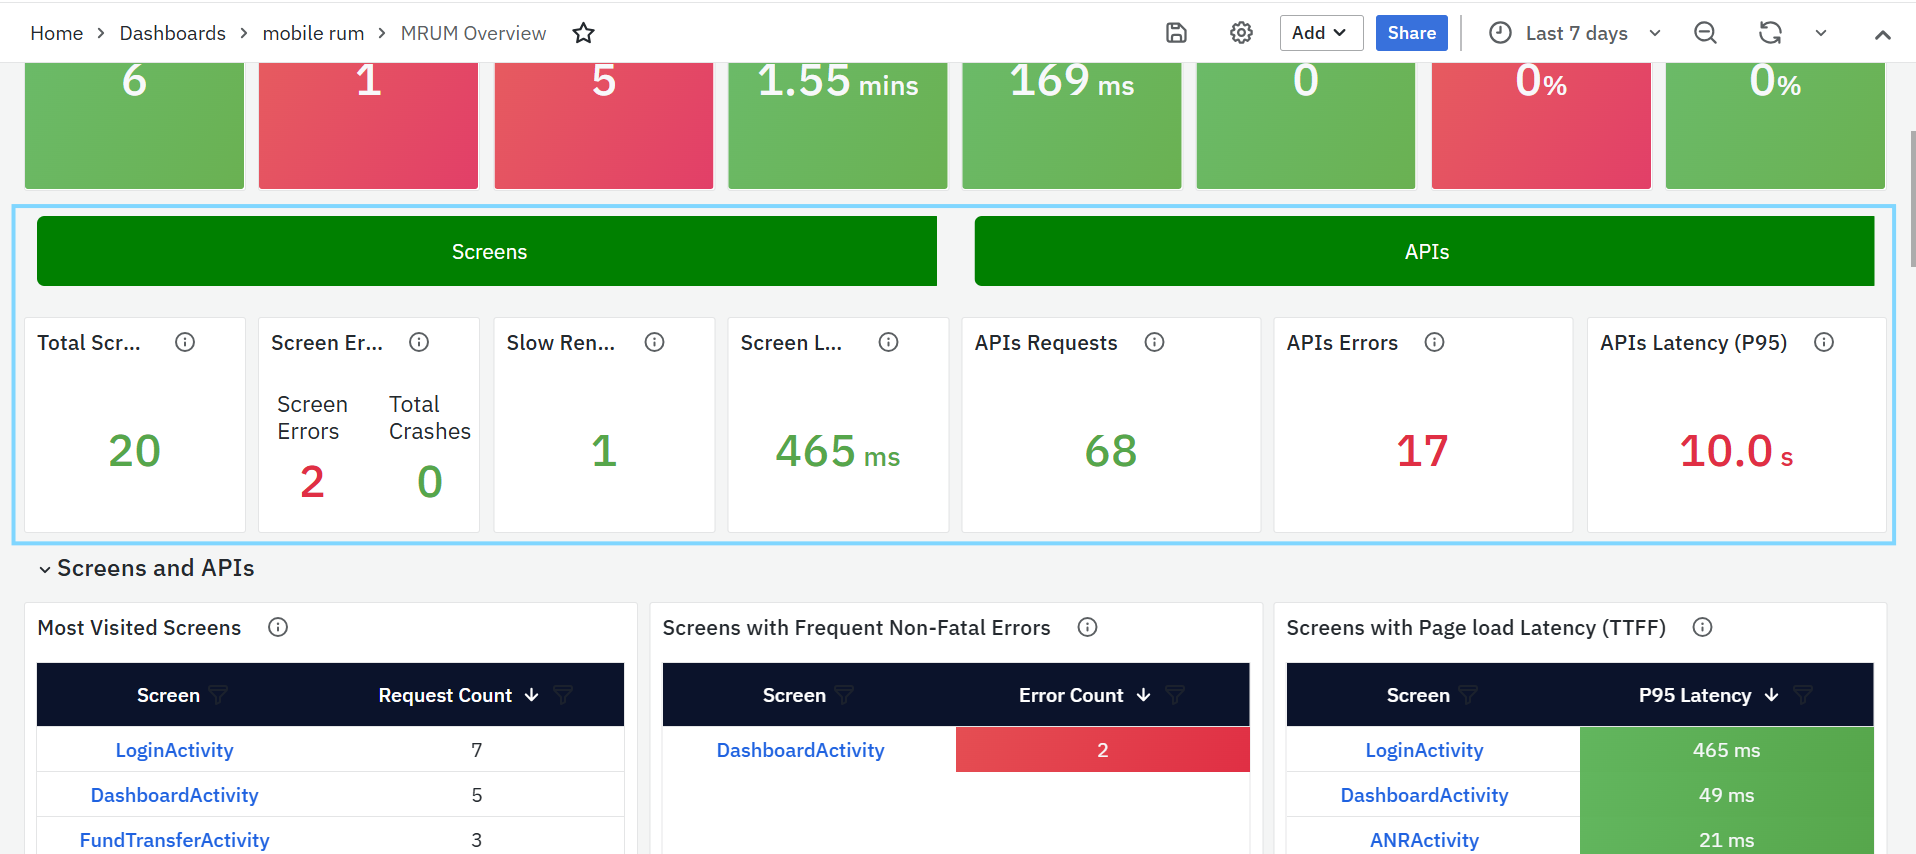
- Total Screen Loads: Shows how many times screens were opened during the selected time range. Helps identify popular screens and peak usage. You can filter by screen name, app version, or platform.
- Screen Errors/Crashes: Displays the total number of screen-level errors and crashes. This helps detect frontend issues and app instability affecting users.
- This is a clickable metric that opens the MRUM Screens Dashboard for detailed insights.
- Slow Rendered Screens: Shows how often screens took longer than expected to render (usually more than 16ms per frame). Useful for identifying UI lag and rendering performance issues.
- This is a clickable metric that leads to the MRUM Slow Render Dashboard.
- Screen Load Time (TTFF) – P95: Measures the time taken to render the first frame of a screen (95th percentile). Highlights delays in screen transitions due to rendering or backend slowness. Focuses on the slowest 5% of user experiences.
APIs
The APIs panel helps monitor the performance and reliability of backend API calls made by the mobile application.
- API Requests: Shows the total number of API calls made during the selected time range. This helps identify usage patterns and detect any spikes or drops in traffic.
- API Errors: Displays the number of failed API calls, including timeouts and invalid responses. Monitoring this helps detect recurring backend issues and improve system reliability.
- Threshold: API Error Count > 0 – marked as Critical.
- API Latency (P95): Measures the 95th percentile of API response time, showing how quickly the backend processes most requests. A high value indicates potential performance issues.
- Threshold: API Latency > 500ms – marked as Critical.
Both API Requests and API Latency (P95) are clickable metrics that redirect to the MRUM APIs Dashboard for detailed analysis.
Screens and APIs
This panel helps you track the most used and most problematic screens and APIs in your mobile app. It identifies areas that are popular, slow, or prone to frequent issues, allowing teams to take action where it matters most.
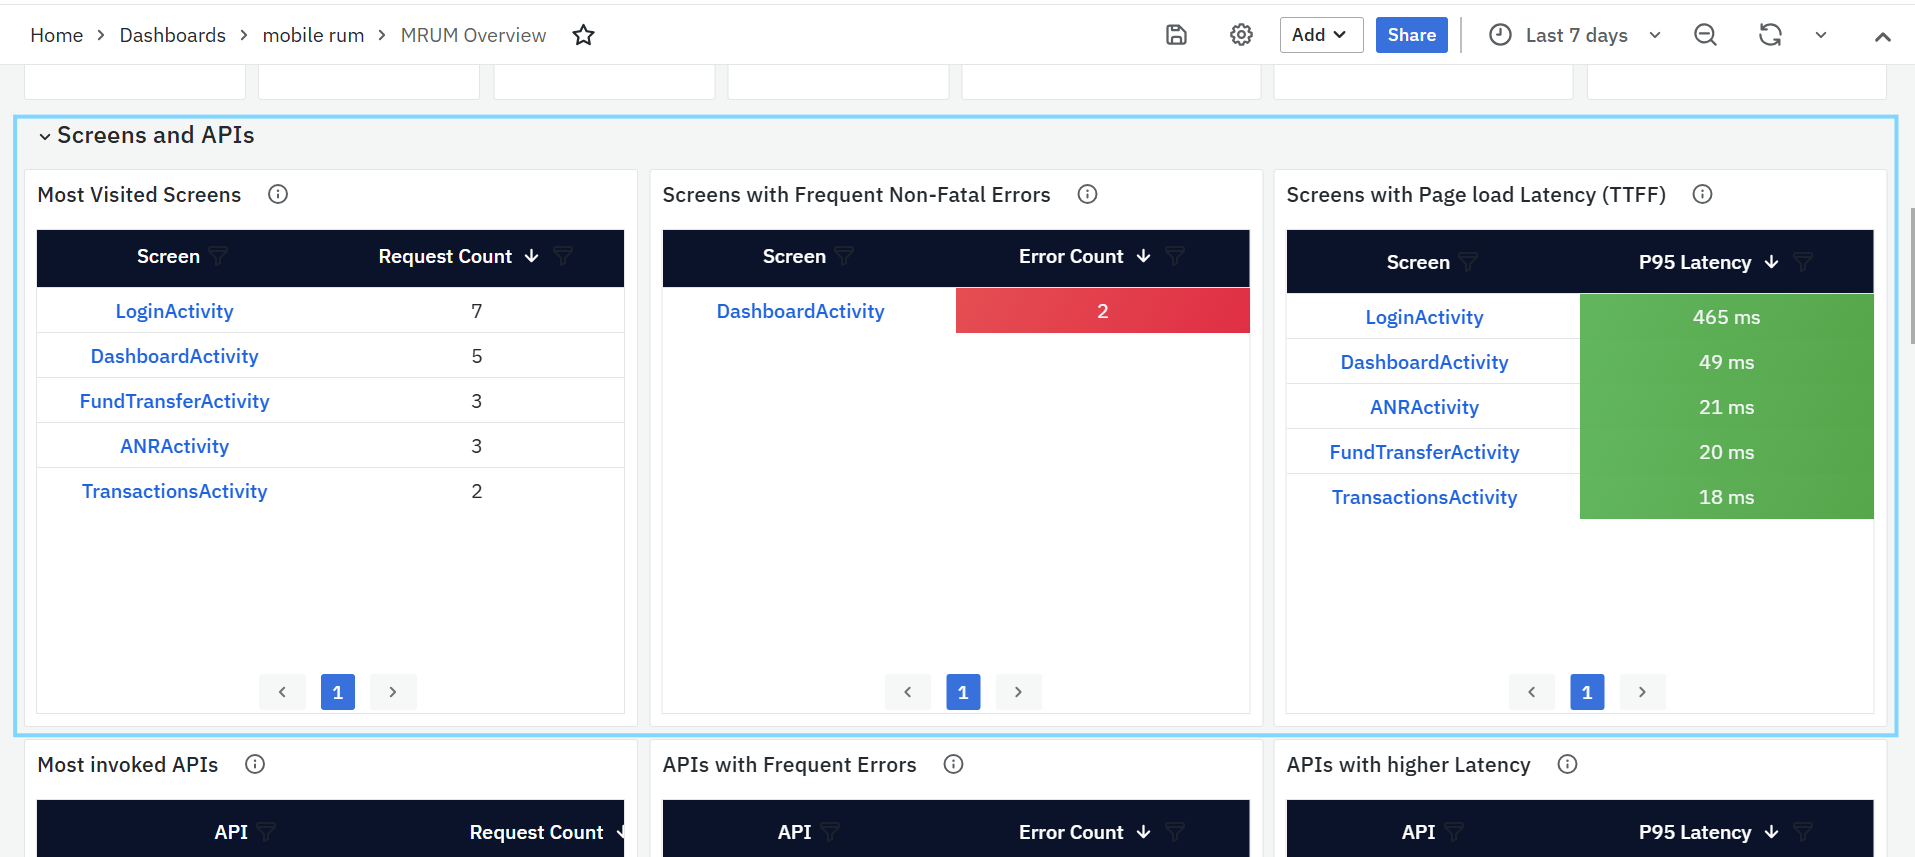
- Most Visited Screens
- Shows the screens that users open most often.
- The Screen column has clickable links that open the MRUM Screens Dashboard for more details.
- The Request Count shows how many times each screen was accessed.
- Helps you understand which screens are used the most.
- Screens with Frequent Non-Fatal Errors
- Lists screens with high error counts, such as missing resources or code exceptions.
- The Screen column links to the MRUM Screens Dashboard for investigation.
- The Error Count shows how many issues were recorded.
- Helps find screens that need fixes to improve user experience.
- Threshold: Error Count > 0 – marked in red.
- Screens with Page Load Latency (TTFF)
- Highlights screens that load slowly.
- The Screen column links to the MRUM Screens Dashboard for load time details.
- P95 Latency shows how long it takes to load the first frame for most users.
- Helps you improve screen loading performance.
- Threshold: P95 Latency > 500ms – marked in red.

- Most Invoked APIs
- Lists the APIs that are called most often by the app.
- The API column has clickable links to the MRUM APIs Dashboard.
- Request Count shows how many times each API was called.
- Helps track which APIs are used the most.
- APIs with Frequent Errors
- Shows APIs with high error rates like timeouts or failed responses.
- The API column links to the MRUM APIs Dashboard for troubleshooting.
- Error Count shows how many errors occurred.
- Helps you find and fix backend problems quickly.
- Threshold: API Error Count > 0 – marked as critical (red).
- APIs with Higher Latency
- Lists APIs that are slow to respond.
- The API column links to the MRUM APIs Dashboard for response time analysis.
- P95 Latency shows how long it takes for most requests to complete.
- Helps identify and fix slow APIs.
- Threshold: P95 Latency > 500ms – marked as critical (red).
Crashes
The Crashes panel helps track app crashes and ANR (App Not Responding) issues. It gives a clear view of where crashes happen, who is affected, and which app versions or OS platforms are more unstable. This helps teams quickly identify and fix stability problems.
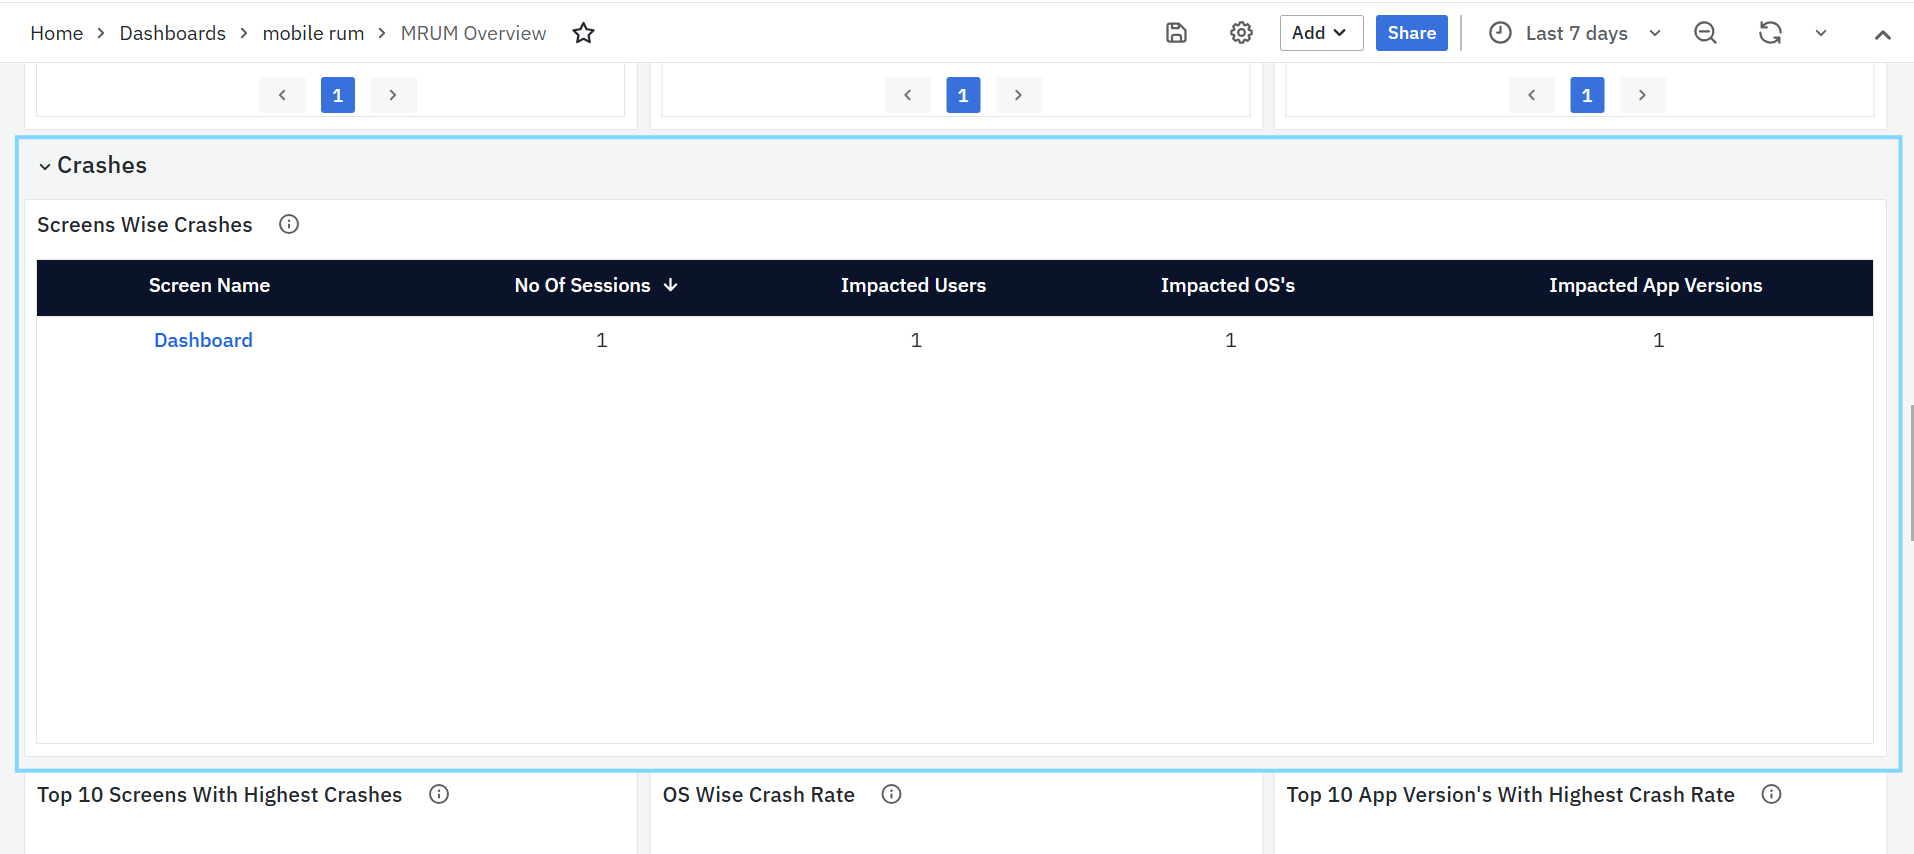
- Screens Wise Crashes
- Lists the screens where crashes occurred most often.
- Screen Name shows which screen the crash happened on.
- Sessions tells how many sessions were affected.
- Impacted Users shows the number of unique users who faced crashes.
- Impacted OS’s and App Versions help identify if the issue is linked to a specific platform or release.
- Error Message gives details about the crash to help with debugging.
- OS and App Version Distribution
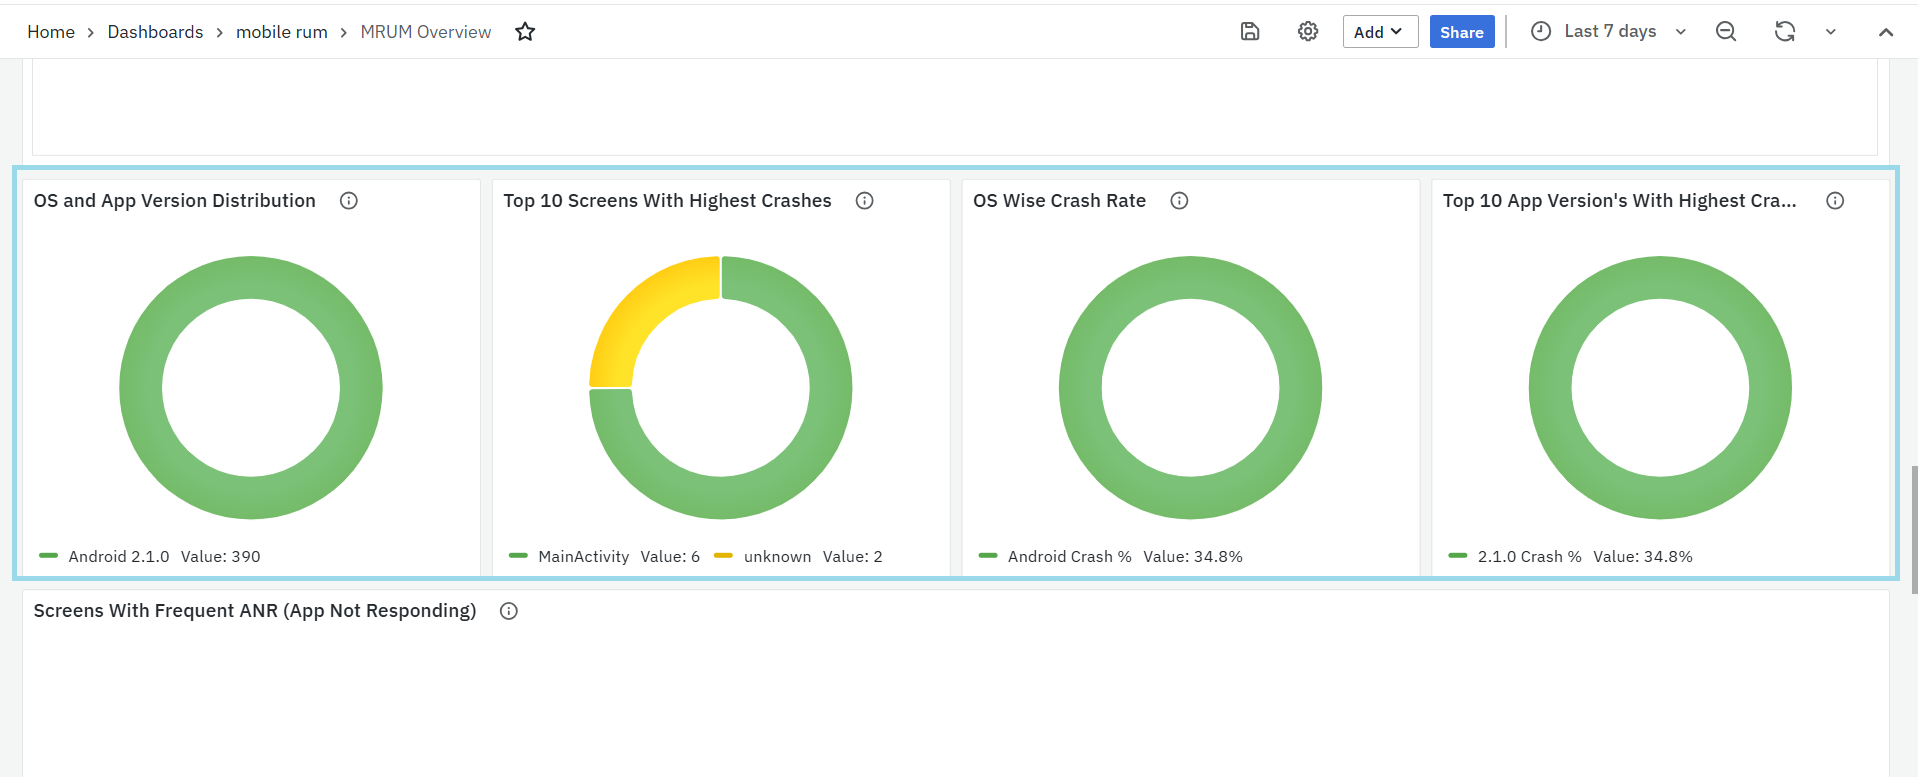
- Displays the distribution of app versions across different operating systems.
- This helps identify which app versions are most widely used on each OS, enabling teams to track version adoption trends and detect potential compatibility issues early.
- Top 10 Screens with Highest Crashes
- Shows the top 10 screens that crashed the most.
- This helps teams focus on the most unstable screens first.
- OS Wise Crash Rate
- Displays crash rates grouped by operating system.
- This helps identify if crashes are more common on Android or iOS, so platform-specific fixes can be prioritized.
- Top 10 App Versions with Highest Crash Rate
- Lists app versions that have the highest crash rates.
- Useful for finding unstable releases and planning fixes or rollbacks.

- Screens with Frequent ANR (App Not Responding)
- Highlights screens that often trigger ANR events, where the app becomes unresponsive.
- Screen: Name of the screen where ANRs occurred.
- Session Count: Number of sessions where the screen was active.
- Affected Users: Number of users who experienced ANRs on that screen.
- Affected OS Versions: Which mobile OS versions saw ANRs.
- Affected App Versions: Which app versions had these issues.
Screens with Rendering Delays
This panel helps identify screens in the mobile app that are slow to render, which can make the user interface feel laggy or unresponsive.
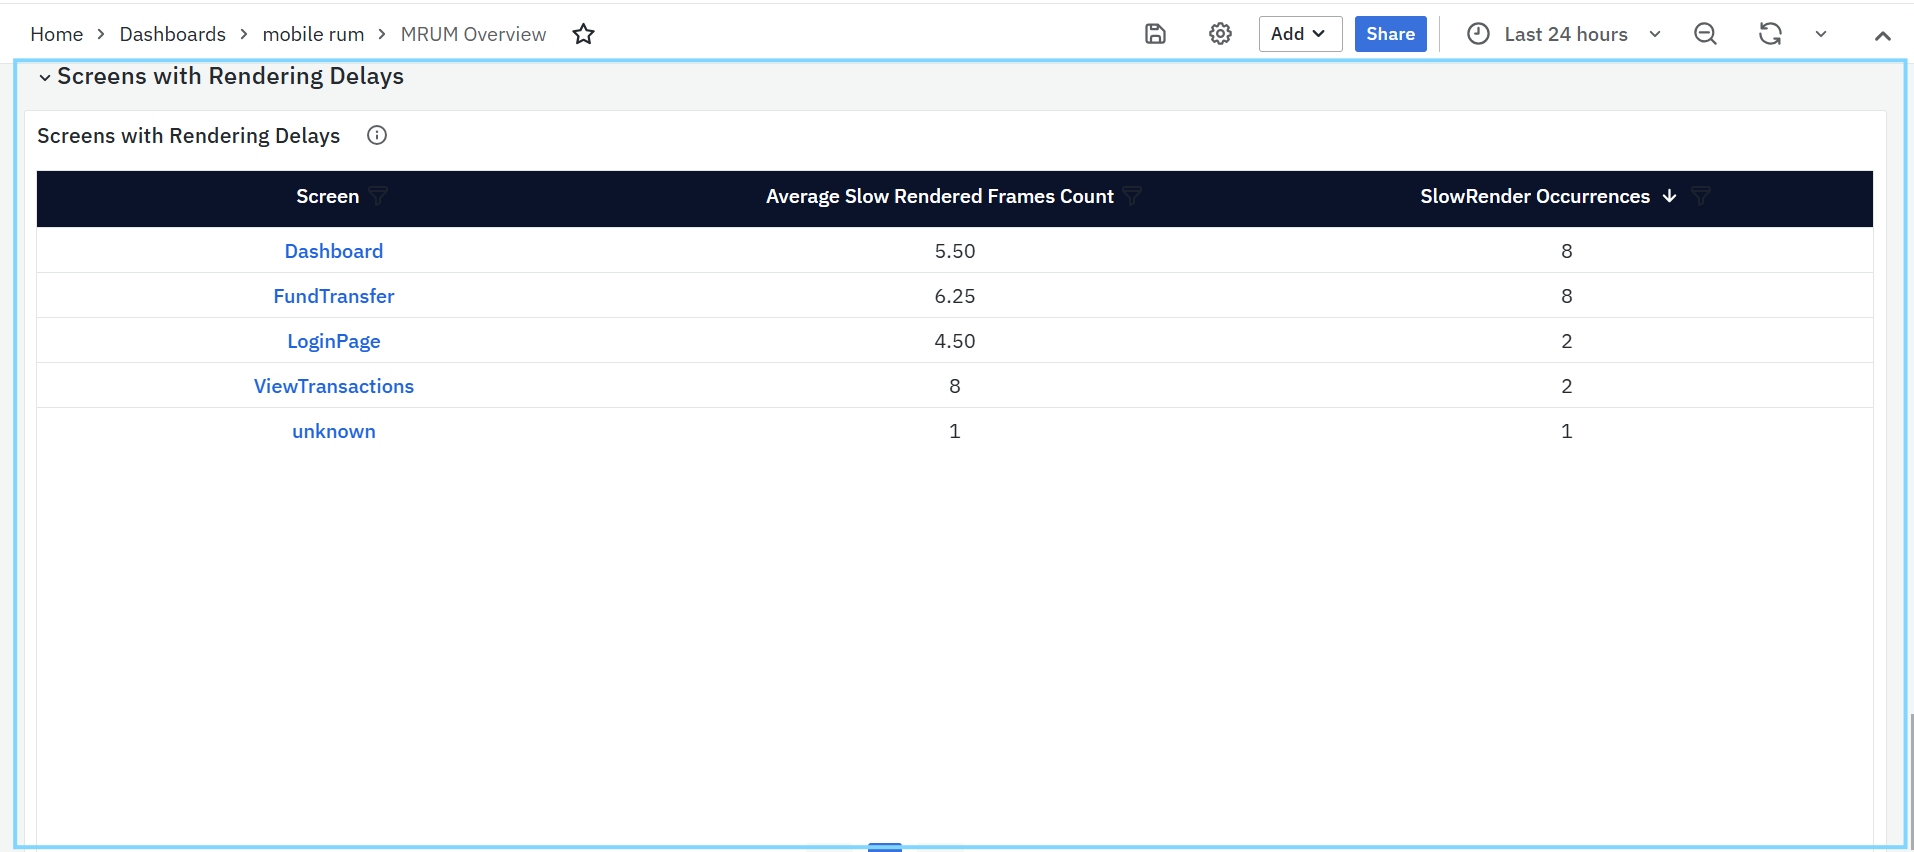
- Screens with Rendering Delays
- Lists screens where rendering delays happen frequently. These delays usually occur when it takes more than 16 milliseconds to draw a frame, which can lead to dropped frames and poor user experience.
- Screen: Name of the screen where rendering delays were detected. This is a clickable link that opens the MRUM Slow Render Dashboard for detailed performance analysis.
- Average Slow Rendered Frames Count: Shows the average number of slow frames recorded for each screen during the selected time. Helps identify which screens regularly face rendering issues.
MRUM Screens
The MRUM Screens Dashboard provides a complete view of your mobile app’s screen-level performance, stability, and user experience. It captures detailed metrics such as load durations, slow renders, crashes, and non-fatal errors across different screens. Each panel in the dashboard highlights specific insights from identifying slow or crash-prone screens to tracking API activity, user interactions, and rendering performance.
To narrow down the data shown on this dashboard, you can use filters available at the top. Filters include Application, Screens, OS, App Type, App Version & Session. Each filter has a dropdown menu where you can choose specific values. This helps you focus on certain parts of the app and analyze performance more accurately.
MRUM Screens Panels
Screen
This panel lists all the screens captured from your mobile application sessions. Each entry represents a unique screen or activity where user interactions or events occurred.
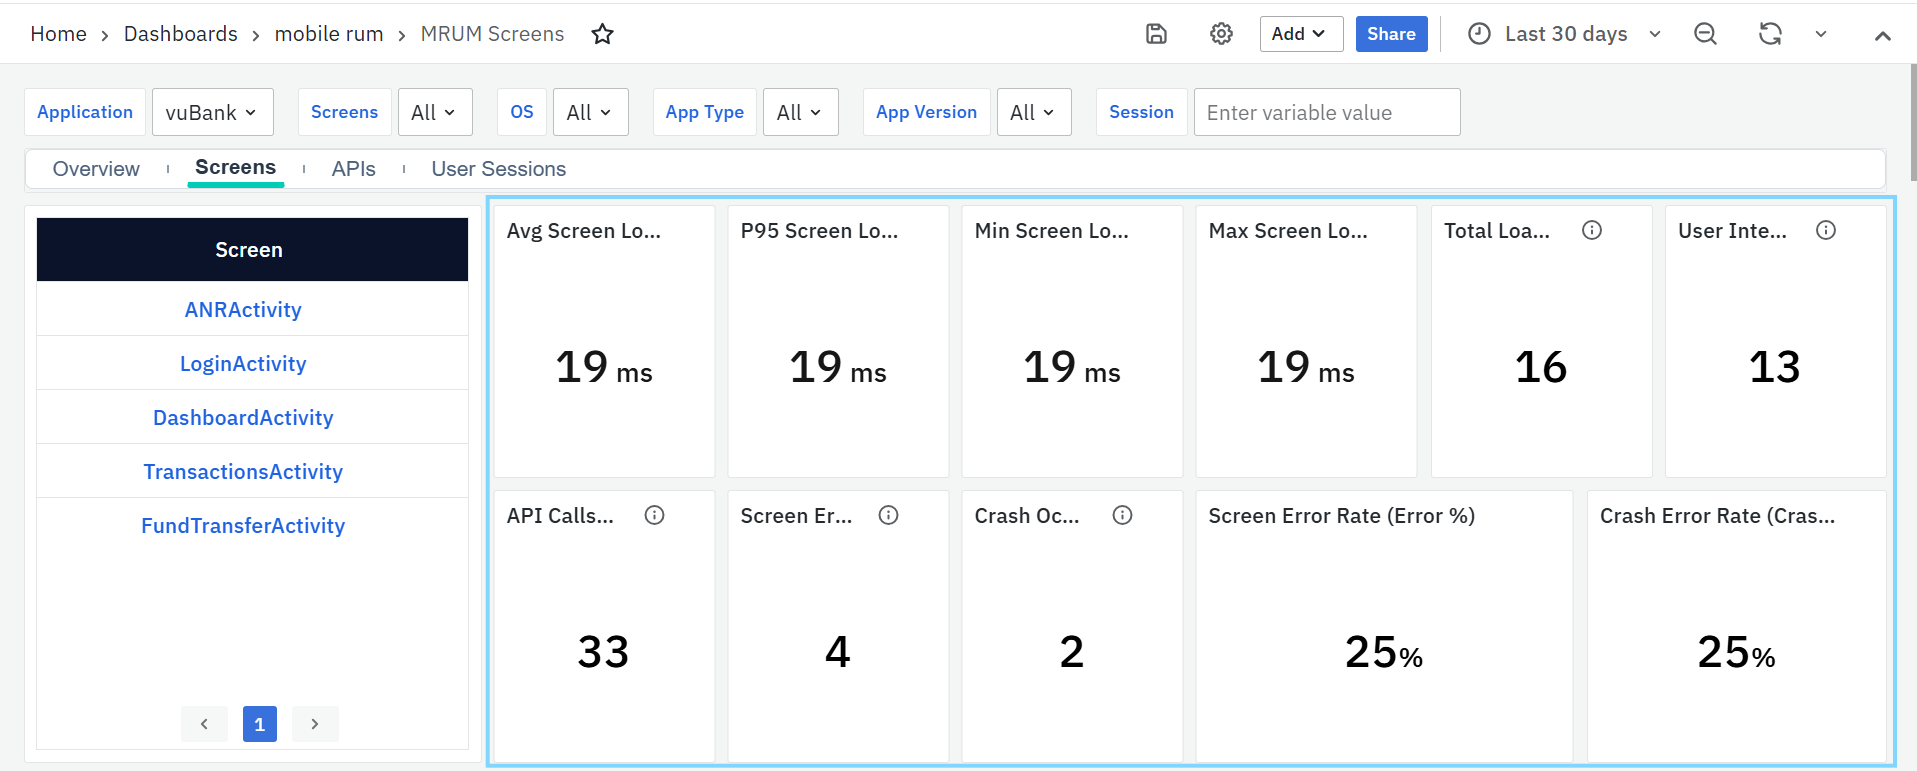
You can click on any screen name to drill down into its details. When clicked, the dashboard automatically updates the filters to focus on that specific screen, displaying related crash, error, and performance data across all other panels. This helps you analyze how a particular screen behaves in terms of stability, performance, and user experience.
Average Screen Load Duration
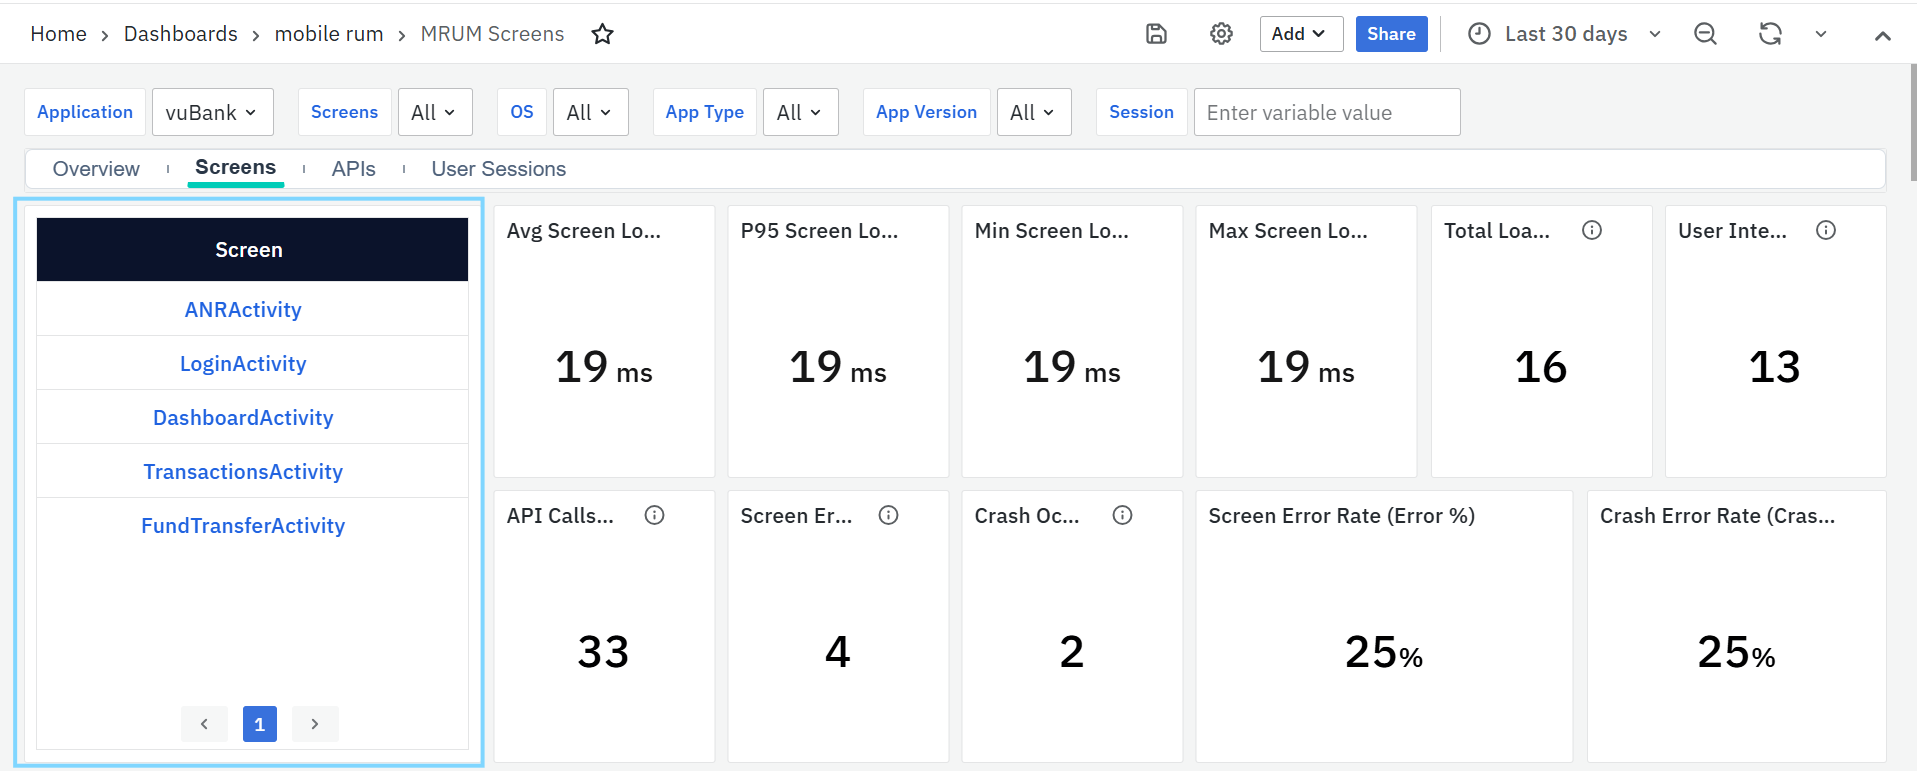
Displays the average time taken for a screen to fully load and render. It helps identify screens that consistently take longer than expected, affecting the overall user experience.
P95 Screen Load Duration
Shows the 95th percentile of screen load times meaning 95% of loads are faster than this value. It’s useful for spotting occasional slow screens that may not appear in average metrics.
Minimum Screen Load Duration
Indicates the fastest screen load time recorded during the selected period. This helps set a baseline for optimal performance under ideal conditions.
Maximum Screen Load Duration
Shows the slowest screen load time observed. It’s useful for identifying performance bottlenecks or specific cases where rendering took unusually long.
Total Loads / Visits
Displays the total number of times a screen was accessed within the selected time range. This helps teams understand user traffic, identify popular screens, and spot usage trends. You can filter this data by screen name, app version, or platform to analyze user behavior across segments.
User Interactions
Shows the total number of user actions (such as taps, clicks, or gestures) on the screen. A higher interaction count indicates that the screen is heavily used or has complex functionality.
API Calls on Screen
Indicates the number of API calls triggered while the screen was loading or active. This helps identify screens that rely on multiple backend calls, which may influence loading speed or responsiveness.
Screen Error Occurrences
Represents the total number of non-fatal errors that occurred while the screen was loading or being used. It helps pinpoint screens that may have frequent functional or rendering issues.
Crash Occurrences
Displays the total number of crashes recorded during the screen load or while the user was on that screen. It helps teams focus on unstable screens that disrupt the user experience.
Screen Error Rate (Error %)
Shows the percentage of sessions or loads where a non-fatal error occurred. A higher percentage indicates that the screen may need debugging or optimization.
Crash Error Rate (Crash %)
Displays the percentage of sessions or loads that resulted in a crash. This helps measure the stability of individual screens and prioritize fixes for the most problematic ones.
P95 Screen Load Time Trend for Top 5 Screens
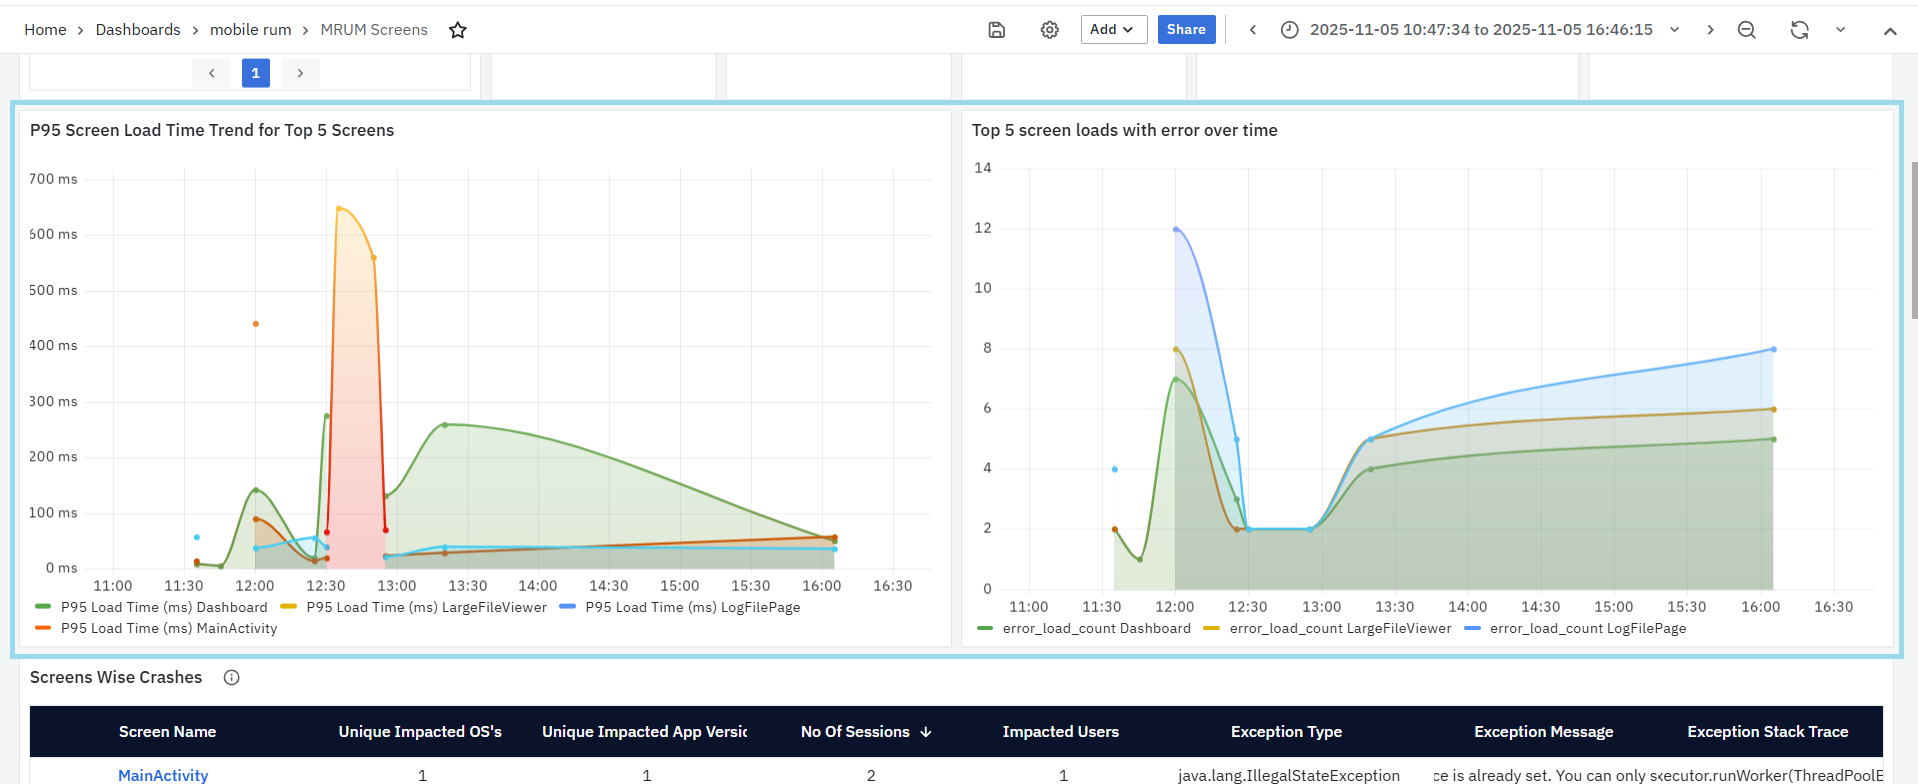
- This panel shows how the P95 screen load time changes over time for the top 5 most-used screens.
- The P95 (95th percentile) value means that 95% of the screen loads are faster than the time shown here making it useful to spot screens that occasionally load much slower than normal.
Top 5 Screen Loads with Error Over Time
- This panel shows the number of screen loads that ended with errors for the top 5 screens over time.
- Each line represents a different screen and how often it encountered errors during the selected time range.
Screens Wise Crashes
This panel lists the mobile screens where crashes have occurred, helping teams identify and fix the most unstable areas of the application.
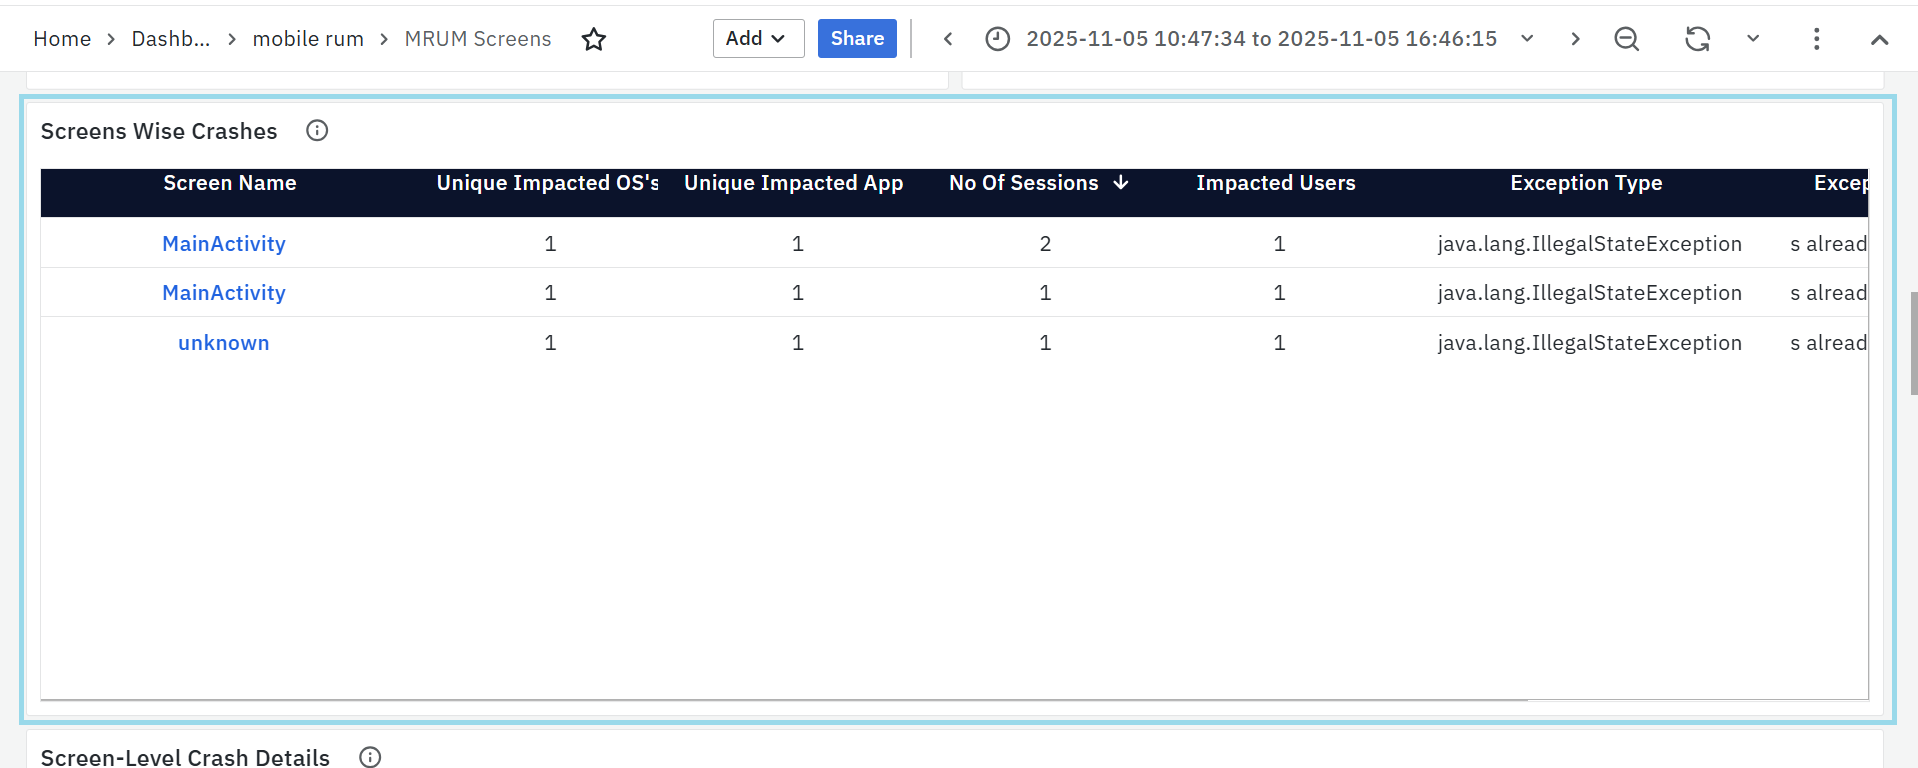
Each row provides detailed information about crash occurrences:
- Screen Name: The specific screen where the crash occurred. Clicking the screen name updates the dashboard filters to show data for that screen.
- Unique Impacted OS’s: The number of operating systems affected by the crash (e.g., Android, iOS).
- Unique Impacted App Versions: The app versions where the crash was reported, helping detect version-specific issues.
- Number of Sessions: The count of sessions that experienced crashes on this screen.
- Impacted Users: The number of unique users who faced the crash.
- Exception Type: The category of the crash or error (e.g., IllegalStateException).
- Exception Message: A short description of the crash, explaining the reason for failure.
- Exception Stack Trace: A detailed technical trace showing the exact code location and sequence that led to the crash.
This panel allows developers to analyze crash frequency, affected environments, and root causes to improve app stability.
Screen-Level Crash Details
This panel displays the most crash prone screens in the application, allowing developers to quickly identify and fix stability issues at the UI level.
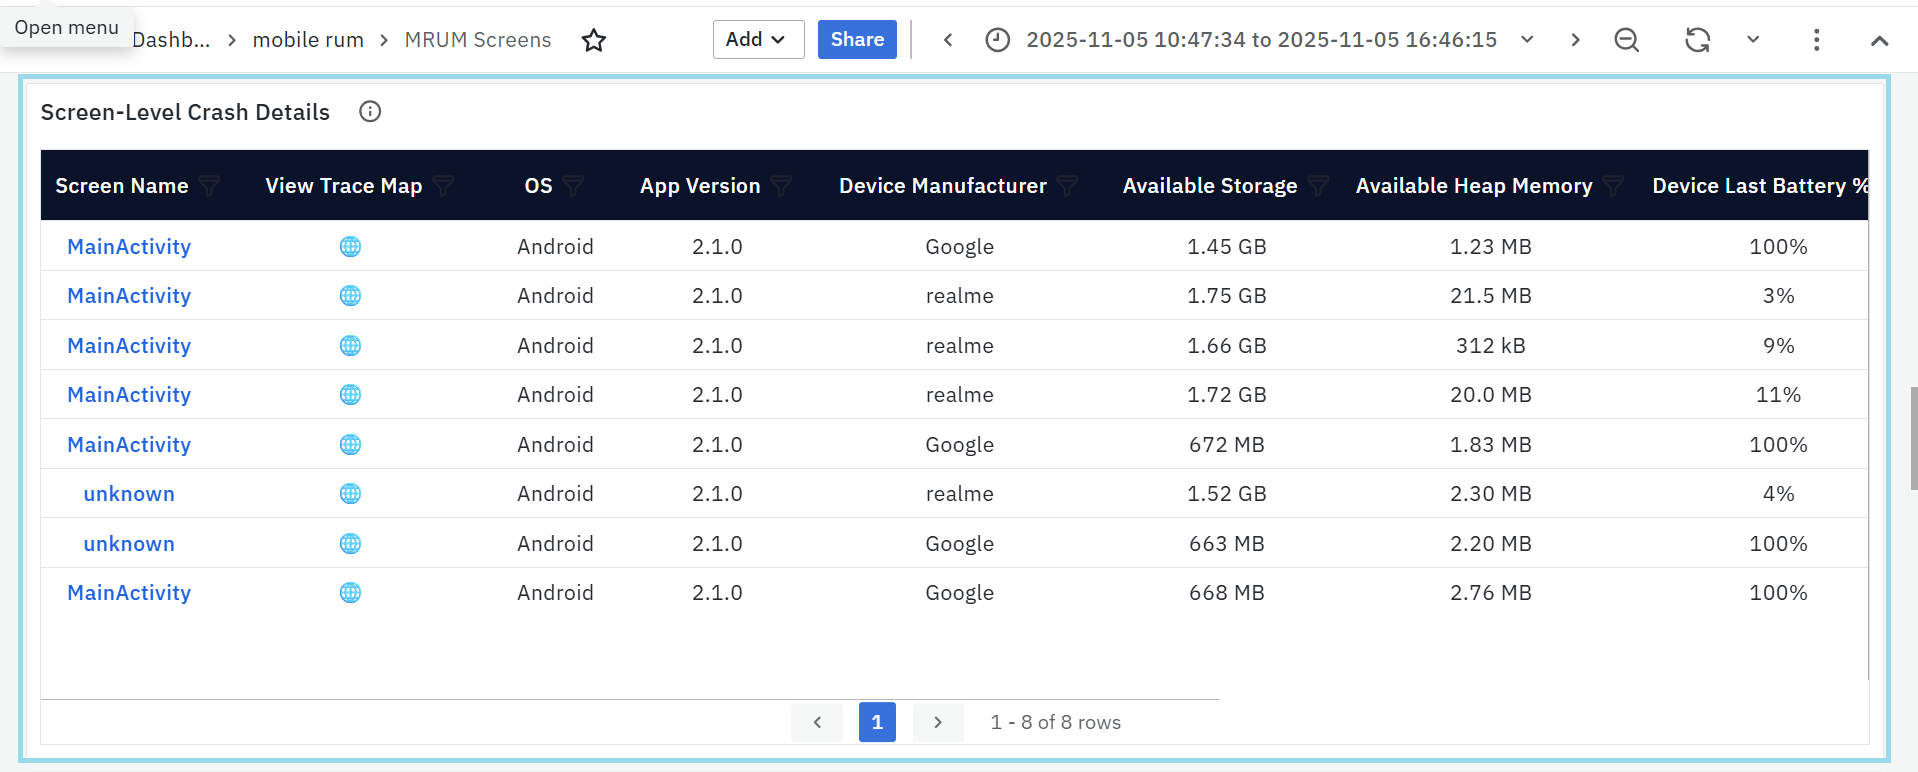
- Screen Name: Name of the activity or screen where the crash occurred. Clicking the screen name updates the dashboard filters to show data for that screen.
- View Trace Map: clickable icon which leads to MRUM Trace Map for more details.
- OS: Operating system of the affected device (e.g., Android, iOS).
- App Version: Version of the app where the crash occurred.
- Device Manufacturer: Brand or vendor of the device (e.g., Samsung, Google).
- Available Storage: Free internal storage on the device at the time of the crash.
- Available Heap Memory: Amount of memory available to the app before it crashed.
- Device Last Battery %: Battery percentage just before the crash — helps detect power-related issues.
- Exception Type: The type of exception thrown (e.g.,
java.lang.NullPointerException,java.lang.ArithmeticException). - Exception Stack Trace: Section of the stack trace showing the cause and location of the crash.
Screen-Level Non-Fatal Error Details
This panel shows screens in the app where runtime errors (non-fatal exceptions) happen most often.
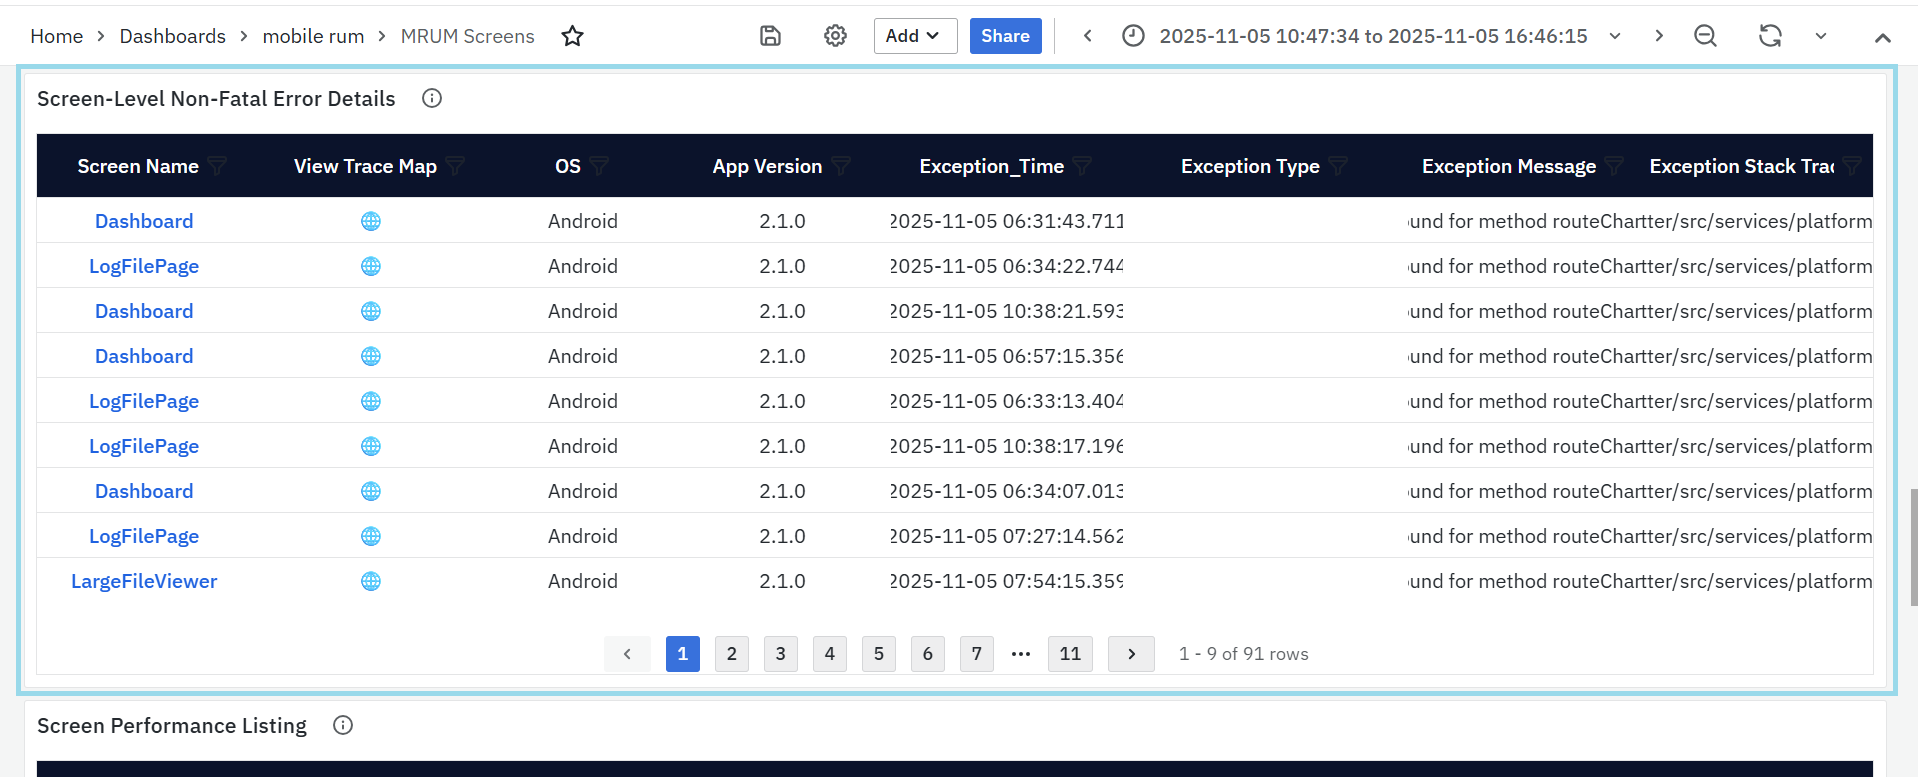
- Screen Name: The screen where the error occurred.Clicking the screen name updates the dashboard filters to show data for that screen.
- View Trace Map: clickable icon which leads to MRUM Trace Map for more details.
- OS: Operating system (e.g., Android, iOS).
- App Version: Version of the app where the issue happened.
- Exception Time: Exact time when the error occurred.
- Exception Type: Type of the error (e.g.,
NullPointerException). - Exception Message: Short error message explaining what went wrong.
- Exception Stack Trace: Technical details showing the function or line that caused the error.
Screen Performance Listing
This panel shows how each screen in the app performs in terms of speed, crashes, and errors. It helps identify which screens are slow, crash often, or are used most frequently.
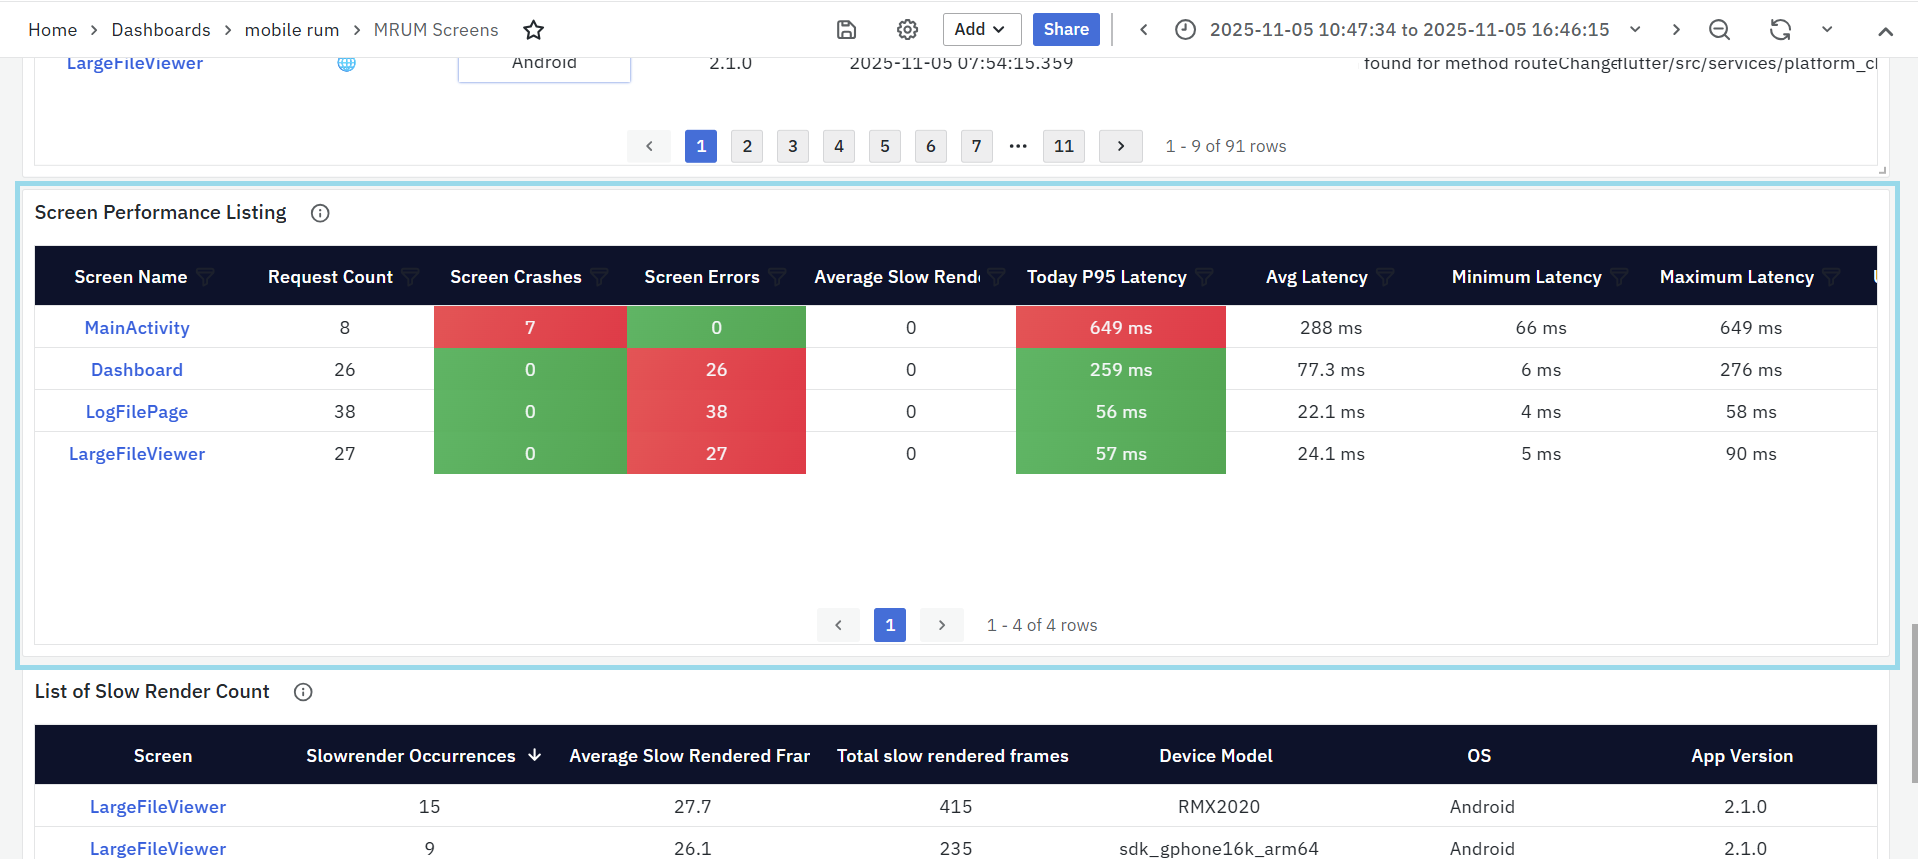
- Screen Name: The name of the app screen (e.g., Dashboard, Login). Clicking the screen name updates the dashboard filters to show data for that screen.
- Request Count: How many times users opened or interacted with the screen.
- Screen Crashes: Total crashes that happened on that screen.
- Screen Errors: Number of runtime or non-fatal errors on that screen.
- Average Slow Render: Number of times the screen took longer to render (slow frames).
- Today P95 Latency: The 95th percentile latency for today — shows how long the screen takes to load for most users.
- Average Latency / Min / Max Latency: Indicates overall, lowest, and highest response times.
List of Slow Render Count
This panel lists screens that experience the most rendering delays, helping teams identify performance bottlenecks that impact smooth UI experience.
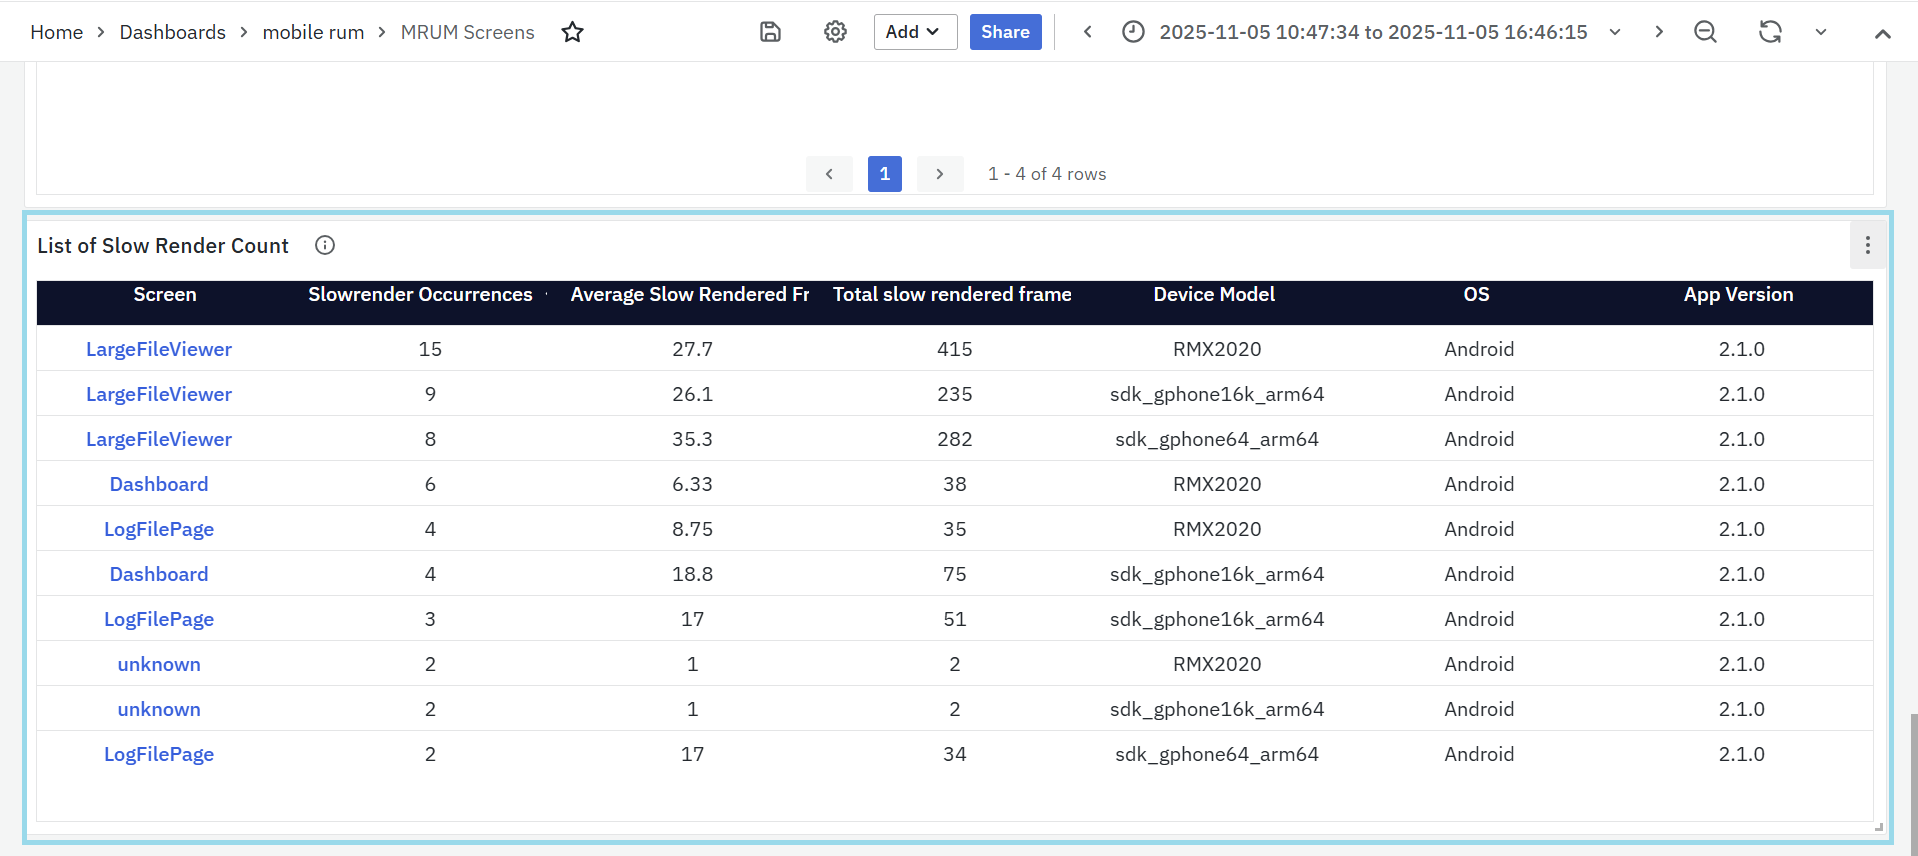
- Screen: The name of the screen where slow rendering occurred. Clicking the screen name updates the dashboard filters to show data for that screen.
- Slow Render Occurrences: Number of times slow rendering was detected on that screen.
- Average Slow Rendered Frames: The average number of frames that took longer than expected to render.
- Total Slow Rendered Frames: The total count of frames that were slow across all sessions for that screen.
- Device Model: The specific device on which the slow renders occurred, helping pinpoint hardware-related issues.
- OS: The operating system (e.g., Android, iOS) where the issue was detected.
- App Version: The version of the app where the slow render occurred, useful for version-based performance tracking.
MRUM APIs
The MRUM APIs Dashboard helps track the performance, reliability, and errors of all API calls made by the mobile app. It highlights slow APIs, client- and server-side failures, and exception trends, giving visibility into how different OS versions, app versions, and networks are affected.
To narrow down the data shown on this dashboard, you can use filters available at the top. Filters include Application, API, OS, App Type, Version & Session. Each filter has a dropdown menu where you can choose specific values. This helps you focus on certain parts of the app and analyze performance more accurately.
MRUM APIs Panels
APIs
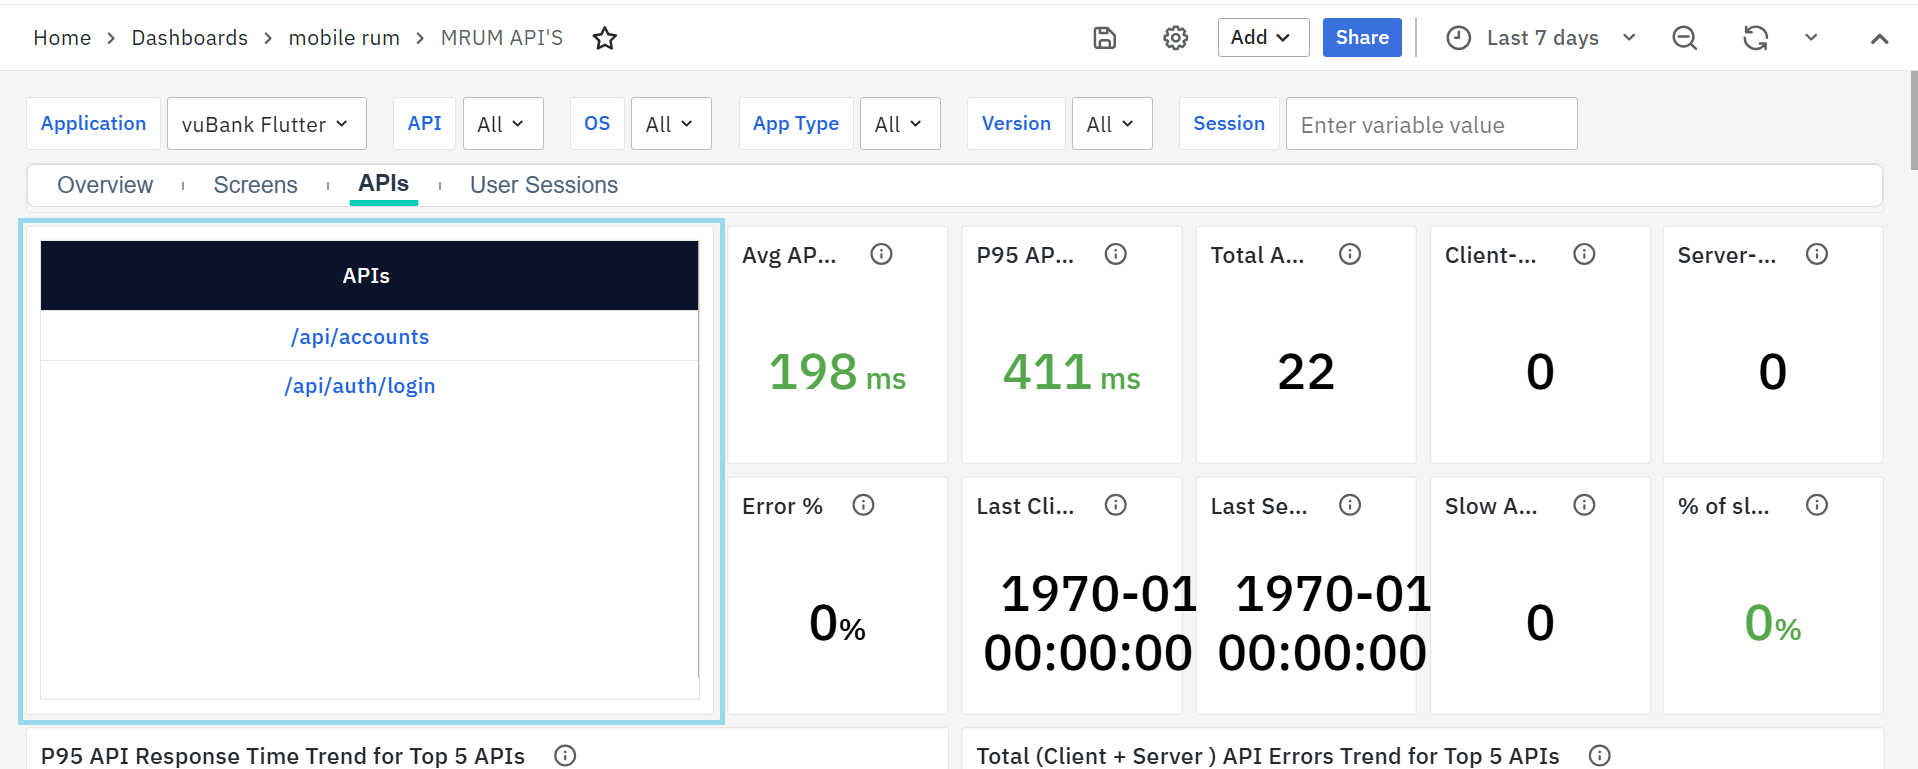
- This panel lists all the API endpoints used by your mobile application. Each row represents a specific API being called by the app.
- You can click on any API name to instantly filter the entire dashboard. Once selected, all panels update to show data related only to that API making it easy to analyze performance, errors, and latency for that specific endpoint.
Average API Response Time
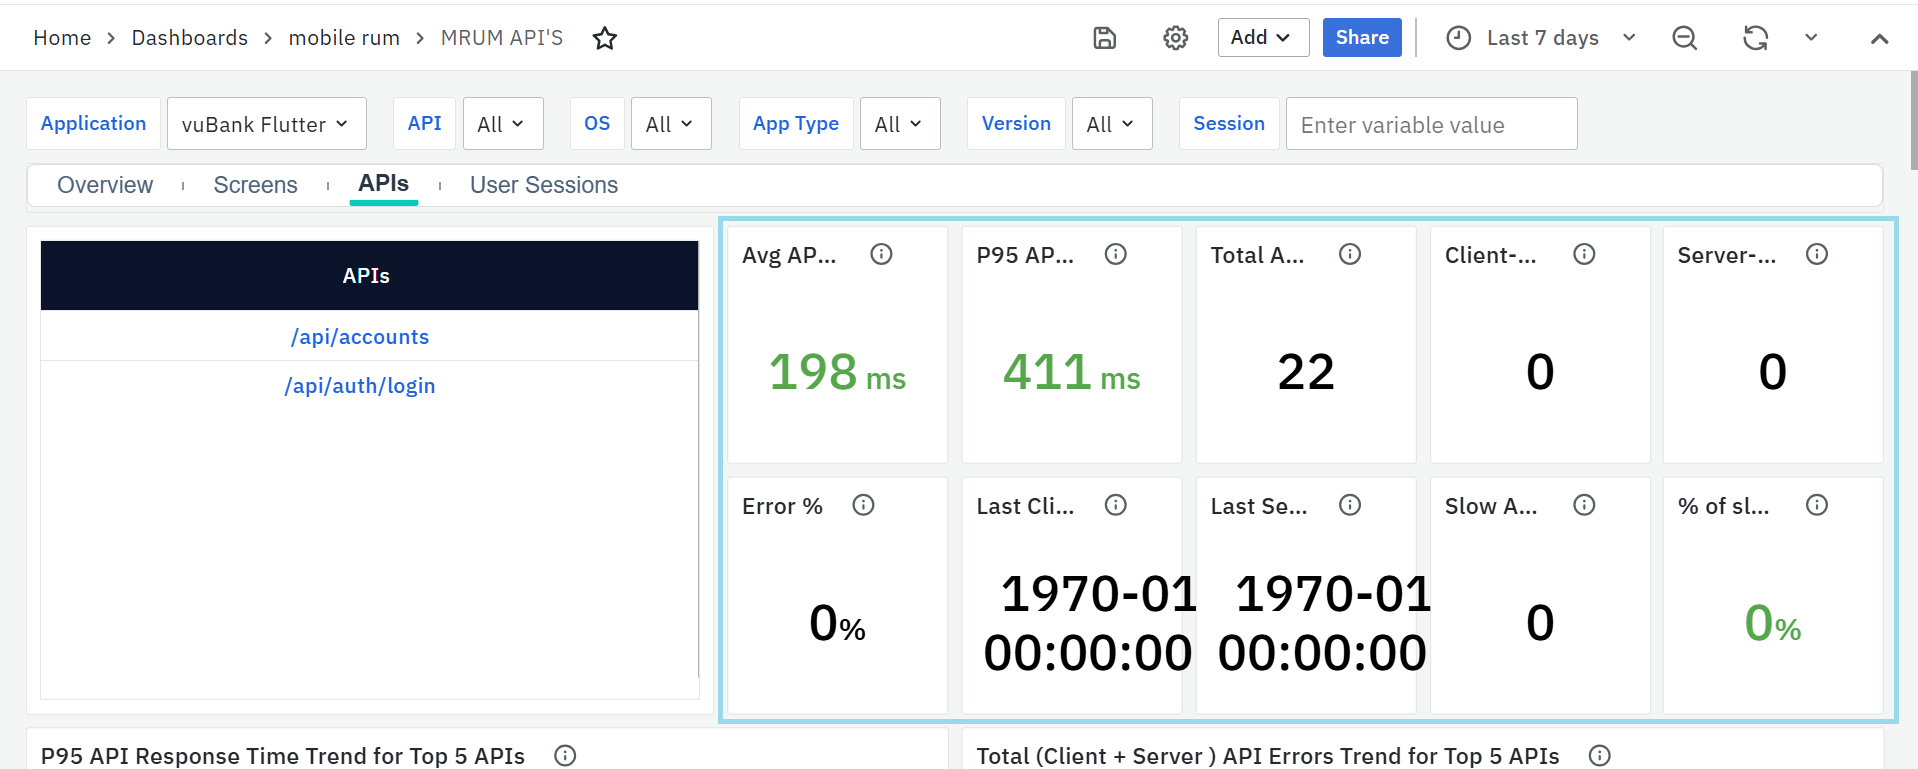
- Shows how long it takes, on average, for the backend to respond to API calls. A lower value indicates better performance and faster data delivery to users.
- If the response time goes above 500ms, it’s considered a performance concern and should be reviewed.
P95 API Latency
- Displays the 95th percentile response time — meaning 95% of all API calls finish faster than this value. It’s helpful for spotting occasional slow responses or performance spikes.
- Latency above 500ms suggests potential delays that might impact user experience.
Total API Call Count
- Shows how many times the selected API was called within the chosen time range. It gives a quick idea of the API’s usage level and helps identify high-traffic endpoints that may need optimization or load handling improvements.
Client-Side Errors
- Represents the number of errors that occurred on the user’s device, such as network issues, timeouts, or connection drops. These usually point to device or connectivity problems rather than backend issues.
Server-Side Errors
- Shows how many API failures came from the backend (like invalid responses, authorization errors, or internal server errors). Tracking these helps ensure backend reliability and stability.
Error Percentage
- Displays the ratio of failed API calls to total calls. A rising error percentage signals reliability issues that need immediate attention.
Last Client-Side Error
- Indicates when the most recent client-side issue occurred, helping teams understand if device-related or network issues are ongoing.
Last Server-Side Error
- Shows the timestamp of the most recent server-side error, useful for checking if backend issues are recurring or recently resolved.
Slow API Calls
- Counts how many API requests took longer than the expected response time (for example, more than 3 seconds). This helps identify endpoints that frequently respond slowly.
Percentage of Slow Calls
- Shows what percentage of total API calls were slow. A high value means that endpoint often struggles with latency and should be optimized.
P95 API Response Time Trend for Top 5 APIs
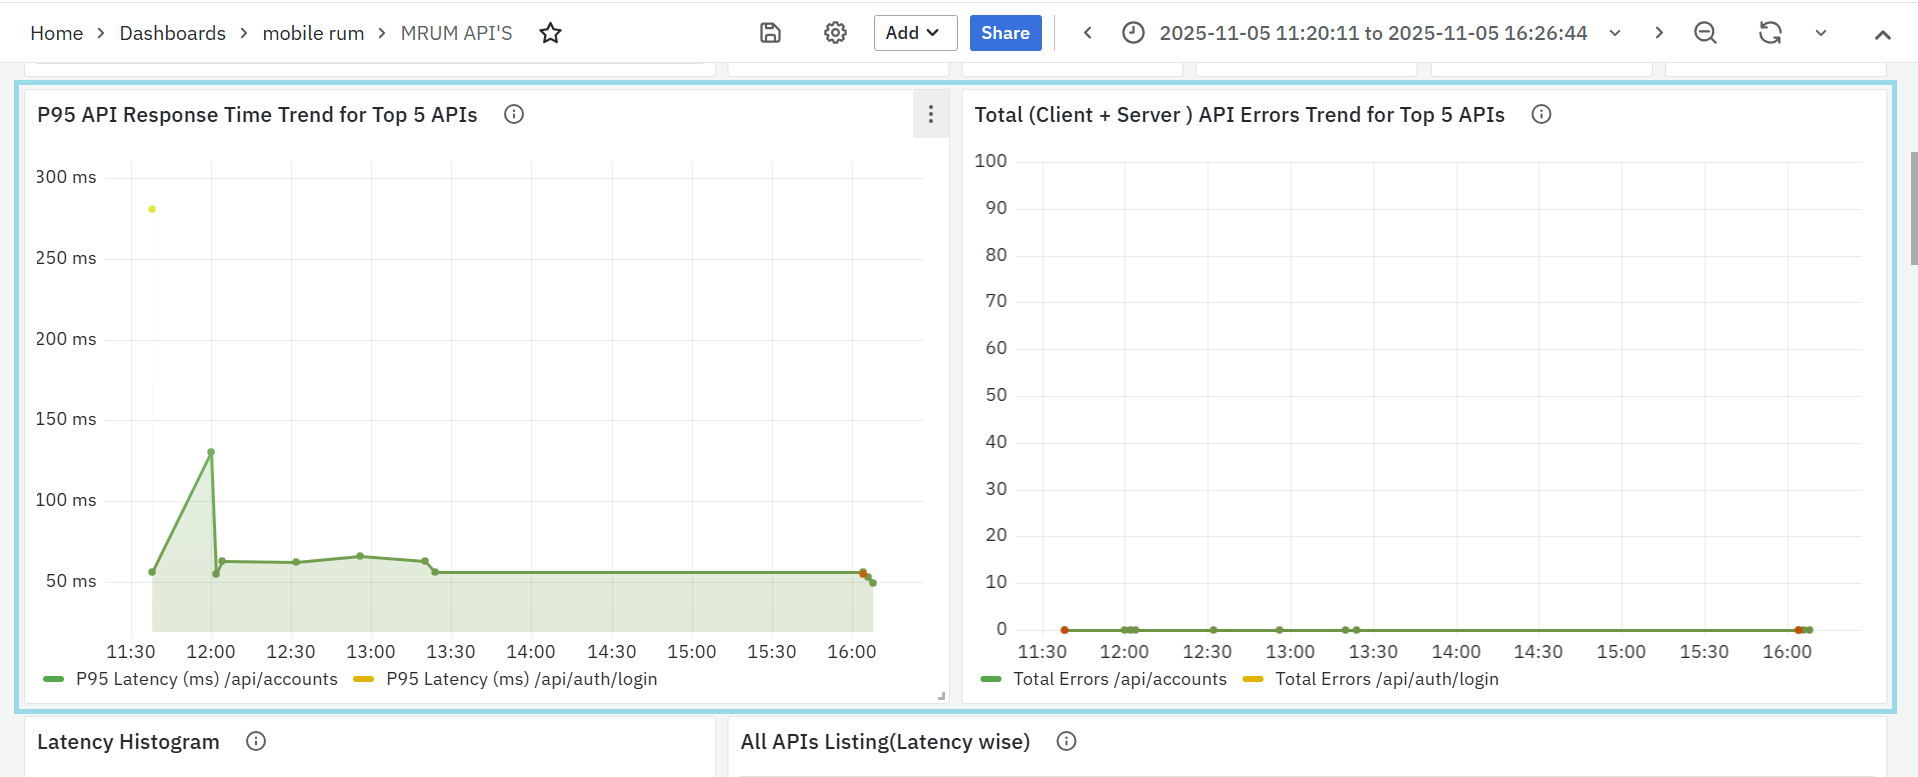
- This panel shows how the 95th percentile response time (P95) changes over time for the top 5 most-used APIs.
- It helps track overall backend performance and identify any sudden increase in latency that might affect user experience.
- Each line in the chart represents an API, allowing quick comparison between endpoints and helping developers detect performance drops after deployments or backend changes.
- Threshold: If API latency exceeds 500ms, it’s marked as critical and requires investigation.
Total (Client + Server) API Errors Trend for Top 5 APIs
- This panel shows how total API errors (both client-side and server-side) vary over time for the top 5 APIs.
- It helps teams identify when and where failures spike, making it easier to trace issues to recent changes, releases, or network conditions.
- Each line in the graph represents an API, helping compare error patterns across different endpoints.
- Threshold: Error spikes or latency above 500ms indicate performance degradation and should be analyzed further.
Latency Histogram
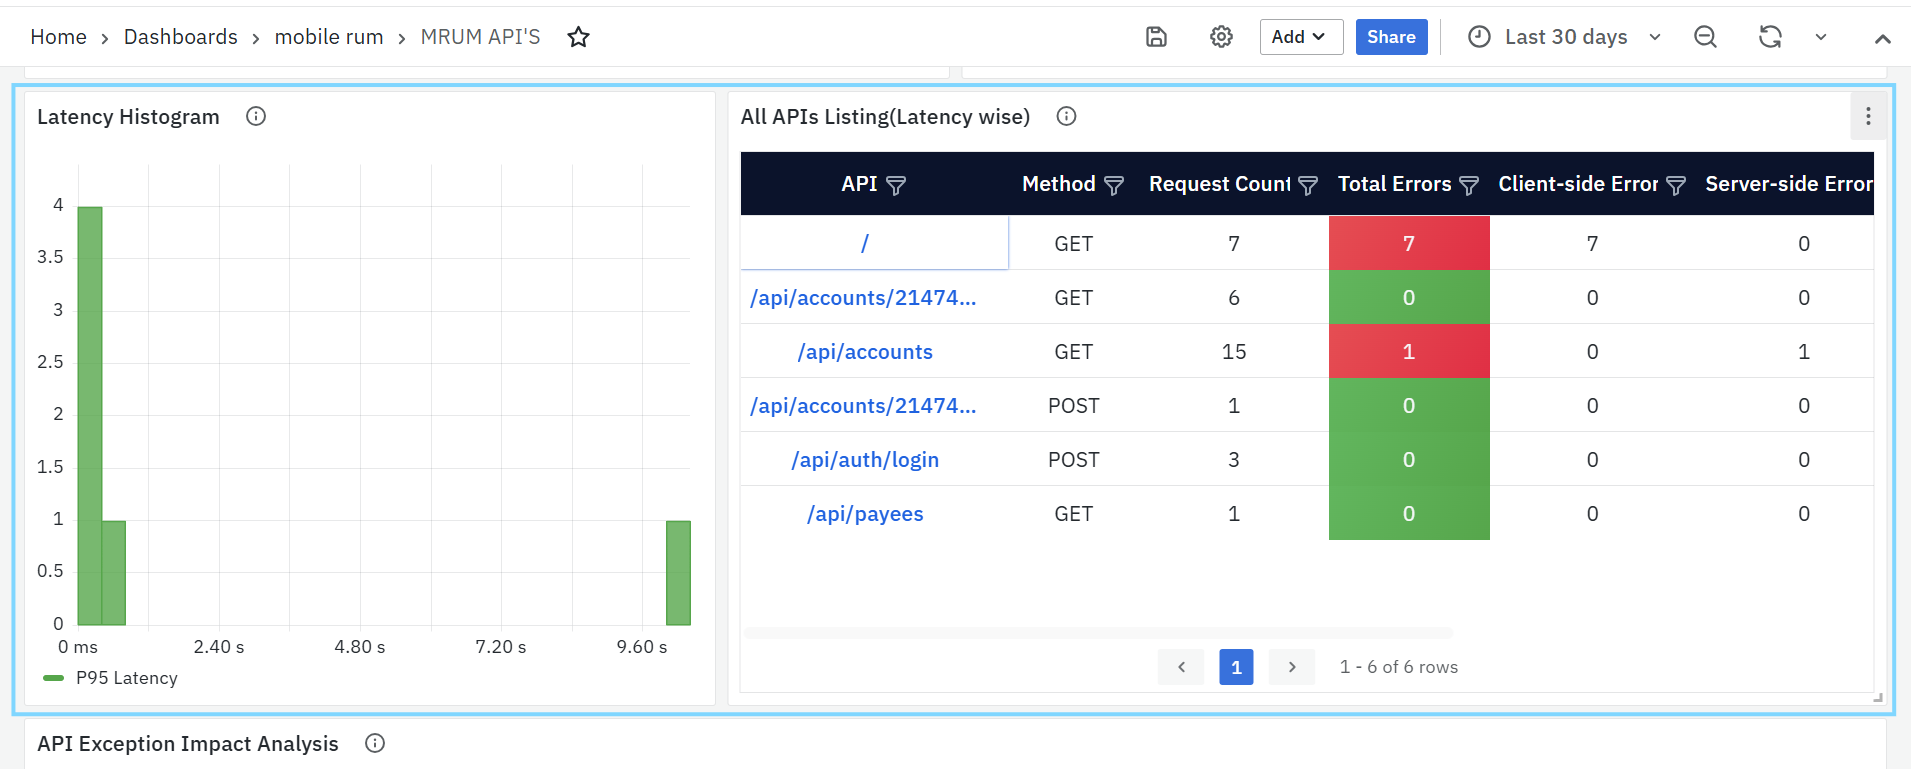
This panel shows a chart of API response times, grouped into different time ranges. It helps detect slow-performing APIs and overall response trends.
- P95 Latency: Shows the time under which 95% of API calls complete.
- This helps identify delays that impact most users and track how they change over time.
All APIs Listing (Latency Wise)
This panel lists all APIs used in the app, sorted by their latency from highest to lowest.
- API: Name or path of the API.
- Method: HTTP method (GET, POST, etc.).
- Request Count: Total number of times the API was called.
- Total Errors: Total failed requests across platforms.
- Client-side and Server-side Errors: Breakdown of where errors happened.
- P95 Latency: Shows how long the slowest 5% of calls took.
- Unique OS Count: Number of different operating systems that made the calls.
- Unique App Version Count: Number of different app versions that called the API.
API Exception Impact Analysis
This panel lists APIs that have encountered exceptions, along with details on how many sessions and users were affected. It helps teams quickly identify APIs causing major issues and understand their overall impact on users.
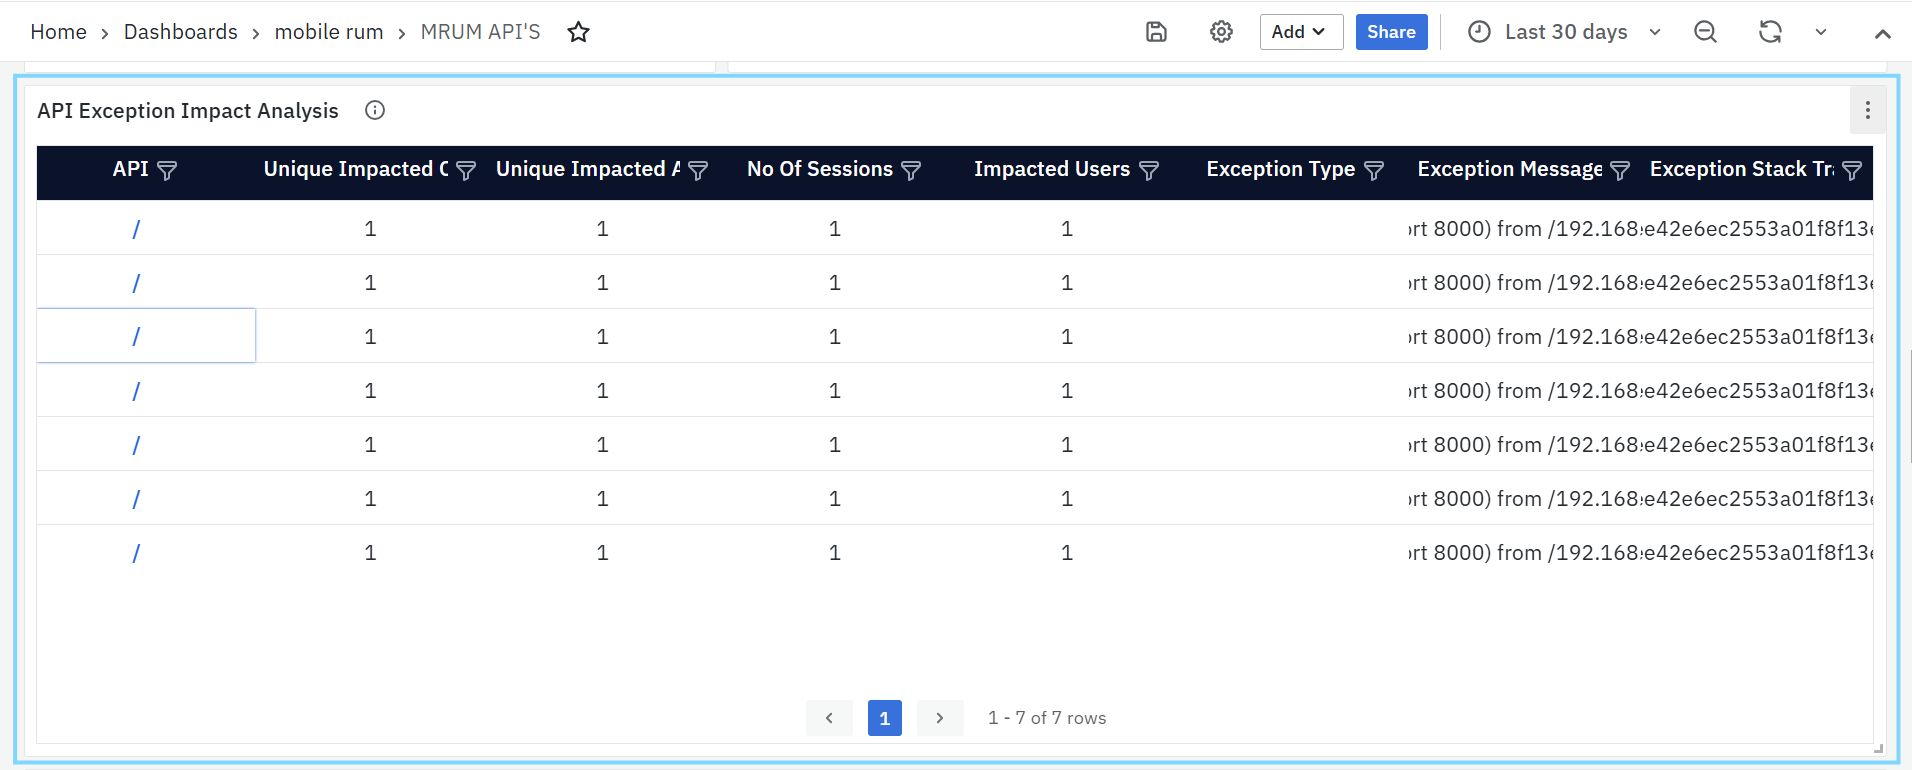
- API Name: The endpoint where the exception occurred.
- Impacted Sessions / Users: Shows how widespread the issue is.
- OS and App Version: Helps identify if the issue is platform or version specific.
- Exception Type, Message, and Stack Trace: Provides detailed information for debugging and finding the exact root cause.
API Errors Listing (Server Side)
This panel highlights APIs that are failing due to backend or server-side issues, typically represented by HTTP 5xx error codes. It helps developers quickly find underperforming APIs and detect problems originating from the backend.
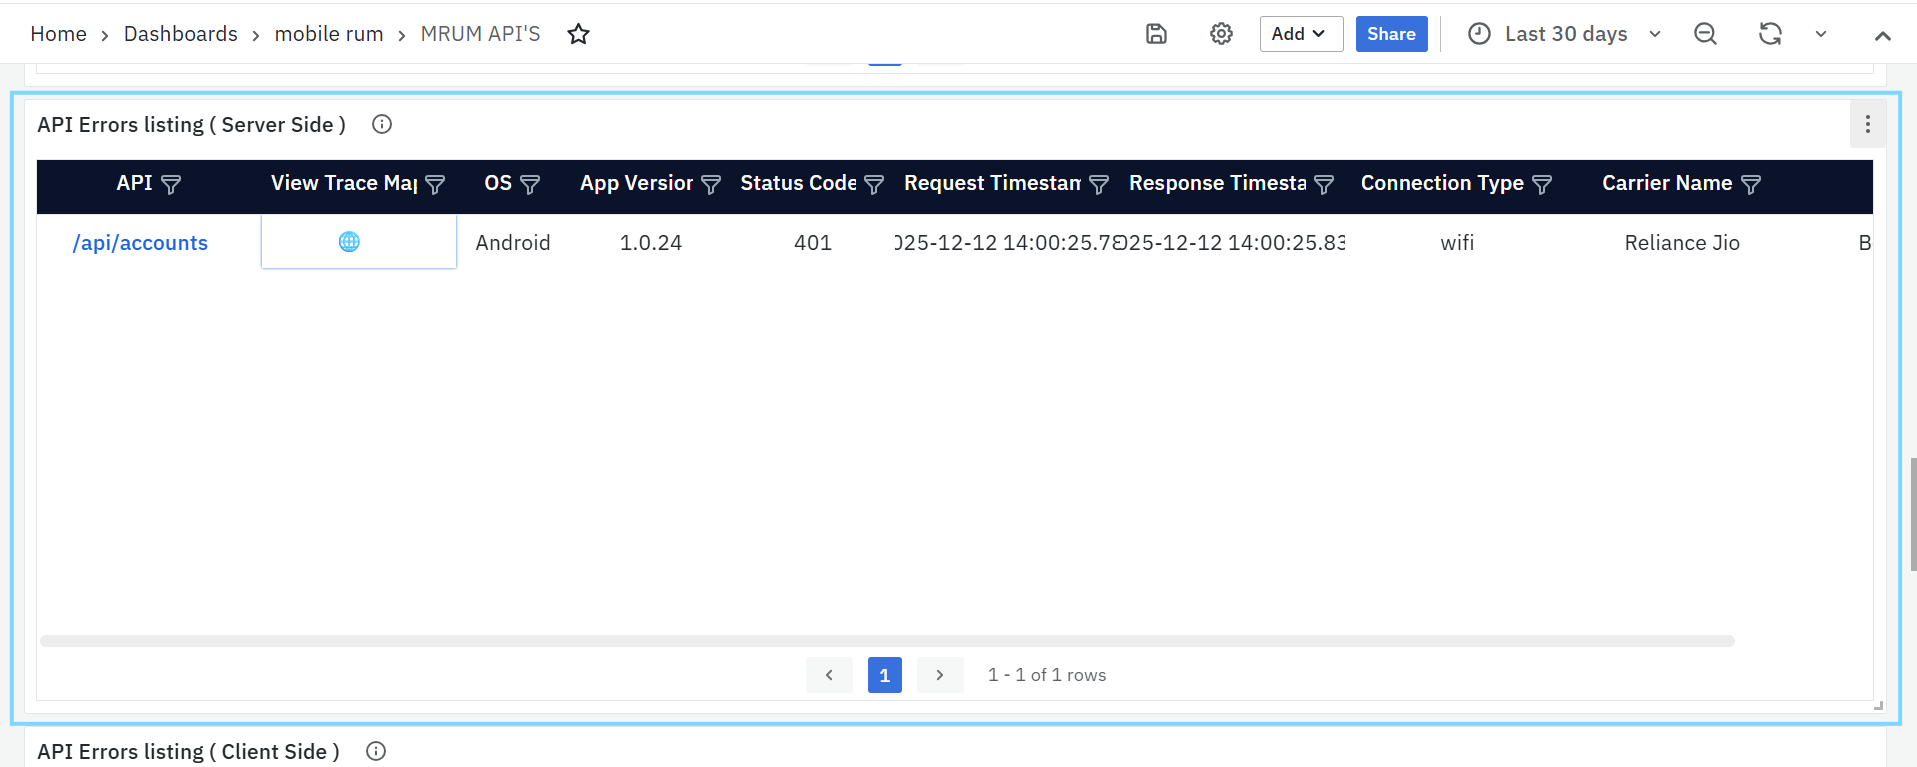
- API: Clickable link that opens the MRUM Trace Listing (APIs) dashboard for deeper investigation.
- Error Count: Number of server-side errors recorded.
- P95 Latency: Response time for the slowest 5% of failed requests.
- > 500ms: Shown in red (high latency)
- ≤ 500ms: Shown in green (acceptable latency)
- OS / App Version: Helps isolate platform- or version-specific backend issues.
- Error Codes: Server-side HTTP response codes (e.g., 500, 502)
- Connection Type & Carrier Name: Shows the network and provider used, helping trace if issues occur under certain network conditions.
API Errors Listing (Client Side)
This panel focuses on client-side errors, which usually result from network issues, timeouts, or app-level misconfigurations. It helps pinpoint failures happening on the user’s device rather than the backend.
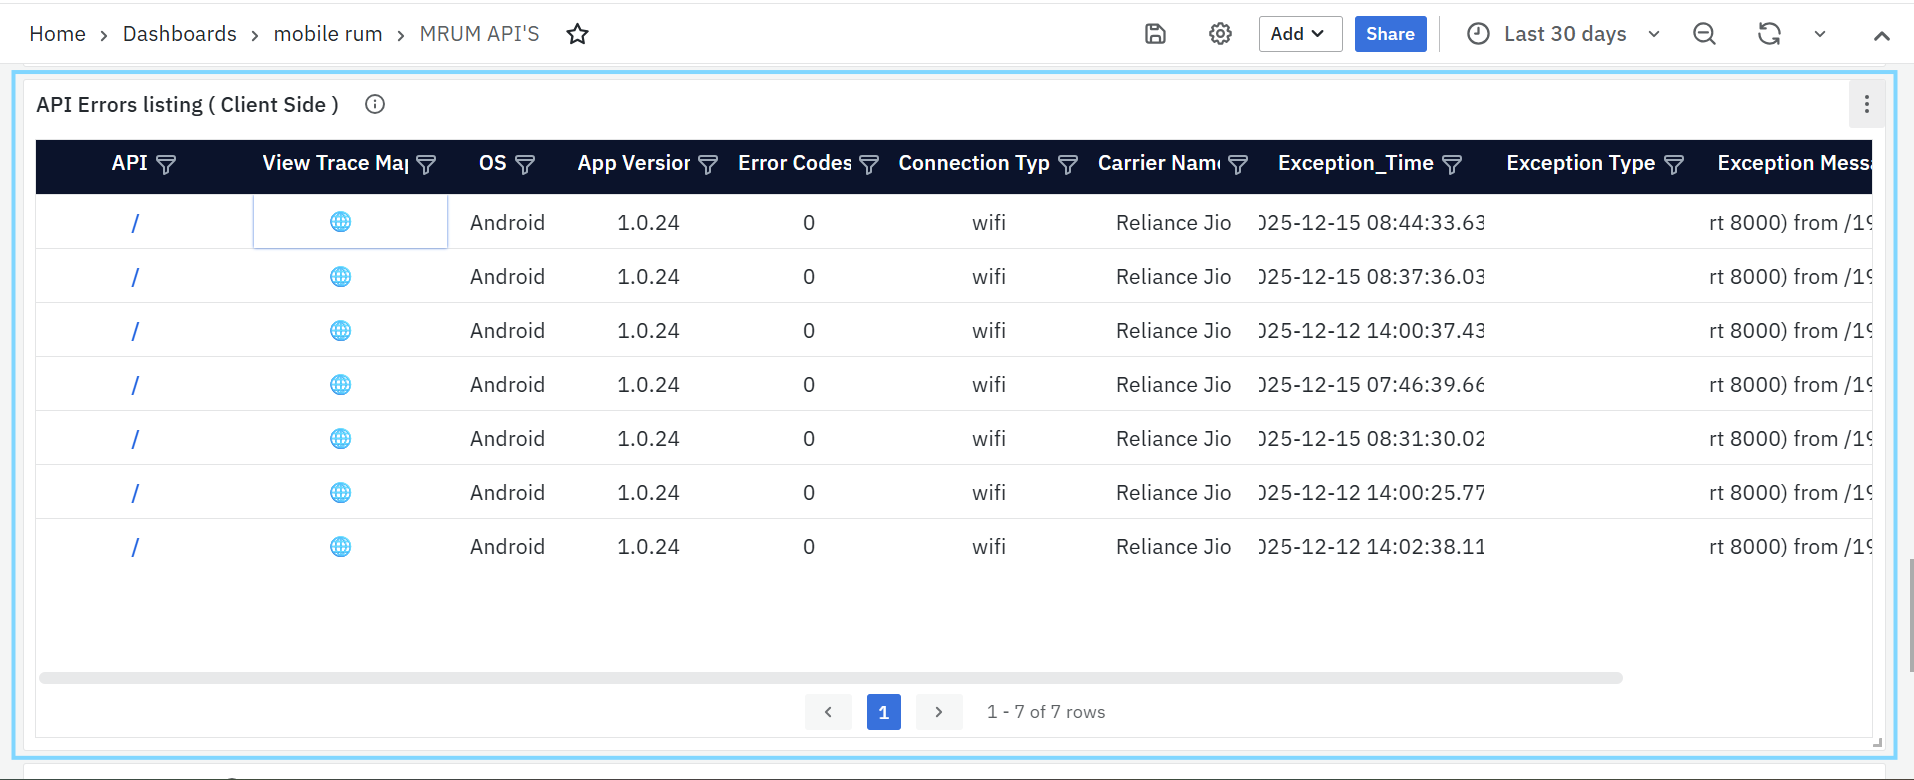
- API: Clickable link to the MRUM Trace Listing (APIs) dashboard for detailed error traces.
- Error Count: Number of failed client-side API calls.
- P95 Latency: The 95th percentile latency for these failed calls.
- > 500ms: Displayed in red (slow response)
- ≤ 500ms: Displayed in green (normal response)
- OS / App Version: Indicates where the issue occurred.
- Error Codes: Client-side error identifiers (e.g., 0 or custom codes).
- Connection Type / Carrier Name: Helps determine if failures are network-related.
- Error Details: Exception messages (e.g.,
TimeoutException,IOException) that help trace the cause of the failure.
Slow API Listing
This panel lists APIs with high latency specifically, where the 95th percentile response time exceeds the defined threshold (default: 3 seconds). It helps teams identify slow-performing APIs that may degrade app performance or user experience.
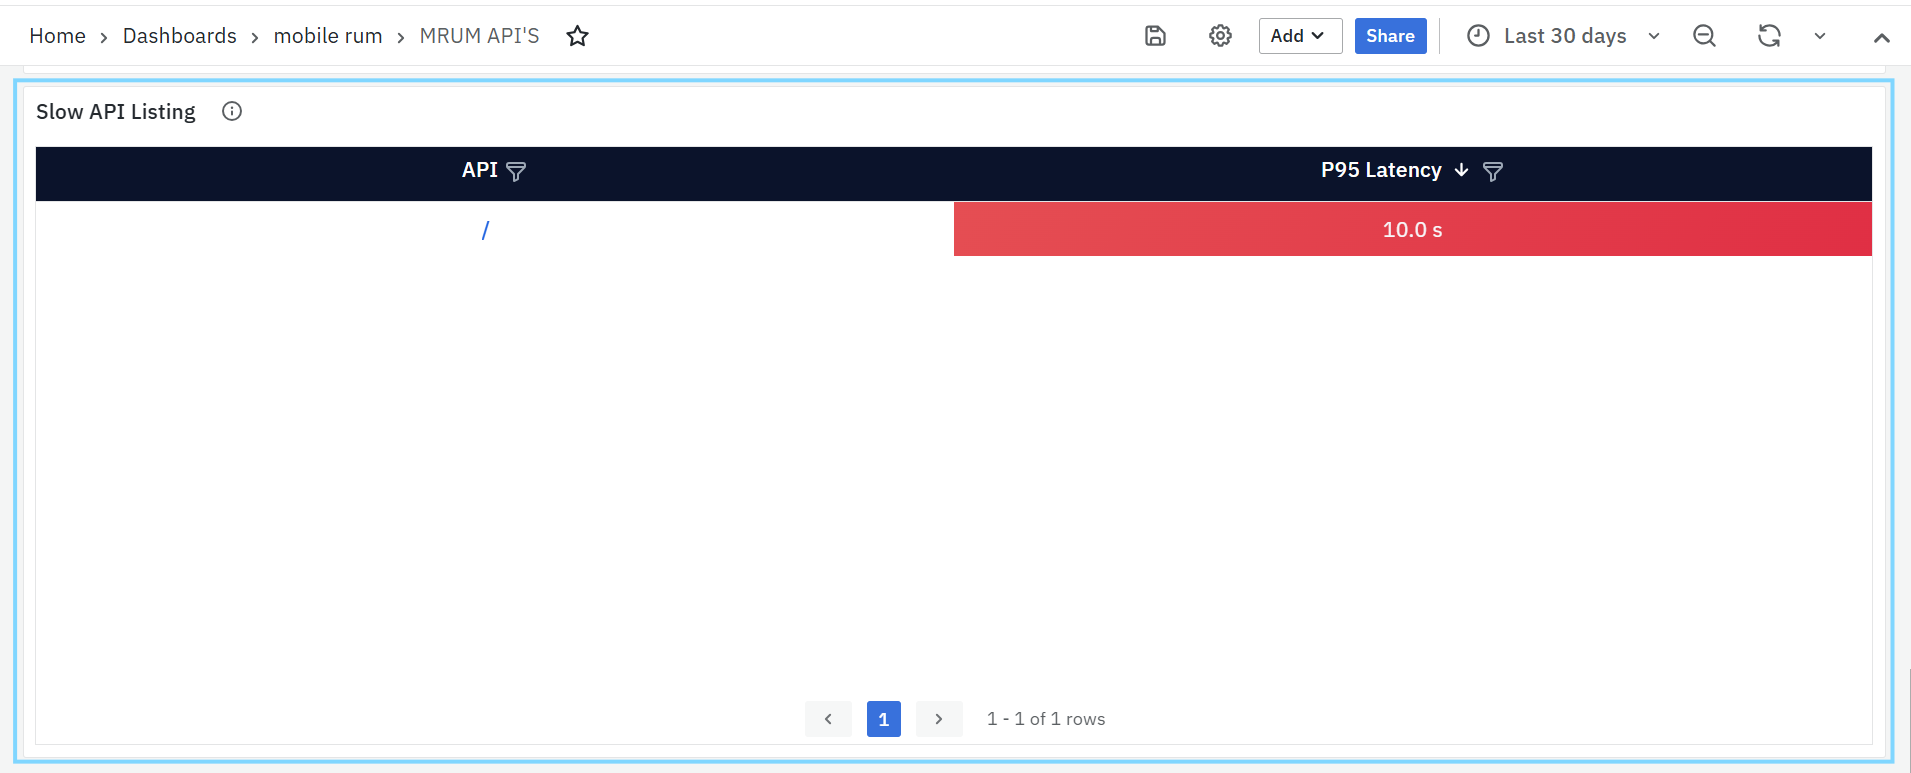
- API Name: Endpoint showing high latency.
- P95 Latency: The measured response time for 95% of calls.
- OS and App Version: Helps find performance issues specific to a version or platform.
Regularly monitoring this panel helps prioritize backend optimization and scaling efforts.
MRUM Slow Render
The MRUM Slow Render Dashboard helps identify screens in the mobile app that have UI lag due to slow frame rendering. It is useful for developers to improve app responsiveness and user experience.
MRUM Slow Render Tasks Panel
List of Slow Render Count
This panel shows the top 10 screens with the most slow-rendered frames. Slow renders occur when the screen takes longer than expected to draw, resulting in visible lag or stuttering.
To narrow down the data shown on this dashboard, you can use filters available at the top. Filters include Application, Screen, App Type, App Version, OS & Session. Each filter has a dropdown menu where you can choose specific values. This helps you focus on certain parts of the app and analyze performance more accurately.
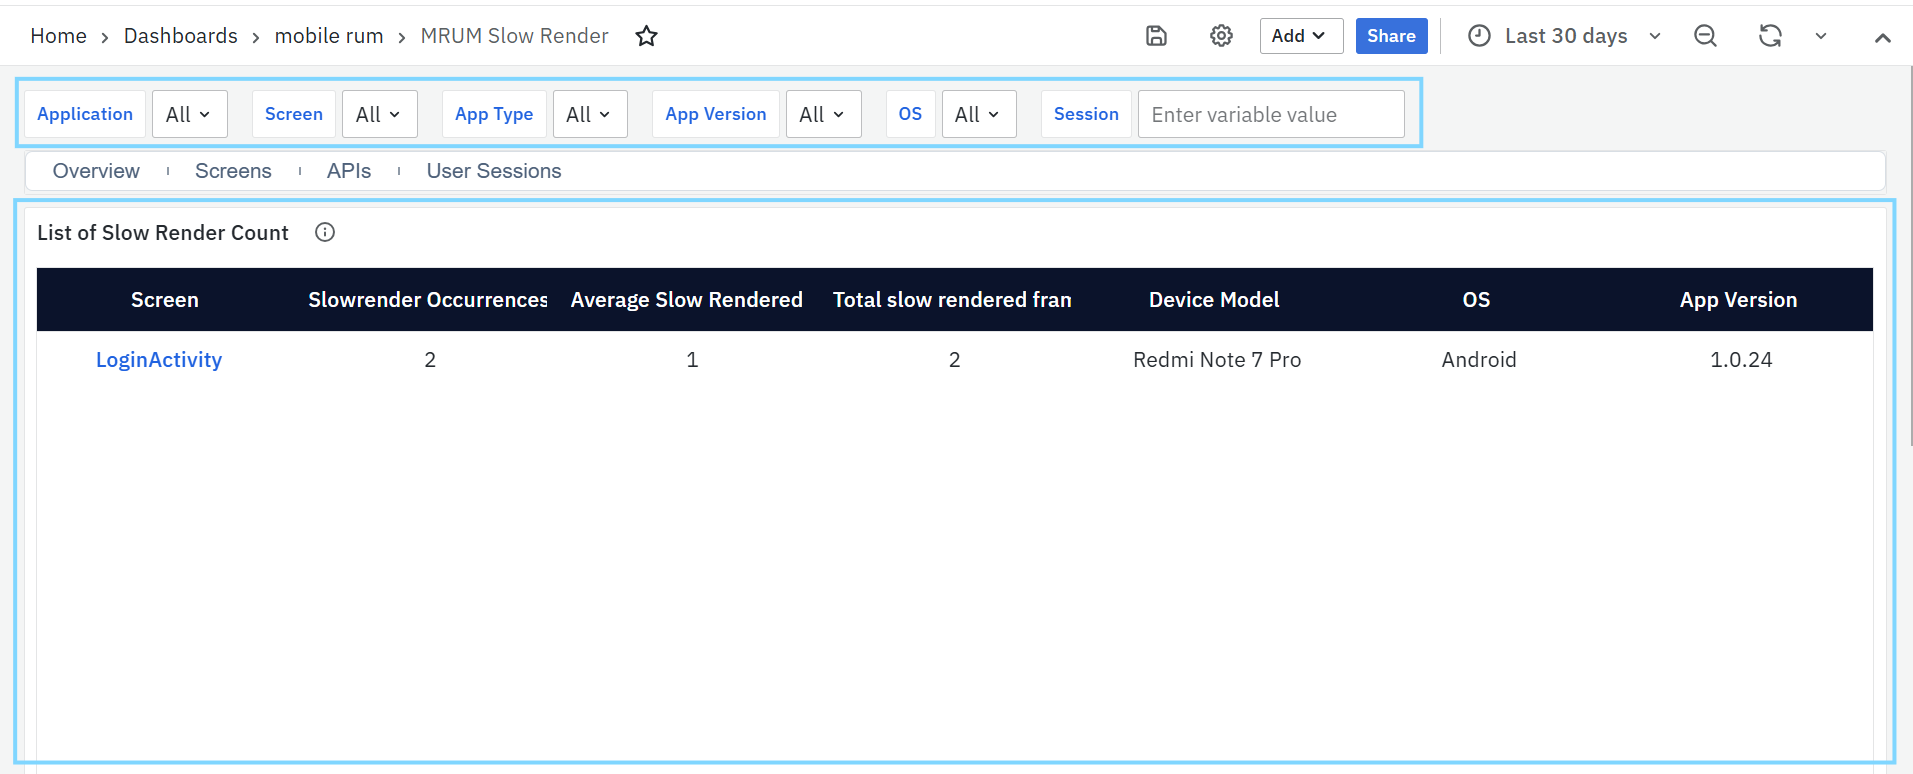
- Screen: Name of the screen where slow renders were detected.
- Slow Render Occurrences: Number of times slow render spans were recorded for the screen.
- Total Slow Rendered Frames in a Screen: Total number of frames that took too long to render, based on the sum of recorded span counts.
This panel helps teams find which screens need UI performance optimization.
MRUM User Sessions
The MRUM User Sessions Dashboard provides a detailed view of how users interact with your mobile app. It tracks session activity, platform usage, performance trends, and app stability across different screens, devices, OS versions, and network conditions..
To narrow down the data shown on this dashboard, you can use filters available at the top. Filters include Application, User ID, OSand App Version Duration Range In minute. Each filter has a dropdown menu where you can choose specific values. This helps you focus on certain parts of the app and analyze performance more accurately.
MRUM User Sessions Panel
Total User Sessions
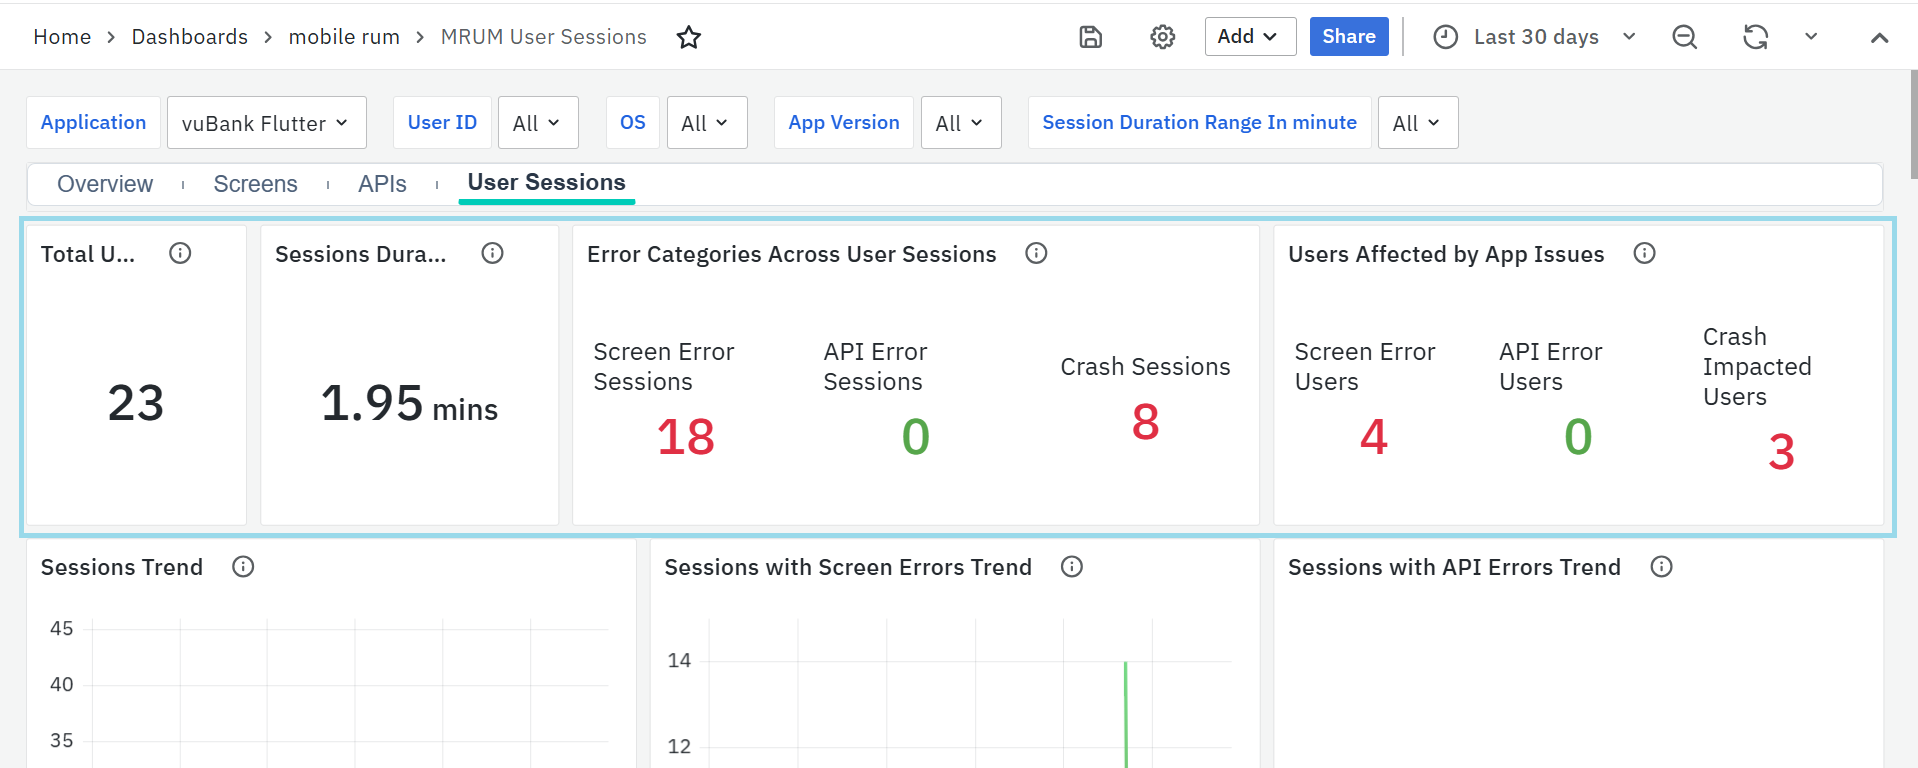
- Displays the total number of sessions recorded. Each session represents a user’s continuous interaction with the app.
- This helps track user engagement and overall app usage.
Session Duration (Avg)
- Displays the average duration of user sessions, showing how long users typically stay active in the app.
- This helps identify engagement patterns and detect sudden drops that may indicate crashes, performance issues, or usability problems.
Error Categories Across User Sessions
- Shows the number of sessions impacted by screen errors, API failures, and crashes.
- Gives a complete view of issues affecting the user experience and helps prioritize fixes.
Users Affected by App Issues
- Displays how many unique users faced app problems like crashes, frontend screen errors, or API failures.
- Helps measure how widespread the issues are and which areas need urgent attention.
Sessions Trend

- Shows how the number of sessions changes over time.
- Useful for spotting usage spikes or drops and understanding traffic patterns.
Sessions with Screen Errors Trend
- Tracks how often sessions had screen-level issues like missing elements or slow rendering.
- Helps identify patterns in UI problems over time.
Sessions with API Errors Trend
- Shows the daily trend of sessions that had API issues such as timeouts or failures.
- Useful for tracking backend reliability from the user's perspective.
Sessions with Crashes Trend
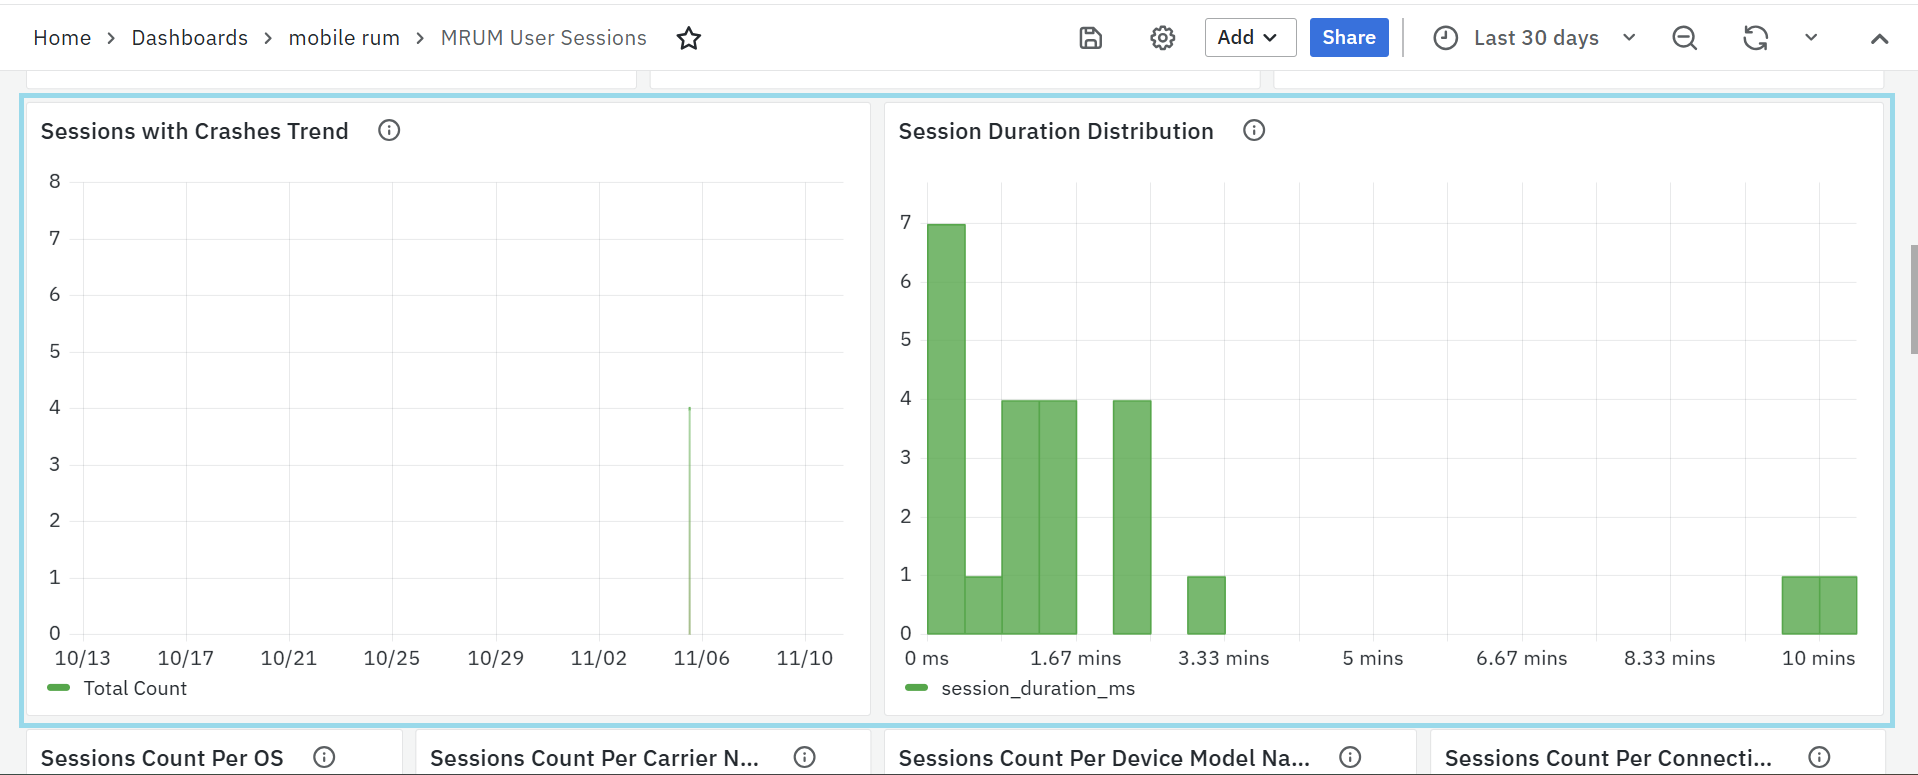
- Displays how crash incidents change over time.
- Helps detect if new updates or third-party changes are causing more crashes.
Session Duration Distribution
- Shows how long sessions last, grouped into different time ranges.
- Helps understand whether users are dropping off early or staying engaged.
Sessions Count Per OS
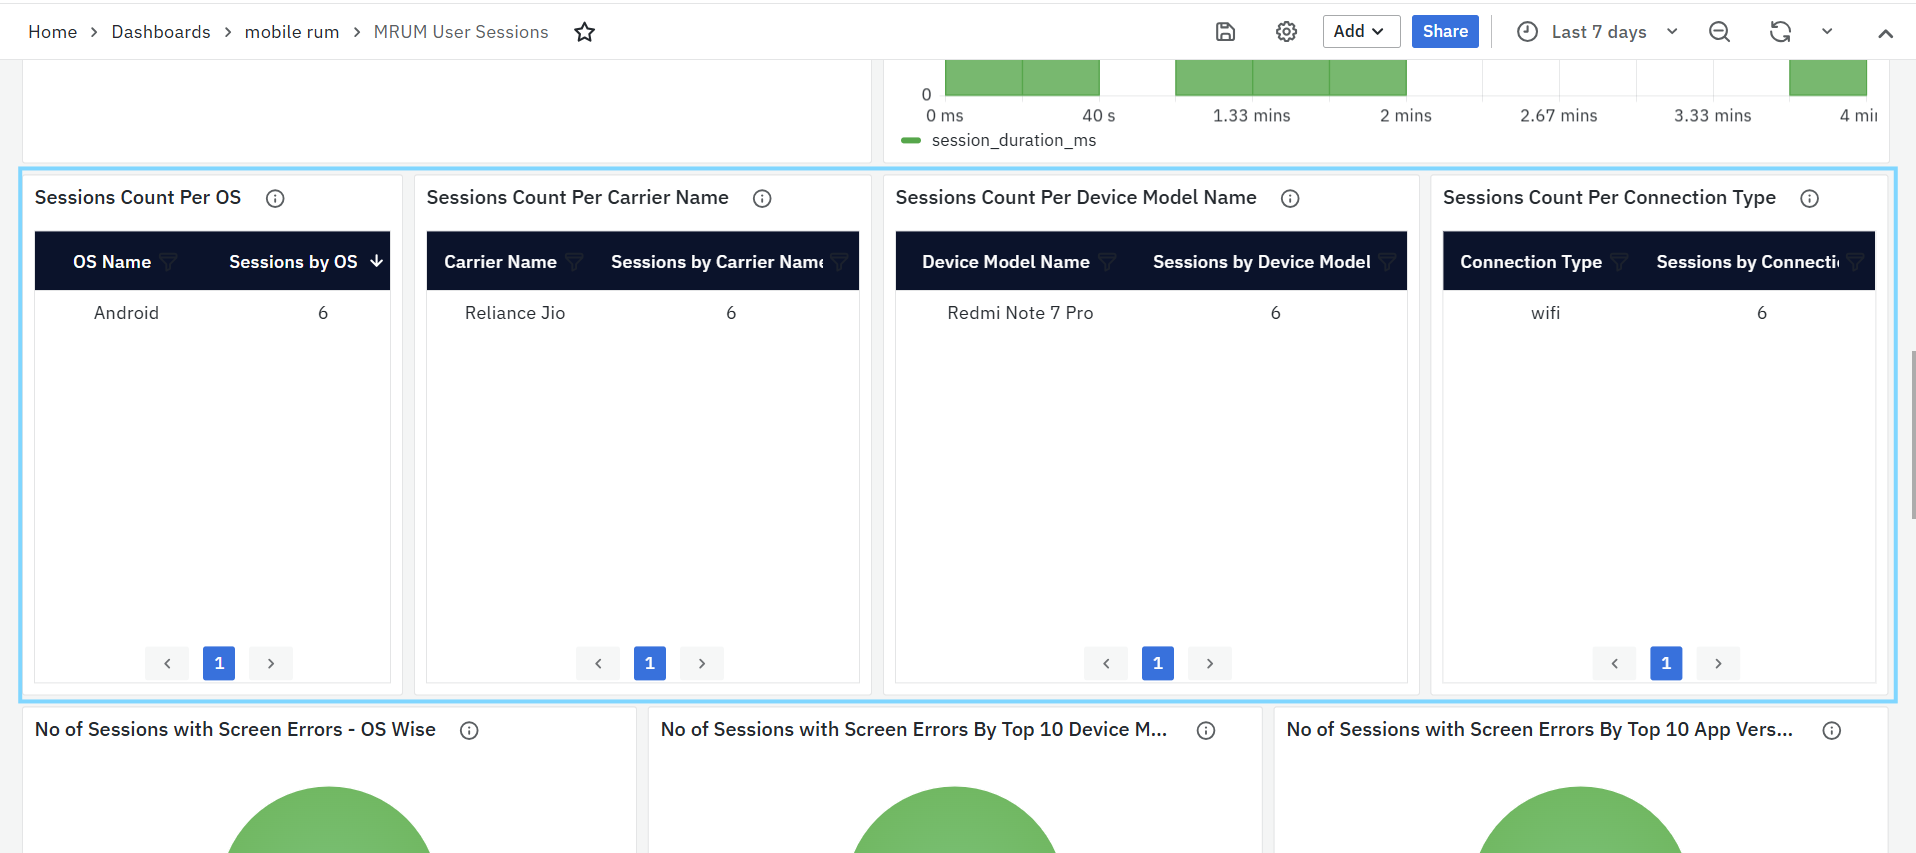
- Breaks down total sessions by operating system (e.g., Android, iOS, Flutter).
- Helps analyze platform usage and detect OS-specific trends.
Sessions Count Per Carrier Name
- Shows session counts grouped by mobile network provider (e.g., Jio, Airtel).
- Useful for identifying network-related trends.
Sessions Count Per Device Model Name
- Lists session counts by device model (e.g., Samsung Galaxy S22, OnePlus 11).
- Helps detect if certain devices are more frequently used or impacted.
Sessions Count Per Connection Type
- Shows how many sessions occurred over different connection types (e.g., Wi-Fi, 4G, 5G).
- Useful for understanding user environments and potential network bottlenecks.
No of Sessions with Screen Errors – OS Wise
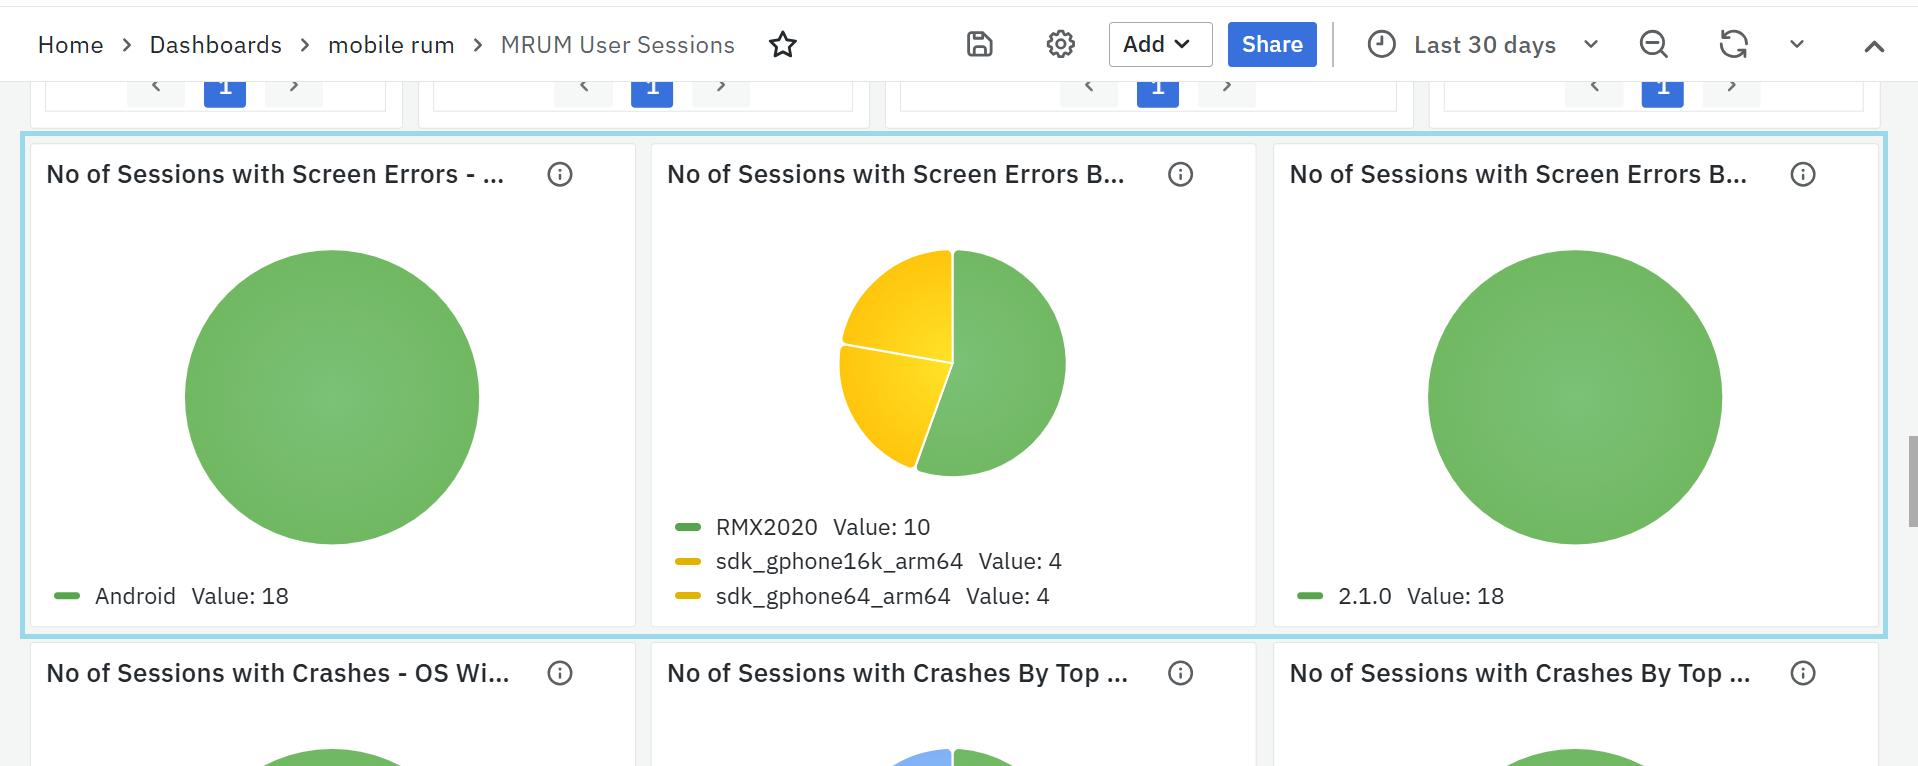
- Displays sessions with screen-level errors grouped by OS.
- Helps prioritize UI fixes based on platform impact.
No of Sessions with Screen Errors by Top 10 Device Model Name
- Groups screen error sessions by device model.
- Helps detect device-specific UI issues.
No of Sessions with Screen Errors by Top 10 App Versions
- Groups screen error sessions by app version.
- Helps track bugs introduced in specific releases.
No of Sessions with Crashes – OS Wise
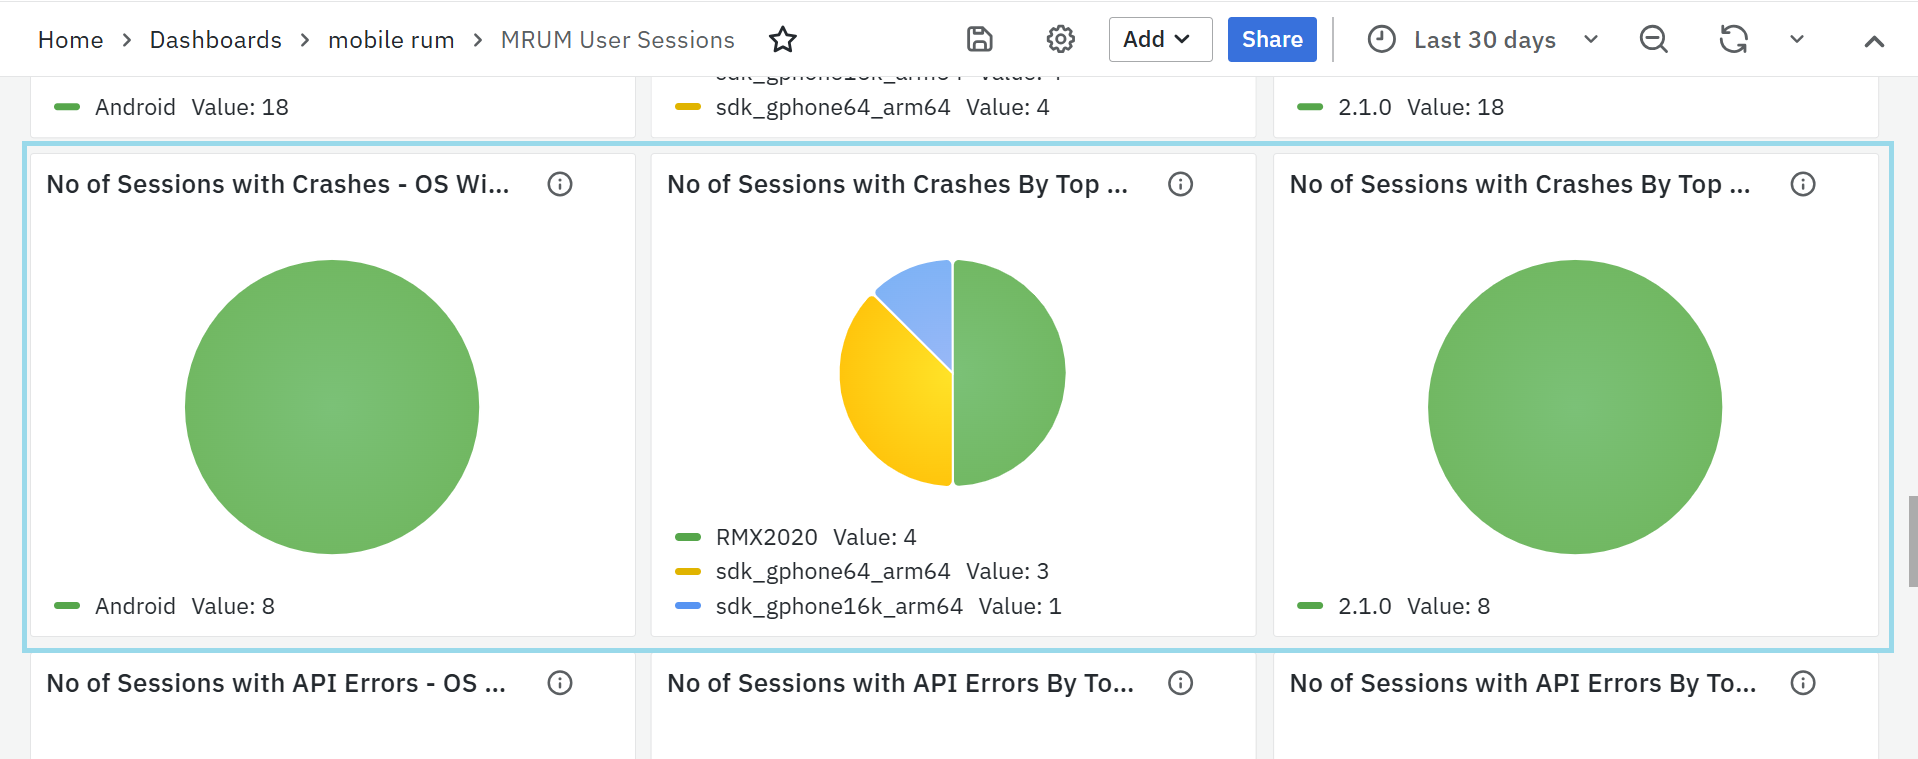
- Groups crash sessions by OS.
- Helps detect if crashes are OS-specific.
No of Sessions with Crashes by Top 10 Device Models
- Shows which devices are most affected by crashes.
- Useful for prioritizing device-specific debugging.
No of Sessions with Crashes by Top 10 App Versions
- Lists app versions with the most crashes.
- Helps track release stability and plan hotfixes.
No of Sessions with API Errors – OS Wise
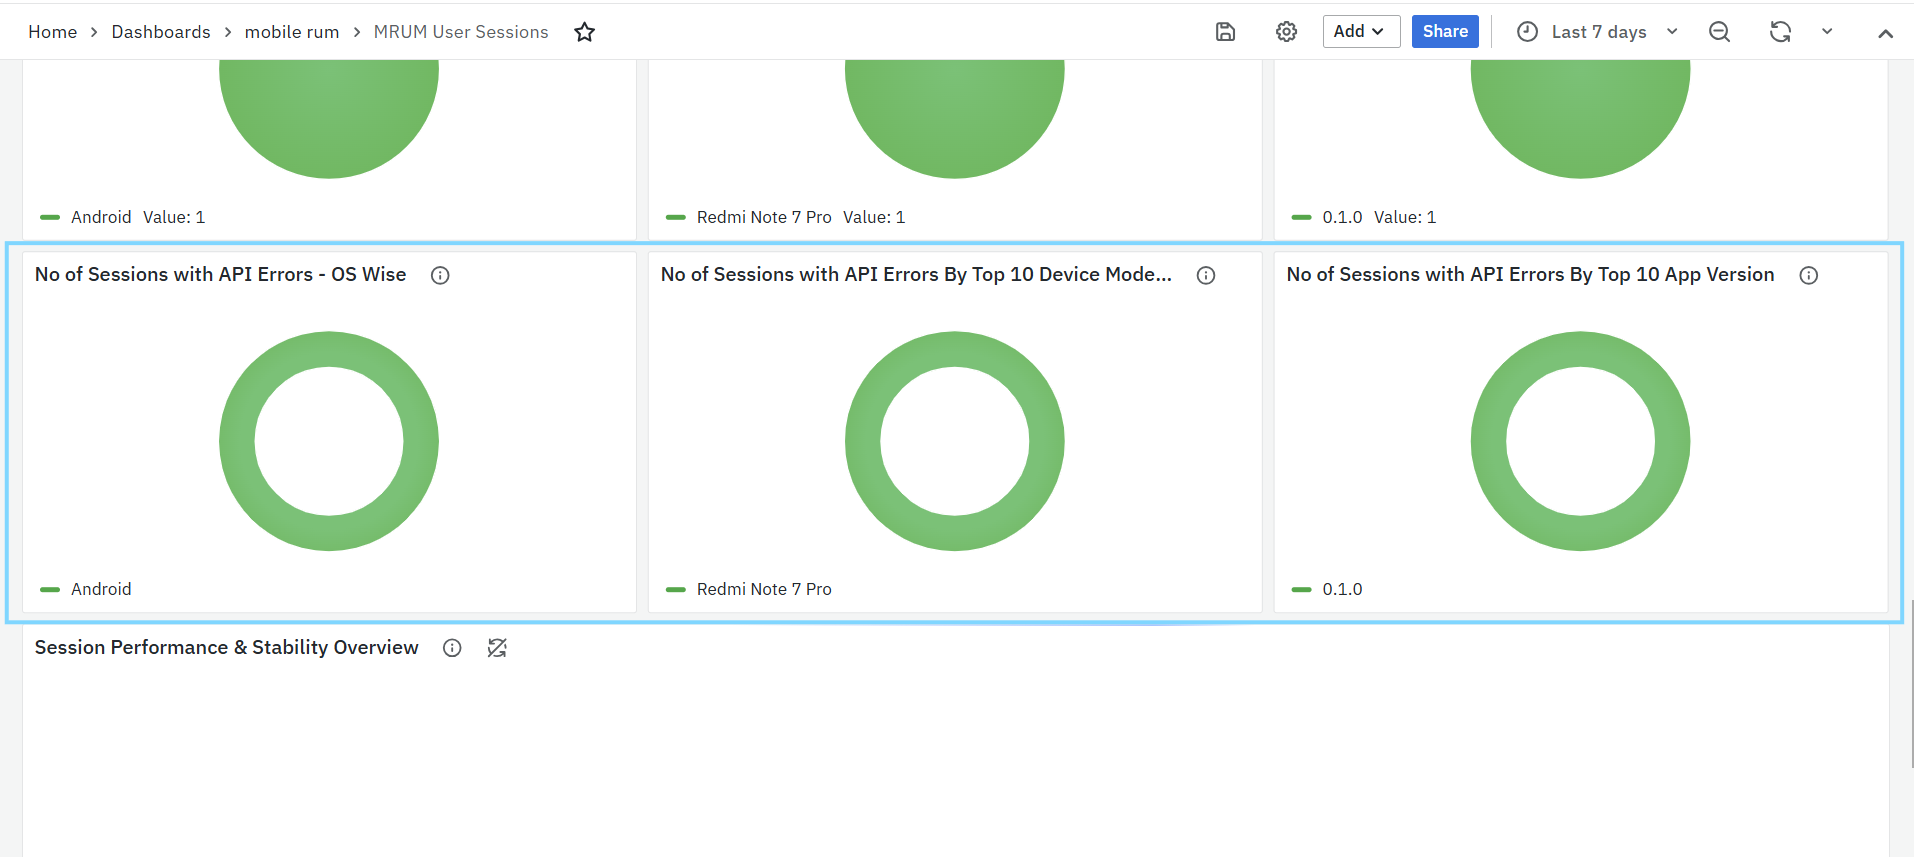
- Groups API error sessions by OS.
- Useful for detecting platform-related API issues.
No of Sessions with API Errors by Top 10 Device Models
- Shows which device models faced the most API issues.
- Helps with testing and optimization on those devices.
No of Sessions with API Errors by Top 10 App Versions
- Groups API error sessions by app version.
- Helps identify releases that introduced backend instability.
Session Performance & Stability Overview
Provides a row-wise view of individual sessions with key details.
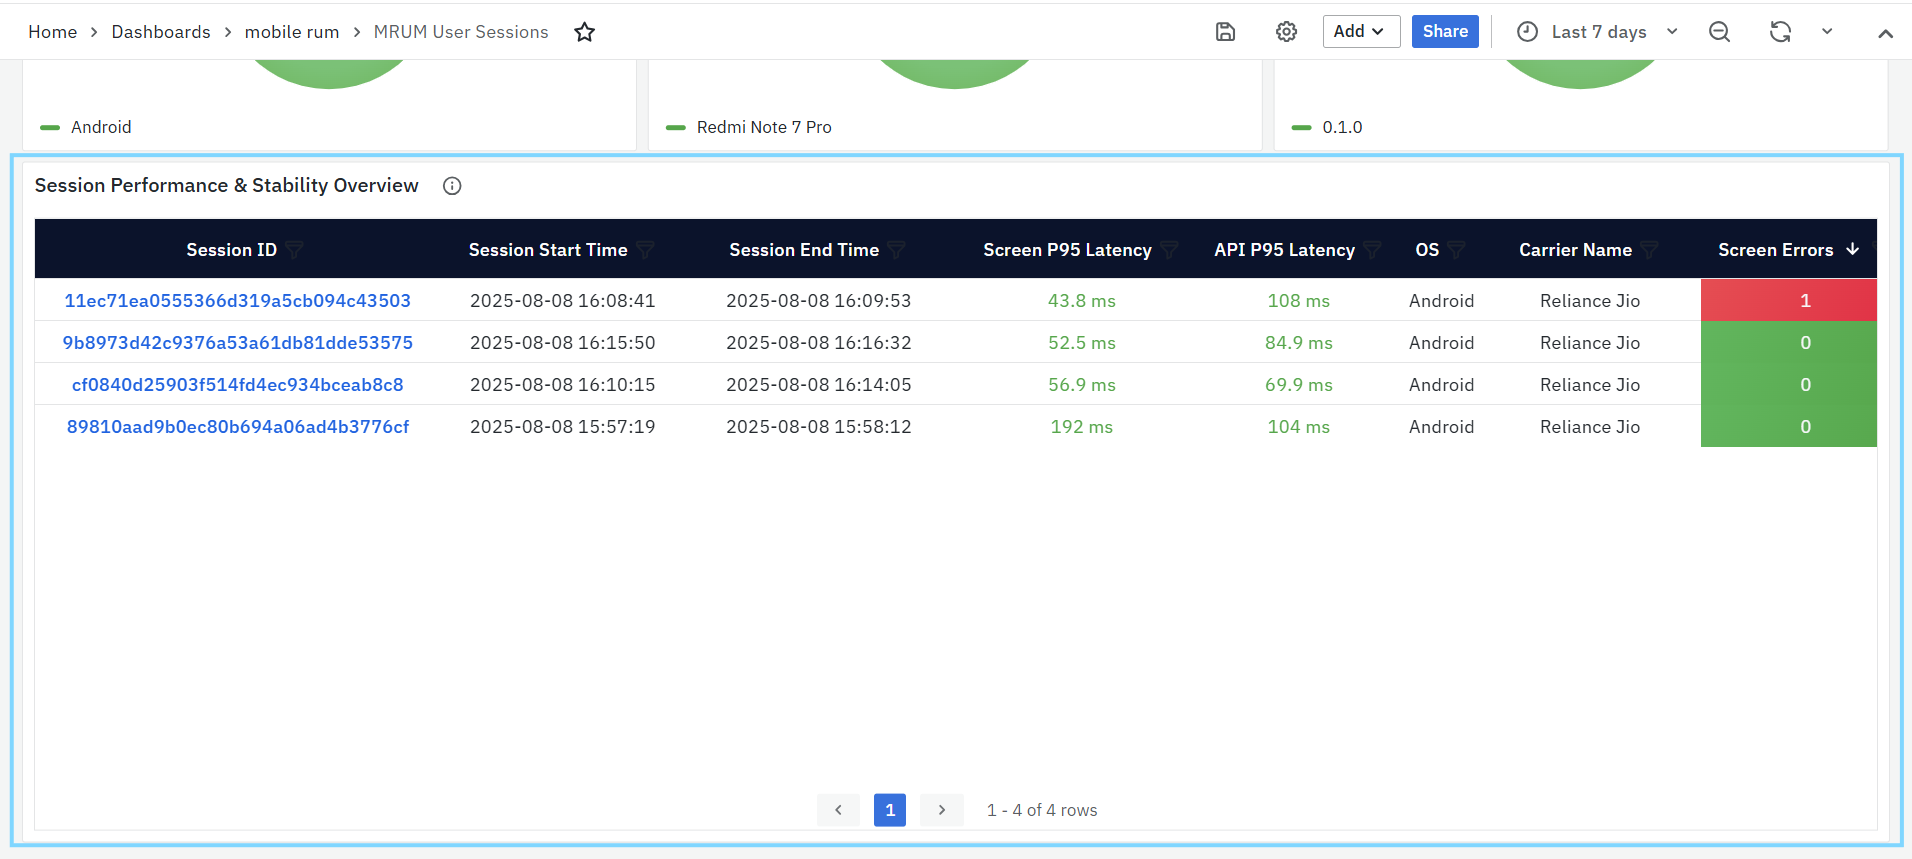
- Session ID: Unique identifier for the session.
- Session Start/End Time: When the session began and ended.
- Screen P95 Latency: How slow the UI was for most screens in the session.
- API P95 Latency: How slow API calls were in that session.
- OS & Carrier Name: The device platform and network provider.
- Screen Errors / API Errors: Number of frontend/backend errors in the session.
- Crashes / ANRs: Number of crashes or app freeze events in the session.
Trace Listing Dashboards
MRUM Tracelisting
The MRUM Trace Listing Dashboard provides a detailed list of individual traces collected from the selected mobile application. It helps you analyze request-level performance and identify latency or failure points within user sessions.
You can use the filters at the top to narrow down results such as by Application, Trace ID, HTTP Status Code, API, Screen, Host, or Session. The View Type option lets you switch between different trace views to focus on either Screens or APIs or All as needed.
All Traces (Screens / APIs)
This panel lists up to the most recent 1,000 traces, showing key details for monitoring and troubleshooting.
Each trace includes the following details:
- Trace ID: Clickable link that opens the MRUM Trace Map for deeper trace visualization.
- Span ID: Unique identifier for the specific span within the trace.
- Session ID: The session in which the trace occurred.
- Duration: Time taken to complete the full user or API request.
- HTTP Status: The response code returned (e.g., 200, 404, 500).
- Status: Indicates whether the request succeeded or failed.
- Start Time: When the trace started.
- Host Name: The server or host that handled the request.
Trace Visualization Dashboards
MRUM Trace Map
The MRUM Trace Map offers a comprehensive, visual representation of a single transaction as it flows through various services and components within your system. By tracking each step, or "span," of the request's journey, it provides a clear view of how the request progresses, which services it interacts with, and the duration of each step. This helps teams identify delays, errors, or unusual patterns in the request processing, essential for diagnosing performance issues and understanding the dependencies and interactions within the application. The dashboard includes a customizable Trace ID, service Name, status code & span Time filter, allowing you to specify the trace you wish to investigate, helping you zoom in on specific requests for detailed analysis.
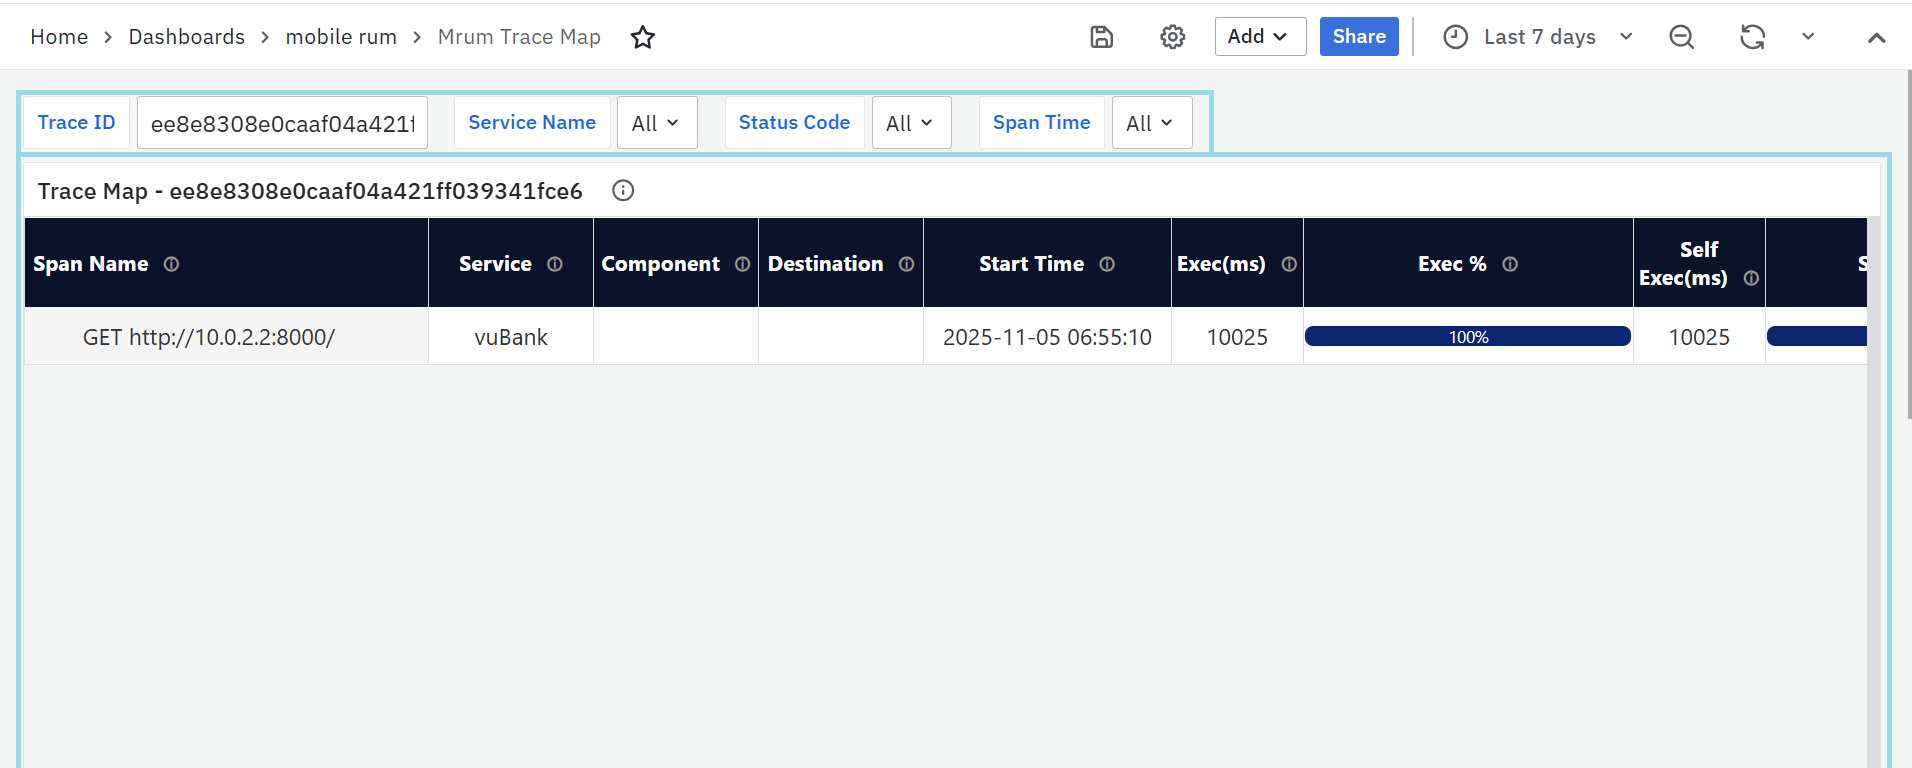
Trace Map - [Selected Trace ID]
The Trace Map panel shows the detailed path of the request, highlighting the key components involved in the transaction. The visualization includes the following section:
- Span Name: Represents individual operations or actions within the trace, such as function calls or database queries. These spans are arranged hierarchically, reflecting the sequence of events in the request flow.
- Service: Indicates which application or microservice is responsible for a particular span, providing insight into which part of the system executed the operation.
- Start Time: The exact moment when each span began. This helps establish a timeline of events as the request travels through different system components.
- Exec (ms): The total execution time for each span, including time spent on dependent or child spans. It shows how long the operation took to complete, including any external service calls or database queries.
- Exec %: This is the percentage of the total trace duration that each span consumes. It highlights which span is consuming the most time within the entire request process.
- Self Exec (ms): The execution time of the span itself, excluding the time taken by child spans or dependent operations. It reflects the time spent on that specific operation alone.
- Self Exec %: The percentage of the total trace duration that is dedicated to the span’s own execution, excluding the time of any nested or dependent operations.
- HTTP Code: Represents the HTTP status code for spans involving HTTP requests or responses. It indicates the outcome of the HTTP operation, helping identify success or errors.
- Span Status: Reflects the overall outcome of the operation captured in the span. This indicates whether the operation was completed successfully or encountered an issue, regardless of the HTTP status code.
User Session Insights
The User Session Details Dashboard provides a detailed view of an individual user session, helping analyze performance, stability, and user interactions. It is divided into multiple panels that focus on screens, APIs, rendering performance, errors, and user journey.
MRUM User Session Details
Screens
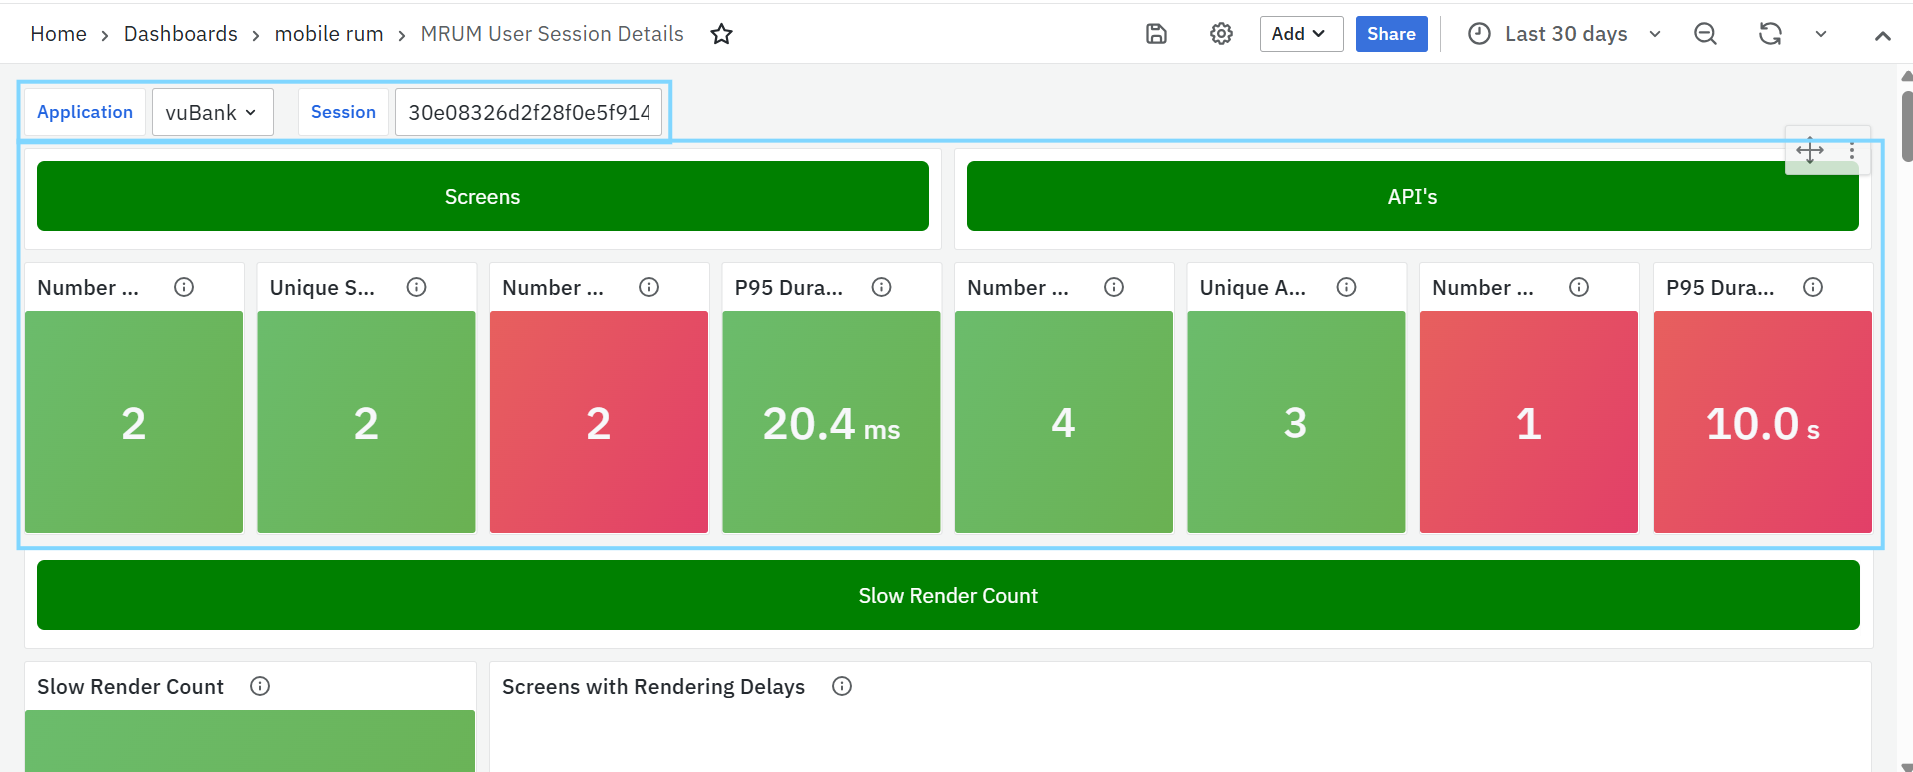
- Number of Requests – Total screen requests made during the session.
- Unique Screens Opened – Total number of distinct mobile screens accessed during the session, helping identify user navigation patterns and the range of screens loaded for the application.
- Number of Errors – Total screen-level errors encountered.
- P95 Duration – 95th percentile screen load time, highlighting slow-rendering screens.
APIs
- Number of Requests – Total API calls made during the session.
- Unique APIs Called – Total number of distinct API endpoints invoked during the session, helping track API usage diversity and understand how many different services or resources are accessed.
- Number of Errors – API-related errors detected.
- P95 Duration – 95th percentile API response time, showing slow backend responses.
Slow Render Count
Shows how many slow-render events occurred in the session. Slow renders happen when the main thread takes too long to update the UI, making the app feel laggy.
Screens & API’s
- Session Details: Shows detailed session information
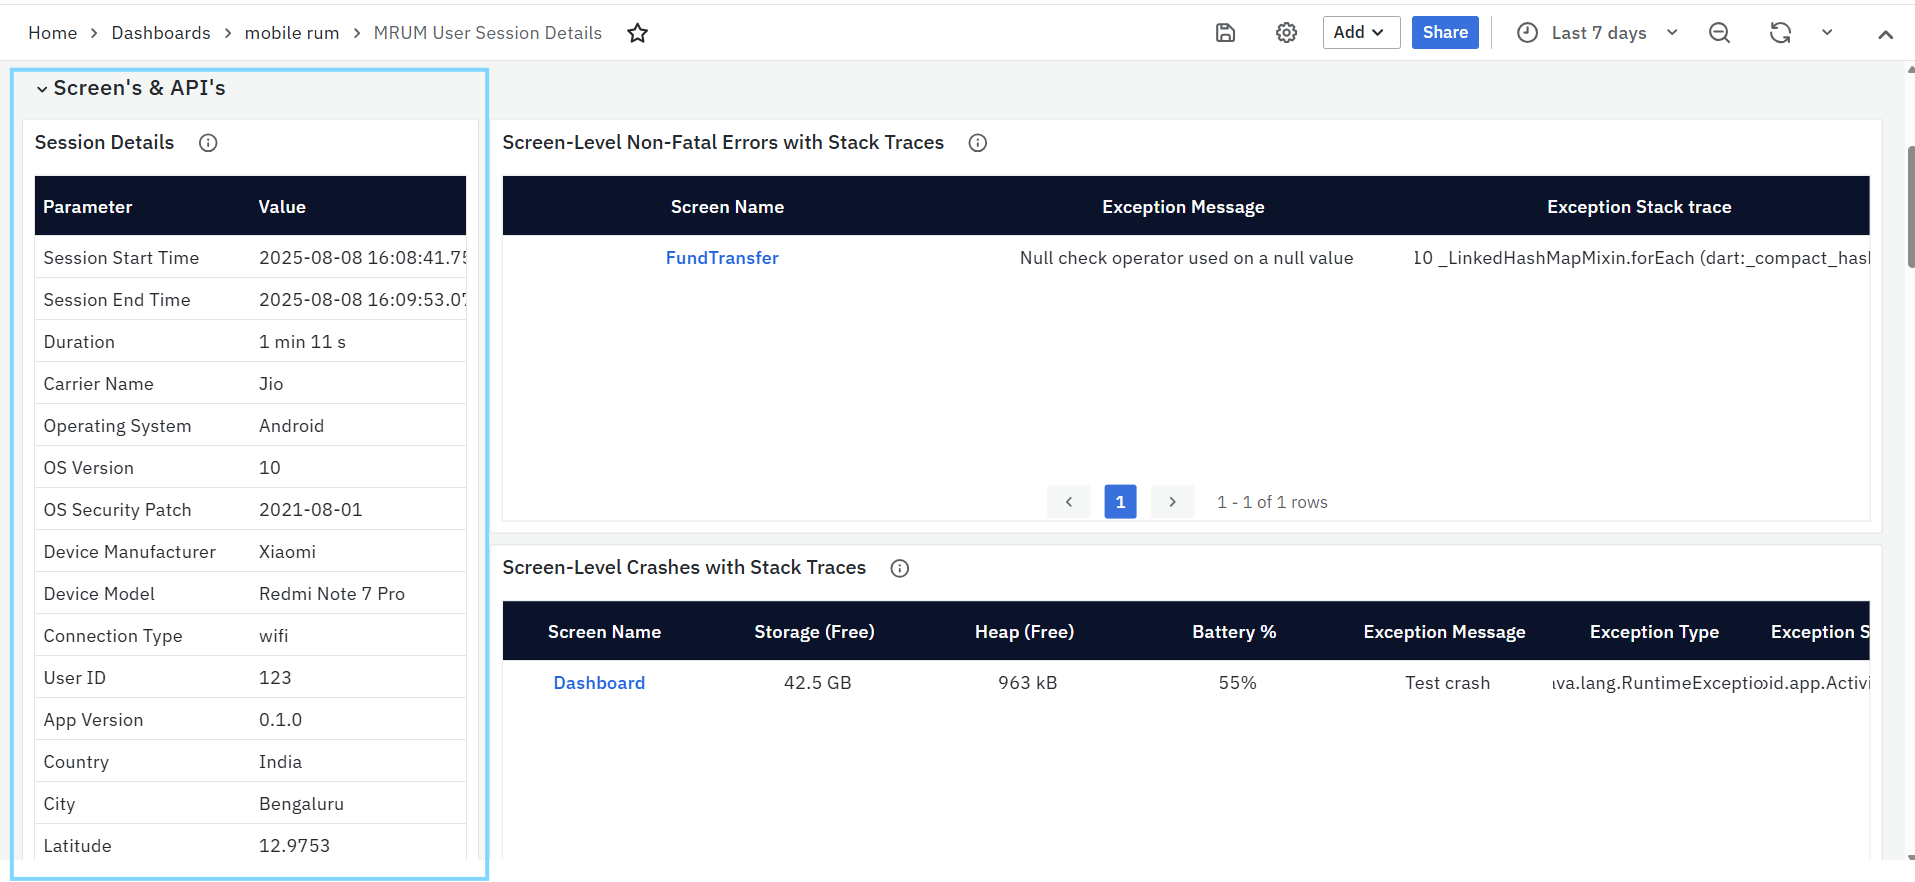
- Session Timing – Start/end time and total duration.
- Device & OS Info – Device manufacturer, model, OS version, security patch level.
- Network Conditions – Carrier name and connection type (WiFi, 4G, 5G).
- User & Location – User ID (if available), app version, city, country, latitude, longitude.
- Screen-Level Non-Fatal Errors with Stack Traces: Lists runtime exceptions that didn’t crash the app
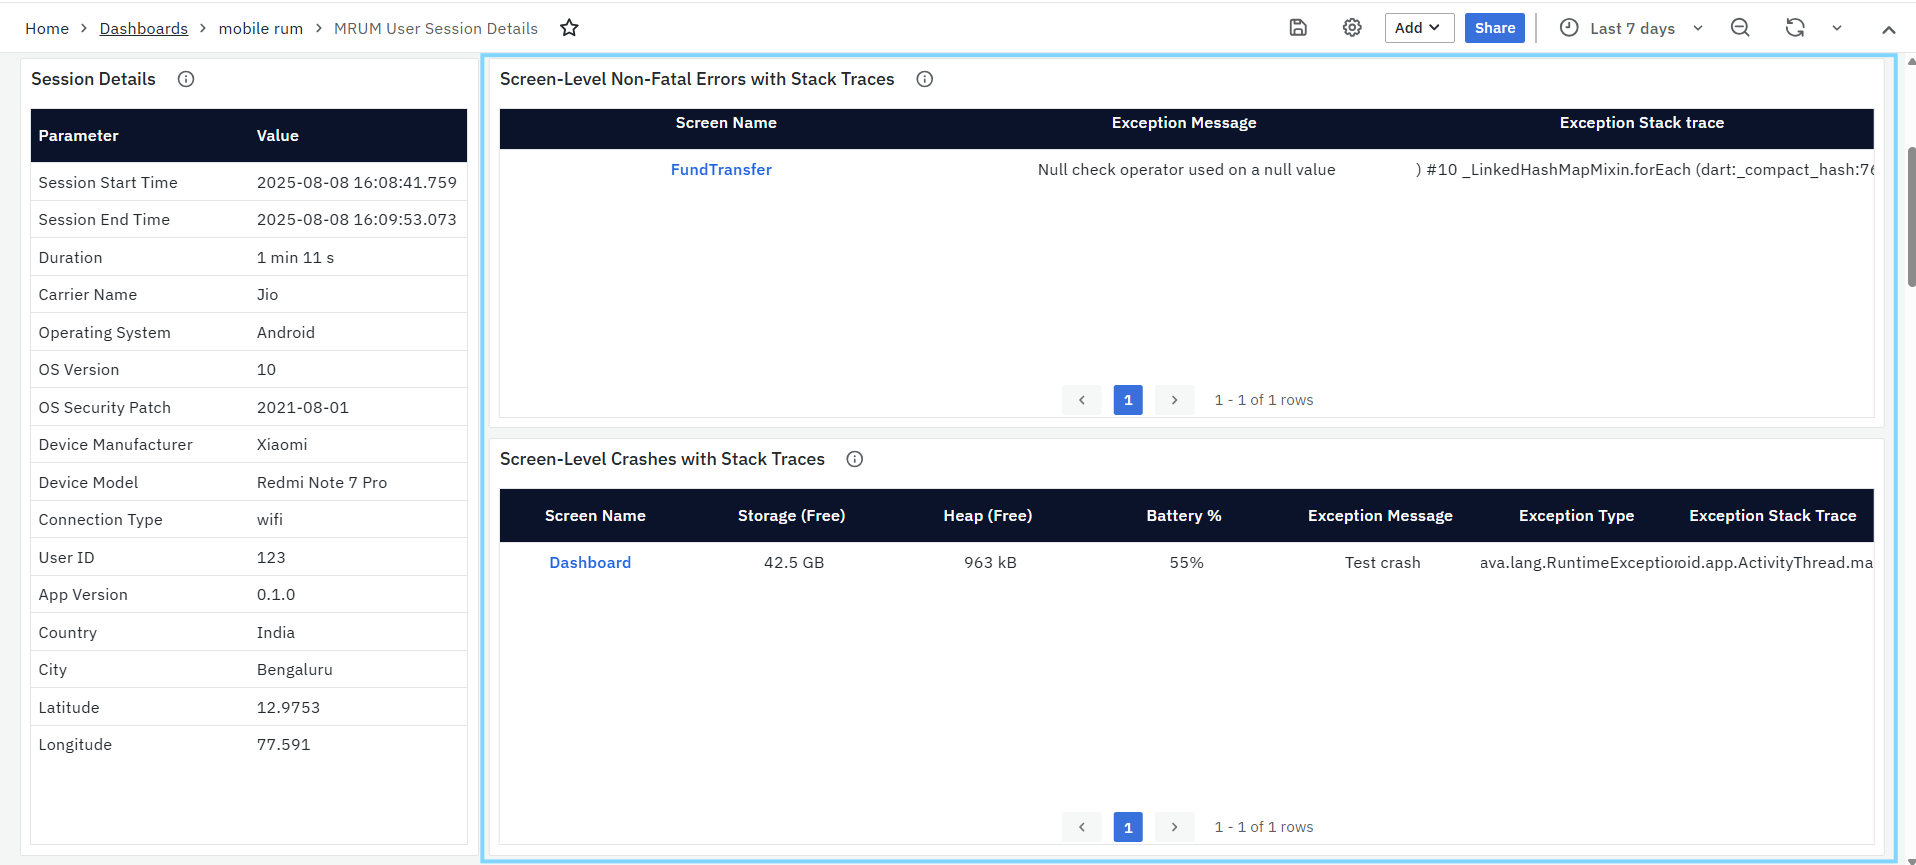
- Screen Name – Where the error occurred.
- Exception Message – Short description of the error.
- Exception Stack Trace – Full trace to locate the issue in code.
- Screen-Level Crashes with Stack Traces: Shows fatal errors that caused the app to crash
- Screen Name – Where the crash occurred.
- Exception Message – Short description of the crash cause.
- Exception Stack Trace – Full trace for debugging.
- API Errors: Lists API failures during the session
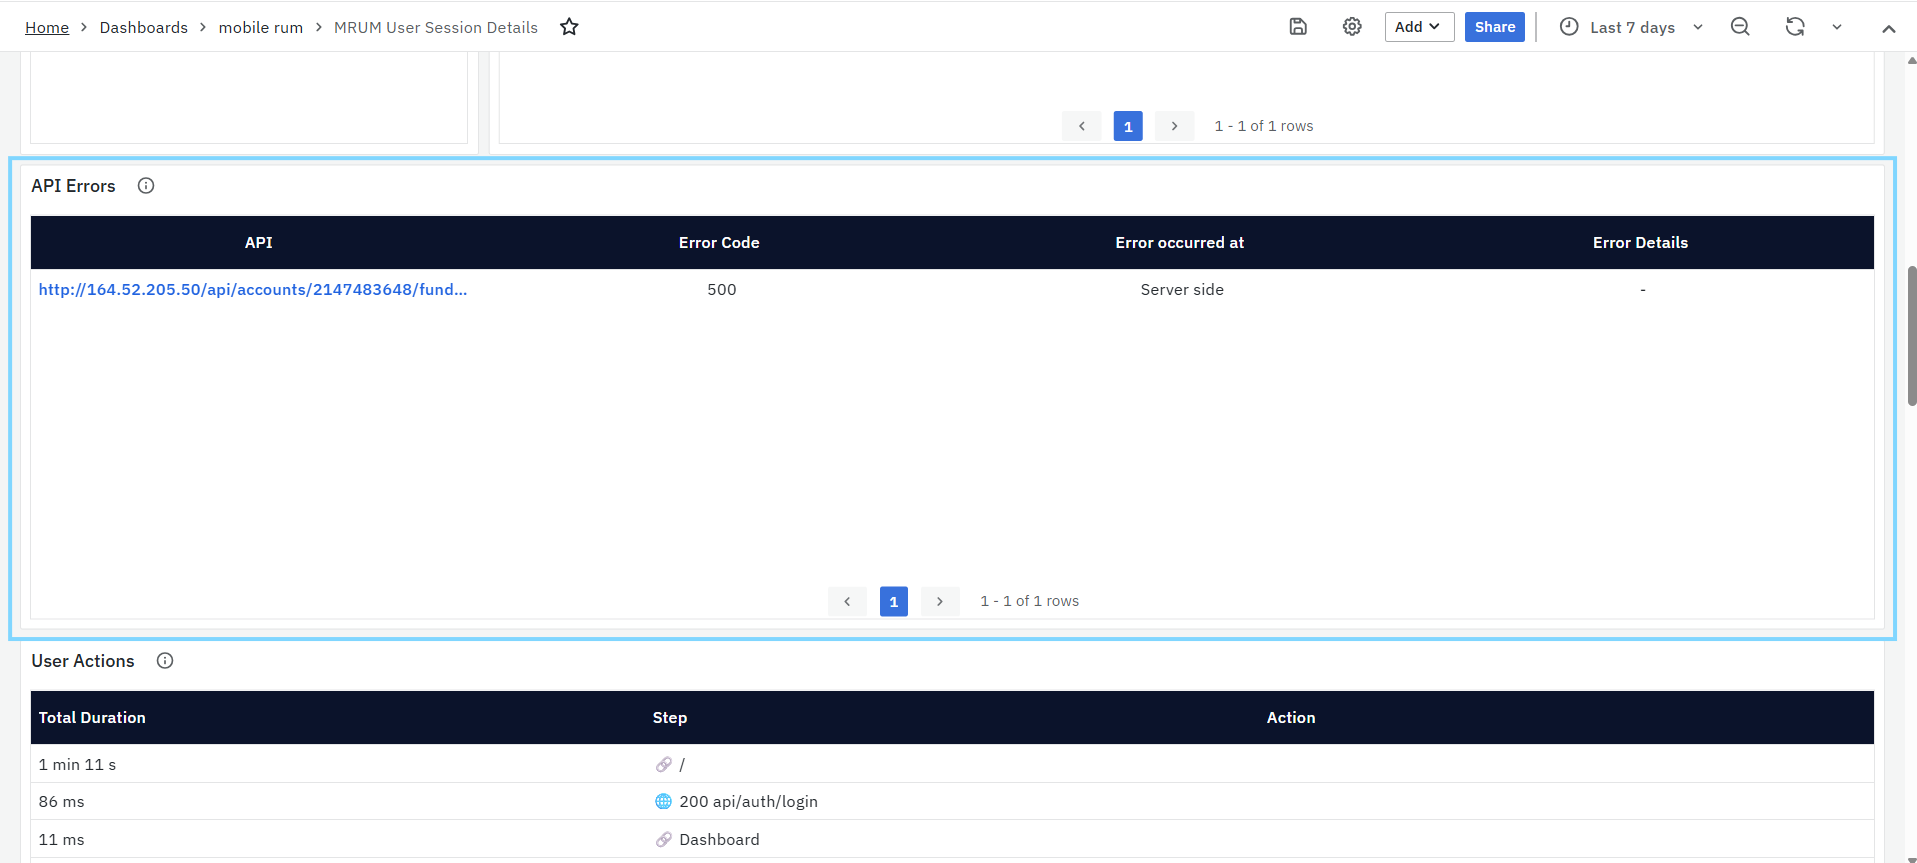
- API – Endpoint where the error occurred.
- Error Code – HTTP status code (0 if no server response).
- Exception Message – Short description of the error.
- Exception Stack Trace – Full trace for debugging.
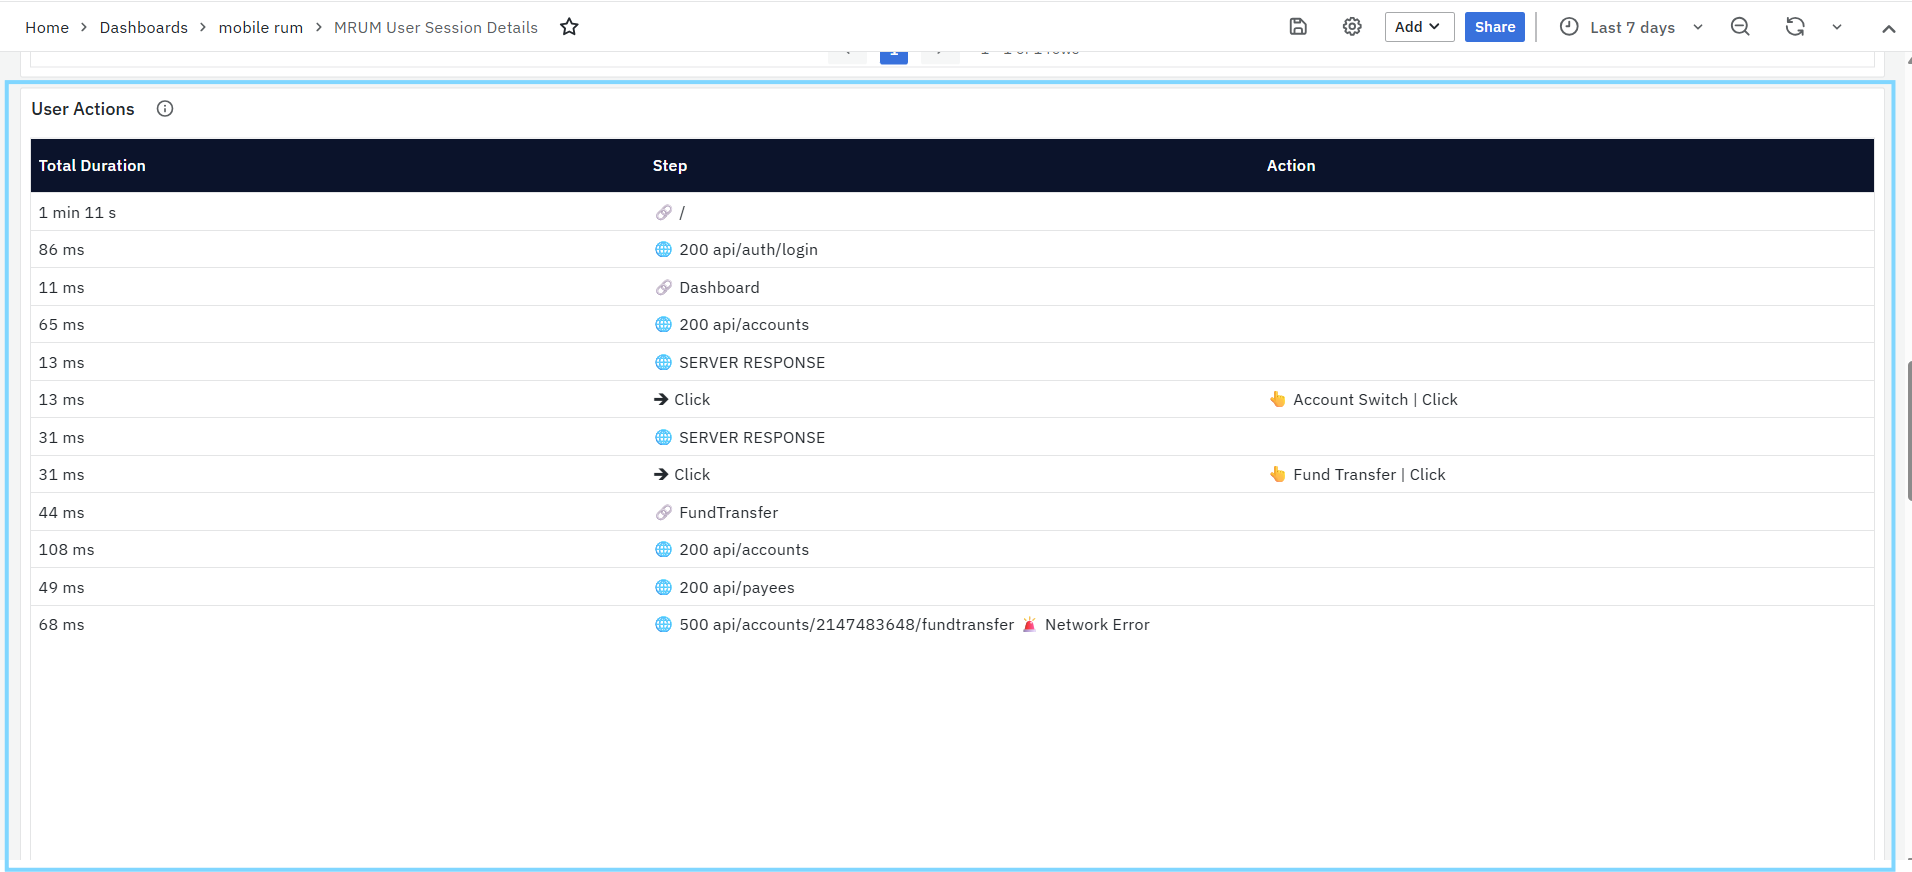
- User Actions: Shows the sequence of screen navigations, API calls, and clicks during the session, along with load/response times to identify performance bottlenecks.
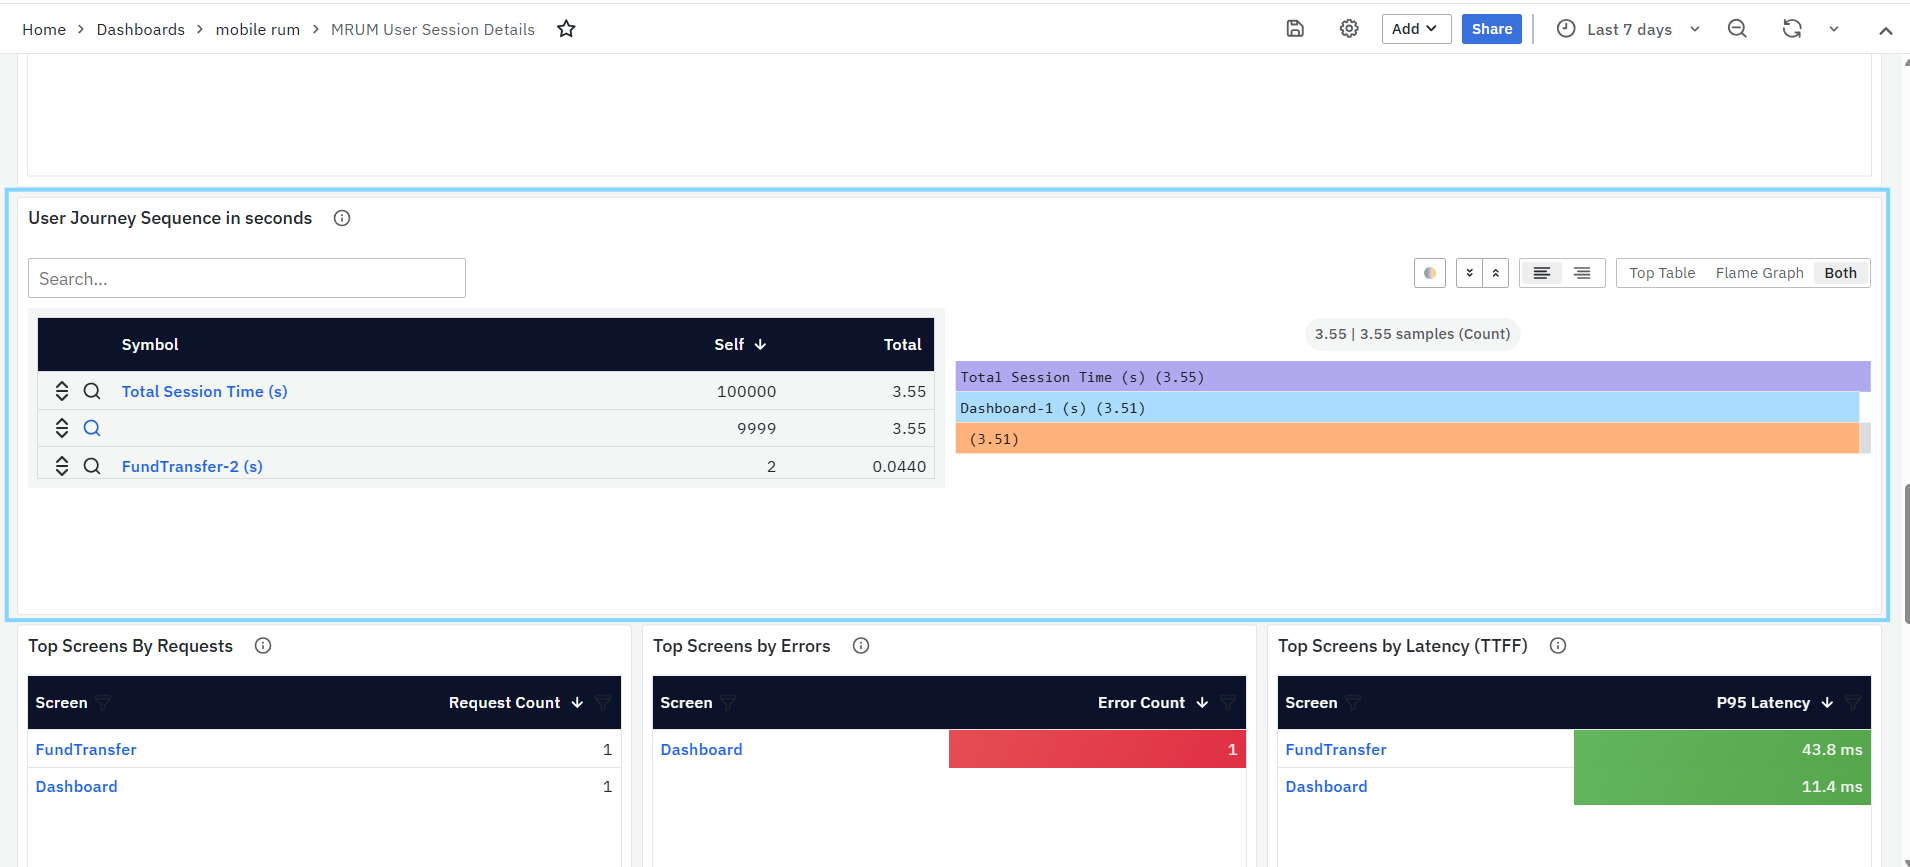
- User Journey Sequence (seconds): A flame graph showing time spent on each screen during the session.
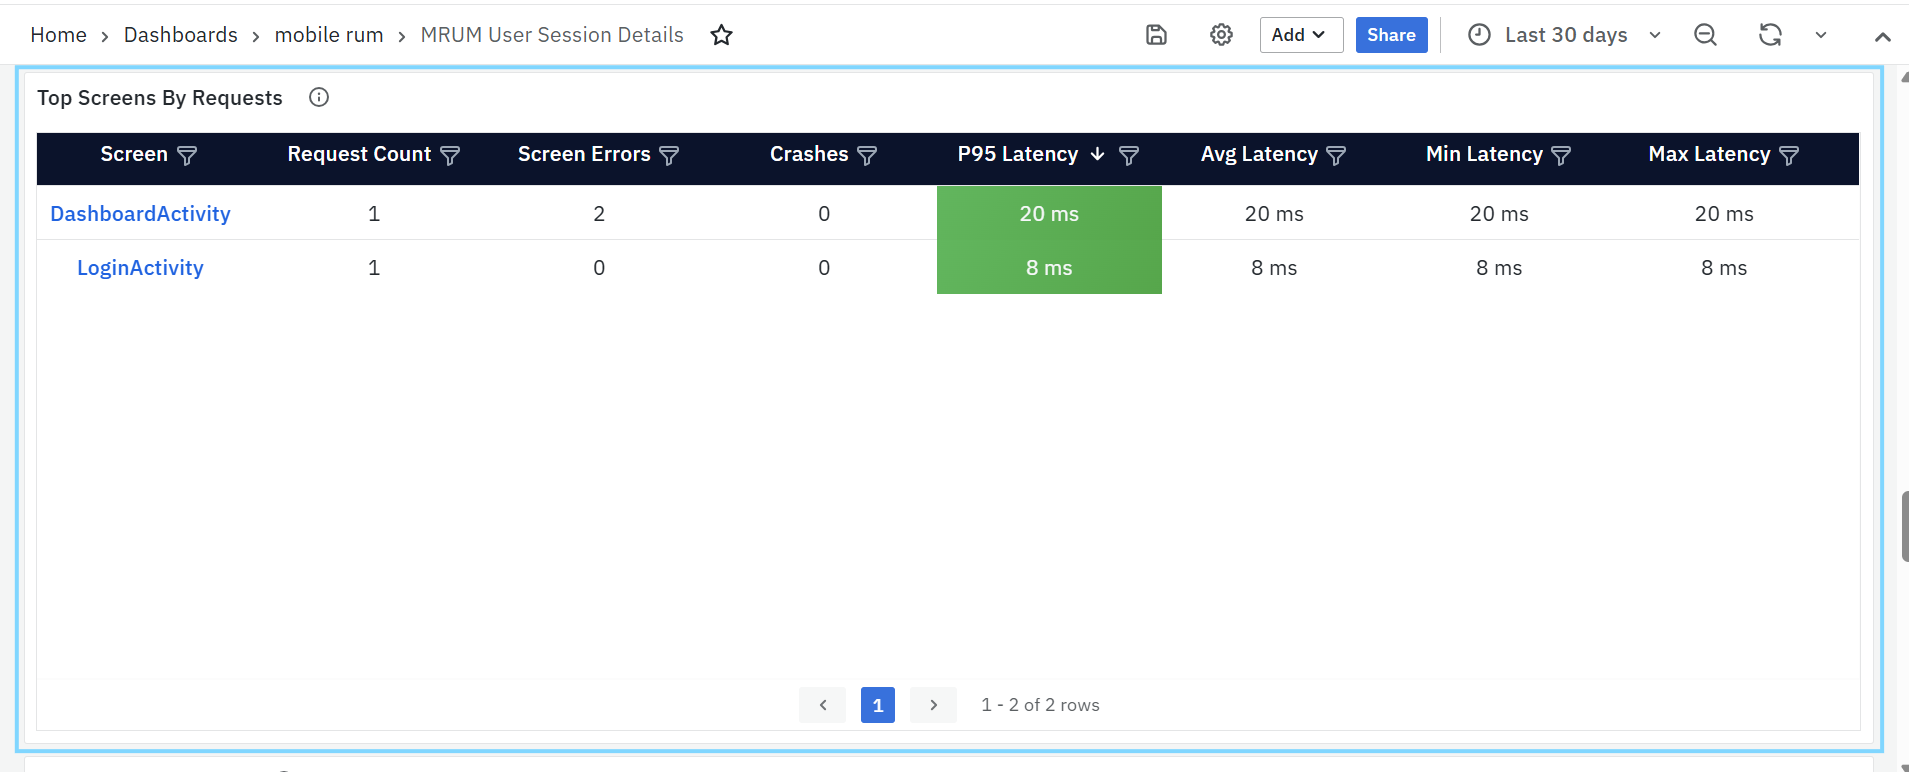
- Top Screens by Requests: Shows the most frequently accessed screens based on user activity.
- Screen – Name or URL of the screen; clickable to open the Mobile RUM Screens Dashboard for detailed screen-level analysis.
- Request Count – Total number of times the screen was accessed during the selected time range.
- Screen Errors – Number of screen-level errors encountered on the screen.
- Crashes – Count of fatal crashes associated with the screen.
- P95 Latency – 95th percentile screen load time, highlighting slow-performing screens.
- Avg Latency – Average time taken to load the screen.
- Min Latency – Fastest recorded screen load time.
- Max Latency – Slowest recorded screen load time.
- Screen Load Timeline: Displays individual screen load events captured during the selected time range.
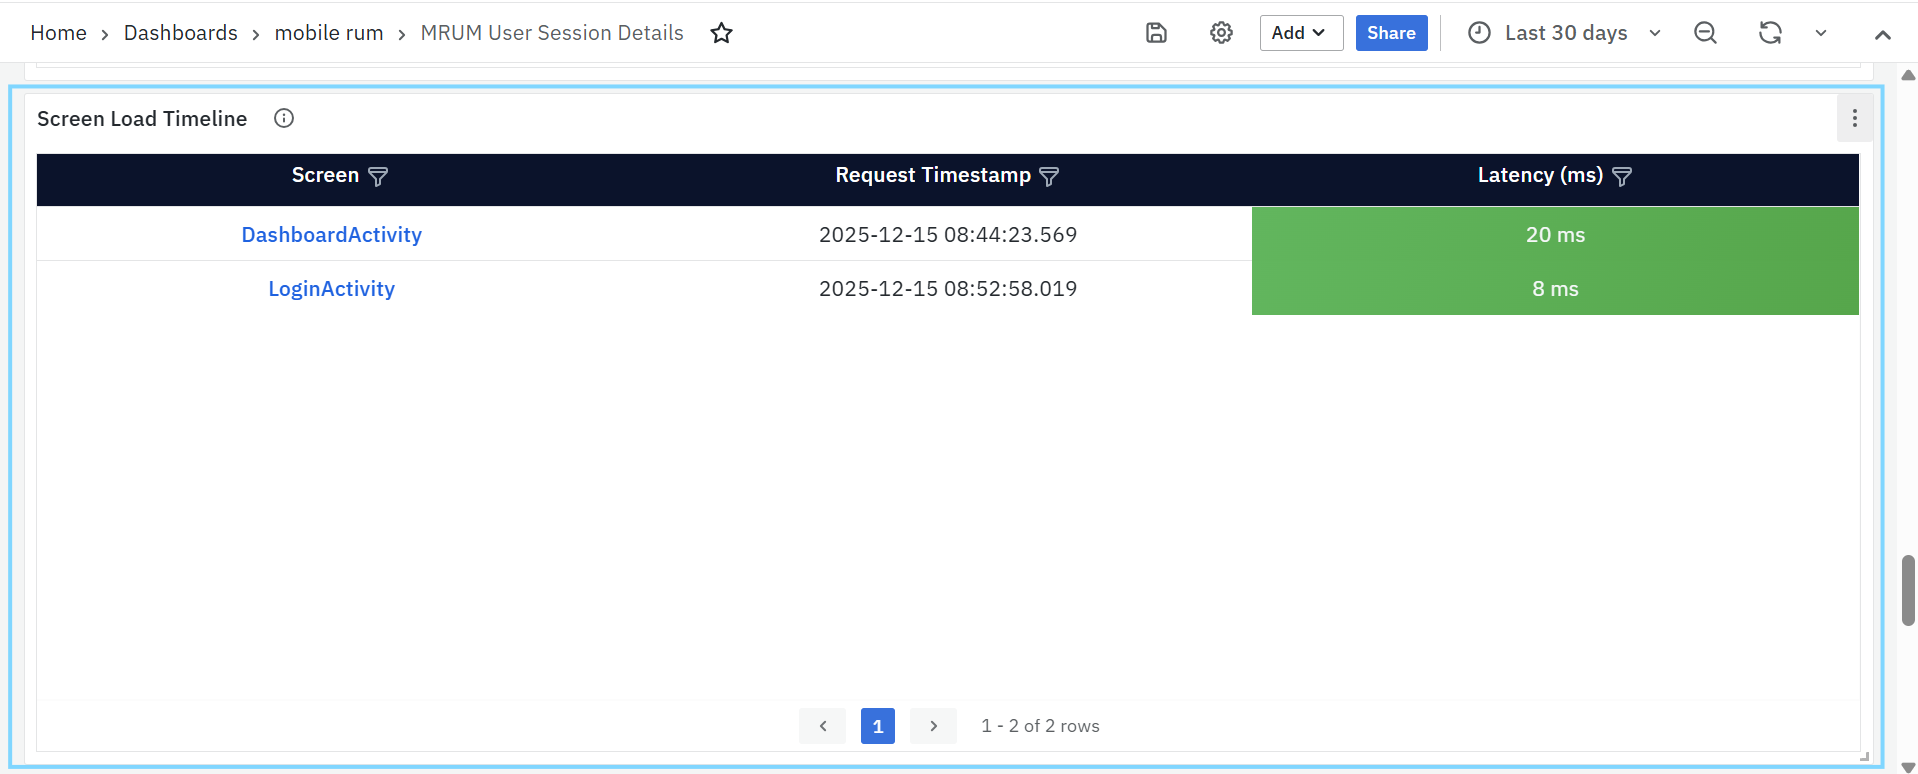
- Screen – Name of the screen loaded; clickable to navigate to the Mobile RUM Screens Dashboard for detailed analysis.
- Request Timestamp – Exact date and time when the screen load request occurred.
- Latency (ms) – Time taken to load the screen, measured in milliseconds, helping identify slow loads and performance variations across screen visits.
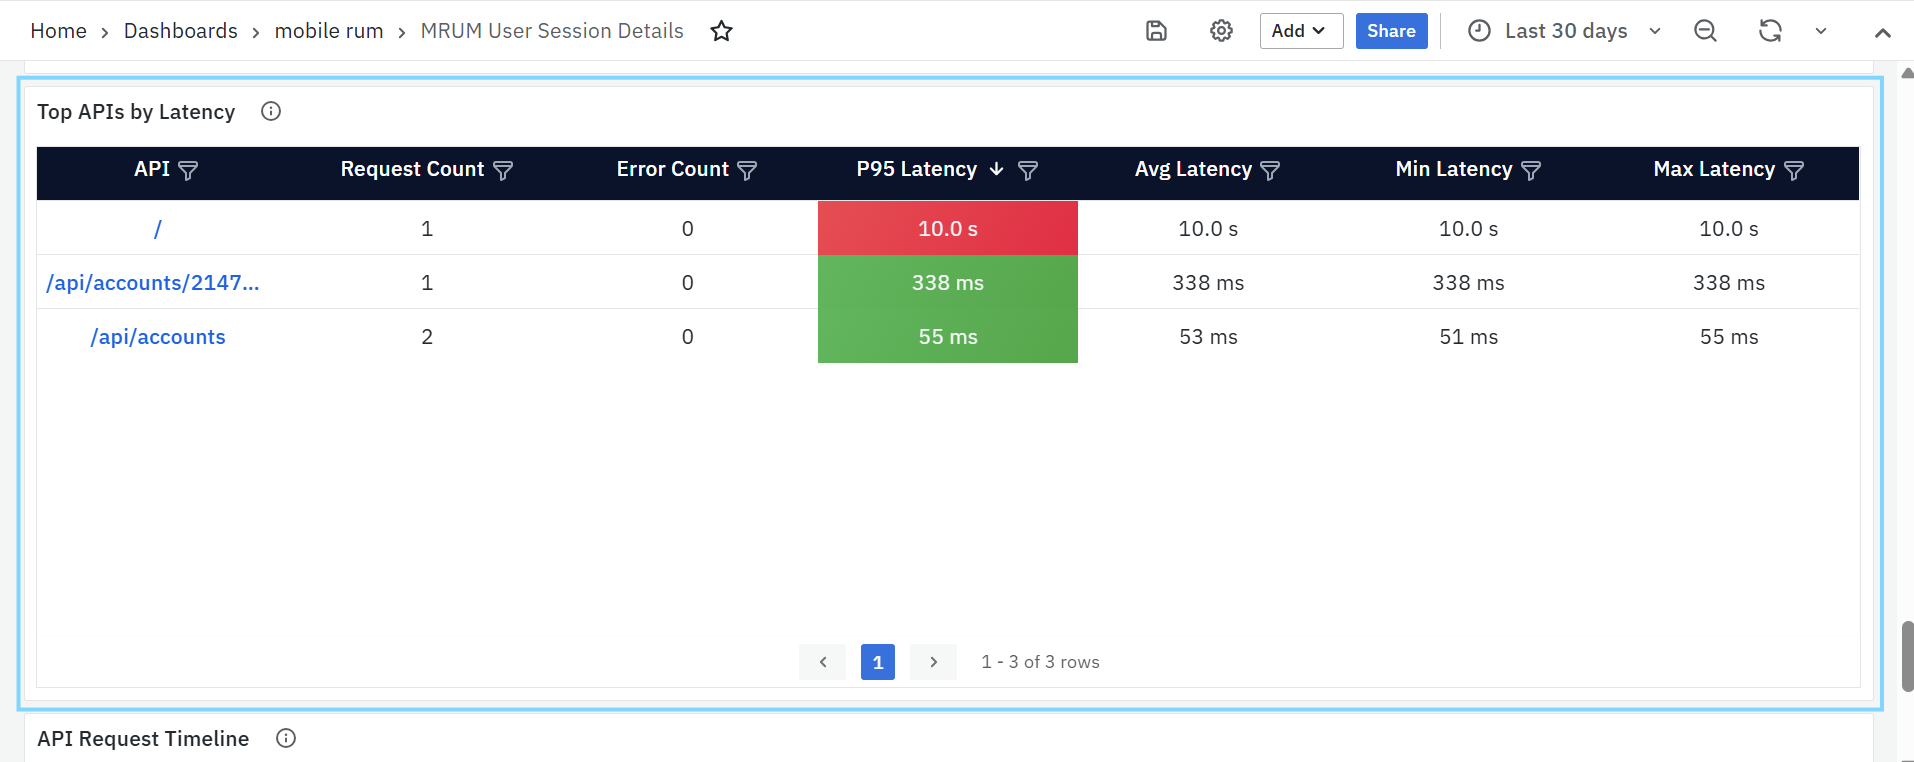
- Top APIs by Latency: Highlights APIs with the highest response times based on the 95th percentile latency.
-
API – API endpoint invoked during the session; clickable to navigate to detailed API-level analysis.
- Request Count – Total number of times the API was called within the selected time range.
- Error Count – Number of API-related errors recorded for the endpoint.
- P95 Latency – 95th percentile API response time, used to identify consistently slow-performing APIs.
- Avg Latency – Average response time of the API.
- Min Latency – Fastest recorded API response time.
- Max Latency – Slowest recorded API response time.
-
API Request Timeline: Displays a detailed timeline of individual API requests made during the selected session or time range.
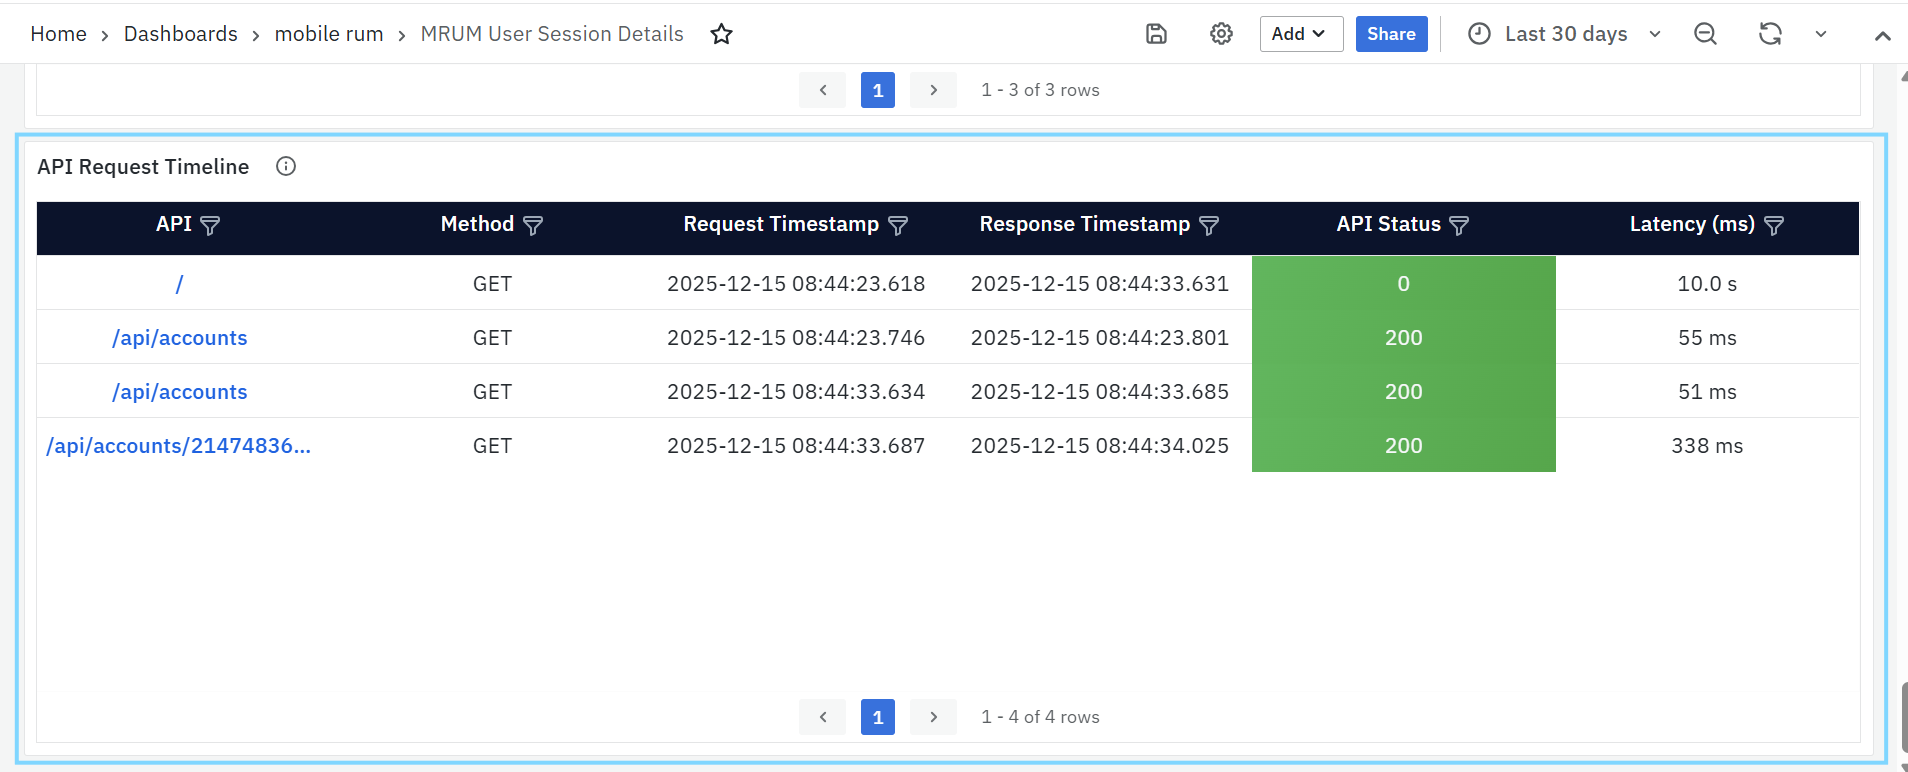
- API – API endpoint invoked by the application; clickable to navigate to detailed API-level insights.
- Method – HTTP method used for the API request (GET, POST, PUT, DELETE, etc.).
- Request Timestamp – Exact date and time when the API request was initiated.
- Response Timestamp – Date and time when the API response was received.
- API Status – HTTP status code returned by the API, indicating success or failure.
- Latency (ms) – Time taken for the API request to complete, helping identify slow responses or performance anomalies.
Geographical Insights
MRUM Geo Map
The Geo Map provides a visual representation of user activity across different geographic locations, helping teams analyze performance metrics by region. It allows users to identify patterns, detect region-specific performance issues, and optimize the user experience accordingly.
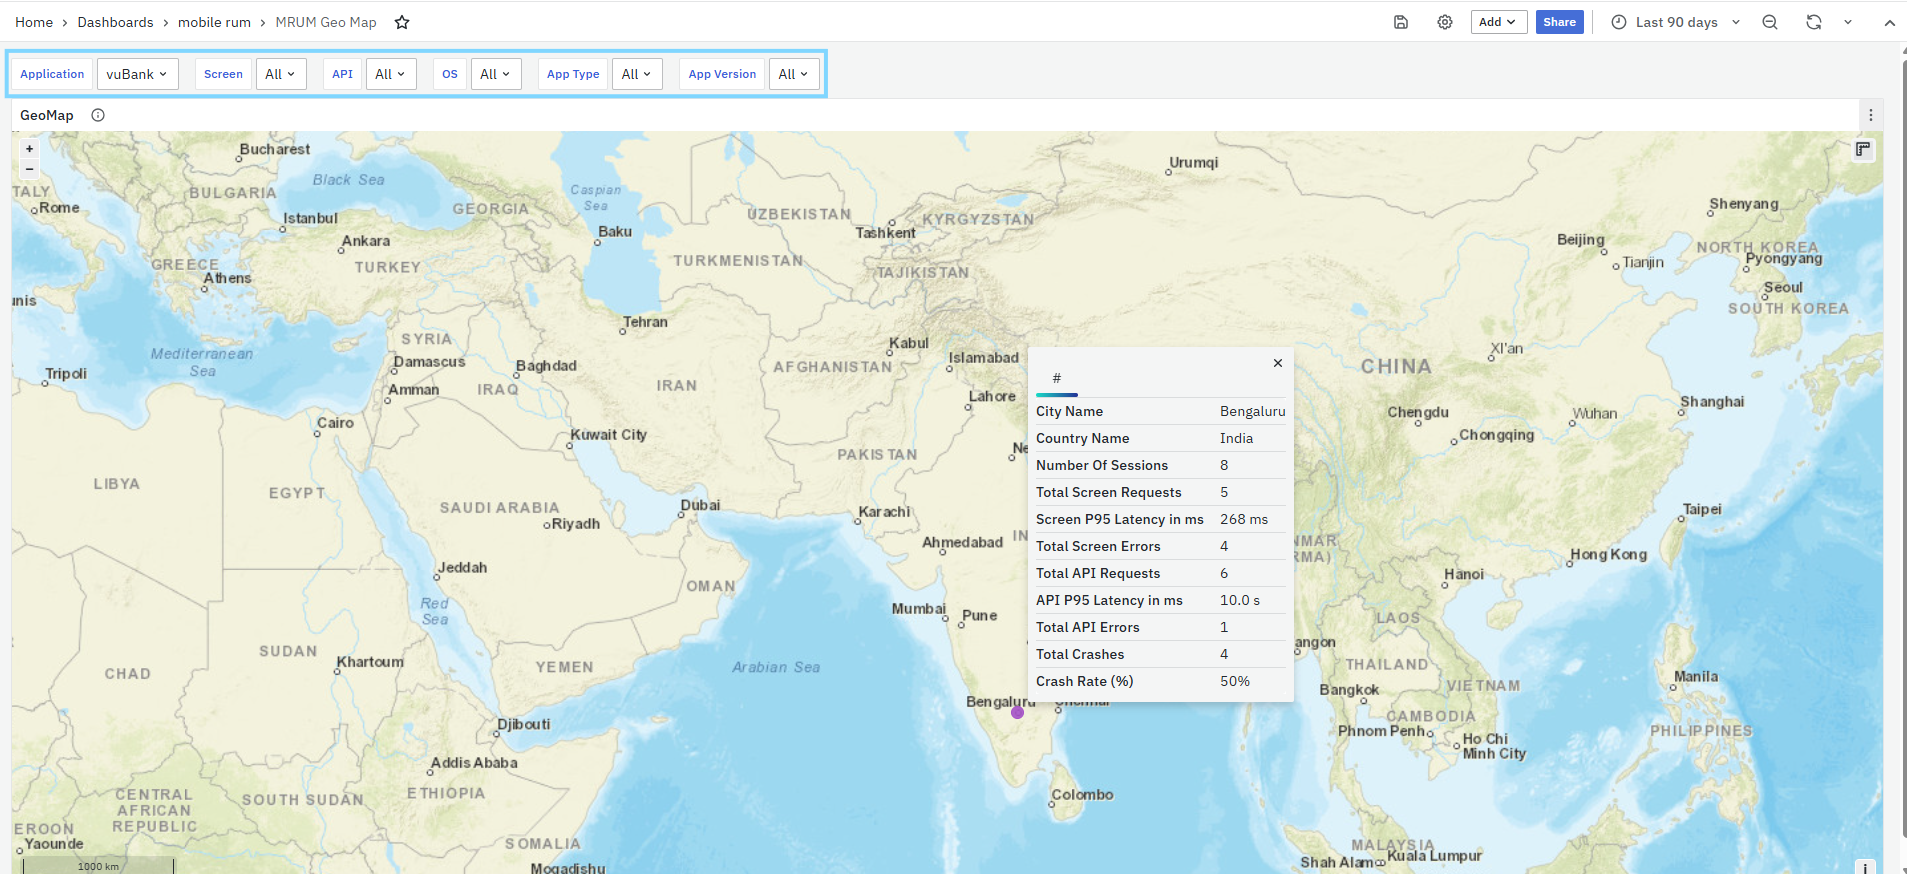
This dashboard includes zoom-in and zoom-out options for exploring data at different levels of detail. Multiple filters are available to refine the data view, ensuring teams can focus on the regions and metrics most relevant to their analysis. You can also apply several filters to narrow down the view:
- Metric: Choose the data type you want to see (e.g., number of sessions).
- Application: Select a specific mobile app to analyze.
- Screen: Filter by screen to track its usage across locations.
- OS: Filter sessions by operating system.
- Android Type: Refine results based on Android device types.
- App Version: View data for specific app versions.
Using these options, you can easily monitor how your mobile application is performing in different regions.
