User Engagement Dashboard
Overview
This metric provides insights into the scale of user interactions within the platform. It measures engagement through data handling, analytics jobs, configured data sources, and identified insights and trends. Let's explore how this metric helps assess and optimize user experiences effectively. The User Engagement Metrics guide offers insights into user interactions within the platform, accessible through the User Engagement Dashboard. By tracking user logins, activity trends, and content views, administrators can optimize performance and enhance user experiences. The Total Usage Trend panel highlights overall platform engagement trends, empowering administrators to make data-driven decisions for optimization.
Comprehensive Understanding
Dashboard Panels

Following are the first sets of the Metrics panels showcasing the details for the selected time range:
- User Logged in: This panel counts the number of users logged in.
- Create/Modify Activities: This panel tracks users' creation and modification activities.
- Viewed Activities: The Viewed Activities panel tracks instances where users access or view data and information within the platform in the selected time range.
- Delete Activities: The deleted Activities panel tracks the deletion of objects within the platform. The panel showcases the number of instances where users have removed or deleted content, configurations, or data within the platform.
Activities performed on Objects
This panel tracks Create, View, Update, and, Delete operations performed on objects within the platform in the selected time range. It provides insights into user interactions related to object management, aiding administrators in monitoring and optimizing data handling practices.
Activities performed by User
This panel provides insights into user account management, tracking Create, View, Update, and Delete actions. It offers data on user activities such as view count, creations, updates, deletions, and totals. This helps administrators understand user management trends, enabling them to optimize processes for platform integrity and performance.
User Statistics
 The User Statistics panel showcases a table representing information related to user engagement. The following fields will be displayed as follows:
- Logins: Number of times the user logged in
- User Name: Shows the user name
- Average Time Spent: Average time spent by a user on the platform
- Total Time Spent: Total time spent by the user in the selected period.
User Login Trend
User Login Trend is the bar graph representation depicting the frequency of user logins over a selected time range. This panel provides a visual overview of user engagement with the platform by showing how often users are logging in within a specific period. By observing trends in user logins, administrators can gain insights into patterns of user activity, peak usage times, and overall platform adoption.
User Login Activity
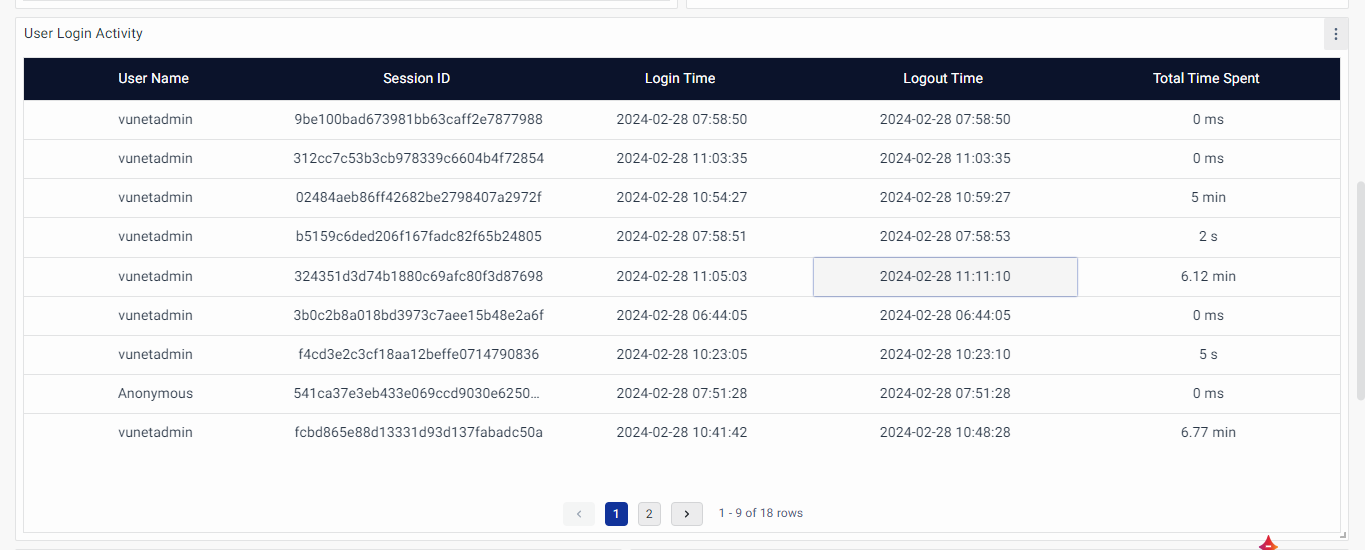
The User Activity panel typically presents relevant user session information in a tabular format. The following fields will be displayed as follows:
- Username: This column displays the usernames of users who have logged into the platform.
- Session ID: Each user session is assigned a unique session ID, which helps track individual sessions and activities.
- Login Time: This column indicates the timestamp (Date and time) when the user logged into the platform.
- Logout Time: It shows the timestamp (Date and time) when the user logged out or ended their session.
- Total Time Spent: This column calculates the duration of the user's session, representing the total time spent by the user actively engaged with the platform.
Top Visited Dashboard
The Top Visited Dashboard showcases the most accessed dashboards. The following fields will be displayed as follows:
- Dashboard: Name of the Dashboard
- Avg Processing Time: Average processing time.
- Top Visited Dashboard By User
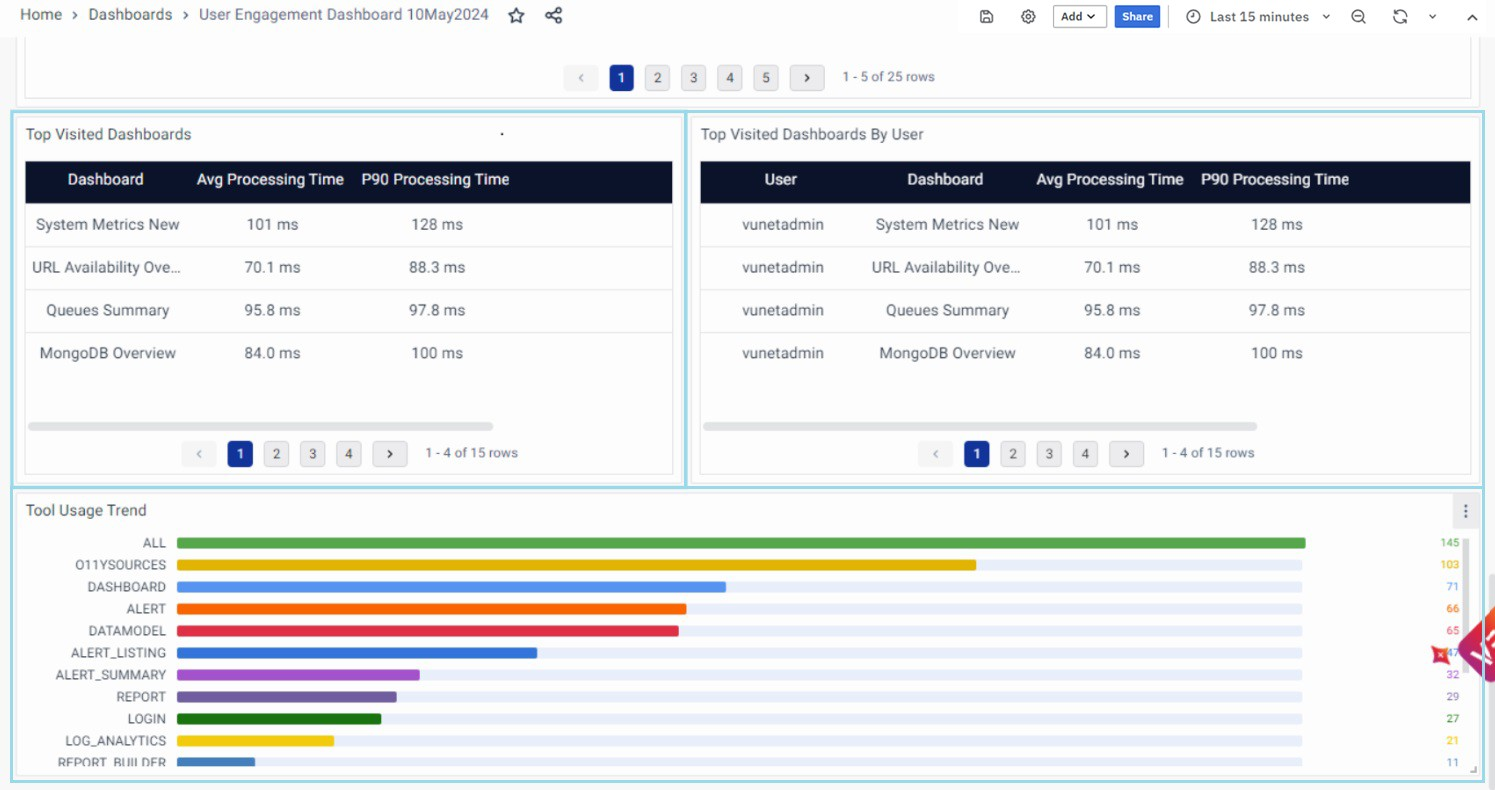 The Top Visited Dashboard By User showcases the list of most accessed dashboards by the user. The following fields will be displayed as follows:
- User: This column displays the usernames of users who have logged into the platform..
- Dashboard: Name of the Dashboard visited by the user.
Total Usage Trend

The Total Usage Trend presents a graphical representation illustrating the overall trend of platform usage over a selected time range. This metric provides valuable insights into the overall engagement levels and adoption of the platform by users. By observing trends in total usage, administrators can identify patterns, assess the effectiveness of initiatives aimed at increasing user engagement, and make informed decisions to optimize the platform's performance and user experience.
Step-by-Step Instructions

- To access the User Engagement Metrics, navigate to the left navigation menu > Dashboards.
- On clicking the Dashboards run the search for the User Engagement Dashboard.
- You will be redirected to the User Engagement Dashboard upon clicking.
FAQs
What does the User Engagement Dashboard provide?
It provides insights into the scale of user interactions within the platform and measures engagement through data handling, analytics jobs, configured data sources, and identified insights and trends.
How do I access the User Engagement Dashboard?
Navigate to the left navigation menu > Dashboards, run the search for the User Engagement Dashboard, and click the dashboard.
What does the User Statistics panel show?
It shows Logins, User Name, Average Time Spent, and Total Time Spent.
What does the User Login Trend panel represent?
It is a bar graph representation depicting the frequency of user logins over a selected time range.
What does the Total Usage Trend panel highlight?
It presents a graphical representation illustrating the overall trend of platform usage over a selected time range.
