Self Observability Dashboards
Overview
Self Observability in vuSmartMaps helps users monitor the health, usage, and operational behavior of the vuSmartMaps platform itself. It provides pre-configured dashboards for user engagement, system metrics, ContextStreams, Kafka Cluster, Kafka Connect, alerts, and audit trails. These dashboards help administrators and support teams understand platform activity, data processing health, Kafka performance, alert trends, and backend changes across key modules.
The feature works mainly through dashboards available from the Dashboards section. Users can search for the required dashboard and open it to view metrics, charts, tables, and trends for the selected time range.
Self Observability covers the following dashboards:
Why This Feature Is Useful
Self Observability is useful because it gives teams visibility into how the vuSmartMaps platform is being used and how its internal components are performing.
For banking and payment environments, platform reliability is important because monitoring teams depend on vuSmartMaps to view alerts, dashboards, reports, data pipelines, and operational insights. If the platform has data ingestion delays, Kafka issues, connector failures, or high resource usage, users may not get timely operational visibility.
This feature helps teams:
-
Track user logins, activity, dashboard usage, and total platform usage.
-
Monitor data ingestion volume, peak EPS, compressed and uncompressed data size.
-
Check configured alerts, dashboards, reports, users, user roles, and O11ySources.
-
Monitor ContextStreams pipeline health, including running apps, failed apps, latency, processed records, dropped records, exceptions, CPU, and memory.
-
Monitor Kafka Cluster health, including brokers, topics, partitions, request rates, host-level metrics, and JVM metrics.
-
Monitor Kafka Connect health, including connectors, tasks, failed tasks, source and sink records, node usage, and JVM metrics.
-
Review alert KPIs, active alerts, cleared alerts, and alert resolution patterns.
-
Track backend changes across dashboards, alert rules, reports, users, roles, preferences, Data Models, and O11ySources using Audit Trails.
Example Scenario
A payment operations team notices that dashboards are not reflecting recent transaction activity as expected. A support engineer uses Self Observability to investigate.
First, the engineer opens the System Metrics Dashboard to check data ingestion volume, peak EPS, and data ingestion trends. Then, the engineer opens the ContextStreams Dashboard to check whether ContextStreams applications are running, whether records are being processed, and whether exceptions or dropped records have increased. If the issue appears related to data streaming, the engineer opens the Kafka Cluster Monitoring Dashboard to review Kafka broker health, request rates, partitions, and data transfer metrics. If the issue involves connectors moving data into or out of Kafka, the engineer opens the Kafka Connect Monitoring Dashboard to check connector count, task count, failed tasks, source metrics, sink metrics, and node resource usage.
If alerts were generated during the same time period, the engineer can use Alert KPI and Alert Details dashboards to review active alerts, cleared alerts, alert severity, and alert duration percentiles. If a configuration change is suspected, the engineer can use Audit Trails to check recent changes to dashboards, alert rules, reports, users, roles, preferences, Data Models, and O11ySources.
When to Use This Feature
Use Self Observability when:
- Platform usage needs to be reviewed.
- User login activity or dashboard usage needs to be analyzed.
- Data ingestion volume or peak EPS needs to be monitored.
- Administrators need to check how many alert rules, dashboards, reports, users, or roles are configured.
- ContextStreams pipeline health needs to be checked.
- Running or failed ContextStreams applications need to be reviewed.
- Record processing, poll latency, process latency, exceptions, or dropped records need to be analyzed.
- Kafka Cluster health needs to be monitored.
- Kafka broker, topic, partition, request, data transfer, host, or JVM metrics need to be reviewed.
- Kafka Connect connectors, tasks, failed tasks, source metrics, sink metrics, node metrics, or JVM metrics need to be analyzed.
- Alert trends, active alerts, cleared alerts, or alert resolution duration need to be reviewed.
- Backend changes across key modules need to be audited.
- User activity needs to be tracked for operational, security, or compliance purposes.

Page / Screen Overview
Accessing Self Observability Dashboards
Self Observability dashboards are accessed from the Dashboards section.
To open any Self Observability dashboard:
- Open the left navigation menu.
- Click Dashboards.
- Search for the required dashboard name.
- Click the dashboard to open it.
This access flow is used for the User Engagement Dashboard, System Metrics Dashboard, ContextStreams Dashboard, Kafka Cluster Monitoring Dashboard, and Kafka Connect Monitoring Dashboard. Alert dashboards are also accessed from Dashboards, by searching for the Alert-KPI Folder and selecting the required alert dashboard.
User Engagement Dashboard

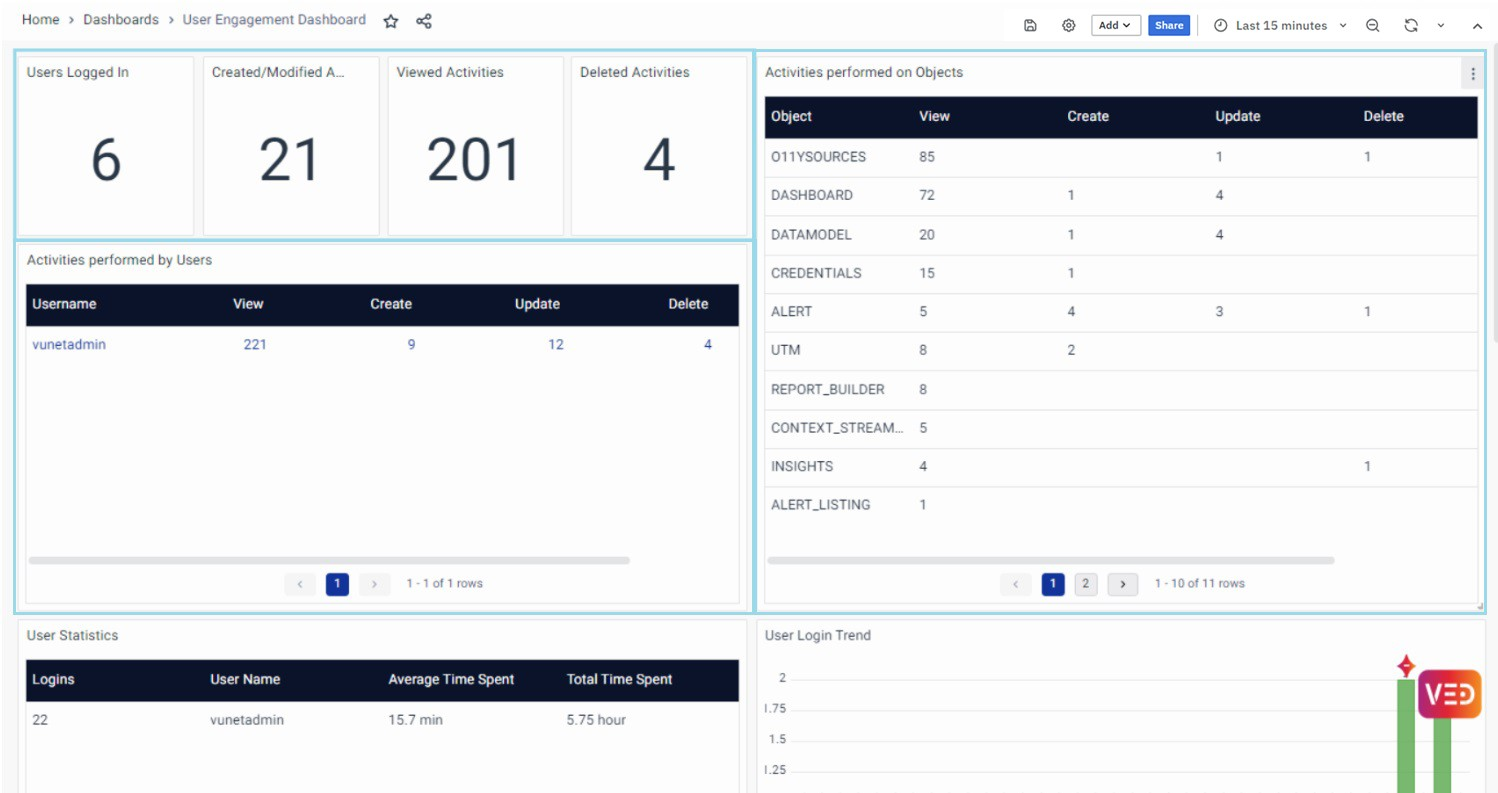
The User Engagement Dashboard shows how users interact with the platform. It measures engagement through user logins, data handling, analytics jobs, configured data sources, insights, and trends.
The dashboard includes panels for:
- User Logged In
Shows the number of users who logged in. - Create/Modify Activities
Tracks user creation and modification activities. - Viewed Activities
Tracks when users access or view data and information. - Delete Activities
Tracks deletion of objects, content, configurations, or data. - Activities Performed on Objects
Shows Create, View, Update, and Delete operations performed on platform objects. - Activities Performed by User
Shows user-level activity related to account management, including views, creations, updates, deletions, and totals. - User Statistics
Displays login count, user name, average time spent, and total time spent. - User Login Trend
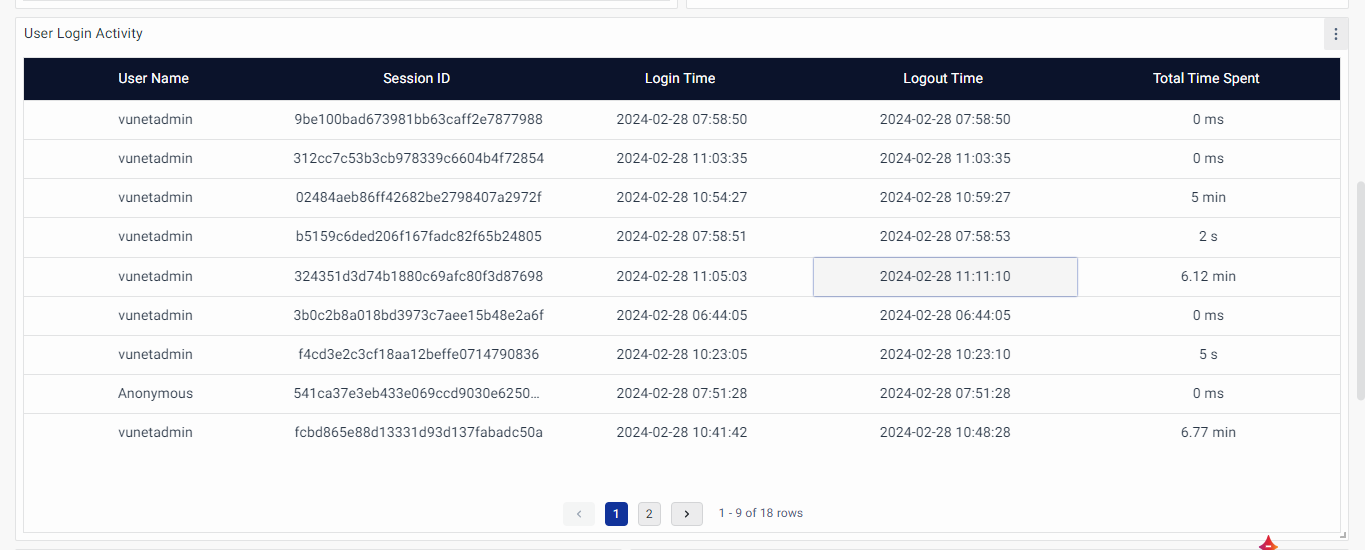
Shows login frequency as a bar graph over the selected time range. - User Login Activity
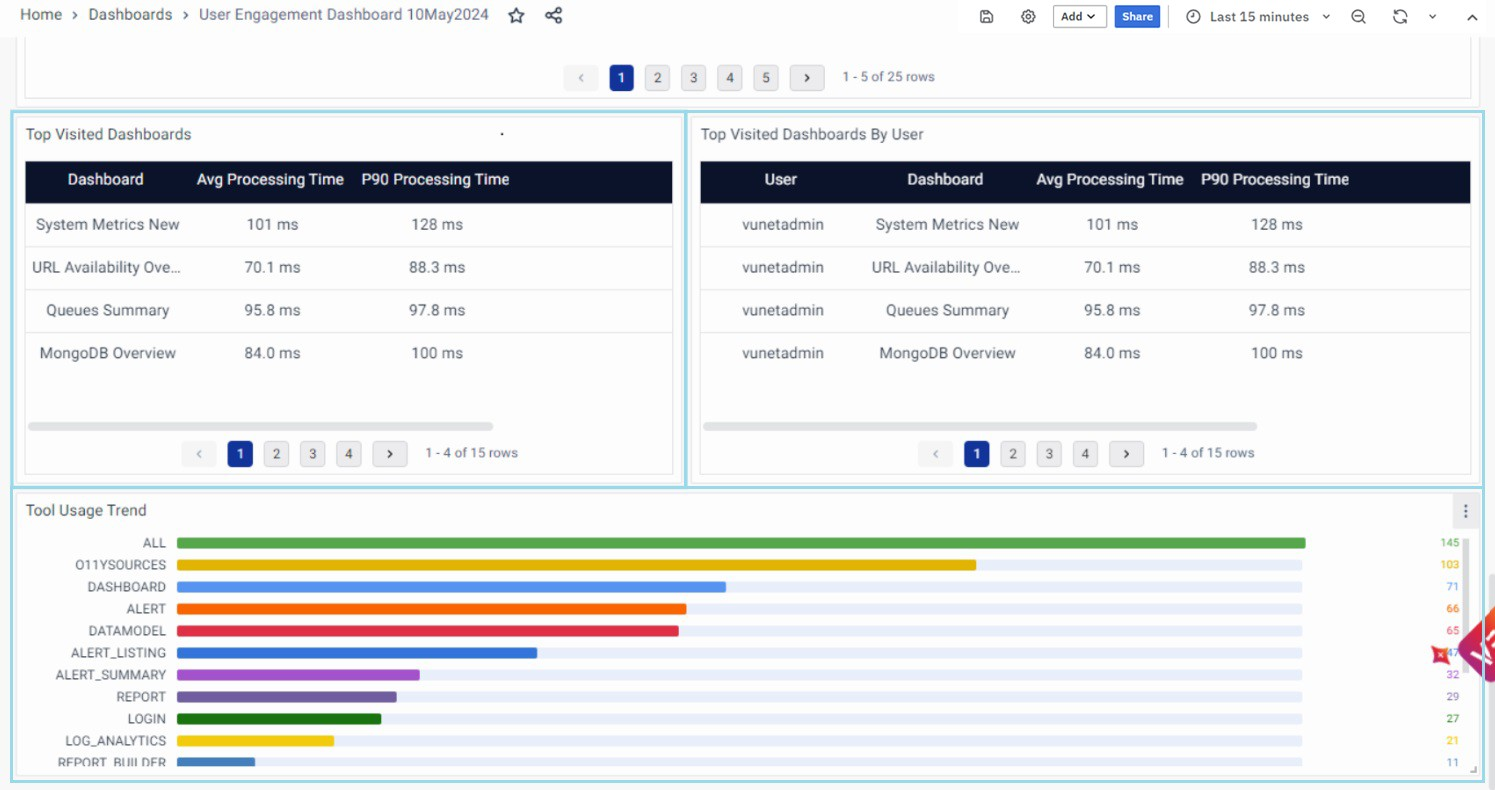
Displays session information such as username, session ID, login time, logout time, and total time spent. - Top Visited Dashboard
Shows the most accessed dashboards. - Top Visited Dashboard by User
Shows which dashboards were accessed by each user. - Total Usage Trend
Shows overall platform usage trends for the selected time range.
System Metrics Dashboard
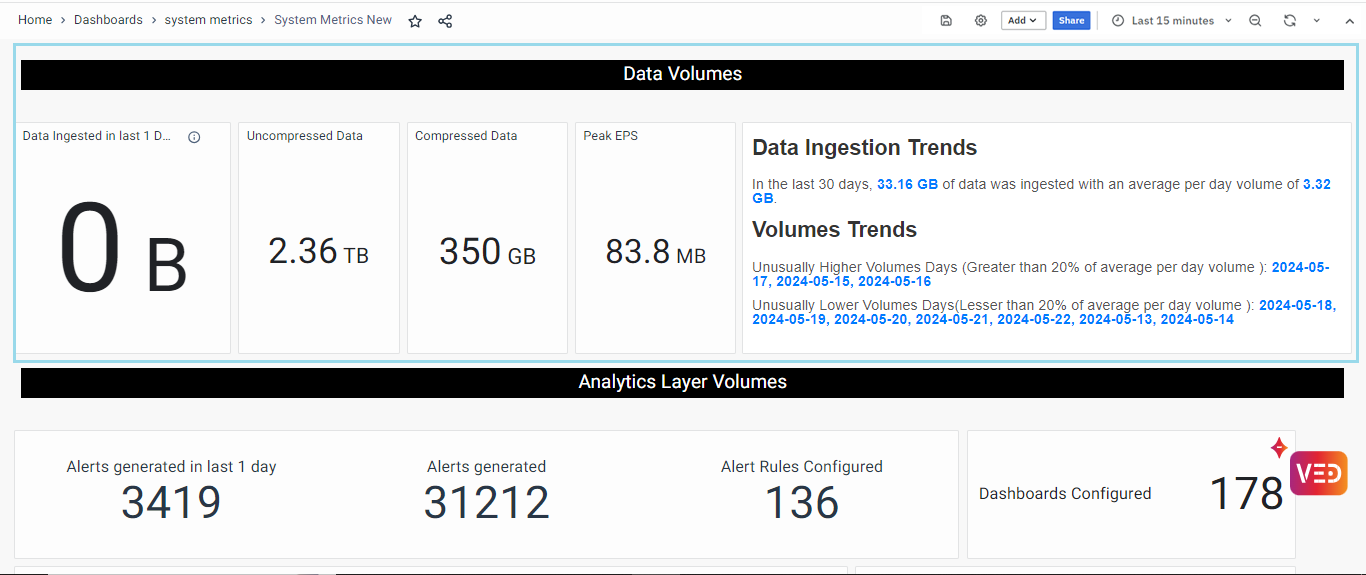
The System Metrics Dashboard provides a pre-configured view of platform operations and system health. It organizes metrics into categories so users can analyze the platform in a focused way.
The dashboard includes the following major sections:
- Data Volume
Shows data ingestion and storage-related metrics. - Analytics Layer Volumes
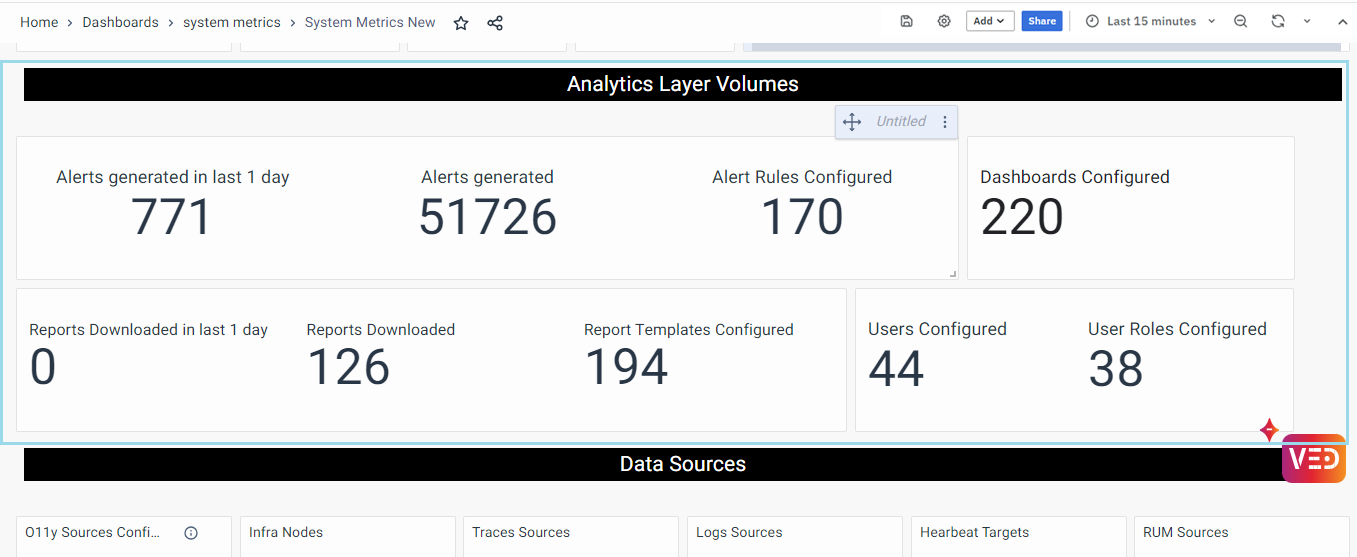
Shows activity and configuration counts for alert rules, dashboards, reports, users, roles, and related analytics objects. - Data Source
Shows the diversity and volume of data sources configured in the system. - Trend Selection
Shows graphical trends for selected system metrics across the selected time range.
ContextStreams Dashboard
The ContextStreams Dashboard gives an overall view of the health of ContextStreams pipelines running in the system. It shows application health, resource usage, stream metrics, plugin metrics, consumer metrics, and JVM metrics.
At the top of the dashboard, users can apply filters for App IDs and Instance IDs. These filters help users focus on a specific ContextStreams pipeline or instance.
The dashboard includes:
- Stream Apps Overview
- Resource Usage Metrics
- Stream Metrics
- Plugin Metrics
- Consumer Metrics
- JVM Metrics
Kafka Cluster Monitoring Dashboard

The Kafka Cluster Monitoring Dashboard gives an overview of the Kafka Cluster service running for vuSmartMaps. Since much of the data streaming and processing depends on Kafka, this dashboard helps users monitor Kafka performance and functionality.
At the top of the dashboard, users can apply filters for Hostname and Brokers. These filters help users focus on specific Kafka clusters or brokers.
The dashboard includes:
- Kafka Emitted Metrics
- Host Level Metrics
- JVM Metrics
Kafka Connect Monitoring Dashboard

The Kafka Connect Monitoring Dashboard shows the Kafka Connect cluster running in vuSmartMaps. Kafka Connect manages connectors that either source data from different databases into Kafka or sink data from Kafka to other databases.
At the top of the dashboard, users can apply filters for Connectors, Workers, and Nodes. These filters help users focus on specific DataStore connectors.
The dashboard includes:
- Kafka Connect Metrics
- Connector Metrics
- Kafka Connect Node Metrics
- JVM Metrics
Alert Dashboards
The Alert Dashboards provide deeper visibility into alert notifications generated by the system. These dashboards exist in addition to the Alert Console page. Users can also create new Alert storyboards for specific requirements.
The available alert dashboards described in the source document are:
- Alert KPI
- Alert Details
Audit Trails Dashboard
The Audit Trails Dashboard tracks and audits backend changes across platform modules. It helps administrators understand what changed, who changed it, and when the change happened.
The dashboard covers changes to:
- Dashboards
- Alert Rules
- Reports
- Users and User Roles
- Channel Preferences
- Data Model
- O11ySources
- User Activity Tracking
Step-by-Step Instructions
Access the User Engagement Dashboard
- Open the left navigation menu.
- Click Dashboards.
- Search for User Engagement Dashboard.
- Click the dashboard name.
- The User Engagement Dashboard opens.
Use this dashboard to review user login counts, user activities, dashboard access, session details, and platform usage trends.
Access the System Metrics Dashboard
- Open the left navigation menu.
- Click Dashboards.
- Search for System Metrics.
- Click System Metrics.
- The System Metrics Dashboard opens.
Use this dashboard to review data volume, analytics layer activity, data sources, and metric trends.
View Data Volume Metrics
- Open the System Metrics Dashboard.
- Go to the Data Volume section.
- Review the following panels:
- Data Ingested in last 1 Day
- Uncompressed Data
- Compressed Data
- peak EPS
- Data Ingested Trends
Use these panels to understand data ingestion and storage usage for the selected time range.
View Analytics Layer Volumes
- Open the System Metrics Dashboard.
- Go to the Analytics Layer Volumes section.
- Review the configured and activity-related panels:
- Alert Generated in last 1 day
- Alert Generated
- Alert Rule Configured
- Dashboards Configured
- Report Downloaded in last 1 day
- Reports Downloaded
- Reports Template Configured
- User Configured
- User Role Configured
Use these panels to understand activity and configuration levels in the analytics layer.
View Data Source Metrics
- Open the System Metrics Dashboard.
- Go to the Data Source section.
- Review the following panels:
- O11ySources Configured
- Infra Node
- Traces Source
- Logs Source
- Netflow Sources
- Heartbeat Target
- RUM Source
- Data Comparison in Hyperscale
Use these panels to understand the types and quantities of data sources integrated with the platform.
View Trend Selection Panels
- Open the System Metrics Dashboard.
- Go to the Trend Selection section.
- Review trend charts for the selected time range.
The trend panels include:
- Data Ingestion
- peak EPS
- Alert Rules Configured
- Report Templates Configured
- Reports Downloaded
- Dashboards Configured
- User Configured
- User Role Configured
- Infra Nodes
- O11ySources Configured
- Logs Sources
- Traces Sources
- RUM Sources
- Heartbeat Targets
Access the ContextStreams Dashboard
- Open the left navigation menu.
- Click Dashboards.
- Search for ContextStreams Dashboard.
- Click the dashboard name.
- The ContextStreams Dashboard opens.
- Use the App ID and Instance ID filters to focus on a specific pipeline or instance.
Review ContextStreams Pipeline Health
- Open the ContextStreams Dashboard.
- Start with Stream Apps Overview.
- Check running apps, failed apps, running instances, and failed instances.
- Review exception count and dropped records.
- Check poll latency and process latency.
- Move to Resource Usage Metrics to check memory and CPU usage.
- Open Stream Metrics to review processed records, polls, running app instances, latency, and rates.
- Open Plugin Metrics to review plugin-level latency, exceptions, and dropped records.
- Open Consumer Metrics to check consumer lag and consumption rates.
- Open JVM Metrics to check heap memory usage and garbage collection behavior.
Access the Kafka Cluster Monitoring Dashboard
- Open the left navigation menu.
- Click Dashboards.
- Search for Kafka Cluster Monitoring Dashboard.
- Click the dashboard name.
- The Kafka Cluster Monitoring Dashboard opens.
- Use Hostname and Brokers filters to focus on specific Kafka hosts or brokers.
Review Kafka Cluster Health
- Open the Kafka Cluster Monitoring Dashboard.
- Start with Kafka Emitted Metrics.
- Review total topics, Kafka brokers, active controller count, and active controller broker list.
- Check under-replicated partitions and offline partitions.
- Review ISR shrink rate, ISR expand rate, and under-min ISR partition count.
- Check request queue size, request handler idle percent, and network processor idle percent.
- Review producer, consumer, and follower request rates.
- Check failed produce and fetch request rates.
- Review request processing time for fetch consumer, fetch follower, and produce requests.
- Check bytes in and bytes out per second.
- Review messages in per second by topic.
- Check purgatory size for fetch and produce.
- Open Host Level Metrics to review memory, CPU, disk space, and network.
- Open JVM Metrics to review heap and non-heap memory usage, garbage collection times, and CPU utilization.
Access the Kafka Connect Monitoring Dashboard
- Open the left navigation menu.
- Click Dashboards.
- Search for Kafka Connect Monitoring Dashboard.
- Click the dashboard name.
- The Kafka Connect Monitoring Dashboard opens.
- Use Connectors, Workers, and Nodes filters to focus on specific DataStore connectors.
Review Kafka Connect Health
- Open the Kafka Connect Monitoring Dashboard.
- Start with Kafka Connect Metrics.
- Review connector count, task count, failed task count, active connector status, and connector task status.
- Open Connector Metrics.
- Review sourced and sinked records, batch size, source metrics, and sink metrics.
- Open Kafka Connect Node Metrics.
- Review memory and CPU usage, CPU usage percentiles, and incoming and outgoing byte rate.
- Open JVM Metrics.
- Review heap and non-heap memory usage and garbage collection times.
Access Alert Dashboards
- Open the left navigation menu.
- Click Dashboards.
- Search for Alert-KPI Folder.
- Click the required Alert Dashboard.
- Review Alert KPI or Alert Details based on the requirement.
Review Alert KPI
- Open the Alert KPI dashboard.
- Review total alerts generated for the selected period.
- Check total active alerts.
- Review active alerts by time.
- Check active warning alerts.
- Check active critical alerts.
- Review cleared alerts.
- Review cleared alerts by time.
- Review new alerts by time.
- Check duration percentile to understand alert resolution efficiency.
Review Alert Details
- Open the Alert Details dashboard.
- Review Active Alert Details.
- Review Cleared Alert Details.
- Review Alert Rule-Name-based Percentile.
- Review Summary-based Percentile View.
Use these areas to understand active alerts, cleared alerts, and alert distribution by rule name, summary, or description.
Use Audit Trails
- Open the Audit Trails Dashboard.
- Start with the Overview section.
- Review the number of unique users who made changes.
- Review the number of API calls.
- Review the number of modification API calls.
- Review the count of API calls based on critical modules.
- Review module-specific changes for:
- Dashboards
- Alert Rules
- Reports
- User and User Role
- Preferences
- Data Model
- O11ySources
- User Activity Tracking
Use Audit Trails to understand changes made in the platform and to support compliance, security, and operational review.
Field Descriptions
Common Dashboard Controls
| Field / Control | Description |
|---|---|
| Dashboards | Left navigation option used to access Self Observability dashboards. |
| Search | Used to find dashboards such as User Engagement, System Metrics, ContextStreams, Kafka Cluster Monitoring, and Kafka Connect Monitoring. |
| Selected Time Range | Defines the time period for which dashboard data, counts, charts, and trends are displayed. |
User Engagement Dashboard
| Field / Panel | Description |
|---|---|
| User Logged In | Shows the number of users who logged in. |
| Create/Modify Activities | Tracks user creation and modification activities. |
| Viewed Activities | Tracks when users view or access data in the platform. |
| Delete Activities | Tracks deletion of objects, content, configurations, or data. |
| Activities Performed on Objects | Shows Create, View, Update, and Delete actions performed on platform objects. |
| Activities Performed by User | Shows user-level activity such as views, creations, updates, deletions, and totals. |
| User Statistics | Shows login count, user name, average time spent, and total time spent. |
| User Login Trend | Bar graph showing login frequency over the selected time range. |
| User Login Activity | Shows session details such as username, session ID, login time, logout time, and total time spent. |
| Top Visited Dashboard | Shows the most accessed dashboards. |
| Top Visited Dashboard by User | Shows the dashboards accessed by each user. |
| Total Usage Trend | Shows overall platform usage over the selected time range. |
System Metrics Dashboard
| Field / Panel | Description |
|---|---|
| Data Ingested in Last 1 Day | Shows the total amount of data ingested in the last one day. |
| Uncompressed Data | Shows the total size of uncompressed ClickHouse data stored on disk. |
| Compressed Data | Shows the total size of compressed ClickHouse data stored on disk. |
| peak EPS | Shows the peak EPS value for the selected time range. |
| Data Ingested Trends | Shows data ingestion trends for the selected time range. |
| Alert Generated | Shows the number of alerts generated in the selected time range. |
| Alert Rule Configured | Shows the count of alert rules configured in the system. |
| Dashboards Configured | Shows the count of configured dashboards. |
| Reports Downloaded | Shows the number of reports downloaded in the selected time range. |
| Reports Template Configured | Shows the number of report templates configured. |
| User Configured | Shows the number of users added to the system. |
| User Role Configured | Shows the number of user roles added to the system. |
| O11ySources Configured | Shows the total count of configured observability sources. |
| Infra Node | Shows the number of infrastructure nodes in the system. |
| Traces Source | Shows the number of sources collecting distributed tracing data. |
| Logs Source | Shows the sources from which logs are generated and collected. |
| RUM Source | Shows the number of Real User Monitoring sources providing data. |
| Heartbeat Target | Shows the count of data sources labeled as vuheartbeat. |
| Data Comparison in Hyperscale | Compares uncompressed and compressed data. |
| Trend Selection | Shows trend charts for key system metrics such as data ingestion, peak EPS, alert rules, dashboards, reports, users, O11ySources, logs, traces, RUM, and heartbeat targets. |
ContextStreams Dashboard
| Field / Panel | Description |
|---|---|
| App ID Filter | Filters the dashboard for a specific ContextStreams application. |
| Instance ID Filter | Filters the dashboard for a specific application instance. |
| Stream Apps Overview | Shows running apps, failed apps, running instances, failed instances, processed records, exceptions, and latency. |
| Resource Usage Metrics | Shows CPU and memory usage for selected stream app instances. |
| Stream Metrics | Shows processed records, polling activity, running app instances, latency, and processing rates. |
| Plugin Metrics | Shows plugin-level exceptions, dropped records, latency, and processing details. |
| Consumer Metrics | Shows consumer lag and consumption rates. |
| JVM Metrics | Shows heap memory usage and garbage collection metrics. |
Kafka Cluster Monitoring Dashboard
| Field / Panel | Description |
|---|---|
| Hostname Filter | Filters the dashboard for a specific Kafka host. |
| Broker Filter | Filters the dashboard for selected Kafka brokers. |
| Kafka Emitted Metrics | Shows Kafka cluster metrics such as topics, brokers, controller count, partitions, request rates, failed requests, bytes in/out, and messages by topic. |
| Active Controller Count | Shows the active controller count. The source document states this should ideally be 1. |
| Under Replicated / Offline Partitions | Shows replication or availability issues in Kafka partitions. |
| ISR Metrics | Shows ISR shrink rate, expand rate, and under-min ISR partition count. |
| Request Metrics | Shows request queue size, request handler idle percent, request rates, failed requests, and request processing time. |
| Host Level Metrics | Shows Kafka node-level memory, CPU, disk, and network metrics. |
| JVM Metrics | Shows heap and non-heap memory usage, garbage collection times, and JVM CPU utilization. |
Kafka Connect Monitoring Dashboard
| Field / Panel | Description |
|---|---|
| Connector Filter | Filters the dashboard for selected Kafka Connect connectors. |
| Worker Filter | Filters the dashboard for selected workers. |
| Node Filter | Filters the dashboard for selected nodes. |
| Kafka Connect Metrics | Shows connector count, task count, failed task count, active connector status, and connector task status. |
| Connector Metrics | Shows sourced records, sinked records, batch size, source metrics, and sink metrics. |
| Kafka Connect Node Metrics | Shows memory usage, CPU usage, CPU percentiles, and incoming/outgoing byte rate. |
| JVM Metrics | Shows heap and non-heap memory usage and garbage collection metrics. |
Alert Dashboards
| Field / Panel | Description |
|---|---|
| Alert KPI | Shows alert volume, active alerts, warning alerts, critical alerts, cleared alerts, new alerts, and duration percentile. |
| Alert Details | Shows active alert details, cleared alert details, alert rule-name percentile, and summary-based percentile view. |
| Duration Percentile | Shows how alerts are distributed by resolution duration. |
Audit Trails Dashboard
| Field / Panel | Description |
|---|---|
| Unique Users | Shows the number of users who made changes in the system. |
| API Calls | Shows the number of API calls. |
| Modification API Calls | Shows API calls that resulted in system changes. |
| Critical Module API Calls | Shows API calls grouped by important platform modules. |
| Last Action Performed User | Shows the user who last performed an action. |
| Last Action Time | Shows when the last action was performed. |
| Last Action | Shows the most recent action, such as create, update, or delete. |
| User Activity Tracking | Tracks user activities such as search, alert view, dashboard view, and alert list access. |
What Happens After the Steps
After the user opens a Self Observability dashboard, vuSmartMaps displays the relevant dashboard panels for the selected time range. Users can review counts, charts, trends, tables, and status information depending on the dashboard.
For example:
- The User Engagement Dashboard shows platform usage, user login behavior, session details, and dashboard access trends.
- The System Metrics Dashboard shows data ingestion, storage size, analytics layer counts, data source counts, and trend charts.
- The ContextStreams Dashboard shows pipeline health, resource usage, stream metrics, plugin metrics, consumer metrics, and JVM health.
- The Kafka Cluster Monitoring Dashboard shows Kafka-emitted metrics, host-level metrics, and JVM metrics.
- The Kafka Connect Monitoring Dashboard shows connector status, task status, connector throughput, node usage, and JVM metrics.
- The Alert Dashboards show active alerts, cleared alerts, warning and critical alert counts, duration percentiles, and detailed alert views.
- The Audit Trails Dashboard shows backend changes and user activity across key product modules.
Users can continue analysis by moving from summary panels to more detailed sections, such as plugin metrics, connector task status, alert details, or audit module sections.
Tips / Best Practices
- Start with the summary or overview panels before moving to detailed panels.
- Use the selected time range carefully, because most panels show values for the selected time range.
- Use the User Engagement Dashboard to understand user adoption, login patterns, and dashboard usage.
- Use System Metrics to check ingestion volume, peak EPS, storage size, and configured platform objects.
- Use ContextStreams Dashboard when there are signs of data processing delay, dropped records, exceptions, or pipeline health issues.
- Use Plugin Metrics when exceptions or dropped records need to be analyzed at a plugin level.
- Use Consumer Metrics when consumer lag or consumption rate issues need to be reviewed.
- Use Kafka Cluster Monitoring when data streaming and Kafka broker health need to be checked.
- Check the Active Controller Count in Kafka Cluster Monitoring. The it should ideally be 1.
- Use Kafka Connect Monitoring when connector status, task status, source flow, or sink flow needs to be checked.
- Use Alert KPI to understand alert volume, active alerts, cleared alerts, and alert resolution efficiency.
- Use Alert Details when active or cleared alert details are required.
- Use Audit Trails when changes to dashboards, alert rules, reports, users, roles, preferences, Data Models, or O11ySources need to be reviewed.
Troubleshooting
-
Issue: A dashboard is not found in the Dashboards search
Possible cause: The dashboard name may not have been searched correctly, or the permission behavior for dashboard access.
Solution: Search using the exact dashboard name mentioned in the document, such as User Engagement Dashboard, System Metrics, ContextStreams Dashboard, Kafka Cluster Monitoring Dashboard, Kafka Connect Monitoring Dashboard, or Alert-KPI Folder.
-
Issue: ContextStreams applications or instances show failure
Possible cause: The failed applications or instances may indicate failures or bottlenecks.
Solution: Check Stream Apps Overview first. Then review Stream Metrics for failed app and instance details. Check Plugin Metrics for plugin-wise exception details.
-
Issue: ContextStreams has high poll latency or process latency
Possible cause: High latency values may indicate performance bottlenecks, network issues, or resource contention.
Solution: Review Stream Apps Overview, Stream Metrics, and Resource Usage Metrics. Check CPU and memory usage trends for spikes or sustained high usage.
-
Issue: ContextStreams shows increased exceptions or dropped records
Possible cause: The exceptions or dropped records may indicate data integrity issues, processing logic issues, or resource constraints.
Solution: Review Stream Apps Overview and then check Plugin Metrics for plugin-wise exception details.
-
Issue: Kafka active controller count is not 1
Possible cause: The active controller count should ideally be 1. Any deviation may indicate configuration issues or cluster management problems.
Solution: Review Kafka Emitted Metrics, including active controller count and active controller broker list.
-
Issue: Kafka has under-replicated or offline partitions
Possible cause: Under-replicated partitions may indicate broker unresponsiveness or performance degradation. Offline partitions may indicate cluster-wide availability issues.
Solution: Review Under Replicated Partitions, Offline Partitions Count, ISR Shrink Rate, ISR Expand Rate, and Under Min ISR Partition Count.
-
Issue: Kafka request processing appears slow
Possible cause: High request queue size, high processing time, failed requests, or resource contention may impact Kafka performance.
Solution: Review request queue size, request handler idle percent, network processor idle percent, request rates, failed request rates, and total request processing time.
-
Issue: Kafka host resource usage is high
Possible cause: High CPU, memory, disk, or network usage may indicate resource constraints.
Solution: Open Host Level Metrics and review memory usage, CPU usage, disk space, and network activity.
-
Issue: Kafka Connect has failed tasks
Possible cause: Failed tasks may affect data integration and processing.
Solution: Open Kafka Connect Metrics. Review Failed Task Count, Active Connector Status, and Connector Task Status.
-
Issue: Kafka Connect data movement is slow or inconsistent
Possible cause: Connector throughput, batch size, source metrics, or sink metrics may indicate data flow issues.
Solution: Review Connector Metrics, including sourced and sinked records, batch size, source metrics, and sink metrics.
-
Issue: Kafka Connect node usage is high
Possible cause: High memory, CPU, or byte rates may indicate node-level resource constraints.
Solution: Review Kafka Connect Node Metrics, including memory and CPU usage, CPU usage percentiles, and incoming and outgoing byte rates.
-
Issue: JVM memory or garbage collection looks abnormal
Possible cause: The sudden memory increases or prolonged garbage collection may indicate memory leaks, inefficient resource management, or garbage collection tuning issues.
Solution: Review JVM Metrics, including heap memory, non-heap memory, and garbage collection times.
-
Issue: Alert volume is high
Possible cause: High active alerts, warning alerts, or critical alerts may indicate unresolved operational issues.
Solution: Open Alert KPI to review active alerts by time, warning alerts, critical alerts, cleared alerts, and new alerts by time. Then open Alert Details for detailed alert information.
-
Issue: A configuration change needs to be investigated
Possible cause: A backend change may have been made to a dashboard, alert rule, report, user, role, preference, Data Model, or O11ySource.
Solution: Open Audit Trails and review the relevant module section. Check last action, last action time, and the user who performed the action.
Related Features
- Dashboards
- User Engagement Dashboard
- System Metrics Dashboard
- ContextStreams Dashboard
- Kafka Cluster Monitoring Dashboard
- Kafka Connect Monitoring Dashboard
- Alert Dashboards
- Audit Trails
FAQs
What is Self Observability in vuSmartMaps?
Self Observability helps users monitor the vuSmartMaps platform itself. It provides dashboards to track platform usage, system metrics, ContextStreams health, Kafka Cluster health, Kafka Connect health, alert trends, and audit activity. These dashboards help administrators and support teams understand whether the platform is being used and running as expected.
How do I access Self Observability dashboards?
Open the left navigation menu and go to Dashboards. Use the dashboard search option to search for the required dashboard, such as User Engagement Dashboard, System Metrics, ContextStreams Dashboard, Kafka Cluster Monitoring Dashboard, or Kafka Connect Monitoring Dashboard. Click the dashboard name to open it.
Which dashboard should I use to check user activity on the platform?
Use the User Engagement Dashboard. It shows user logins, create or modify activities, viewed activities, delete activities, activities performed on objects, activities performed by user, user statistics, login trends, login activity, top visited dashboards, and total usage trend. This helps administrators understand platform adoption and user behavior.
Which dashboard should I use to check data ingestion and platform usage metrics?
Use the System Metrics Dashboard. It shows data volume, analytics layer volumes, data source metrics, and trend selection panels. These panels help users review data ingested, compressed and uncompressed data size, peak EPS, alert rules, dashboards, reports, users, user roles, O11ySources, logs, traces, RUM sources, and heartbeat targets.
Which dashboard should I use if data processing appears delayed?
Use the ContextStreams Dashboard. It helps monitor ContextStream pipelines through Stream Apps Overview, Resource Usage Metrics, Stream Metrics, Plugin Metrics, Consumer Metrics, and JVM Metrics. It also provides filters for App IDs and Instance IDs, so users can focus on a specific pipeline or instance.
What should I check first in the ContextStreams Dashboard?
Start with Stream Apps Overview. Check running apps, failed apps, running instances, failed instances, exceptions, dropped records, poll latency, and process latency. If there are failures, check Stream Metrics. If exceptions or dropped records increase, check Plugin Metrics for plugin-level details.
Which dashboard should I use to monitor Kafka Cluster health?
Use the Kafka Cluster Monitoring Dashboard. It shows Kafka-emitted metrics, host-level metrics, and JVM metrics. These include topics, brokers, active controller count, partitions, request rates, failed requests, bytes in and out, memory, CPU, disk, network, heap memory, non-heap memory, and garbage collection metrics.
What does Active Controller Count indicate in Kafka Cluster Monitoring?
The Active Controller Count helps assess Kafka cluster health. the active controller count should ideally be 1. Any deviation may indicate configuration issues or problems with cluster management.
Which dashboard should I use to monitor Kafka Connect connectors and tasks?
Use the Kafka Connect Monitoring Dashboard. It shows connector count, task count, failed task count, connector status, task status, sourced and sinked records, batch size, source metrics, sink metrics, node memory and CPU usage, incoming and outgoing byte rate, and JVM metrics. This helps teams check whether connectors are moving data correctly between Kafka and other databases.
Which dashboard should I use to review alerts and system changes?
Use Alert Dashboards to review alert volume, active alerts, cleared alerts, warning alerts, critical alerts, new alerts, and alert resolution duration. Use Audit Trails to track backend changes across Dashboards, Alert Rules, Reports, Users and User Roles, Channel Preferences, Data Model, and O11ySources. Audit Trails also includes user activity tracking.
