Mobile RUM
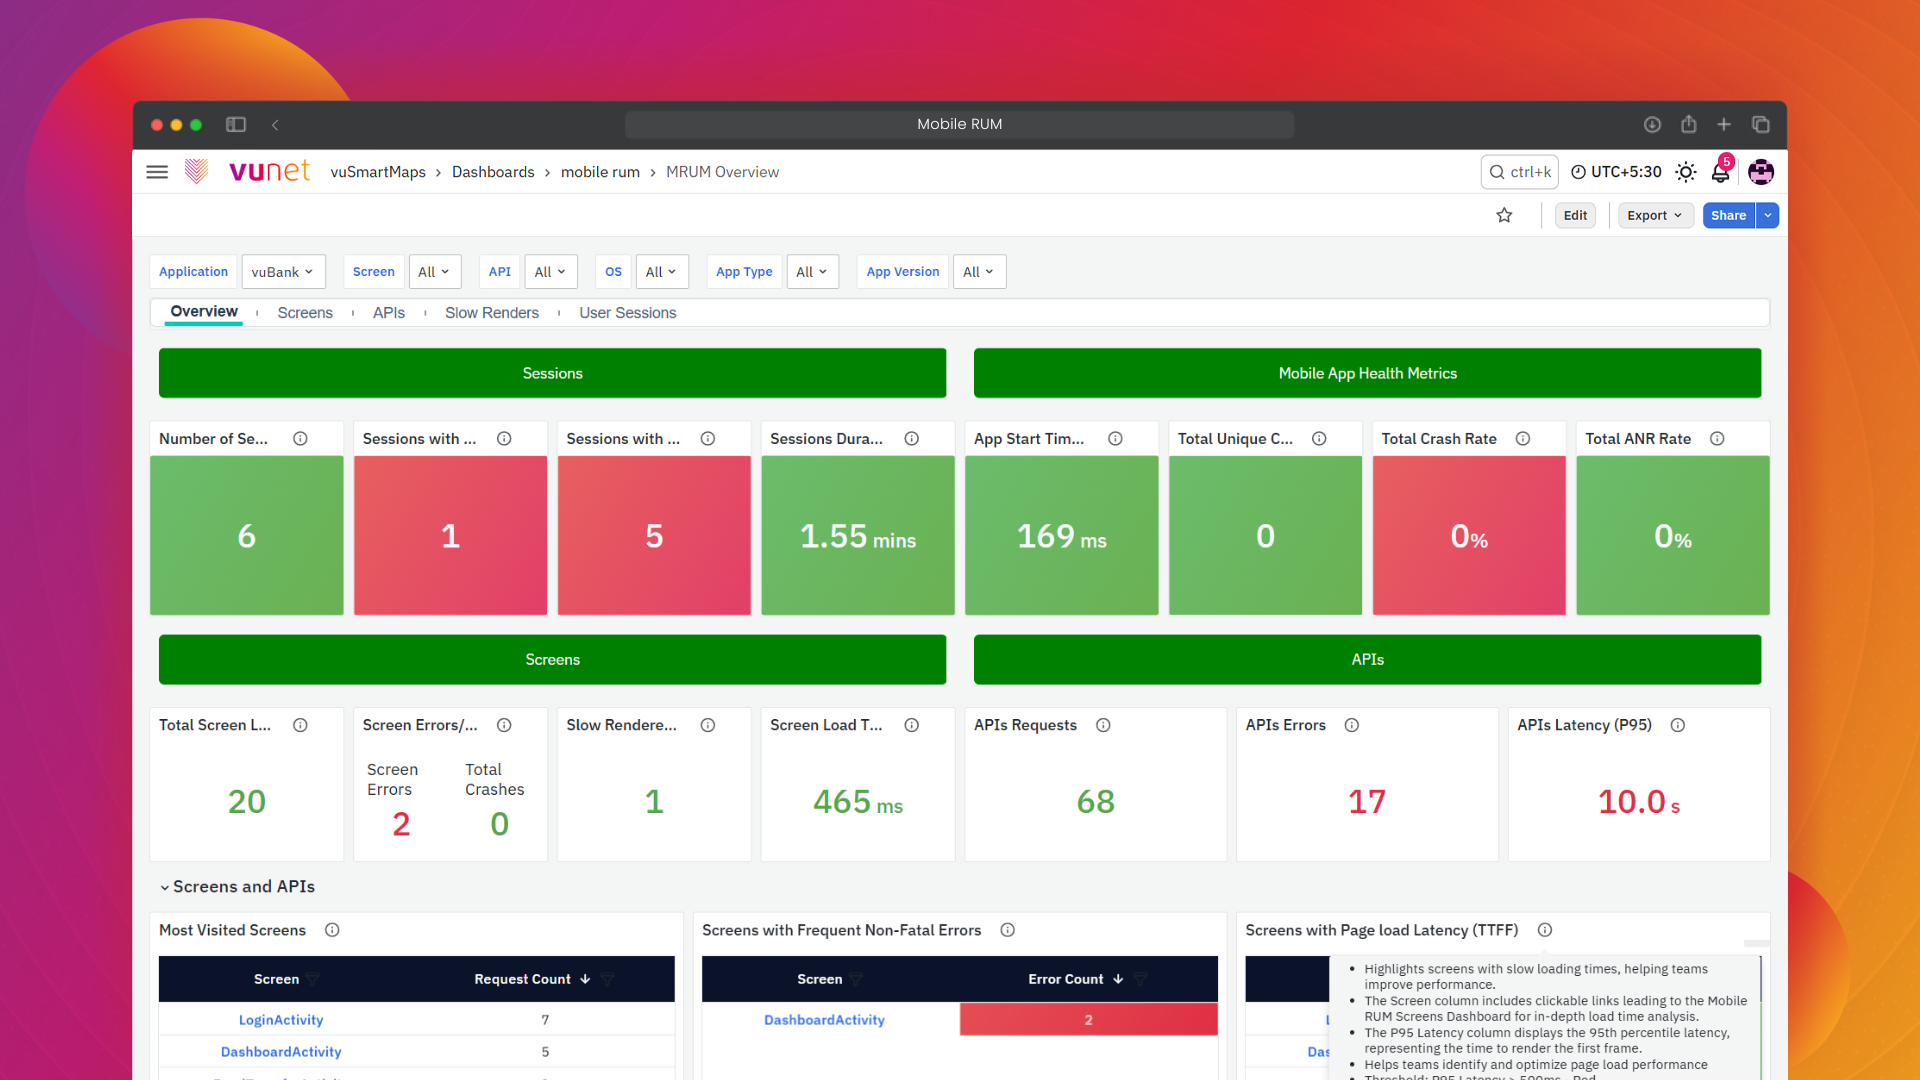
Overview
Mobile Real User Monitoring (MRUM) helps you understand how real users experience your mobile applications in real time. By adding VuNet’s Mobile SDK to your app, MRUM automatically tracks key performance details like screen load times, API call latency, crashes, errors, and user interactions. This data is securely sent to vuSmartMaps, where it is processed and displayed in easy-to-read dashboards. These insights help you quickly detect problems, analyze trends, and improve both app performance and user experience. MRUM works across Android and Flutter apps, supporting detailed tracking of screens, APIs, and user sessions, along with geographical and device-specific breakdowns.
Why This Feature Is Useful
- Mobile Real User Monitoring (MRUM) provides visibility into how real users experience mobile applications in production environments. By collecting telemetry directly from mobile devices, MRUM enables organizations to monitor application performance, user interactions, crashes, errors, network activity, and session behavior in real time.
- MRUM helps development, operations, and support teams identify performance bottlenecks, troubleshoot application issues, analyze user journeys, and improve overall user experience. By correlating frontend mobile telemetry with backend observability data, organizations can gain end-to-end visibility across the entire application ecosystem and reduce Mean Time to Resolution (MTTR).
Example Scenario
A mobile banking application team wants to monitor the real-world performance of its application after a new release. The team integrates the Mobile RUM SDK into the application, configures the Mobile RUM O11ySource in vuSmartMaps, and deploys the updated app. As users interact with the application, MRUM captures screen load times, API response times, crashes, user sessions, and device information. The operations team uses the dashboards to identify slow screens, investigate failed API calls, analyze user sessions, and quickly resolve performance issues before they impact more users.
When to Use This Feature
Use Mobile RUM when you need to:
- Monitor real-user mobile application performance.
- Track screen load times and navigation flows.
- Monitor API response times and network performance.
- Detects application crashes and runtime errors.
- Analyze user sessions and user behavior patterns.
- Identify slow rendering screens and performance bottlenecks.
- Correlate mobile transactions with backend distributed traces.
- Monitor application performance across different devices and operating systems.
- Analyze geographical performance trends.
- Track custom user interactions and business activities.
- Improve mobile application reliability and user experience.
- Gain end-to-end observability across mobile and backend services.
Comprehensive Understanding
The Mobile RUM pages provide a centralized interface for configuring, monitoring, and analyzing the performance of mobile applications.
The module allows you to:
- Enable and configure the Mobile RUM O11ySource.
- Configure Mobile RUM data sources.
- Download the Flutter SDK package and integrate the Mobile RUM SDK into supported mobile applications.
- Configure Android Native, Flutter, and iOS instrumentation.
- Monitor application performance through dedicated dashboards.
- Analyze screen performance, API latency, crashes, slow rendering, user sessions, trace maps, and geographical insights.
- Track mobile application health using alerts and performance metrics.
The dashboards provide comprehensive visibility into mobile application performance, helping teams identify bottlenecks, troubleshoot issues, and improve the overall user experience.
MRUM Architecture

The Mobile RUM architecture enables real-time performance monitoring by capturing telemetry directly from end-user mobile applications.
- End User:
The process starts when an end user accesses the mobile application. Instrumented code, embedded within the app via the Mobile RUM SDK, collects RUM data such as screen load times, API call performance, crashes, ANRs, and user interactions. - Internet:
The captured telemetry data is securely transmitted over the internet to the organization’s infrastructure. - Firewall:
The data passes through an external firewall into a secure Demilitarized Zone (DMZ). - DMZ – Web Server / Proxy Server:
A web server or proxy server hosted within the DMZ receives the RUM data. This server can:
- Act as a reverse proxy, or
- Be a dedicated server that forwards telemetry to the internal observability platform.
- Internal Firewall:
The forwarded data passes through an internal firewall to reach the organization's internal network. - Internal Network – Data Center (DC):
Within the DC, the vuSmartMaps RUM Collector ingests the telemetry data. - RUM Server & Databases:
The RUM Collector forwards the data to the RUM Server, which processes and stores it in connected databases. This processed data is then used for visualization, performance analysis, and troubleshooting within the observability platform.
Step-by-step instructions
Follow these steps to configure Mobile RUM:
- Enable the Mobile RUM O11ySource.
- Configure a new Mobile RUM data source.
- Provide the application details required for monitoring.
- Review and finalize the data source configuration.
- Download the SDK package (Flutter) or configure SDK dependencies (Android/iOS).
- Configure the required firewall and proxy settings.
- Install and integrate the Mobile RUM SDK into the application.
- Initialize the SDK with the required telemetry endpoints and API keys.
- Configure optional instrumentation such as screen navigation, network tracing, and activity tracking.
- Build and deploy the instrumented application.
- Generate application traffic and user activity.
- Verify data ingestion within vuSmartMaps.
- Monitor dashboards, traces, sessions, and alerts.
Deployment and Configuration
Mobile RUM works by integrating VuNet’s Mobile SDK into your mobile application, enabling it to collect performance and usage data in real time. After the SDK is added, the application must be rebuilt and redeployed with the integration in place. Once deployed, the SDK automatically sends the collected data to vuSmartMaps, where it can be analyzed to improve application performance and overall user experience.
The configuration process for comprehensive monitoring involves two key steps:
- Configuring vuSmartMaps for Mobile RUM: Enable the Mobile RUM O11ySource in vuSmartMaps, configure the data source with your application details, and download the required SDK package (for Flutter) or configure the Android Native or iOS Native SDK as per the instrumentation guide.
- Client-Side Instrumentation: Integrate the VuNet Mobile RUM SDK into your mobile application (Flutter, Android Native, or iOS Native). Initialize it with the required telemetry endpoints, application details, and optional tracking features such as slow frame detection, screen navigation tracing, and API monitoring.
- Additional Configuration Details: For secure and scalable data collection, deploy a proxy server in the DMZ. The proxy handles SSL termination, CORS enforcement, API key authentication, and forwards telemetry to the vuSmartMaps RUM Collector inside the internal network.
Following these steps, Mobile RUM is successfully integrated, allowing continuous monitoring of performance trends, stability metrics, and user interactions for improved mobile application observability.
Mobile RUM Dashboards
The Mobile RUM Dashboards, included with Mobile RUM, can be accessed by clicking on Dashboards in the left menu. On the Dashboards page, you can find the MRUM App Catalog using the Search bar. Navigate to the MRUM App Catalog dashboard which is located in the Mobile RUM folder.
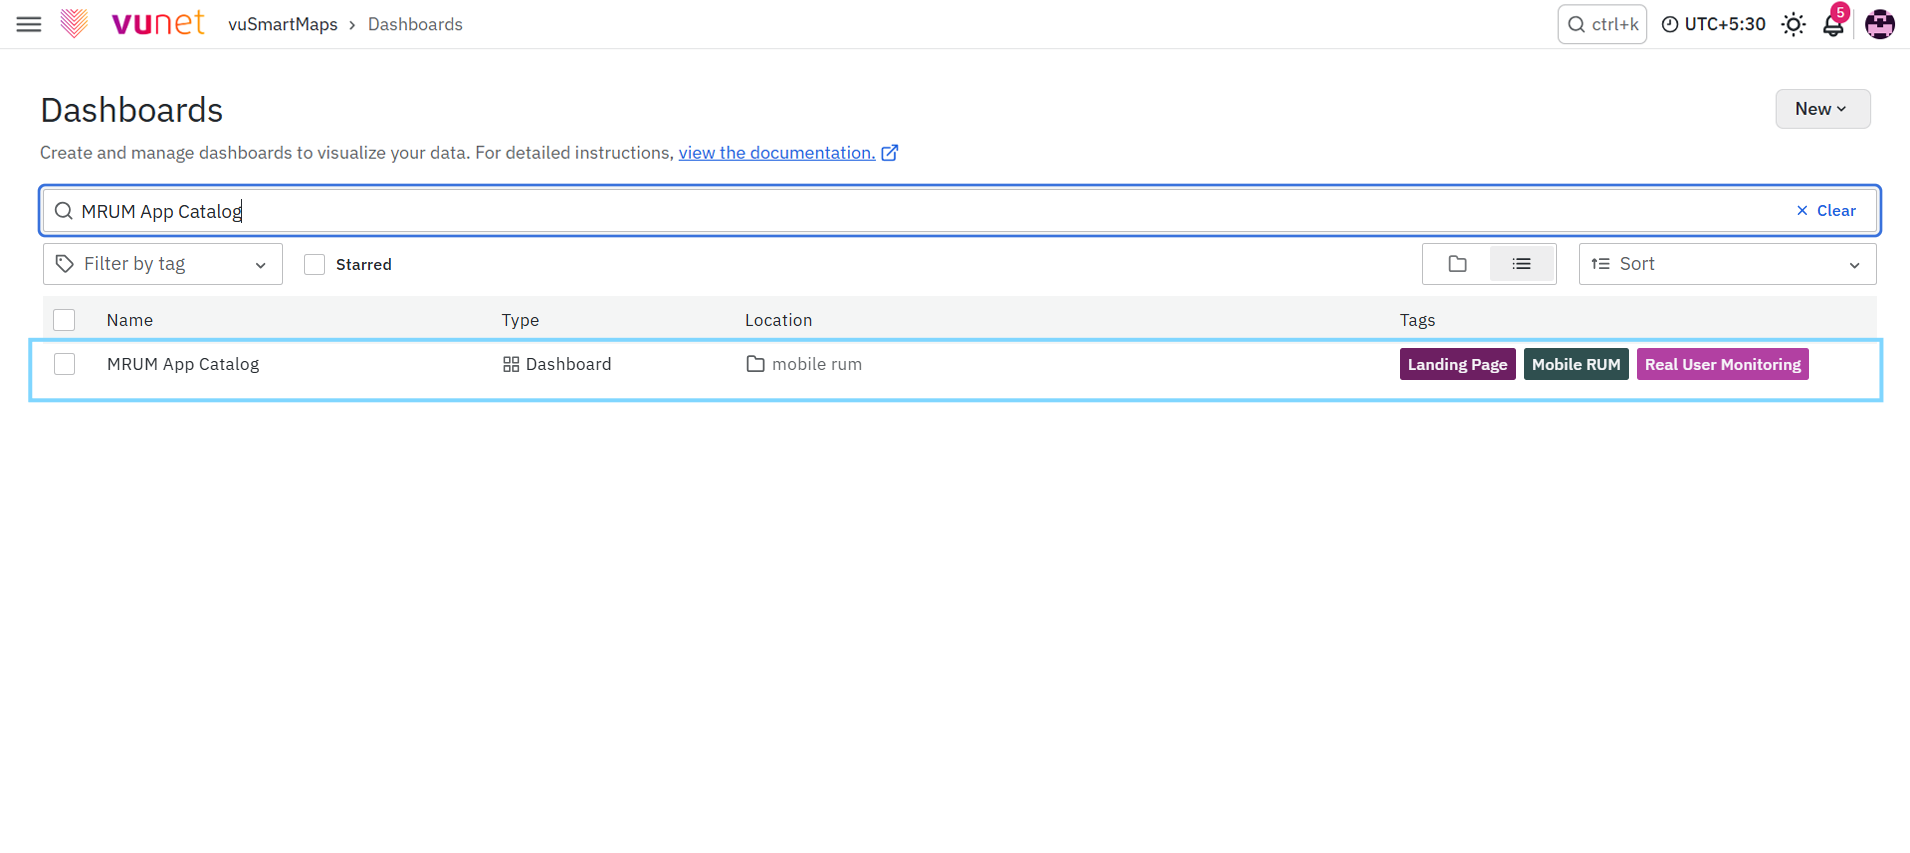
Once you access the Mobile RUM Dashboards, the first page you’ll see is the MRUM App Catalog. Mobile RUM provides a range of dashboards designed to give you meaningful insights into your application's mobile performance. Here are the available dashboards:
- Application Overview Dashboard
- MRUM App Catalog – Lists all monitored mobile applications with quick access to session statistics, error counts, and regional usage insights.
- Detailed Application Metrics Dashboards
- MRUM Overview – Summarizes key performance metrics for screens, APIs, crashes, and sessions, providing a high-level view of app health.
- MRUM Screens – Shows screen-level metrics such as request counts, load latency, and error trends.
- MRUM APIs – Displays API performance data, including call volumes, error counts, and latency.
- MRUM Slow Render – Highlights screens with slow-render frames that may impact UI performance.
- MRUM User Sessions – Provides session counts, error trends, duration insights, and breakdowns by OS, device, and network.
- Trace Listing Dashboards
- MRUM Tracelisting - provides a unified view of the most recent screen and API traces, showing key details like duration, status, and response codes to help monitor and troubleshoot app performance..
- Trace Visualization Dashboard
- MRUM Trace Map – Presents a visual flow of screen/API events within a session, helping trace execution paths and timing.
- User Session Insights
- MRUM User Session Details – Offers a detailed breakdown of a single user session, including screen/API usage, flame graphs, slow tasks, and error logs.
- Geographical Insights
- MRUM Geo Map – Displays session activity by geographic region with filters for app version, OS, screen, and other parameters to identify location-specific trends and issues.
FAQs
What is Mobile Real User Monitoring (MRUM)?
Mobile Real User Monitoring (MRUM) provides real-time visibility into how users experience mobile applications by tracking screen load times, API latency, crashes, errors, user interactions, and sessions.
What mobile applications does MRUM support?
MRUM supports Android and Flutter applications, with instrumentation options for Android Native, Flutter, and iOS.
What types of mobile application data can MRUM monitor?
MRUM can monitor screen performance, API response times, crashes, errors, user sessions, network activity, user interactions, device and operating-system details, and geographical performance.
How does the Mobile RUM architecture collect and process telemetry?
The Mobile RUM SDK collects telemetry from the mobile application and sends it through the internet, firewall, and DMZ proxy to the vuSmartMaps RUM Collector. The RUM Server then processes and stores the data for visualization and analysis.
What are the main steps to configure Mobile RUM?
The process includes enabling the Mobile RUM O11ySource, configuring a data source, providing application details, configuring the SDK and network settings, integrating and initializing the SDK, deploying the application, generating traffic, and verifying the ingested data in vuSmartMaps.
What dashboards are available for Mobile RUM?
Mobile RUM provides dashboards including MRUM App Catalog, MRUM Overview, MRUM Screens, MRUM APIs, MRUM Slow Render, MRUM User Sessions, MRUM Tracelisting, MRUM Trace Map, MRUM User Session Details, and MRUM Geo Map.
What insights can I get from Mobile RUM dashboards?
The dashboards provide insights into application performance, screen and API metrics, crashes, slow rendering, user sessions, traces, session details, and geographical usage trends.
