Browser RUM
Overview
Browser Real User Monitoring (RUM) focuses on capturing performance data from users interacting with web applications. It collects metrics like page load time, XHR request latency, Core Web Vitals (LCP, FID, CLS), and JavaScript errors, providing a complete picture of frontend performance.
With vuSmartMaps Browser RUM, teams can visualize user journeys, analyze slow-loading pages, and quickly identify areas for frontend optimization. It enables proactive performance tuning based on real user behavior, ensuring smooth, responsive web experiences.
Getting Started with Browser RUM
BRUM Architecture
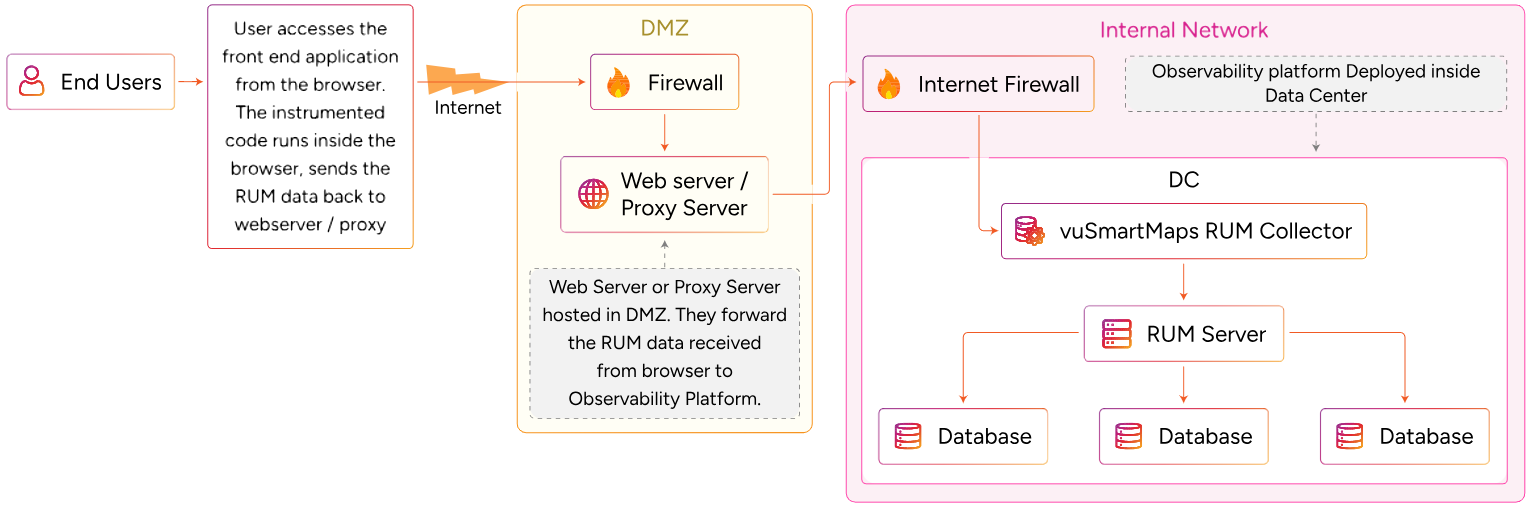
The Browser RUM architecture enables real-time performance monitoring by capturing telemetry directly from end-user browsers.
- End User:
The process starts when an end user accesses the frontend application through a browser. Instrumented JavaScript code embedded in the frontend captures RUM data, including page load times, user interactions, and JavaScript errors. - Internet:
The captured telemetry data is transmitted over the internet to the organization’s infrastructure. - Firewall:
The data passes through an external firewall into a secure Demilitarized Zone (DMZ) - DMZ - Web Server / Proxy Server:
A web server or proxy server, hosted within the DMZ, receives the RUM data. This server can:- Act as a reverse proxy,
- Or be a dedicated server that forwards telemetry to the internal observability platform.
- Internal Firewall:
The forwarded data passes through an internal firewall to reach the organization's internal network. - Internal Network - Data Center (DC):
Within the DC, the vuSmartMaps RUM Collector ingests the telemetry data. - RUM Server & Databases:
The RUM Collector forwards the data to the RUM Server, which processes and stores it across connected databases. This processed data is used for visualization, performance analysis, and troubleshooting within the observability platform.
Why This Feature Is Useful
- Browser Real User Monitoring (RUM) provides visibility into the actual experience of users interacting with web applications. Unlike synthetic monitoring, which relies on simulated transactions, Browser RUM captures performance metrics directly from real user sessions, enabling organizations to understand how applications perform under real-world conditions.
- By collecting frontend performance data, user interactions, network requests, browser errors, and Core Web Vitals, Browser RUM helps teams identify performance bottlenecks, diagnose user experience issues, monitor application health, and optimize digital experiences. It also enables faster troubleshooting by correlating frontend behavior with backend observability data and distributed traces.
- With Browser RUM, organizations can proactively improve application responsiveness, reduce user-impacting issues, and make data-driven decisions to enhance customer experience.
Example Scenario
A platform administrator wants to create a reusable data model that combines application performance metrics from a PostgreSQL database with log data stored in Elasticsearch. Using the Data Modelling Workspace, the administrator configures the required Data Stores, creates queries using the Query Builder and SQL Editor, applies transformations to enrich the data, and exposes only the required metrics and dimensions. The completed Data Model is then used across dashboards, alerts, reports, and insights, ensuring consistent data representation and reducing the need to recreate queries for different use cases.
When to Use This Feature
Use Browser RUM when you need to:
- Monitor application performance from the perspective of real users.
- Measure page load times, API response times, and browser rendering performance.
- Track Core Web Vitals such as Largest Contentful Paint (LCP), First Input Delay (FID), and Cumulative Layout Shift (CLS).
- Analyze frontend JavaScript errors and client-side failures.
- Understand user behavior across pages, sessions, and application workflows.
- Identify slow-loading pages and performance bottlenecks.
- Correlate frontend activity with backend traces and services.
- Monitor user sessions and session replay data.
- Investigate performance issues affecting specific geographies, browsers, or devices.
- Validate application performance improvements after releases or deployments.
Step-by-step instructions
Follow these steps to configure Browser RUM monitoring:
- Enable the Browser RUM O11ySource in vuSmartMaps.
- Configure the Browser RUM data source and monitoring parameters.
- Define application details, sampling percentages, and security settings.
- Select the appropriate management mode for deployment.
- Download the Browser RUM instrumentation package if manual deployment is required.
- Configure the reverse proxy and network prerequisites.
- Add the Browser RUM JavaScript instrumentation to the target application.
- Configure the telemetry receiver endpoint and authentication settings.
- Deploy the updated application.
- Verify that telemetry data is being received by the Browser RUM collector.
- Access Browser RUM dashboards to validate data ingestion and monitoring coverage.
- Review user sessions, traces, page performance metrics, and browser insights.
Deployment and Configuration
Achieve seamless real user monitoring by integrating the Browser RUM instrumentation library into the target application. Once integrated, the system begins capturing and forwarding user experience data to vuSmartMaps in real-time, providing deep insights into web application performance. The configuration process for comprehensive monitoring involves two key steps:
Achieve seamless real user monitoring by integrating the Browser RUM instrumentation library into the target application. Once integrated, the system begins capturing and forwarding user experience data to vuSmartMaps in real-time, providing deep insights into web application performance. The configuration process for comprehensive monitoring involves two key steps:
-
Configuring vuSmartMaps for Browser RUM: To enable Browser RUM in vuSmartMaps, activate the Browser RUM O11ySource, configure data sources, and download the client instrumentation package to begin monitoring user sessions and application performance in real time.
-
Client-Side Instrumentation: The next step involves adding the VuNet RUM script to the target application. The process varies based on the deployment environment:
- Host/VM: Add the VuNet RUM script directly to your application’s codebase and configure the telemetry receiver endpoint.
- Cloud/CDN: Load the RUM script from VuNet’s Content Delivery Network (CDN) for easier deployment and updates.
- Docker:Include the RUM script in the container image and rebuild it to enable monitoring within containerized applications.
- Kubernetes: Deploy the updated container with the embedded RUM script to your cluster for end-to-end session monitoring.
-
Additional Configuration Details: To support secure and scalable collection of Browser RUM data, a reverse proxy server must be configured. This setup enables SSL termination, CORS handling, API key authentication, and safe forwarding of data to the RUM collector. The section below outlines all prerequisites, NGINX configurations, and proxy sizing recommendations required for seamless integration.
Following these steps, Browser RUM is successfully integrated, allowing continuous tracking of user experience, performance trends, and potential issues for enhanced web application observability.
Browser RUM Dashboards
The Browser RUM Dashboards, included with Browser RUM, can be accessed by clicking on Dashboards in the left menu. On the Dashboards page, you can find the BRUM BRUM App Catalog using the Search bar. Navigate to the BRUM App Catalog dashboard which is located in the Browser RUM folder.
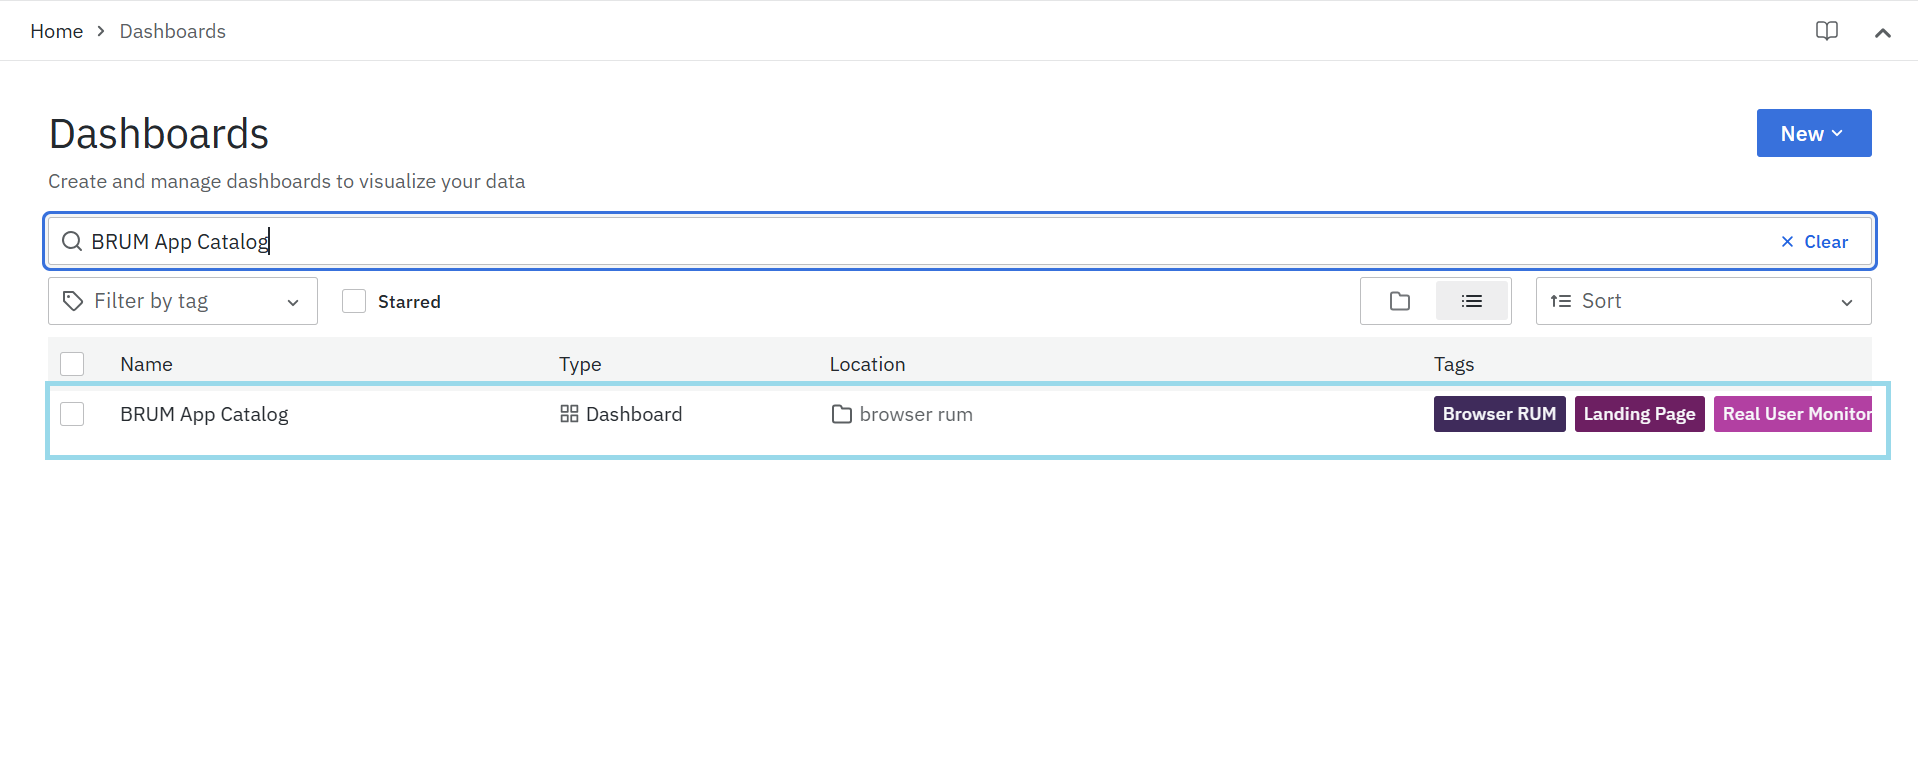
Once you access the Browser RUM Dashboards, the first page you’ll see is the BRUM App Catalog page, Browser RUM provides a range of dashboards designed to give you meaningful insights into your application's performance.Here are the available dashboards:

-
Application Overview Dashboard: Offers a high-level summary of browser performance metrics and key indicators.
- BRUM App Catalog: Offers insights into the various applications within your system, allowing for comprehensive management and analysis.
-
Detailed Application Metrics Dashboards:Provides a detailed overview of individual services within Browser RUM, including performance metrics, user interactions, and usage statistics.
- BRUM Overview: summarizes KPIs like total sessions, average page load time, and error rates for a quick assessment of the application's health.
- BRUM Pages: Tracks metrics like page load times, web vitals, errors, and slow-loading pages to provide insights for performance improvement.
- BRUM API's: Shows metrics like API requests, error rates, and response times to identify backend issues impacting user experience.
- BRUM Long Tasks: Highlights browser tasks that take longer than expected, helping identify bottlenecks and optimize frontend performance.
- BRUM User Sessions: Provides insights into session details, errors, trends, and correlations with performance data for better troubleshooting.
-
Tracelisting Dashboards: Provides a list of recent traces, capturing performance details for better analysis and troubleshooting.
- BRUM Tracelisting (Pages): Lists the most recent 1000 page traces, capturing load times, user interactions, and errors.
- BRUM Tracelisting (API's): Lists the most recent 1000 API traces, tracking response times, failures, and dependencies.
-
Trace Visualization Dashboard:
- BRUM Trace Map: Offers visually tracks a transaction's journey across services, helping identify delays, errors, and dependencies for detailed performance analysis.
-
- BRUM User Session Details: Offers session-level analysis, capturing user journeys, performance metrics, and error occurrences.
-
- Geo Map: Displays user activity across different geographic locations, helping analyze performance trends and regional impact.
