Configuring UTM Visualization
In this section, you can add a new UTM and configure it. It consists of the following steps.
Prerequisite:
Before configuring, set the Data Source as “VuNet (Provisioned) ”, as Insights can be accessed only through this.
Step 1: Create a Dashboard.
On the Toggle menu, click on the Dashboards tab and Click onNew > New Dashboard.
Step 2: Click on + Add Visualization
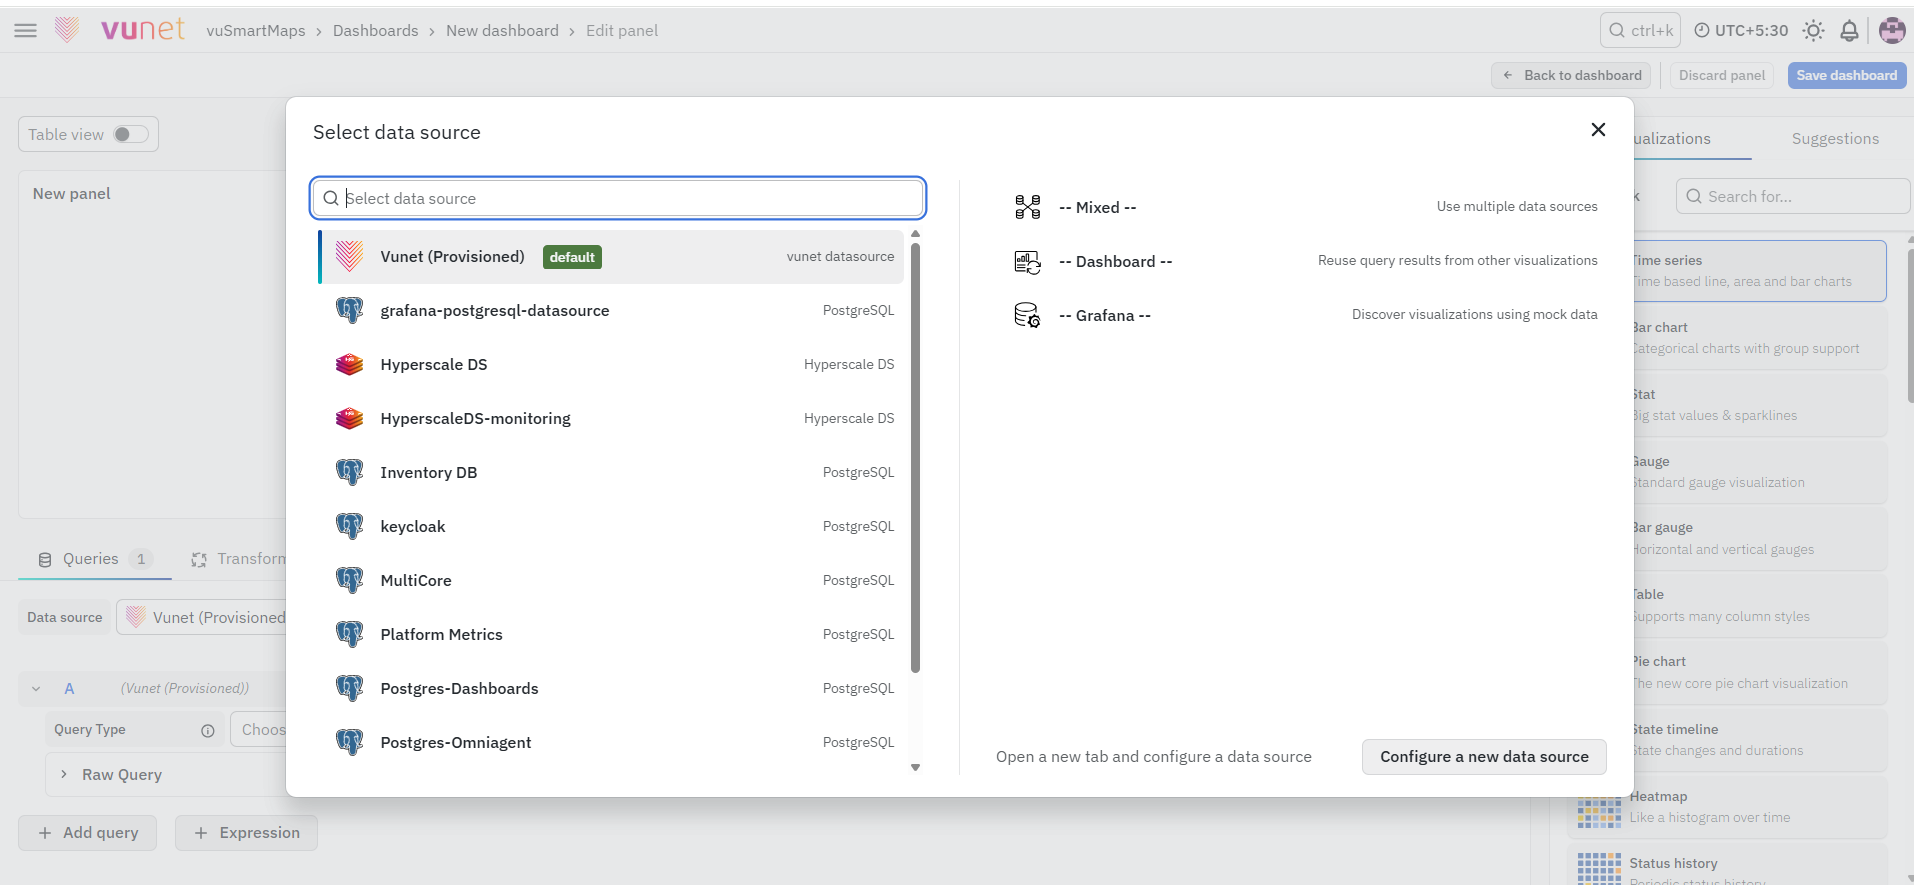
Step 3: Select Data Source as VuNet (Provisioned)
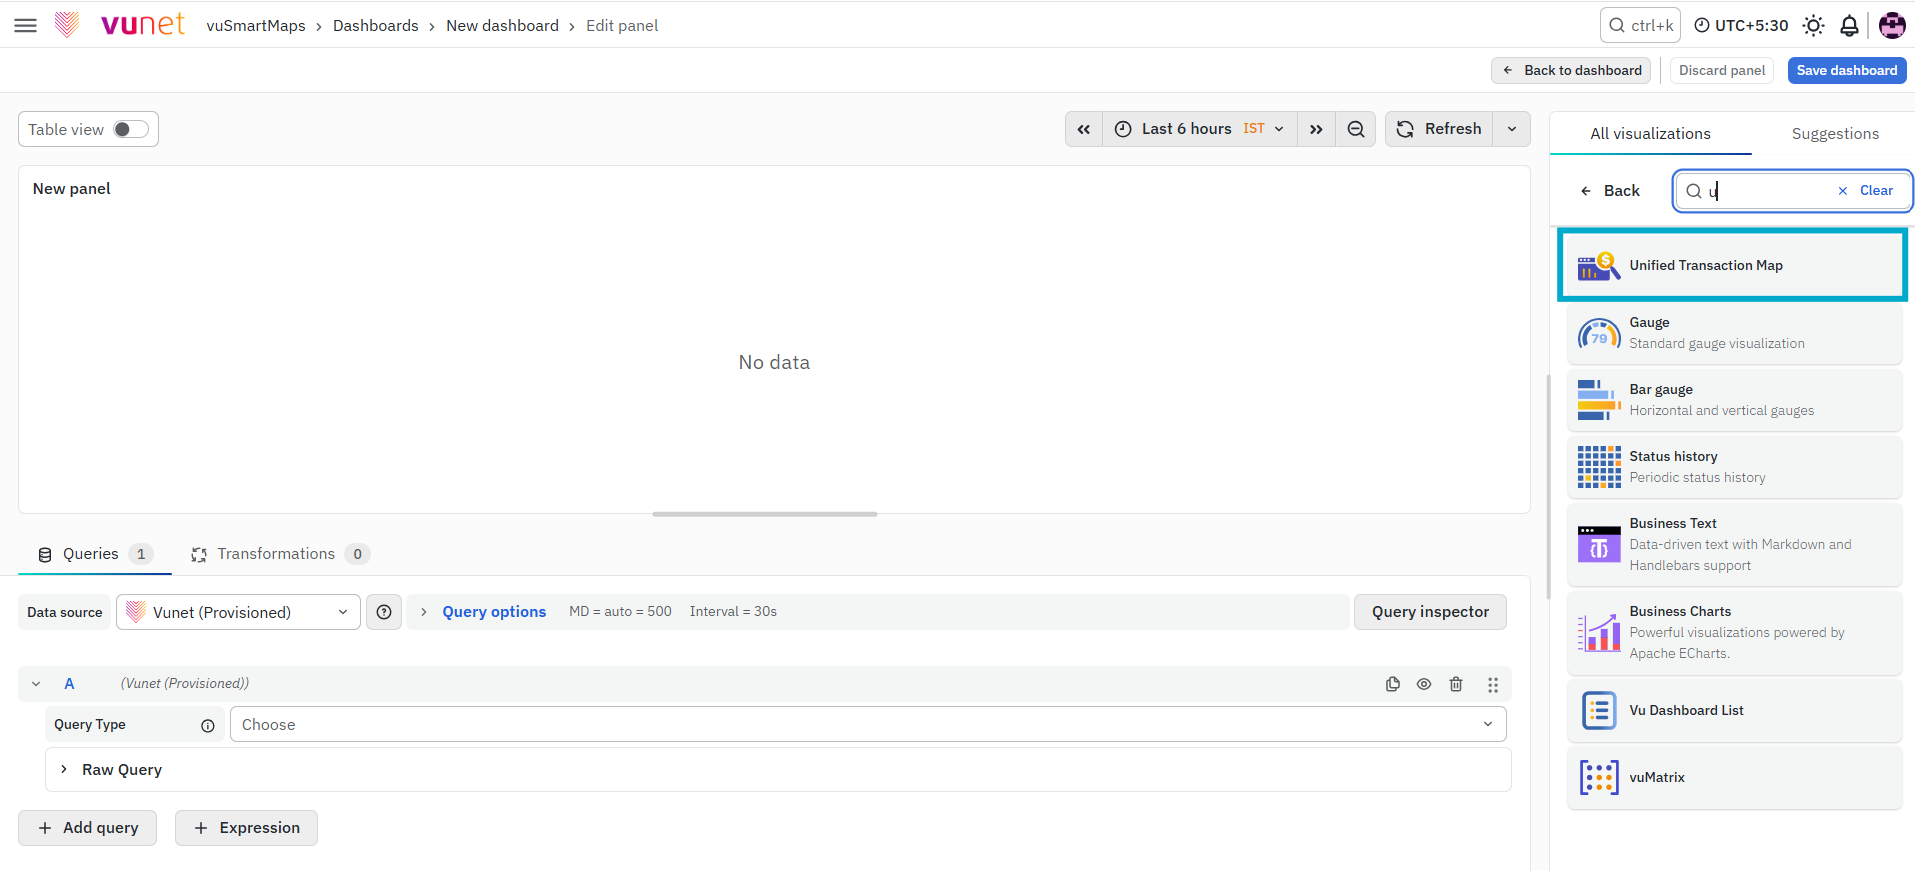
Step 4: On the right side of the screen, pick Unified Transaction Map for your UTM panel.
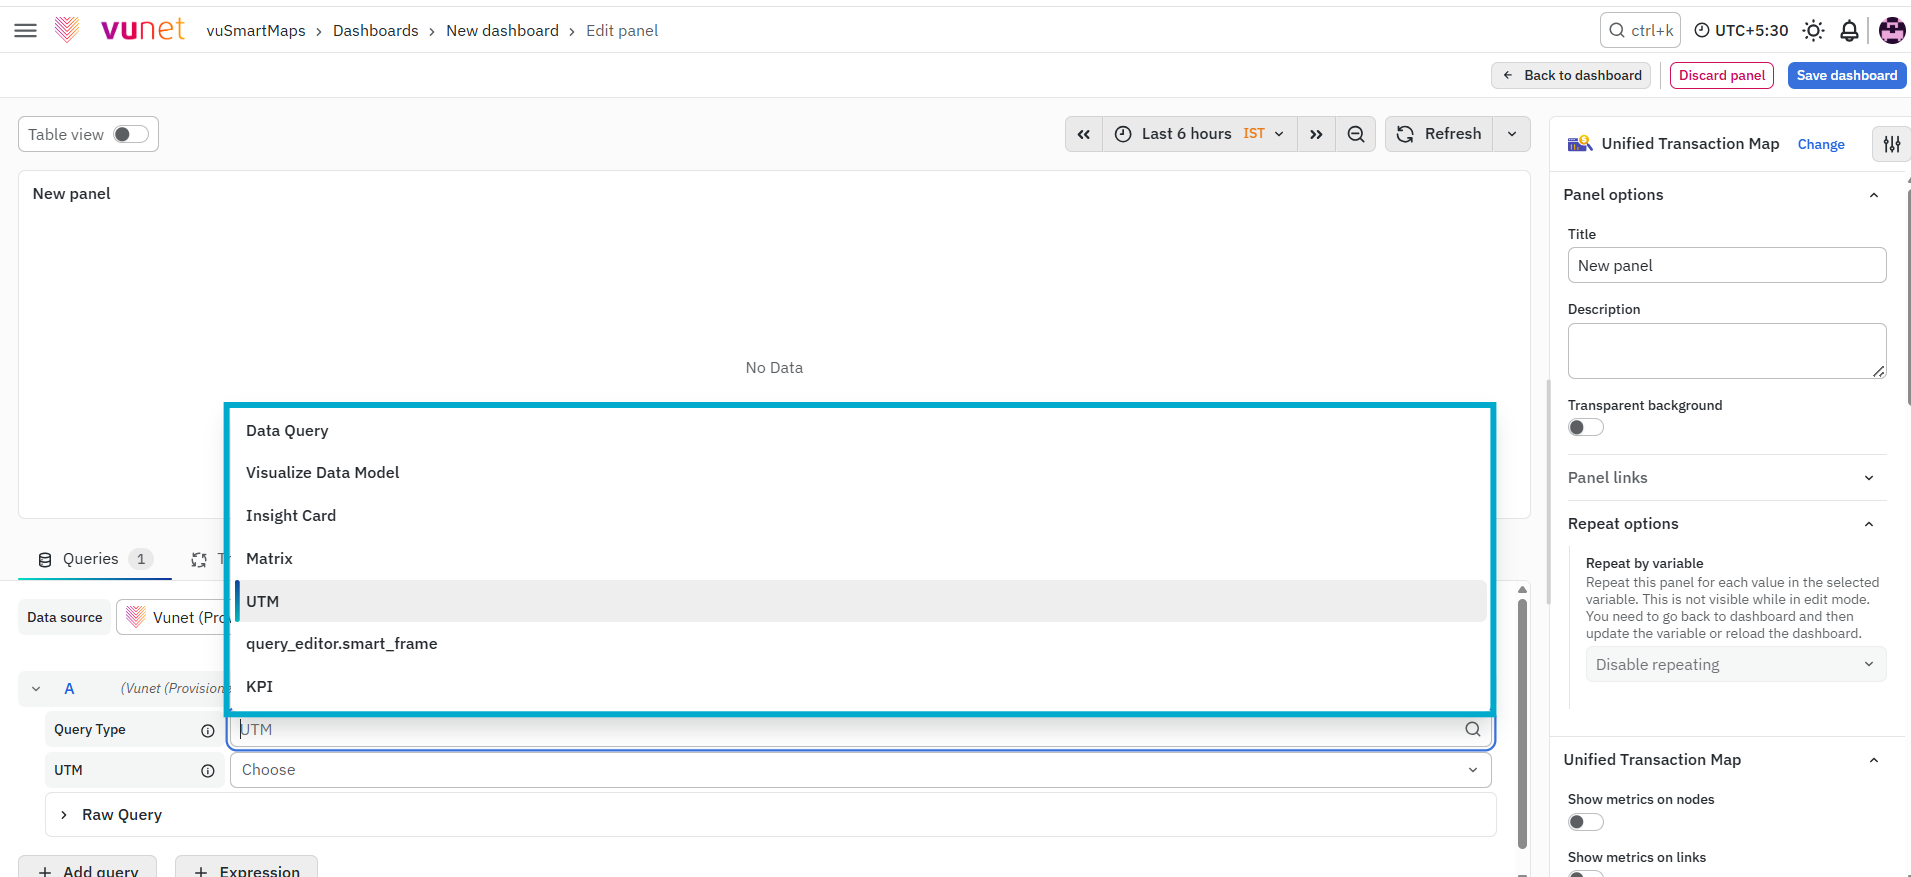
Step 5: Choose Unified Transaction Map as your Query Type.

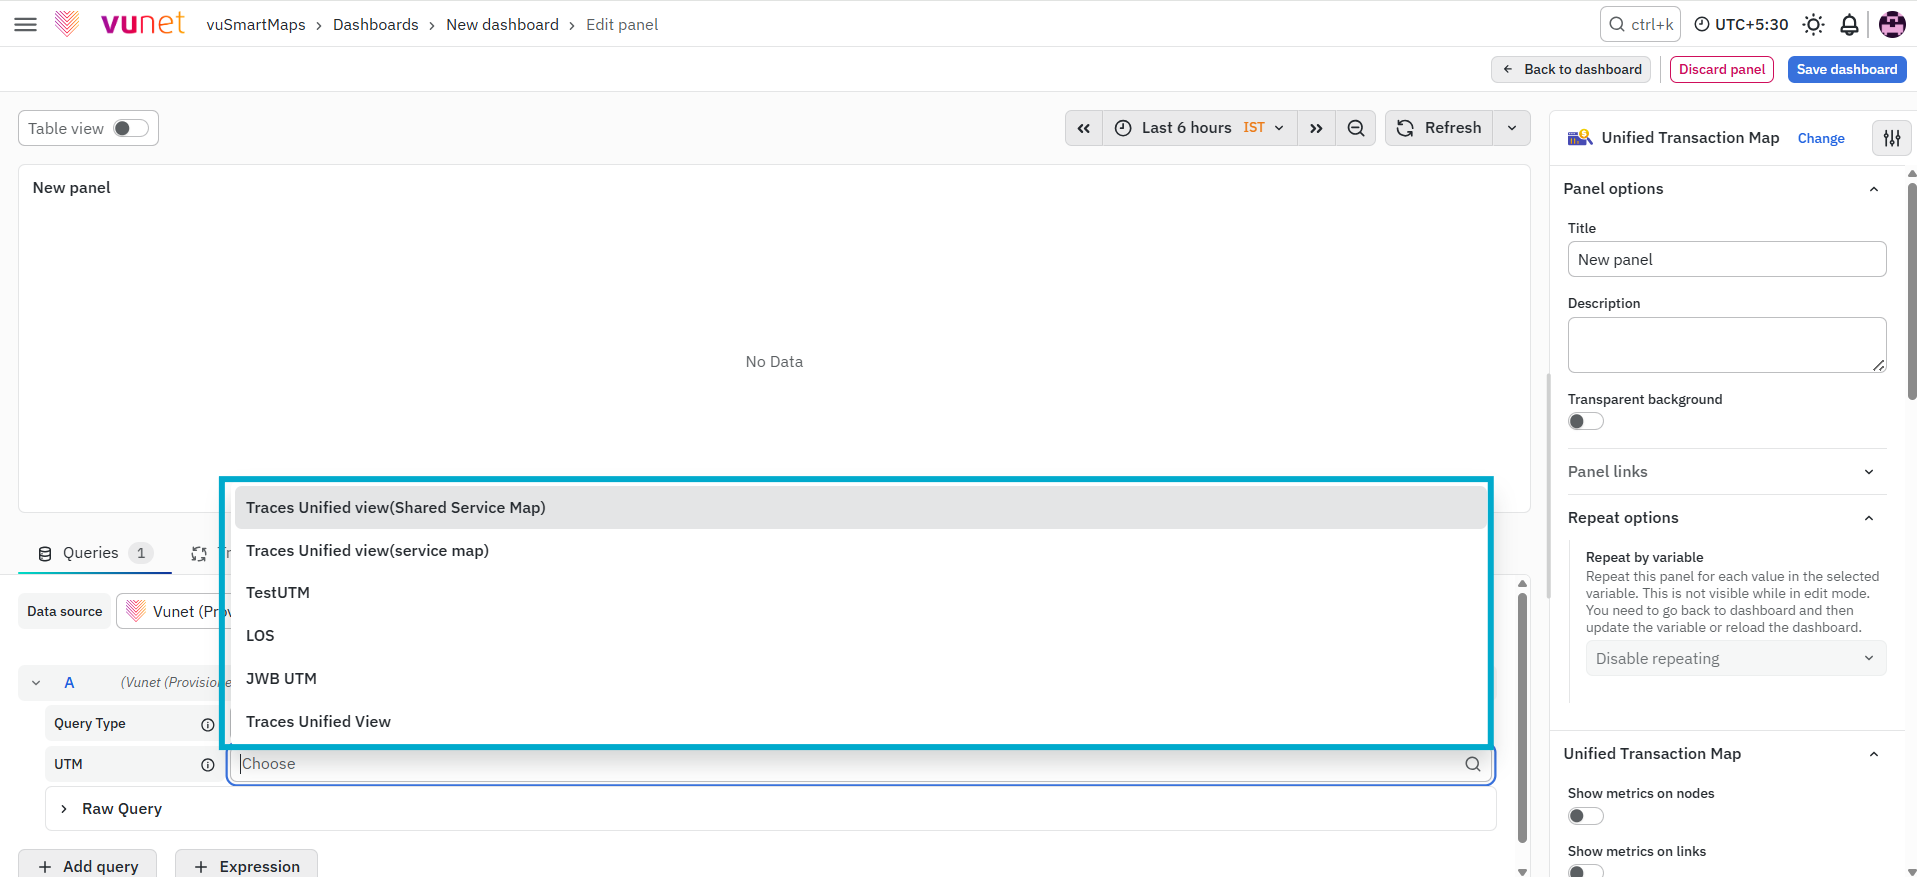
Now, simply select one of the pre-configured UTM configurations.
Visualization Options
Panel Options
You have several ways to tweak your panel. Let's start with Panel Options:
- Name and Description: Give your panel a Name and Description. I have taken CPU storage as an example here.
- The Description appears in the top left corner and can be seen by hovering over the i button.
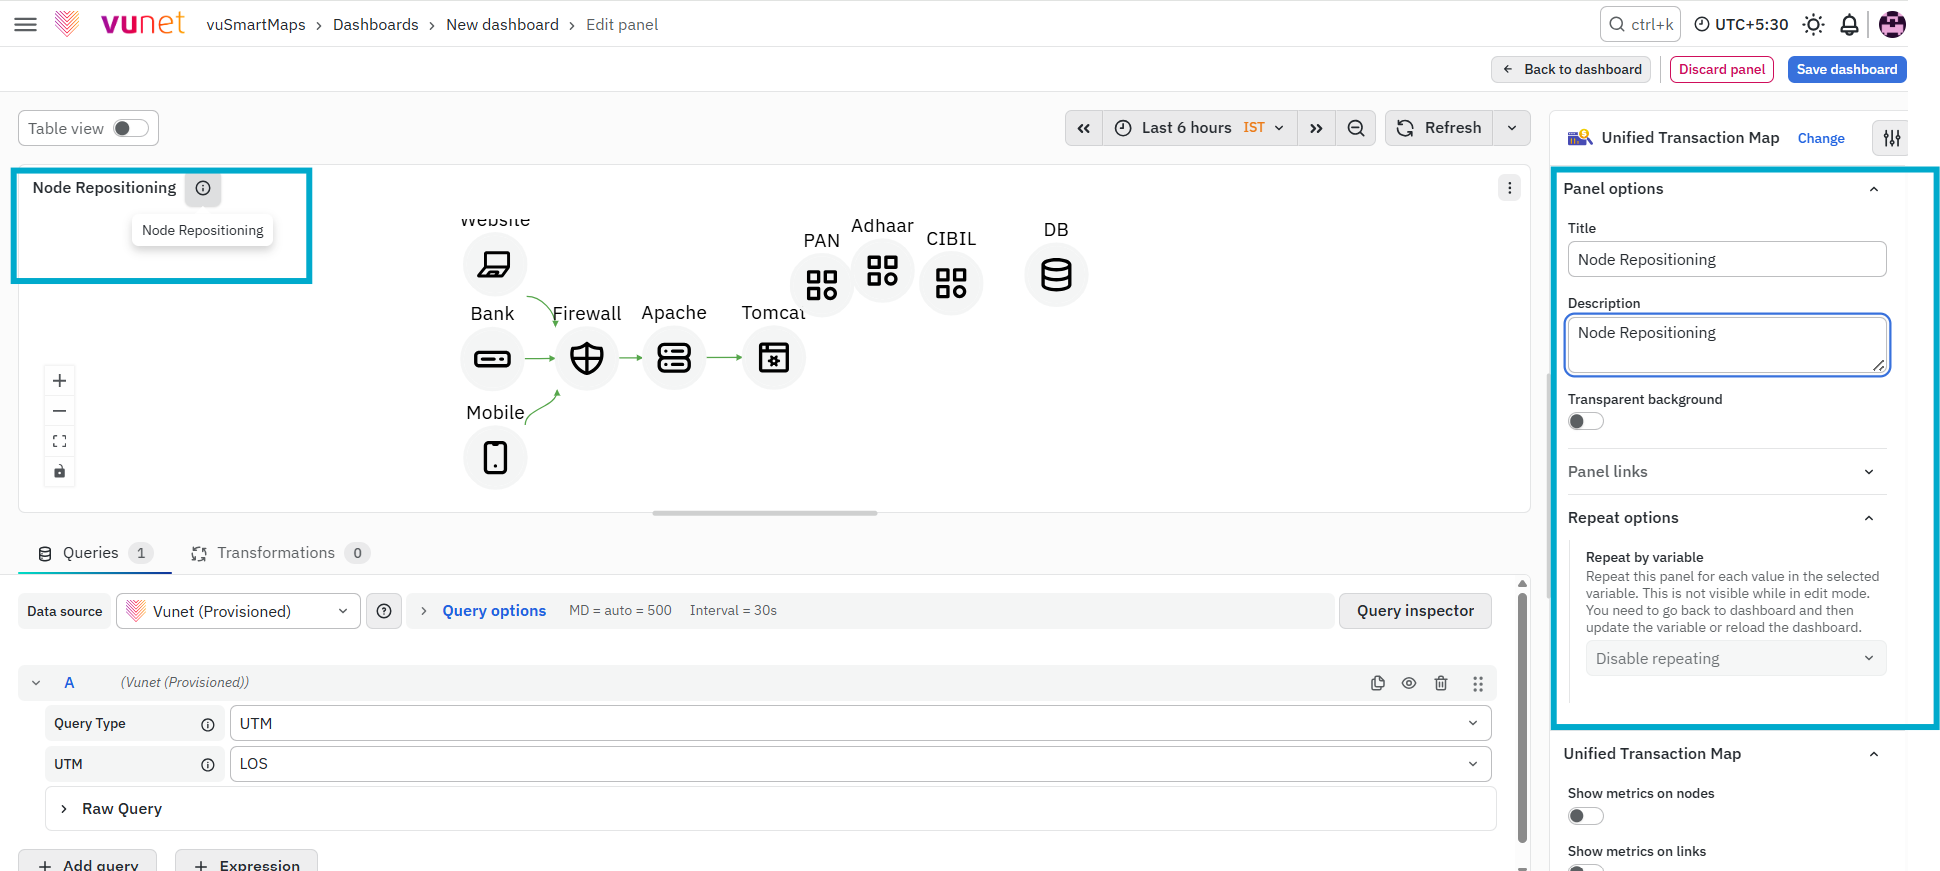
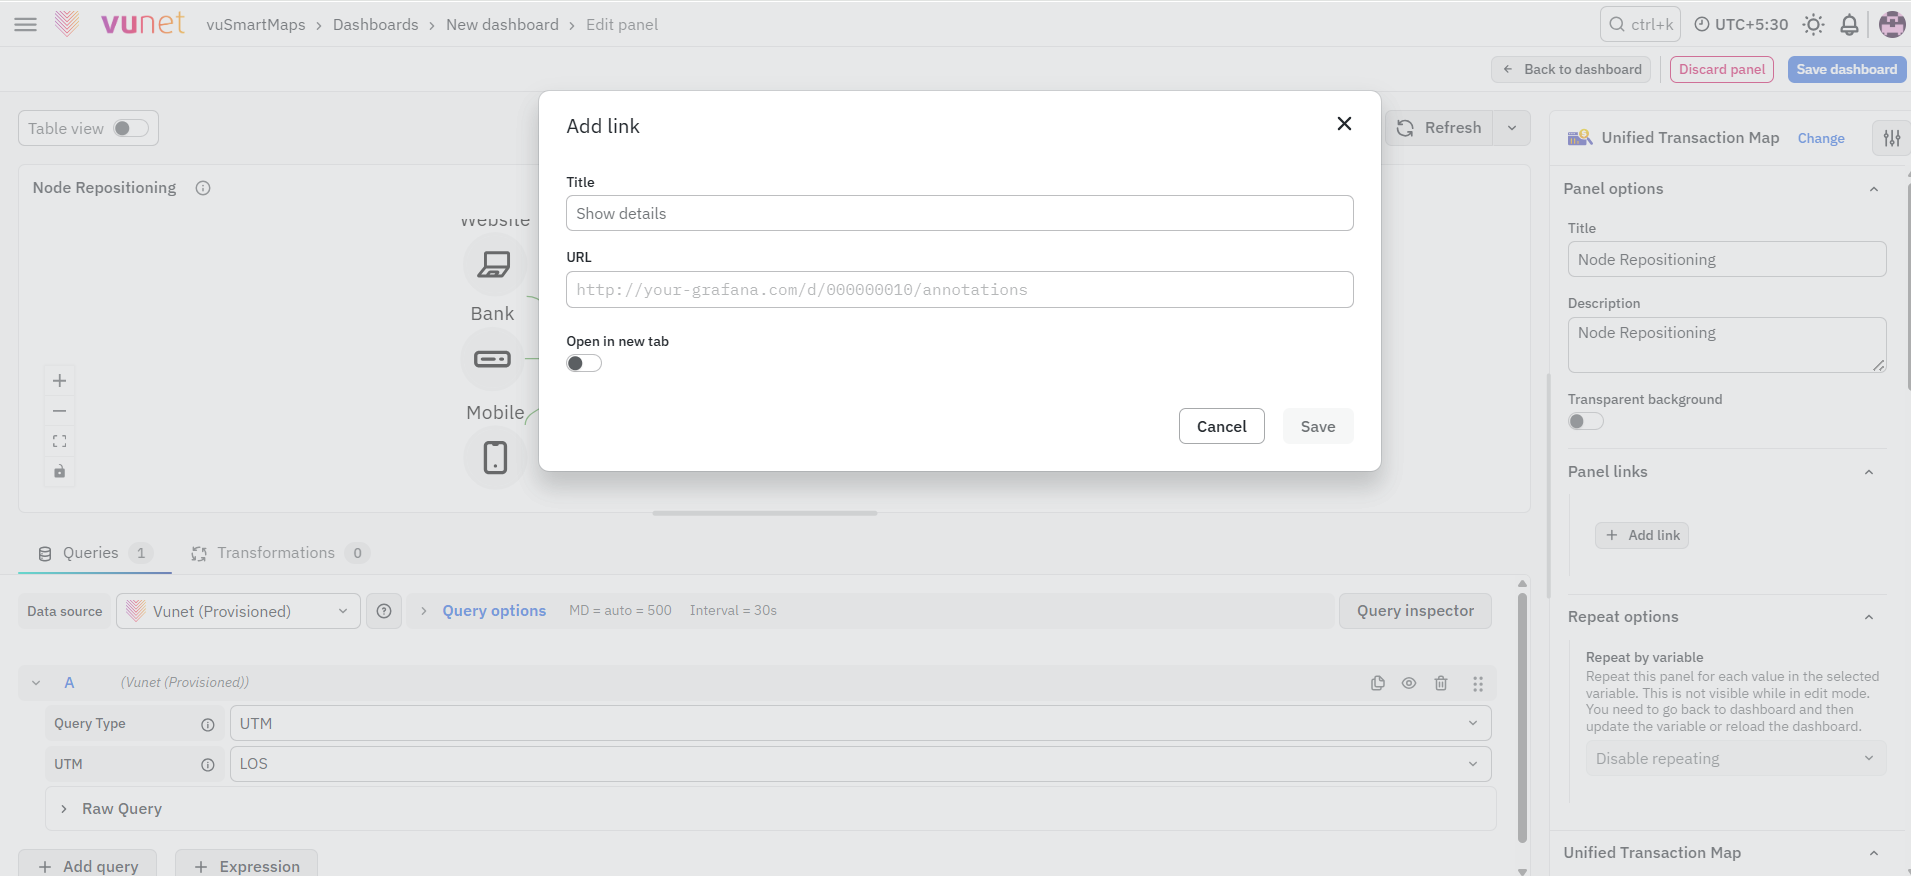
- Panel Link: Create a link to another website or dashboard. Provide a title, and URL, and choose to open it in a new tab if needed. Click Save.
- The URL can lead to another dashboard, offer support, or provide helpful information. If you want to compare with a default dashboard, just click the link to open it.
Unified Transaction Map
In the Unified Transaction Map settings, you can configure how your UTM looks and behaves:
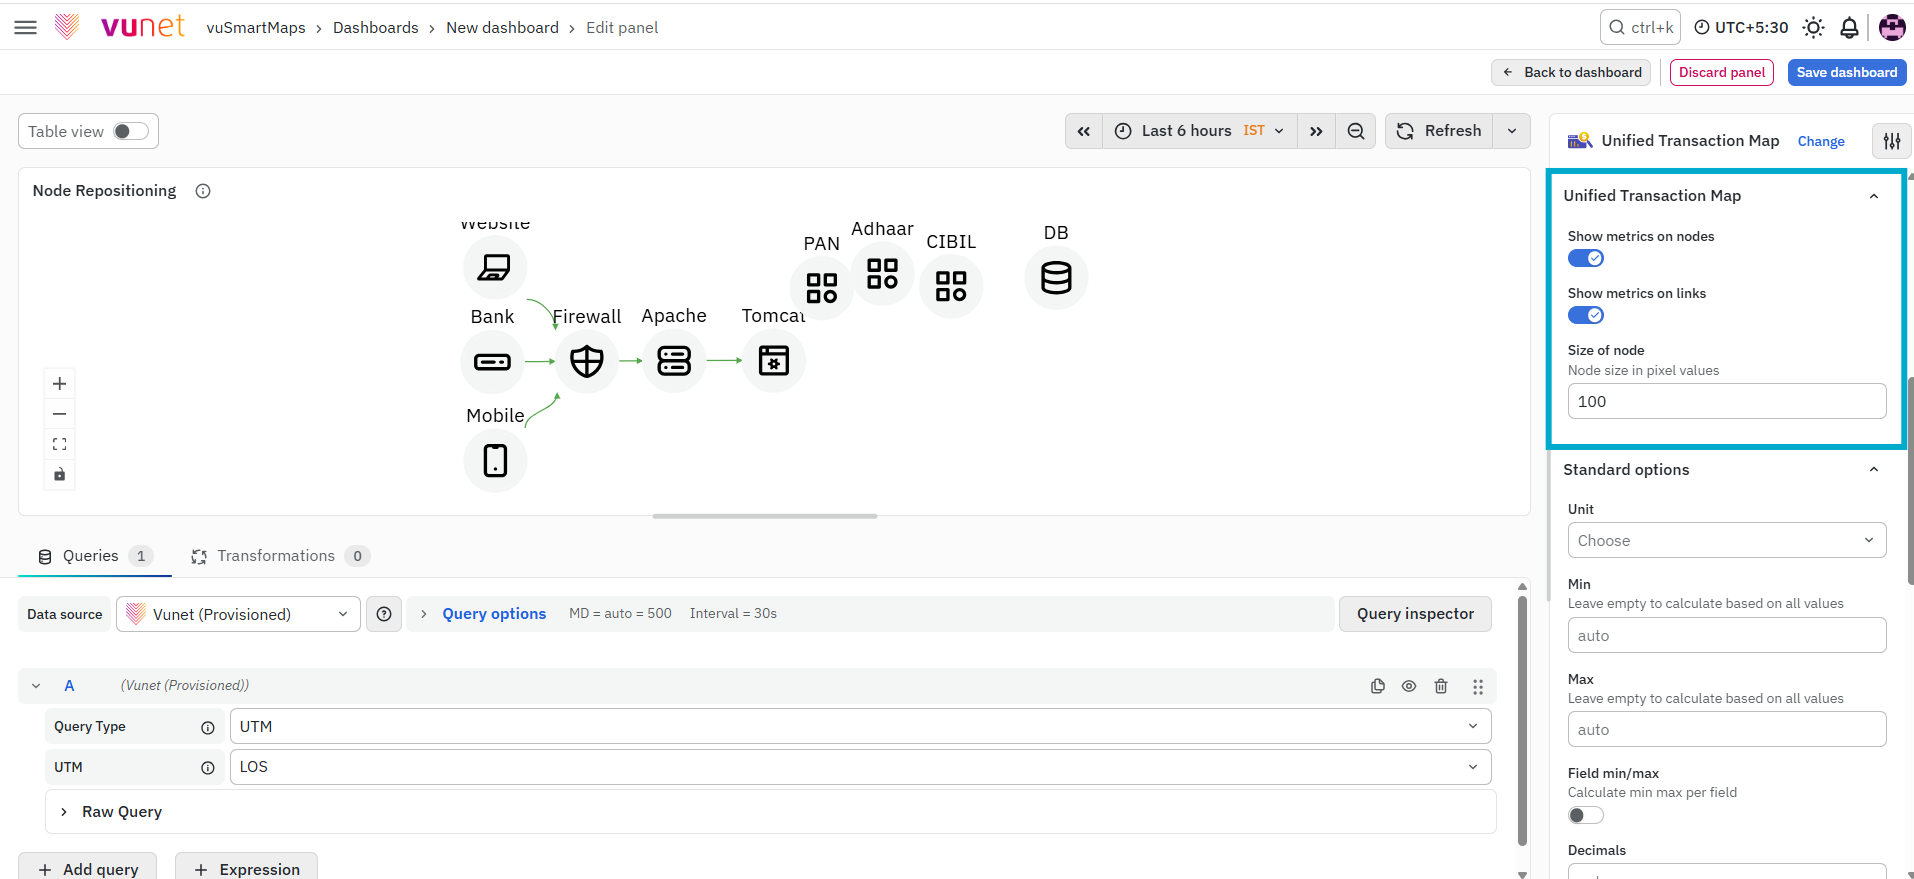
- Show Metrics on Nodes: This is disabled by default. Toggle to show or hide the metrics list under the nodes.
- Show Link Metrics: This is disabled by default. Toggle to show or hide the metrics list on the links.
- Node Size: Use the number input field to specify the pixel node size. The default is 100, with a minimum of 50 and a maximum of 250.
Standard Options
In the Standard Options, you can change how the panel looks. Here are the details:
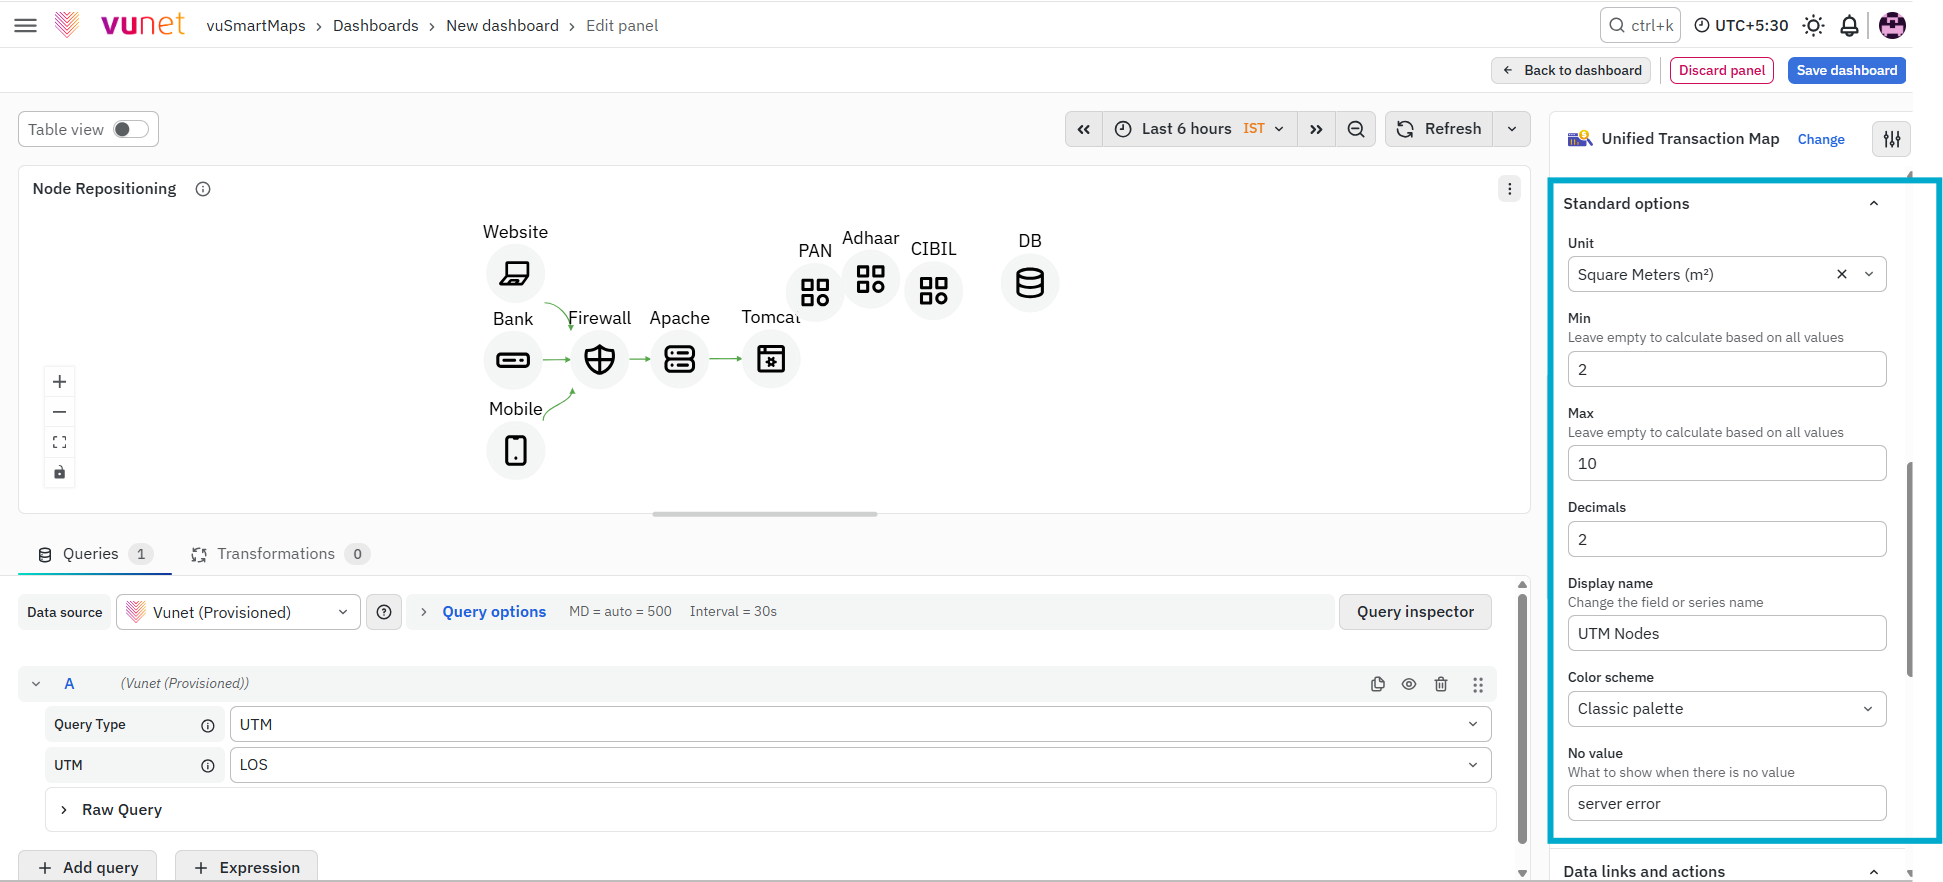
- Unit Type: Select the type of unit parameters.
- Minimum Value: Set the minimum value to be considered.
- Maximum Value: Define the maximum value to be considered.
- Decimal Places: Specify the total number of digits after the decimal point.
- Display Name: Choose the name to display for the series.
- Color Scheme: Pick a color scheme for the graph.
- No Value Display: Decide what to show when there is no value available.
Data Links & Actions
The Data Links option is similar to the Panel Link where you can link a URL and then open it in another tab. It is placed on the data instead of the Panel.
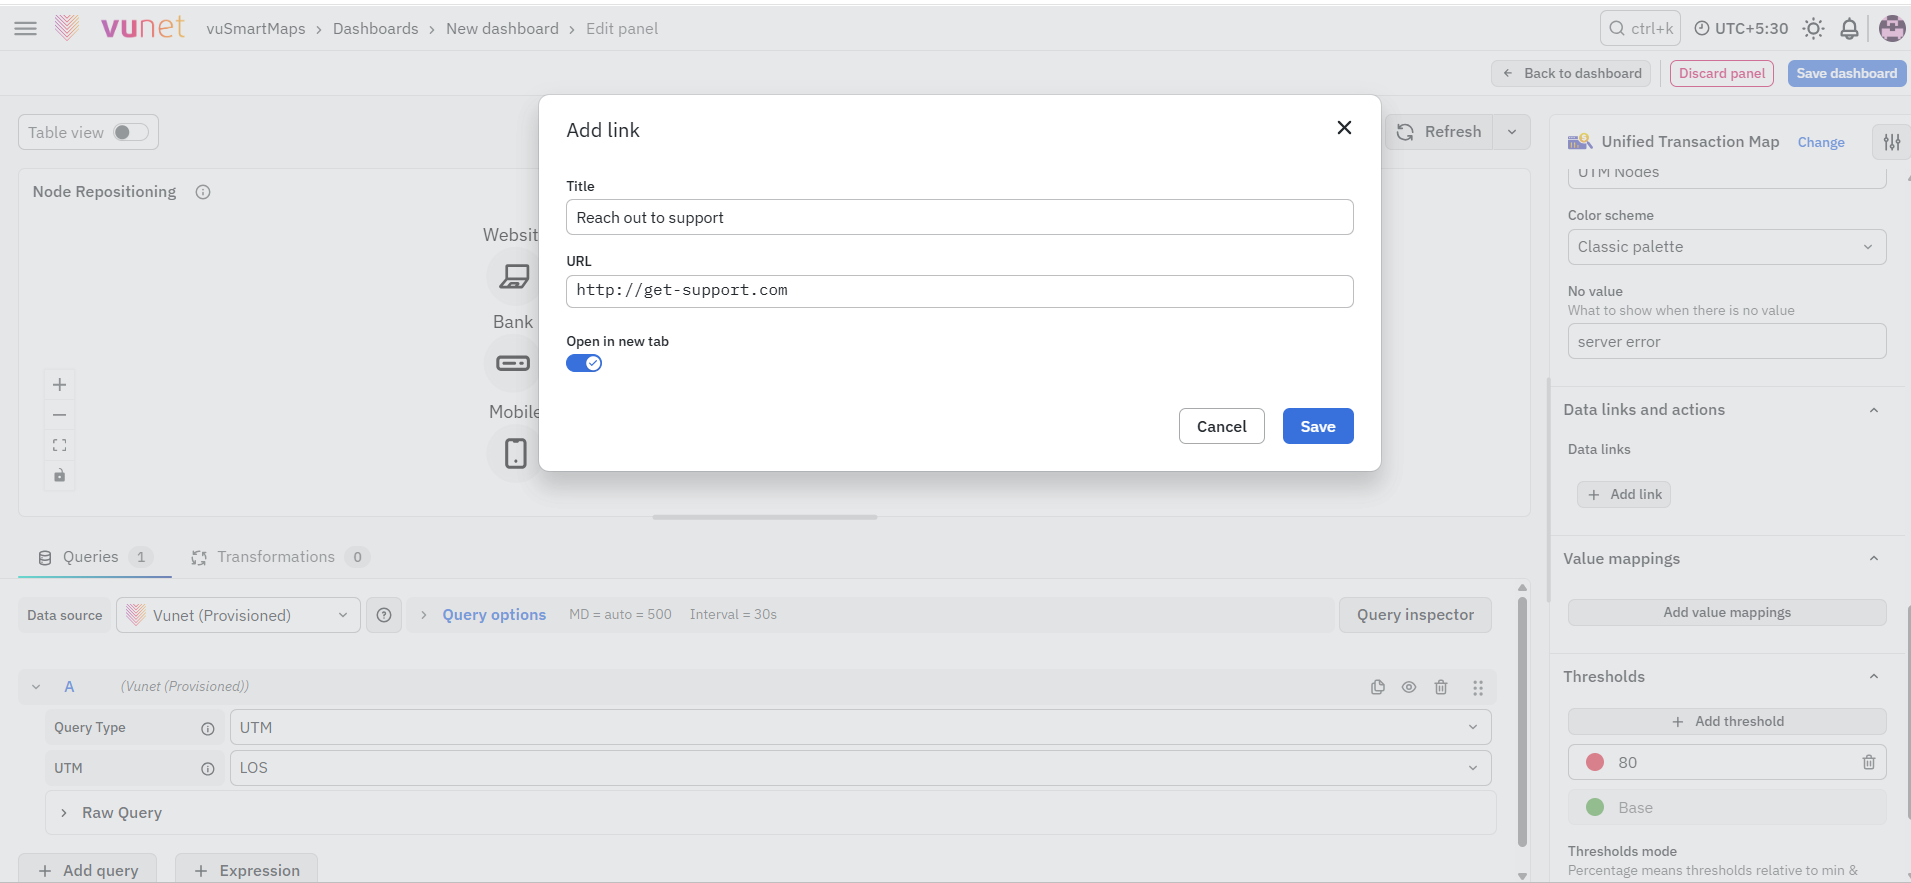
- Adding a Data Link: Click anywhere on the data, and the link option will pop up.
- Instant Access: It is a drill-down feature. click on it, to go to the destination dashboard.
Value Mappings
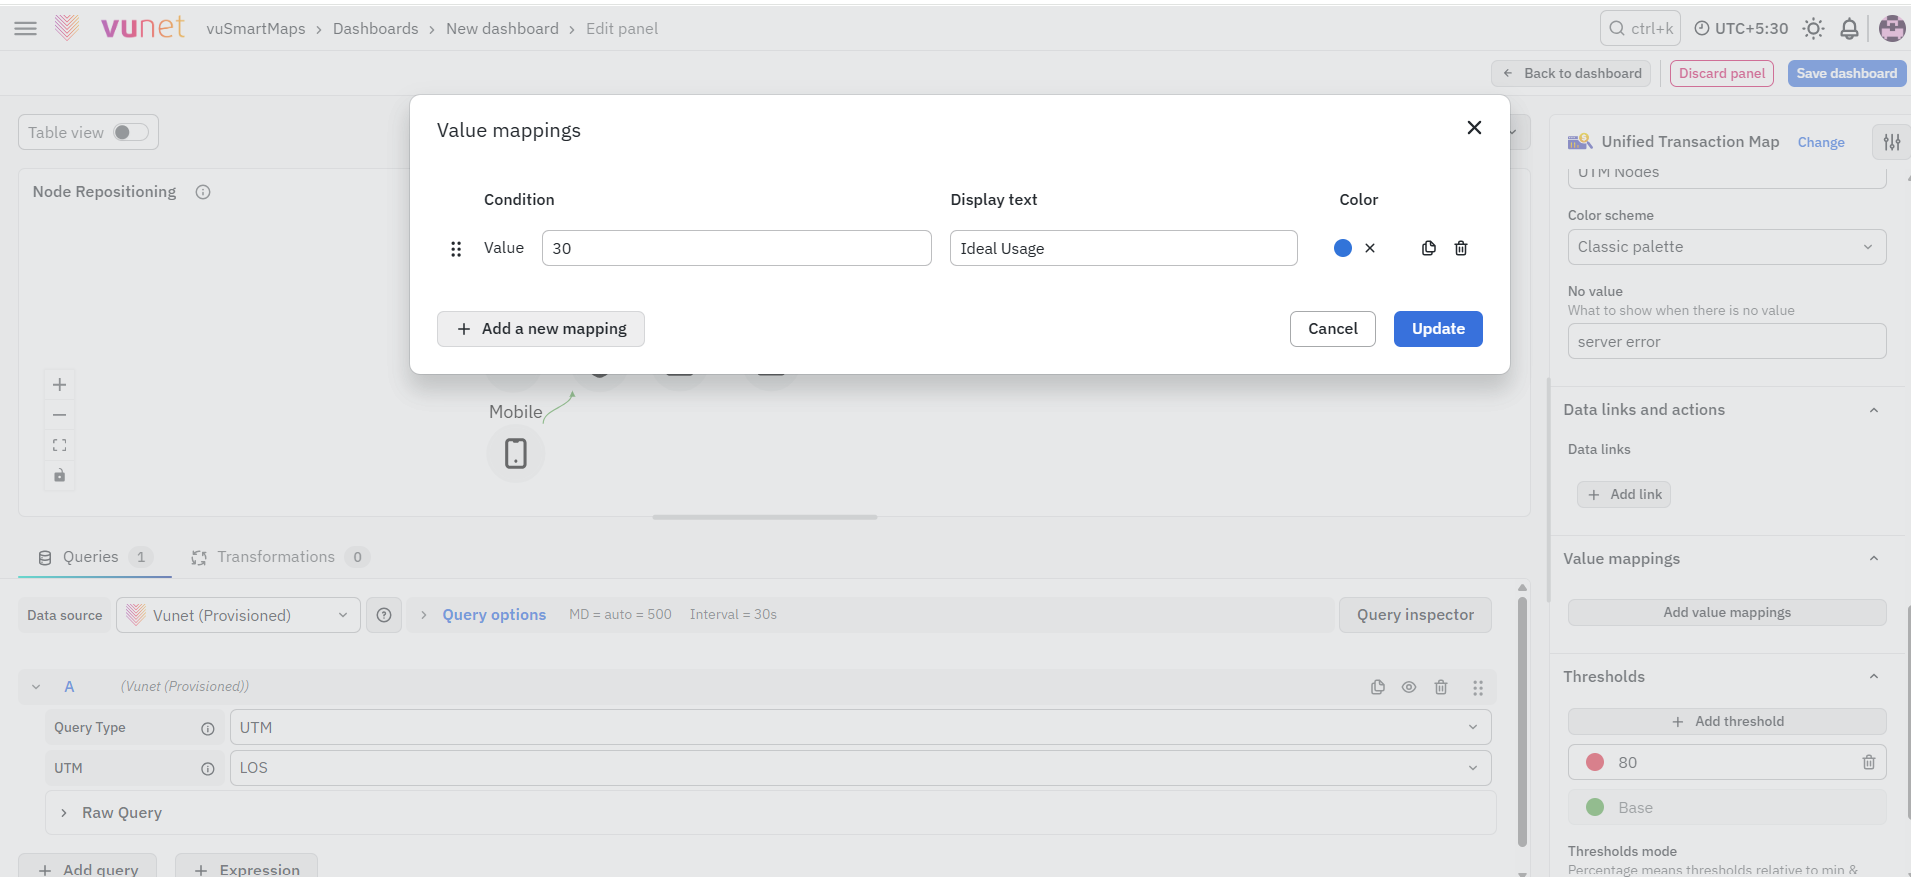
Value Mappings help you find a specific value in your data and replace it with custom display text. If there are similar values, they'll stand out with the chosen color.
Threshold
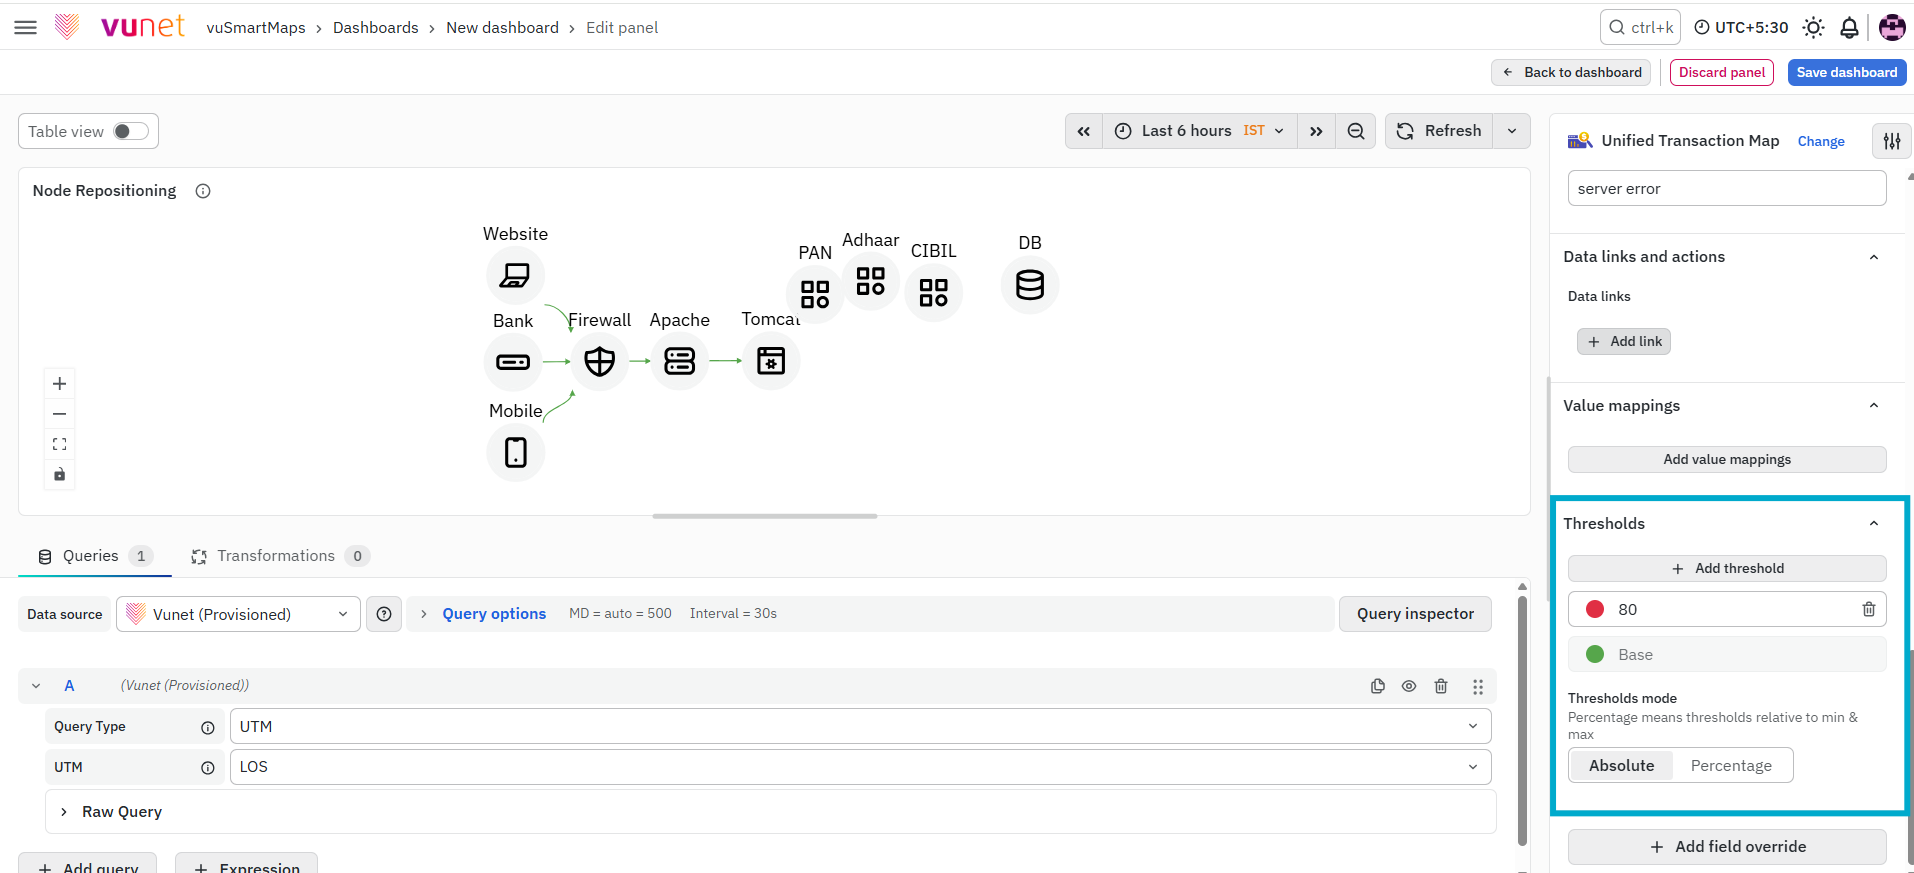
The Threshold option lets you establish value thresholds and assign colors to them. You have two ways to show thresholds:
- As Absolutes: Define specific values and their corresponding colors.
- As Percentages: Assign colors based on percentages. For instance, you can set CPU usage to be green at 0%, blue at 10%, yellow at 20%, red at 30%, and so on. This helps you quickly spot when values exceed thresholds, allowing for immediate action or error alerts.

Add Field Override
The "Add Field Override" option allows you to modify an existing field. Overrides let you tweak settings for specific fields.
The field options for overrides are just like those for a regular panel, but you choose which fields they apply to. Here's how:
- Click Add Field Override.
- Choose the Field Type based on:
- Name: Modify properties for a field with a specific name.
- Matching Regex: Modify properties for fields with names matching a regex pattern.
- Type: Modify properties for a specific type field (number, string, boolean).
- Query: Modify properties from the field for a specific query.

- Select the Field you want to modify.
- Choose the Override Property you want to adjust.
- Configure the Override Property according to your needs.
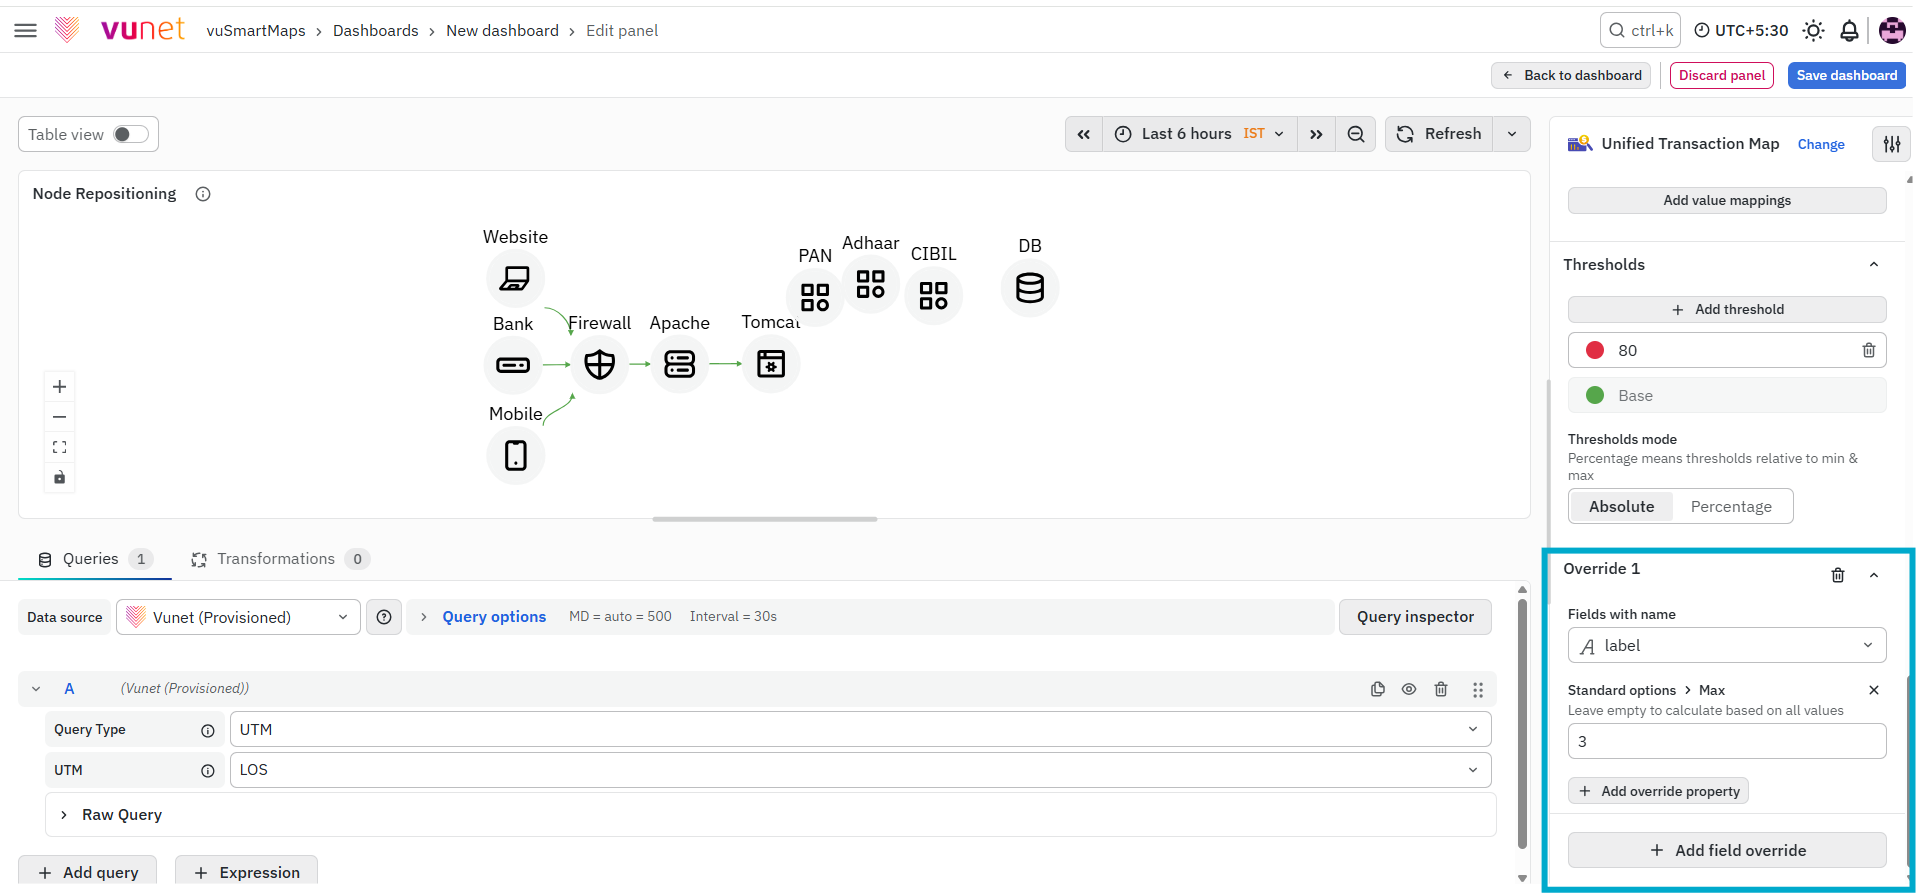
You can add multiple field overrides by repeating these steps.
Dashboard Filters for UTM
You've already learned how to create filters for your Dashboard. Now, you can apply these filters to your UTM visualizations. Here's how:
-
Open the Dashboard where you've created a filter. The filters appear at the top and show the default value you chose earlier.
-
To use a different variable, simply select it from the list.
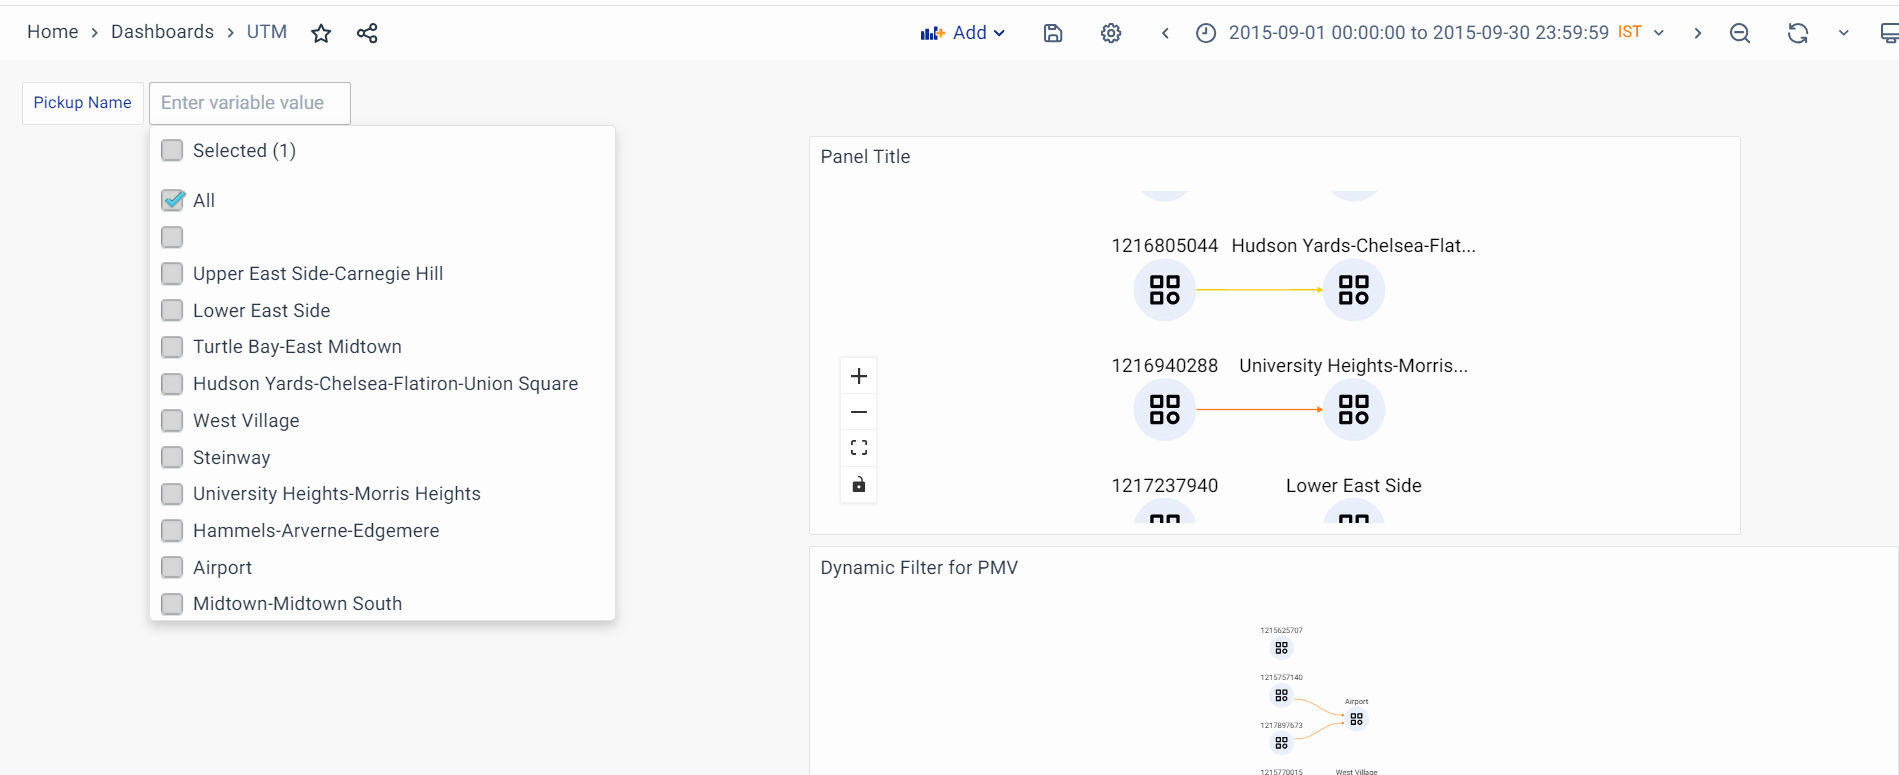
Notice that the filter values are applied, and the Dashboard now shows panels only for those selected values.
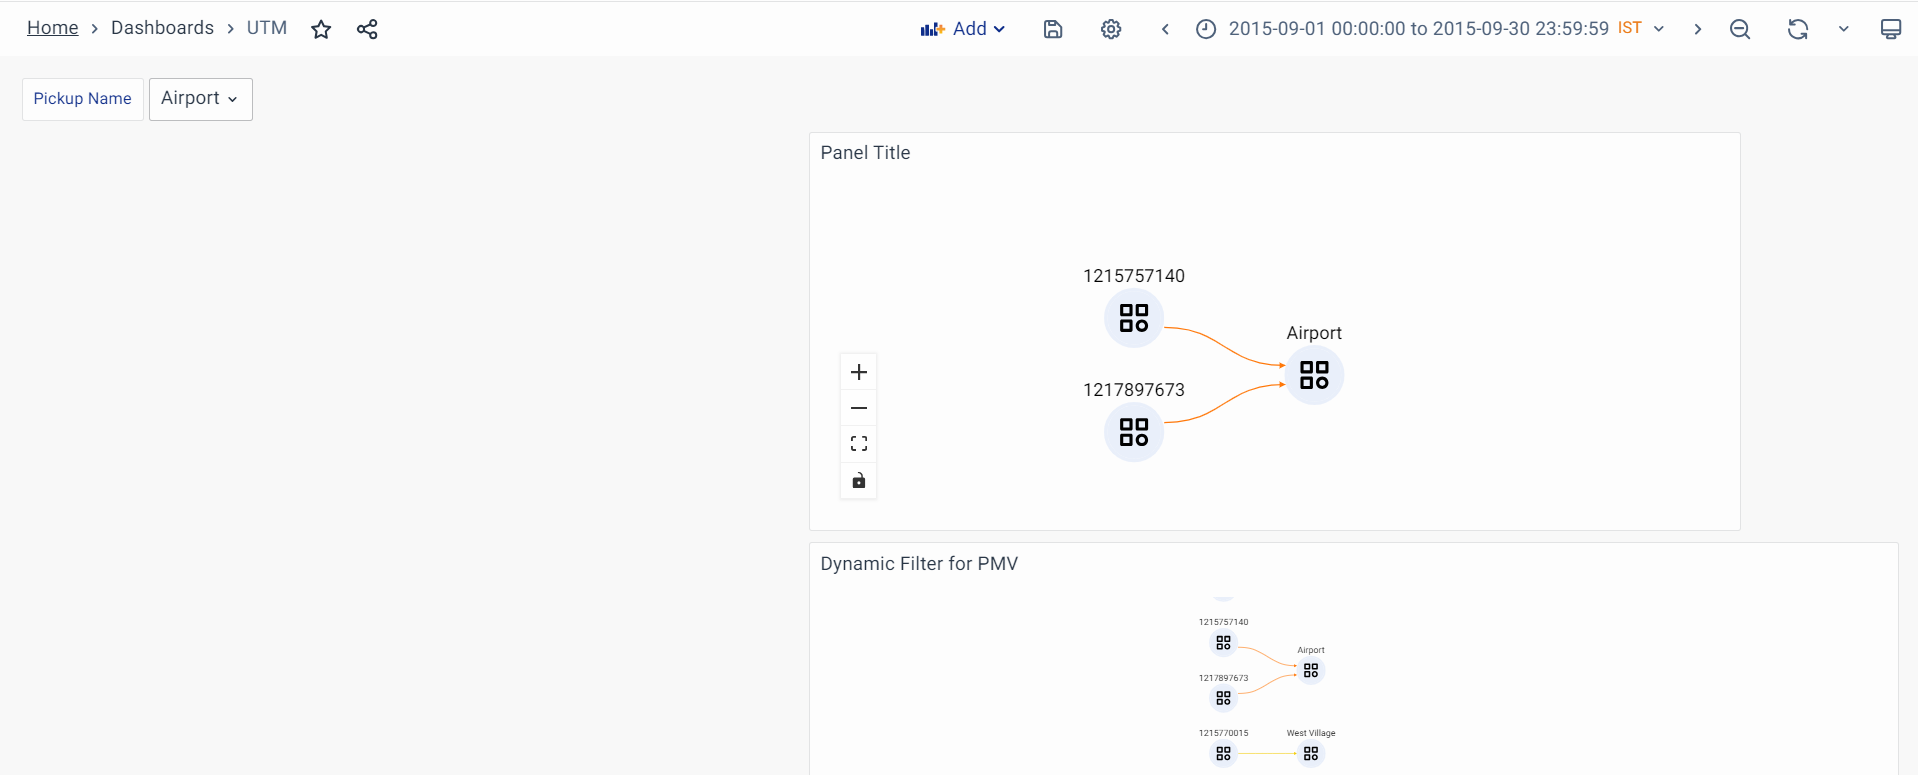
-
You can create additional filters for other values and repeat these steps.
What Happens After the Steps
After a UTM configuration is successfully created:
- The transaction map becomes available within UTM Studio.
- Graphs are generated using the selected Data Models.
- Nodes represent logical services, applications, devices, or business entities.
- Links display relationships and interactions between connected components.
- Metrics are displayed on nodes and links based on the configured Data Models.
- Transaction flows become visually accessible for operational analysis.
- Users can preview, edit, copy, and manage the UTM configuration.
- The UTM becomes available for dashboard visualization.
- Dashboard filters and visualization settings can be applied.
- Teams can use the UTM for monitoring, troubleshooting, and operational investigations.
Tips and Best Practices
- Design the transaction flow before creating nodes and links.
- Use meaningful names for graphs, nodes, links, and UTM configurations.
- Ensure the selected Data Models contain the required grouping fields and metrics.
- Configure appropriate icon types to improve map readability.
- Preview the UTM before saving to validate the transaction flow.
- Use Auto Align to organize complex transaction maps for better visualization.
- Display only the metrics required by operators to avoid visual clutter.
- Reuse existing UTM configurations by copying them instead of creating new ones from scratch.
- Configure object-level permissions to control access and modification rights.
- Regularly review and update transaction maps as application architectures evolve.
Troubleshooting
- Issue: UTM visualization is empty.
- Possible Cause: The selected Data Model does not contain supporting data.
- Solution: Verify that the selected Data Models contain data for the configured time range.
- Issue: Nodes are not displayed.
- Possible Cause: Node configuration is incomplete.
- Solution: Verify the node definitions, selected node types, and associated metrics.
- Issue: Links are not visible.
- Possible Cause: Link configuration issue.
- Solution: Verify the source node, destination node, and configured link metrics.
- Issue: Icons are not displayed.
- Possible Cause: Icon type mapping is missing.
- Solution: Verify that the
bucketname_typefield is configured correctly in the Data Model.
- Issue: Metrics are not displayed on nodes.
- Possible Cause: Metrics are not configured.
- Solution: Verify the Data Model metric definitions and ensure the required metrics are mapped to the nodes.
- Issue: Preview does not show the expected results.
- Possible Cause: Data query issue.
- Solution: Validate the Data Model queries, grouping fields, and metric configuration.
- Issue: UTM dashboard panel shows no data.
- Possible Cause: Incorrect UTM configuration is selected.
- Solution: Verify the dashboard panel configuration and select the correct UTM.
- Issue: Dashboard filters do not affect the UTM.
- Possible Cause: Dashboard filter variables are not mapped correctly.
- Solution: Verify the dashboard variable configuration and filter mapping.
- Issue: Auto Align does not organize nodes correctly.
- Possible Cause: Complex node relationships.
- Solution: Manually reposition the nodes and save the updated layout.
- Issue: Unable to save the UTM configuration.
- Possible Cause: Validation error or duplicate UTM name.
- Solution: Verify all required fields and provide a unique UTM name before saving.
- Issue: Data Model is not available in the dropdown.
- Possible Cause: Data Model is not configured properly.
- Solution: Verify that the Data Model has been created successfully and that you have permission to access it.
- Issue: Permission changes are not applied.
- Possible Cause: Permission assignment issue.
- Solution: Review the assigned roles and object-level permissions, then save the updated permission settings.
FAQs
How can I set up alerts for transaction failures or delays in UTM?
Configure thresholds for key metrics in the UTM panel to trigger alerts when values exceed defined limits. This helps in proactively managing issues before they impact business operations.
How do I add a UTM to a dashboard panel?
To add UTM to a dashboard:
- Go to Dashboards > Create or open a dashboard
- Click + Add Visualization
- Select VuNet (Provisioned) as the data source
- Choose Unified Transaction Map as the query type
- Select an existing UTM configuration from the dropdown
Can I link nodes or data points in the UTM to other dashboards?
Yes. Use the Data Links option in the UTM panel settings to configure clickable links on nodes or metrics. These can lead to dashboards, documentation, or external URLs.
What are Panel Options in UTM Visualization?
Panel Options let you configure the name, description, links, and appearance of the UTM panel. You can define size, toggle metric visibility, and align layout directions for better viewing.
Can I apply dashboard-level filters to UTM panels?
Yes. UTM visualizations support dashboard filters. When a filter is applied (e.g., application name), the UTM panel only displays nodes and metrics matching the filter value.
