Dynamic Insights Visualization
The Dynamic Insights visualization enables users to create a custom, data-driven view using a built-in HTML editor. It is used to render HTML from the selected query data using a Mustache template. Dynamic Insights visualizations can be configured using the Query Builder and the Dynamic Insights Configuration section, which allow users to define the data model, metric configuration, aggregation fields, and custom HTML rendering logic.
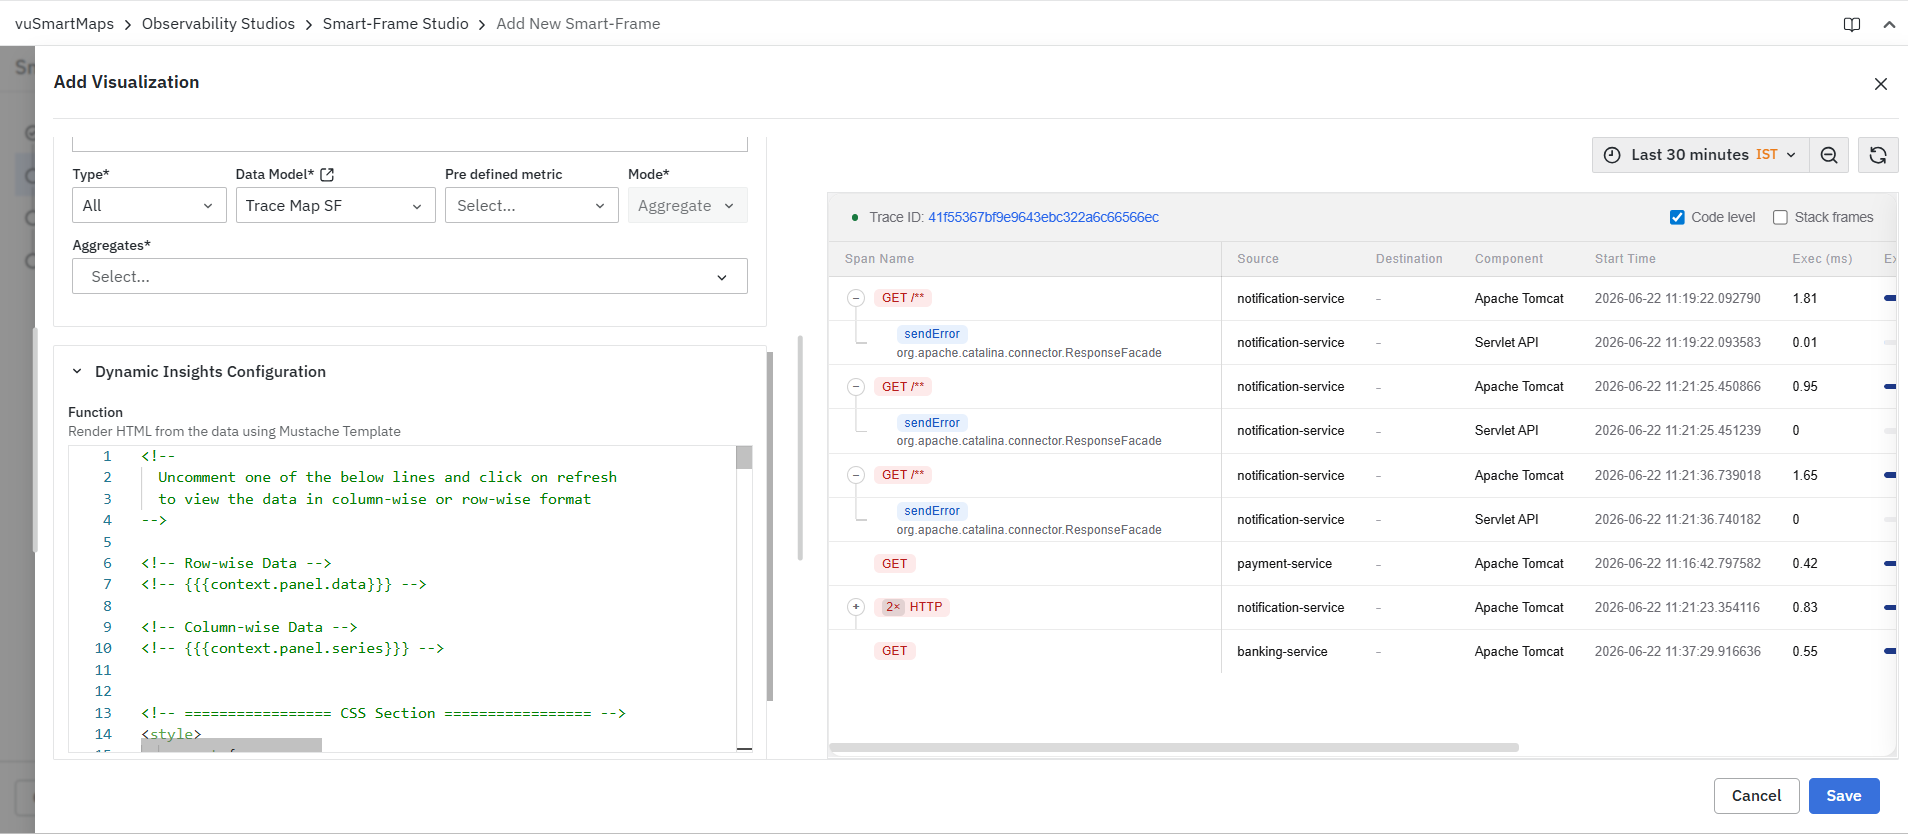
Creating a Dynamic Insights Visualization
To create a Dynamic Insights visualization:
-
Select Dynamic Insights from the Visualization Type drop-down.
-
Configure the query using the Query Builder.
-
Review the generated query summary.
-
Configure the HTML output using the Dynamic Insights Configuration section.
-
Validate the results in the Preview panel.
-
Configure optional interactions if required.
-
Click Save.
Query Configuration
Dynamic Insights visualizations use the standard Query Builder framework available in Smart-Frame Studio. The Query Builder allows you to:
-
Select the visualization type.
-
Choose a data model.
-
Select a pre-defined metric.
-
Configure the mode.
-
Configure aggregations.
-
Review query summaries before execution.

For detailed information about all Query Builder fields and configuration options, see Query Builder.
Preview Panel
The Preview Panel displays the output generated by the configured query and Dynamic Insights configuration. As configuration changes are applied and refreshed, the preview reflects the latest HTML output based on the selected query settings.
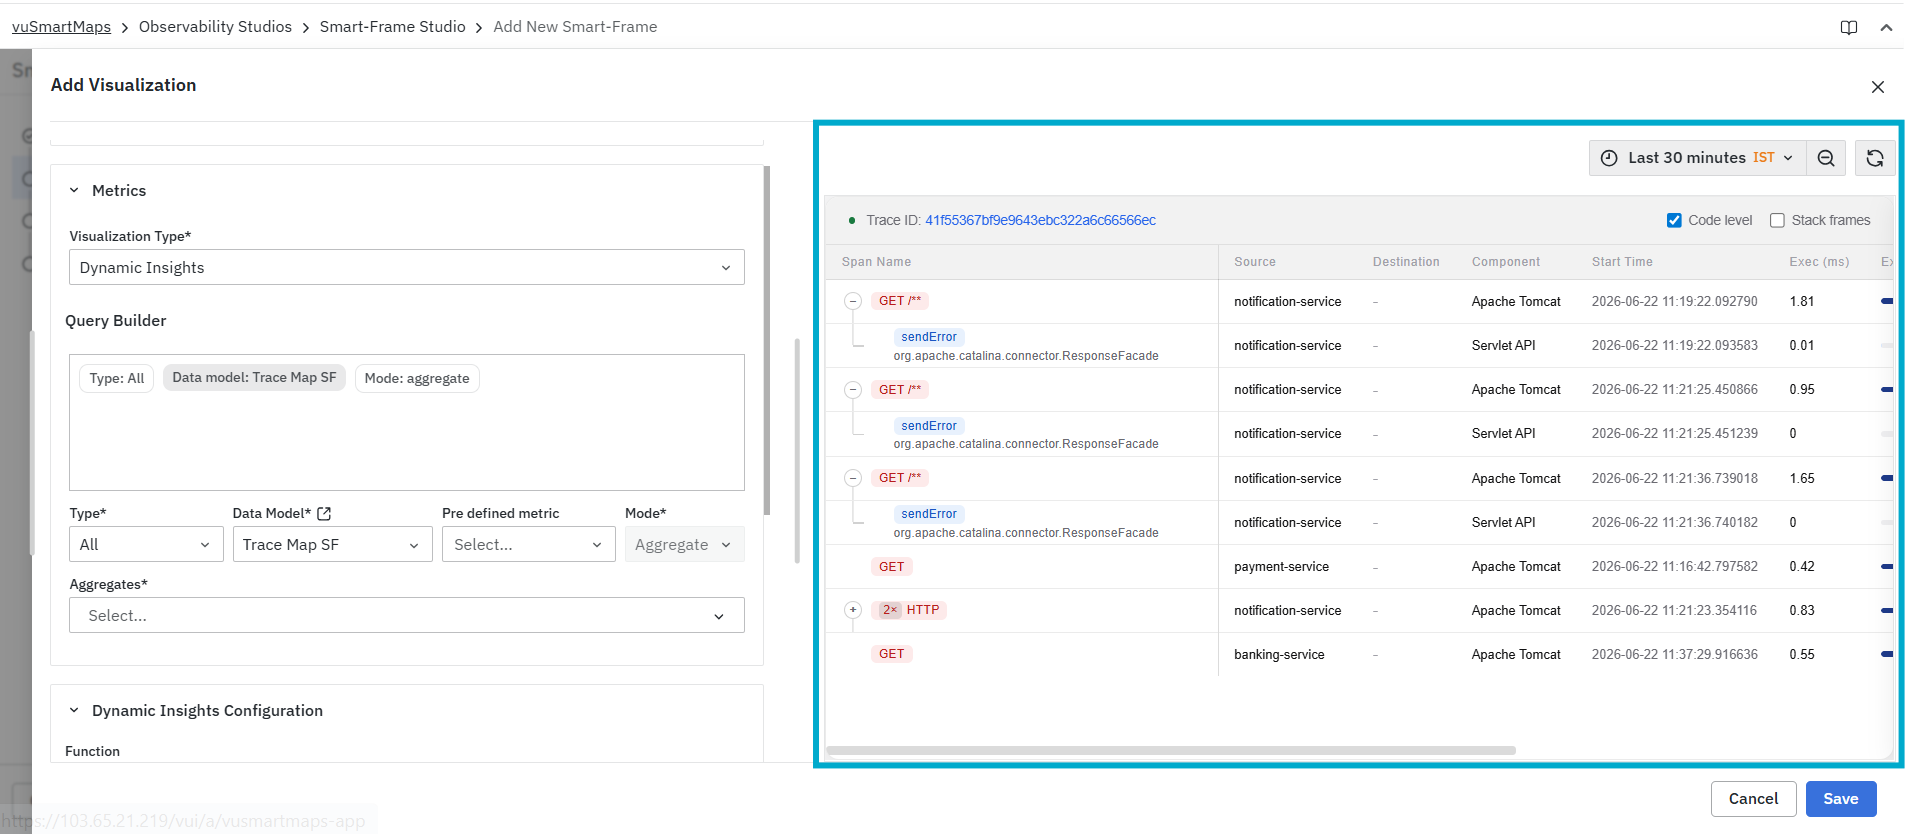
The preview can be used to:
-
Validate query results.
-
Review the rendered Dynamic Insights output.
-
Confirm that the selected data model and metric configuration are returning the expected data.
-
Verify whether the output is displayed in row-wise or column-wise format.
-
Review the visualization before saving it.
The preview also includes options such as Code level and Stack frames, which control the trace detail displayed in the preview output. If no data is returned, the preview displays a No Data message.
Dynamic Insights-Specific Characteristics
Dynamic Insights visualizations are designed to display:
-
Custom HTML-based output.
-
Data-driven insights rendered from query results.
-
Row-wise or column-wise data using Mustache template variables.
-
Flexible layout and formatting through HTML and CSS.
-
Output generated from the selected Query Builder configuration.
Common use cases include:
-
Rendering trace or metric data in a custom layout.
-
Reviewing query output in row-wise or column-wise format.
-
Creating custom insight views using HTML templates.
-
Validating how query data is structured before saving the Smart Frame visualization.
Dynamic Insights Configuration
The Dynamic Insights Configuration section is used to define the HTML template required for rendering the Dynamic Insights output. The Function editor renders HTML from the data using a Mustache template. The editor includes commented sample lines that can be used to view the data in either row-wise or column-wise format. Users can uncomment one of the provided lines and click refresh to view the data output.

For row-wise data, users can uncomment the context.panel.data line. For column-wise data, users can uncomment the context.panel.series line. Only one format should be enabled at a time while validating the data structure. This helps users understand how the query output is available before writing or modifying the HTML template. The configuration also includes a CSS section, which can be used to define styling for the rendered HTML output.
FAQs
What is a Dynamic Insights visualization?
A Dynamic Insights visualization creates a custom, data-driven view by rendering query results using HTML templates with Mustache variables.
How do I create a Dynamic Insights visualization?
Select Dynamic Insights, configure the query using Query Builder, review the query summary, configure the HTML output, validate the results in the Preview panel, optionally configure interactions, and click Save.
What can I configure using the Query Builder?
The Query Builder allows you to select the visualization type and data model, choose a pre-defined metric, configure the mode and aggregations, and review the query summary before execution.
What can I use the Preview Panel for?
The Preview Panel allows you to validate query results, review the rendered output, confirm the selected data and metric configuration, verify row-wise or column-wise formats, and review the visualization before saving.
How can I configure the Dynamic Insights HTML output?
Use the Dynamic Insights Configuration section to define the HTML template. You can use context.panel.data for row-wise data or context.panel.series for column-wise data, and use the CSS section to style the rendered HTML output.
