Creating a New Report
Step-by-Step Instructions

Create a New Report
Open Create New Report
- Navigate to Observability Studios > Report Studio.
- Click + Create New Report.
- The Create Report page opens.
Step 1: Enter Basic Details

Enter the following details:
- Name of the Report
- Description — optional
Click Next.
Step 2: Manage Report Contents

Select one source for the report. Available sources:
- Dashboard
- Data Source
- Data Model
Only one source can be chosen at a time for generating reports.
Create Report Using Dashboard

- Select Dashboard as the report source.
- Select the required dashboard by ticking the checkbox beside its name.
- The selected dashboard appears in the Sort Dashboard section.
- Arrange the order of selected dashboards as required.
- Set the required Time Filter.
- Click Download if an instant report is required from the UI.
- Continue to scheduling and distribution.
Users can select up to 3 dashboards at once. To replace a selected dashboard, click Delete in the Sort Dashboard section and select another dashboard.
Create Report Using Data Source
Before selecting the data source, select the database.
Supported data sources include:
| Database | Supported Query Types |
|---|---|
| ES | NoSQL DSL query, NoSQL Timelion query |
| PSQL | Internal Storage SQL query, Long-Term Storage SQL query |
| Hyperscale | SQL query |

ES Database: NoSQL Timelion Query

- Select ES database.
- Select NoSQL Timelion Query.
- Provide the ES Timelion query in the ES Query field.
- Choose a column filter to select columns for the generated report.

- Select the report type:
- Table
- Chart
- Both
- If Chart is selected, choose the chart type:
- Line Chart
- Vertical Bar Chart
- Area Chart
- Select the fields for the X-axis and Y-axis.

- Click Apply to display the report preview.

Only numerical values are available under the Y-axis.

ES Database: NoSQL DSL Query

- Select ES database.
- Select NoSQL DSL Query.
- Provide the NoSQL query.
- Provide the respective index for the query.

- Choose a column filter.
- Select the report type:
- Table
- Chart
- Both
- If Chart is selected, choose the chart type:
- Line Chart
- Vertical Bar Chart
- Area Chart
- Select the fields for the X-axis and Y-axis.
- Click Apply to display the report preview.

The annexure includes sample Elasticsearch queries.
PSQL Database: Long-Term Storage SQL Query
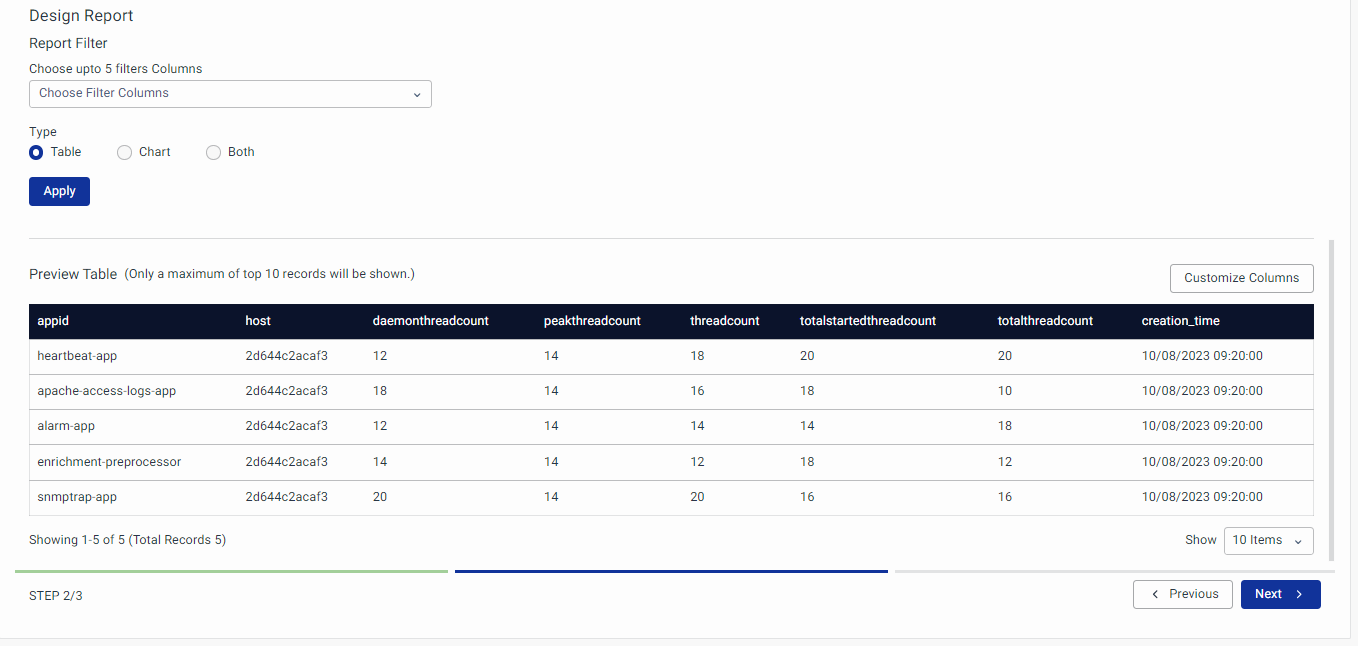
- Select PSQL database.
- Select Long-Term Storage SQL Query.
- Provide the long-term data store query.
- Choose a column filter.
- Select the report type:
- Table
- Chart
- Both
- If Chart is selected, choose the chart type:
- Line Chart
- Vertical Bar Chart
- Area Chart
- Select the X-axis and Y-axis fields.
- Click Apply to display the report preview.
The annexure includes sample long-term storage queries.
PSQL Database: Internal Storage SQL Query

- Select PSQL database.
- Select Internal Storage SQL Query.
- Provide the MySQL query.
- Choose a column filter.
- Select the report type:
- Table
- Chart
- Both
- If Chart is selected, choose the chart type:
- Line Chart
- Vertical Bar Chart
- Area Chart
- Select the X-axis and Y-axis fields.
- Click Apply to display the report preview.
Hyperscale Database

- Select Hyperscale as the data store.
- Provide the SQL query.
- Choose a column filter.
- Select the report type:
- Table
- Chart
- Both
- If Chart is selected, choose the chart type:
- Line Chart
- Vertical Bar Chart
- Area Chart
- Select the X-axis and Y-axis fields.
- Click Apply to display the report preview.
Hyperscale provides the provision for creating reports using a data model query.
Data Summarization for Long-Term Data Storage

Users can generate reports based on:
- Raw data
- Daily data
- Hourly data
- Weekly data
Users need to write queries using the raw table name irrespective of the time period. If the query includes a time filter, the system identifies the table from which data must be fetched based on the selected time period.
Sample query:
select \* from rawdata where time\>='$start\_time' and time\<='$end\_time'
Create Report Using Data Model

- Select Data Model as the source.
- Select the required Data Model.
- Select the required Metric.
- Click Submit to preview the data.
Step 3: Schedule to Generate and Distribute

This step contains three collapsible sections:
- Manage Schedule
- Report Format
- Configure Distribution Channels
Manage Schedule
Use this section to configure report scheduling.
- Use the radio button to toggle scheduled reports.
- For one-time scheduling, select Schedule At time.
- For recurring reports, choose Recurring Schedule.
Report Format
Select the required format:
- CSV
The same report can be generated in both formats simultaneously.
CSV format cannot be used to generate reports for:
- Dashboard as a report
- Long-term data storage report using chart
Configure Distribution Channels

If Configure Distribution Channels is selected, an Email ID is mandatory. The available fields are:
- Email ID
- Email Groups — optional
- Email Subject — optional
- Email Description — optional
After completing all configurations, click Finish. The new report appears on the Report Studio page.
Analytics Reports Preferences

Analytics Reports Preferences allow users to choose how date fields appear in reports.
Default date format:
DD/MM/YYYY hh:mm:ss
Manage Existing Reports
Delete Report

Reports can be deleted from the Report Studio listing page.
- Select the report checkbox.
- Click Delete.
- Confirm the deletion in the confirmation window.
Multiple reports can be deleted together.
There are two report deletion cases:
- Deleting report templates from Report Studio.
- Deleting generated reports from the Generated Reports tab.
Enable Reports

- Select the report checkbox.
- Click Enable.
- The report becomes accessible for users to generate.
Multiple reports can be enabled together.
Disable Reports

- Select the report checkbox.
- Click Disable.
- Disabled reports are not available for users to generate.
Multiple reports can be disabled together.
View Report Configuration
- Click the clickable report name.
- The report configuration page opens in view-only mode.
Users can only view the report configuration from this page.
Preview and Generate
Users can preview and generate reports from Report Studio. For generation details, refer to the Generate On-Demand Report flow.
To view downloaded dashboards as intended, ensure User-Specific Views are set up. Refer to Identity and Access and RBAC User-Specific Views for configuration details.
Edit Report

- Click Edit under the Actions column.
- The report configuration page opens.
- Make the required changes at any step.
The top-right corner includes:
- Permissions
- Duplicate Report
Permissions

Object-level permissions control report access. Users with admin permission can edit and delete reports. Click Permissions to manage object-level permissions for reports.
Permission types:
| Permission | Description |
|---|---|
| View | Selected user can only view reports. |
| Modify | Selected user can modify and make changes to reports. |
| None | No permission is given. |
Duplicate Reports

Use Duplicate Report to create a copy of an existing report.
- Click Duplicate Report.
- A pop-up appears.
- By default, the duplicate report name is suffixed with
_copy. - Users can rename the report later.
- Click Save to create the copy.
Example:A duplicate of Datamodel is named Datamodel_copy.
Prevent Duplicate Report Generation: If report generation is already in progress, the user is notified that the same report cannot be generated again until the initial generation is successful.

What Happens After the Steps
After a report is created:
- The report appears in Report Studio.
- Users can generate the report if it is enabled.
- If scheduling is configured, the report is generated based on the selected schedule.
- If distribution channels are configured, the report is sent using the configured email details.
- Users can view, edit, delete, duplicate, enable, disable, or preview and generate the report based on permissions.
- Generated report outputs are available under Generated Reports in the Reports module.
Tips / Best Practices
- Use Report Studio for reusable report templates.
- Use Reports for on-demand generation and generated report access.
- Select only one source at a time while creating reports.
- Use dashboard reports when the report should be based on existing dashboards.
- Use Data Source reports when report content depends on queries.
- Use Data Model reports when the report should use a selected Data Model and Metric.
- Use column filters to control the columns displayed in generated reports.
- Use preview before scheduling or finishing report creation.
- Use object-level permissions to control view and modify access.
- Use duplicate reports when an existing report can be reused as a template.
- Enable only reports that should be available for users to generate.
Troubleshooting
-
Issue: Report is not available for users to generate.
- Possible Cause: The report may be disabled.
- Solution: Select the report checkbox in Report Studio and click Enable. Enabled reports become accessible for users to generate.
-
Issue: Users can generate an unwanted report.
- Possible Cause: The report may still be enabled.
- Solution: Select the report checkbox and click Disable. Disabled reports are not available for users to generate.
-
Issue: CSV format is not available for a report.
- Possible Cause: CSV format is not supported for Dashboard as a report or Long-term data storage report using chart.
- Solution: Use PDF format for these report types, or change the report configuration where CSV is supported.
-
Issue: Y-axis field is not available while creating a chart.
- Possible Cause: Only numerical values are available under the Y-axis.
- Solution: Select a numerical field for the Y-axis.
-
Issue: Report cannot be generated again.
- Possible Cause: The same report is already being generated.
- Solution: Wait until the current report generation is successful. The system prevents duplicate report generation while generation is in progress.
-
Issue: Dashboard report does not appear as expected after download.
- Possible Cause: User-Specific Views may not be configured.
- Solution: Ensure User-Specific Views are set up. Refer to User Management and RBAC User-Specific Views.
-
Issue: User cannot modify a report.
- Possible Cause: The user may not have Modify permission.
- Solution: Open Permissions and assign the required permission. Available permission types are View, Modify, and None.
FAQs
What is the difference between Reports and Report Studio?
Reports under Observability Hub > Reports is used to execute configured reports, generate on-demand reports, view generated reports, download reports, track failed reports, and delete generated report outputs.
Report Studio under Observability Studios > Report Studio is used to create, configure, schedule, enable, disable, edit, duplicate, delete, and manage report templates.
What types of reports are available in vuSmartMaps?
The Reports module provides pre-built reports covering key areas such as Application, Business Journey, Infrastructure Components, and Network Devices. Users can also create custom reports based on dashboards, data sources, or data models.
How can I generate an on-demand report?
Go to Observability Hub > Reports, open the Execute Reports tab, and click Preview and Generate Report under the Actions column. Select the report range, update the report name if required, choose the report format, optionally configure distribution channels, and click Generate.
The report is generated in the background and appears under the Generated Reports tab.
Where can I find generated reports?
All generated reports are available under the Generated Reports tab in Observability Hub > Reports. This tab shows the report name, status, applied filters, downloaded count, and available actions such as download and delete.
How can I check why a report failed?
Open the Generated Reports tab and click the Failed status for the report. A tracking information panel appears with details that help diagnose the cause of the failure.
Which report formats are supported?
Reports can be generated in PDF and/or CSV format. The same report can be generated in both formats simultaneously.
However, CSV cannot be used for Dashboard as a report or for Long-term data storage reports using chart.
What sources can be used to create a report in Report Studio?
Report Studio supports three report sources: Dashboard, Data Source, and Data Model. Only one source can be selected at a time while creating a report.
How many dashboards can be selected for a dashboard-based report?
Users can select up to 3 dashboards at once for generating reports. Selected dashboards appear in the Sort Dashboard section, where their order can be arranged.
To replace a selected dashboard, delete it from the Sort Dashboard section and select another dashboard.
What happens when a report is disabled?
A disabled report is not available for users to generate. To disable a report, select its checkbox in Report Studio and click Disable. Multiple reports can be disabled at the same time.
Can I duplicate an existing report?
Yes. Report Studio allows users to duplicate an existing report and use it as a template.
When a report is duplicated, the new report name is suffixed with _copy by default to maintain uniqueness. For example, a duplicated Datamodel report is named Datamodel_copy.
Users can rename the report later and click Save to create the copy.
