Failures
Failure Detection
The Failure Detection page in APM Studio allows you to define how APM identifies failed operations from incoming trace data. It helps ensure that failures are detected consistently by using rules based on status codes, exceptions, span errors, and other matching conditions, instead of relying only on default telemetry behavior.
In distributed applications, failures may not always be represented in the same way. Some failures are visible through protocol-level error signals such as HTTP 4xx/5xx or gRPC errors, while others may be reflected through exceptions, span status, or service-specific error patterns. The Failure Detection feature helps standardize this behavior by allowing you to configure rules that determine when a span or operation should be treated as failed.
This improves the accuracy of failure analysis across APM dashboards, trace views, service analytics, and troubleshooting workflows.
Failure Detection Rules
The Failure Detection Rules page is the central place where you configure how APM interprets failed operations.
The page is organized into two tabs:
- Custom: The Custom tab allows you to create your own failure detection rules. These rules are evaluated first and can be used to override the default behavior when your application requires more specific failure logic.
- Pre-built: The Pre-built tab displays the default failure detection rules provided by the platform. These rules are applied when no custom rule matches and help cover common protocol-level failure scenarios.
Failure Detection Page Overview
The Failure Detection page provides a structured view for managing both custom and default failure rules.
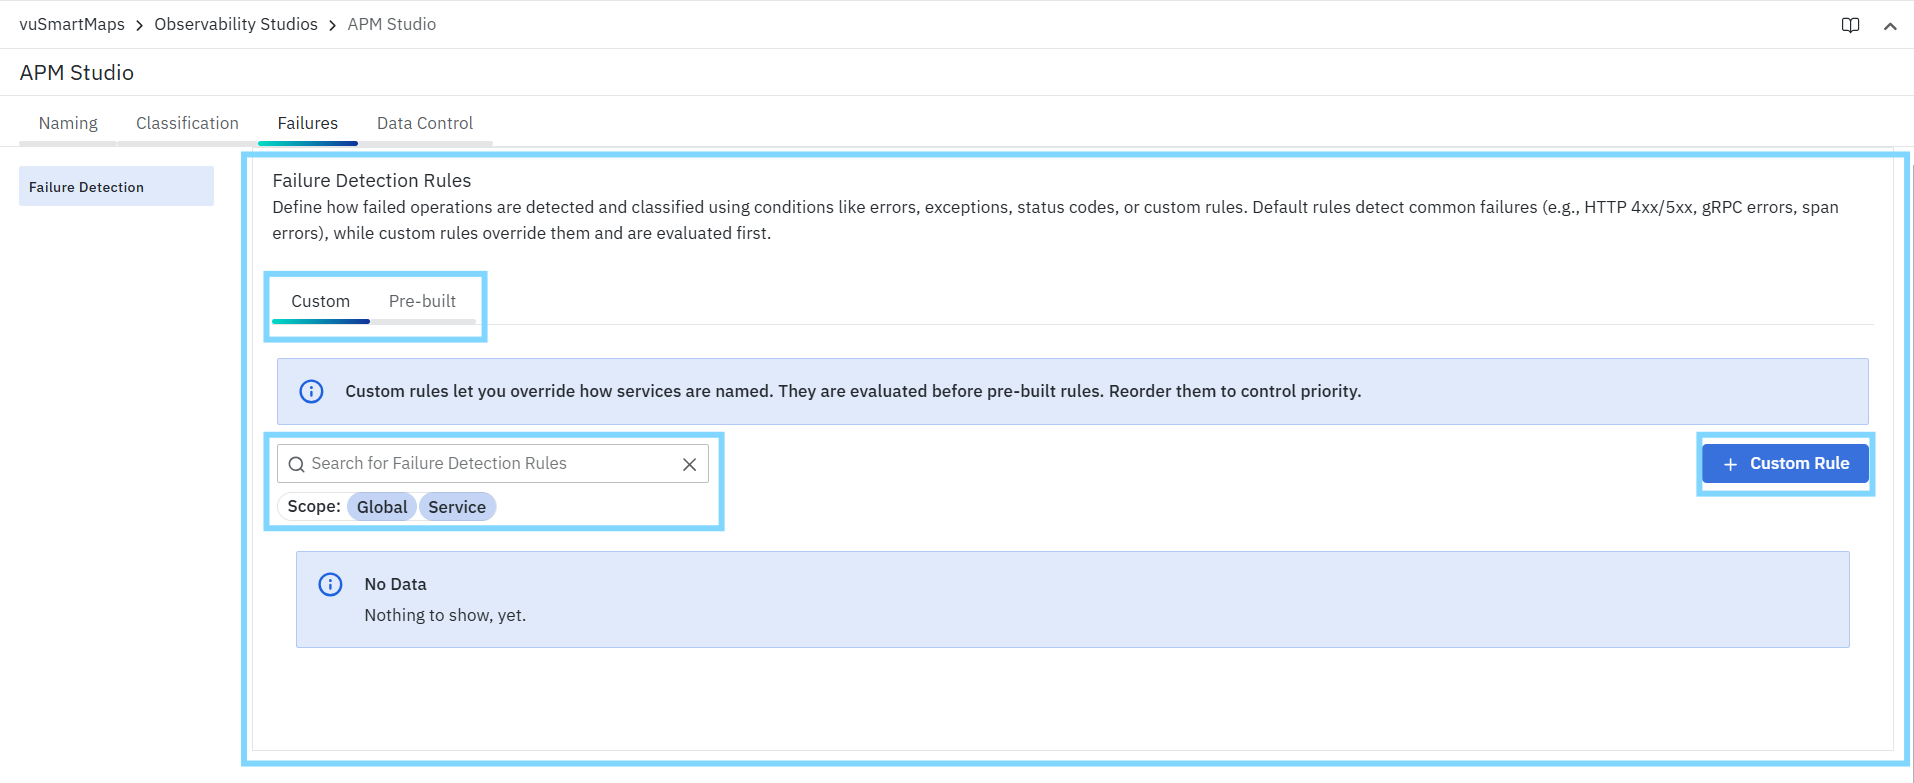
The page includes:
- Custom and Pre-built tabs
- A Search for Failure Detection Rules field
- Scope filter chips in the Custom tab
- A + Custom Rule button for creating new rules
- A multi-step side panel for adding a rule
- A list of default rules in the Pre-built tab
This layout makes it easy to review existing behavior, add new rules, and maintain consistent failure detection logic across your environment.
Search for Failure Detection Rules
Use the Search for Failure Detection Rules field to quickly find an existing custom or pre-built rule by name.

This is especially useful when:
- Multiple rules are configured
- You want to review a specific rule
- You need to update an existing rule
- You want to confirm whether a rule already exists before creating a new one
Filter by Scope
In the Custom tab, the page displays scope filters for:
- Global: Rules apply across all services.
- Service: Rules apply only to selected services.
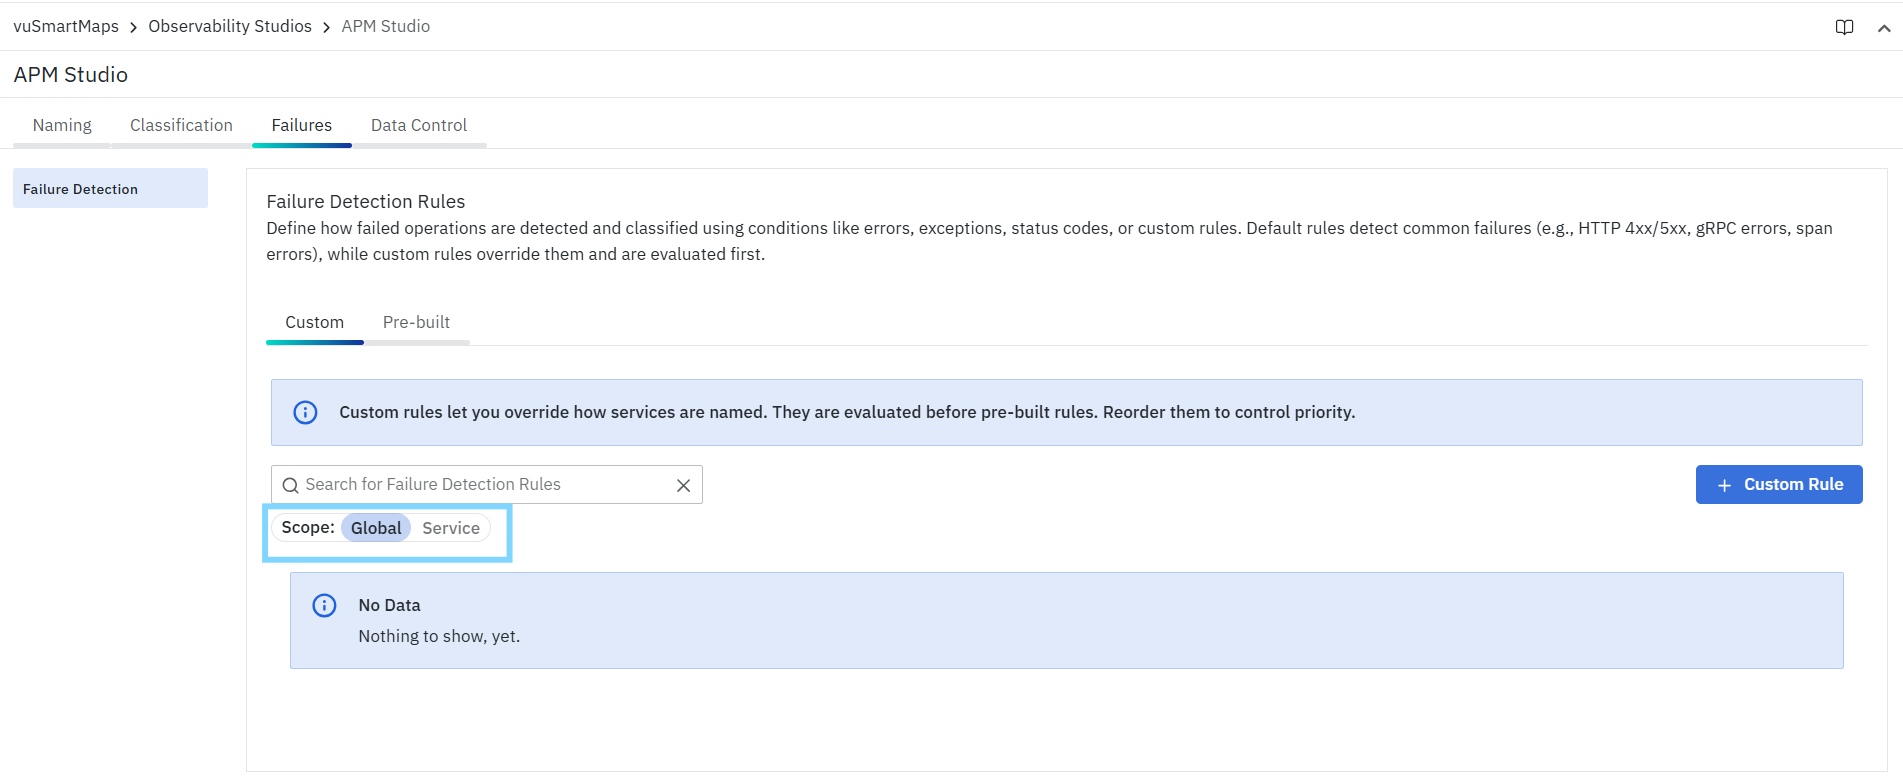
These filters help you quickly narrow the visible rules based on where they apply. This helps you review whether your failure logic is organization-wide or limited to specific services.
Custom and Pre-built Rule Behavior
Understanding how these two rule types work together is important when configuring failure detection.
Custom Rules
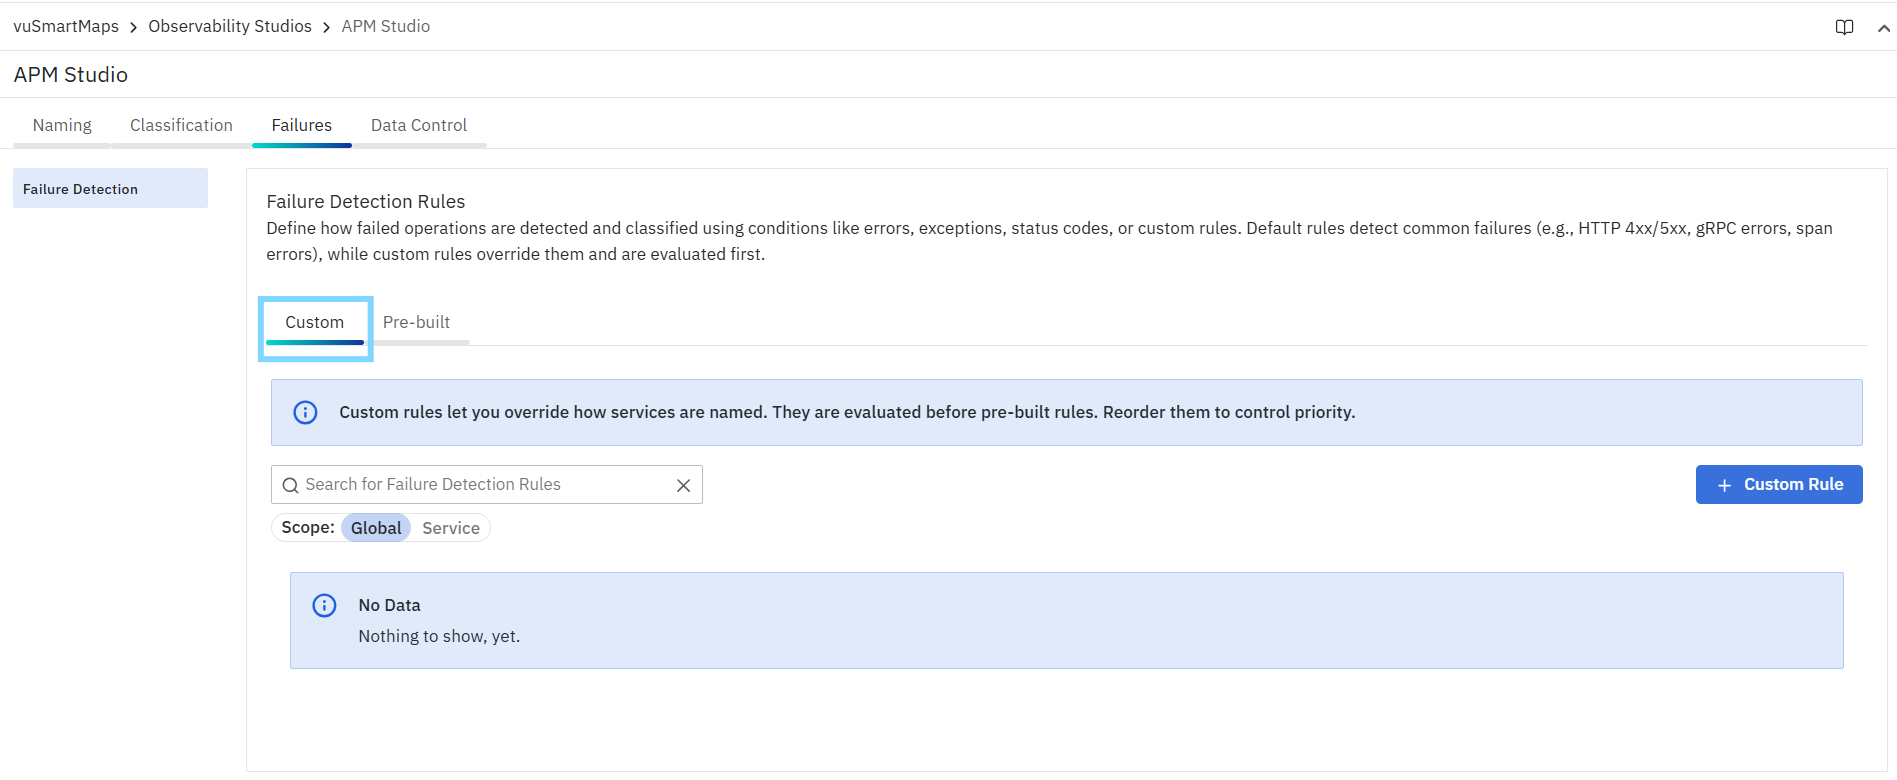
Custom rules are used when:
- Your application has service-specific failure behavior
- Business failures need to be captured explicitly
- The default protocol-level rules are not enough
- You want to override how failures are interpreted
These rules are configurable and evaluated first.
Pre-built Rules
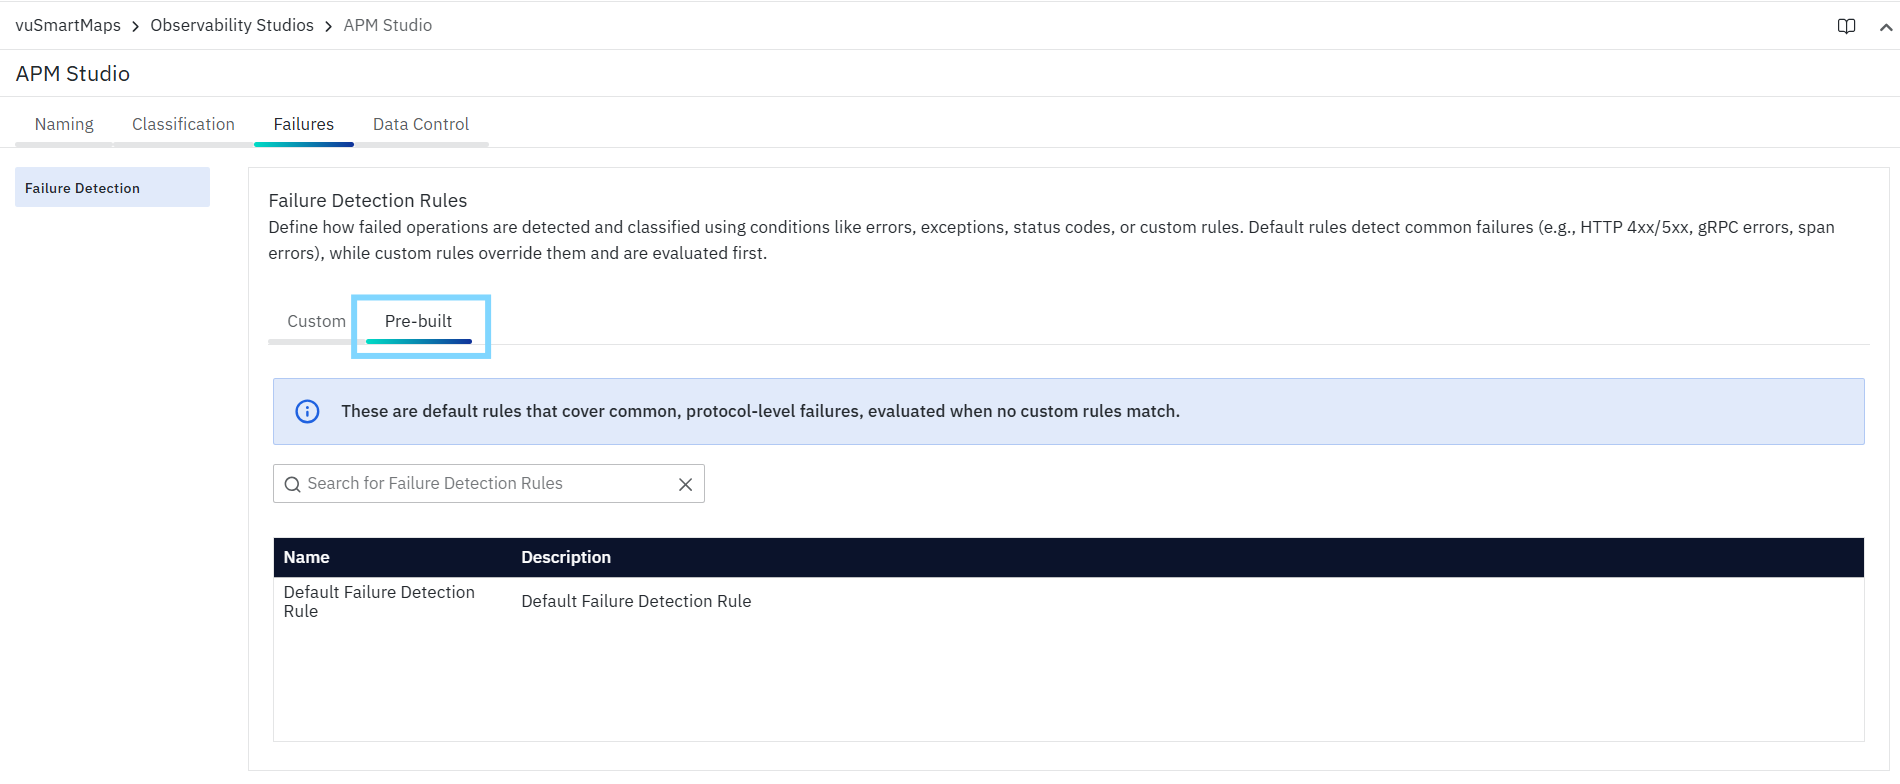
Pre-built rules are used as fallback logic. They help detect common failures using standard telemetry indicators such as:
- HTTP failures
- gRPC failures
- span error signals
- protocol-level error behavior
These rules are applied only when no custom rule matches.
Add a Custom Failure Detection Rule
To create a new failure detection rule:
- Open the Custom tab.
- Click + Custom Rule.
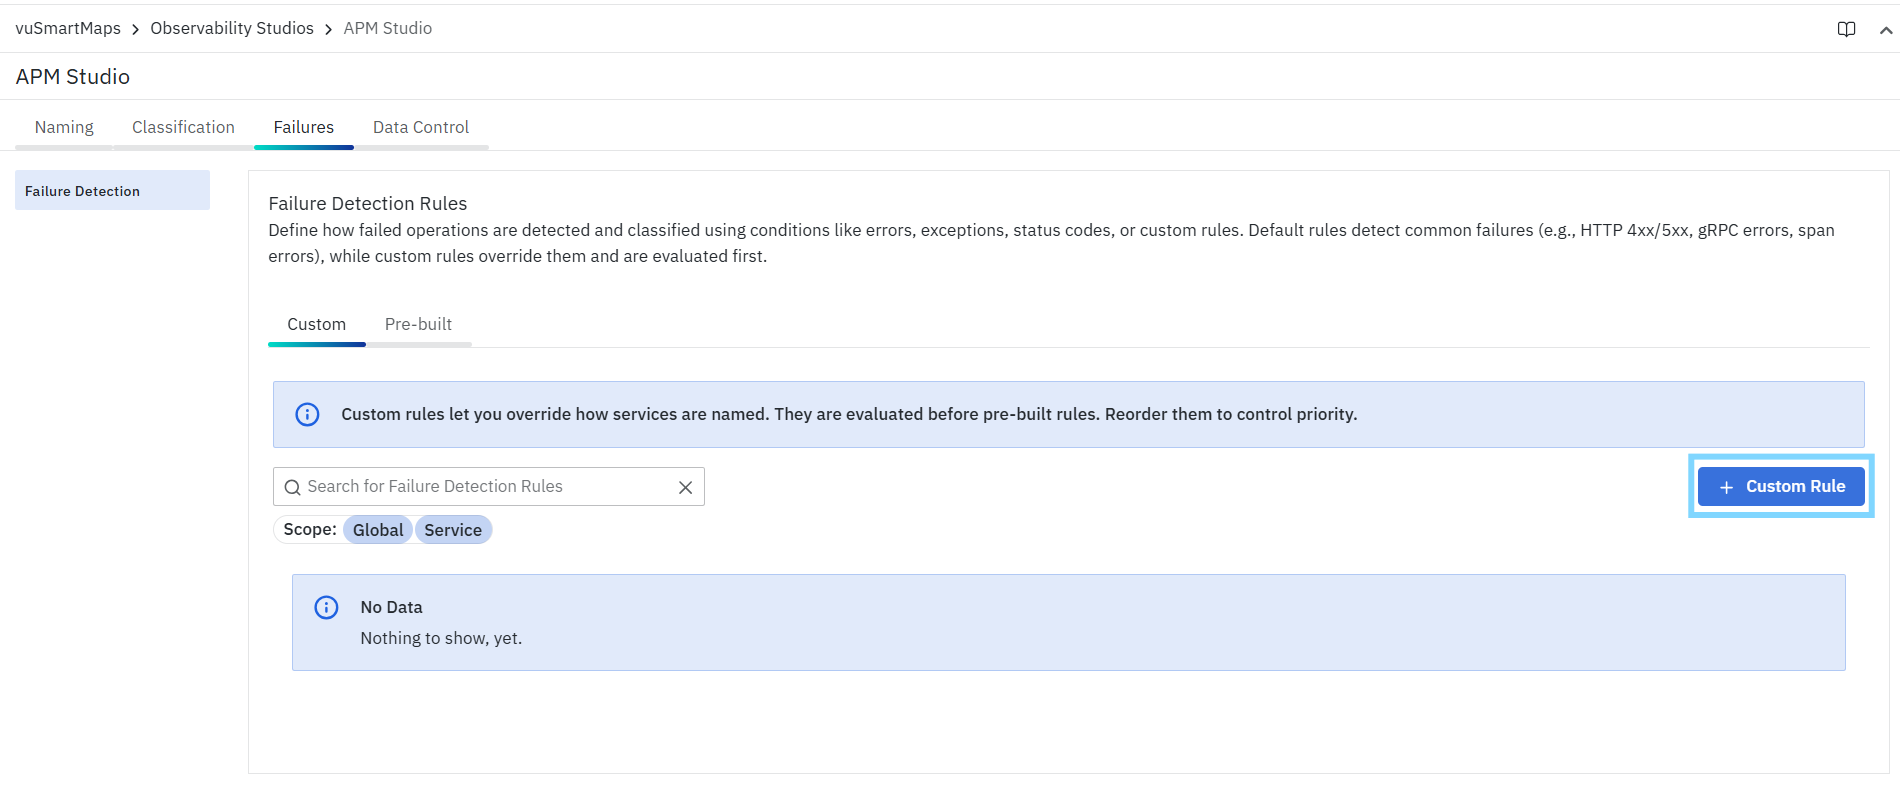
This opens the Add Custom Failure Detection Rule panel. The rule creation flow is organized into three steps:
This guided workflow helps you define the rule clearly before saving it.
General Info
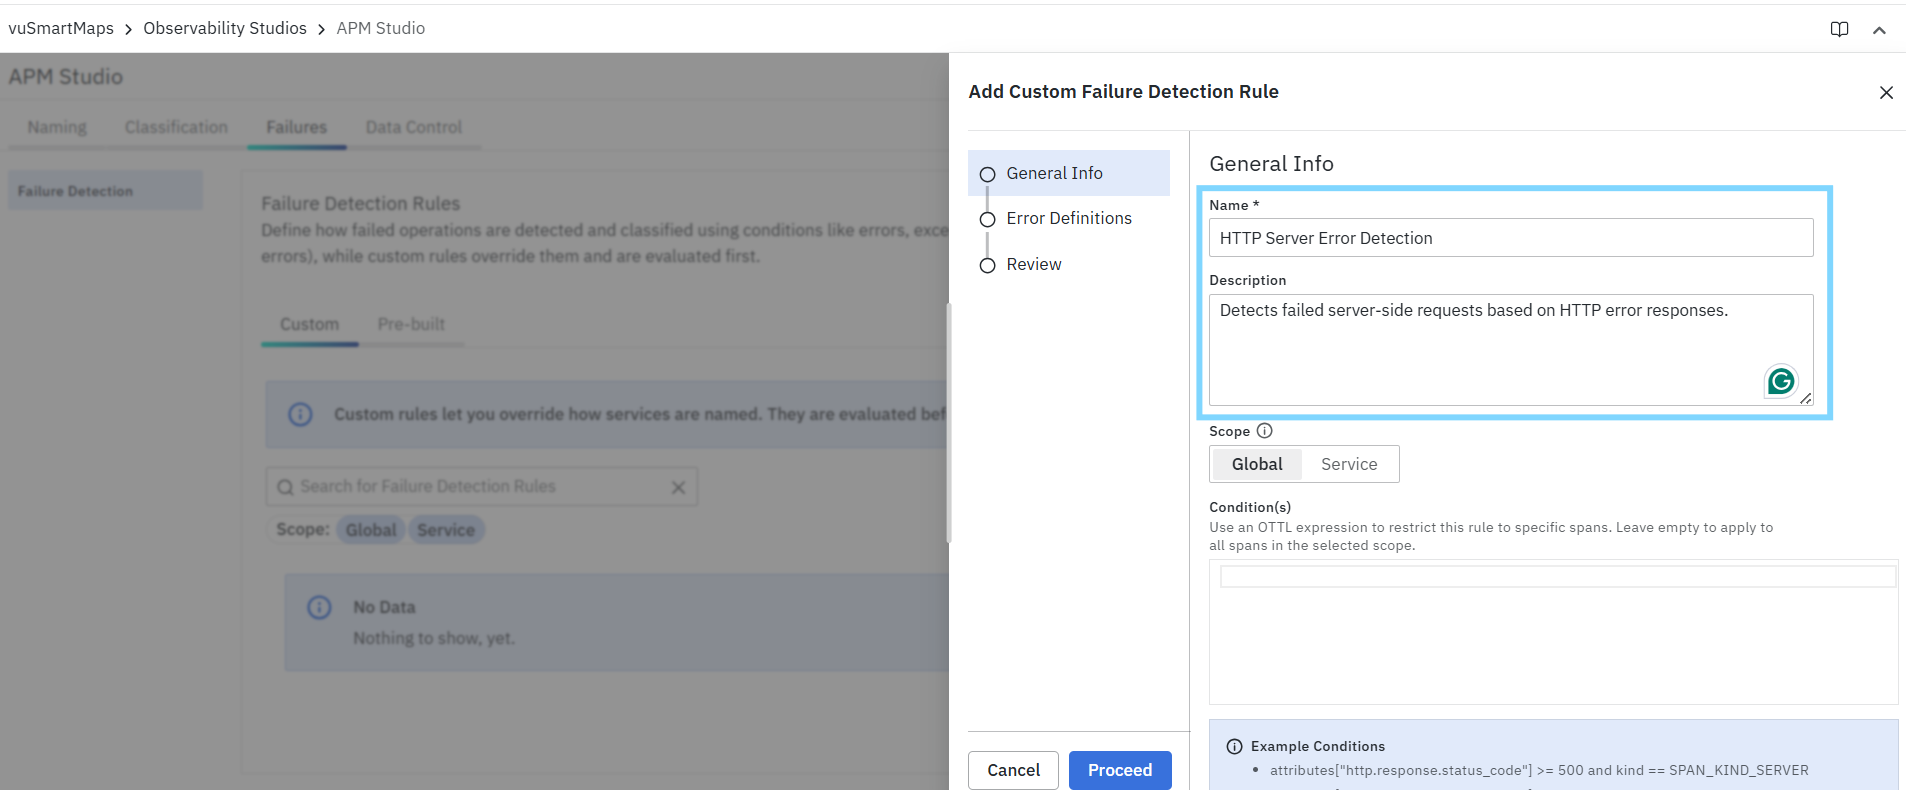
The General Info step is where you define the rule name, scope, and matching conditions.
The fields shown in this step are:
- Name
- Description
- Scope
- Service Name(s) (available when Service scope is selected)
- Condition(s)
This step controls where the rule applies and which spans it should target.
Field Descriptions – General Info
Name
- Enter a meaningful name for the rule.
- Choose a name that clearly reflects the purpose of the rule so that it is easy to identify later.
Examples
HTTP Server Error Detection
Description
- Provide a short explanation of what the rule is intended to detect.
- A clear description helps other users understand the purpose of the rule without opening the full configuration.
Examples
Detects failed server-side requests based on HTTP error responses.
Scope
- Select where the rule should apply.
- Available options:
- Global
- Service

Global
- Use Global when the failure logic should apply across all services.
- This is useful for:
- common HTTP failure logic
- common gRPC failure logic
- organization-wide failure handling
- generic protocol-based rules
Service
- Use Service when the rule should apply only to selected services.
- This is useful when:
- only certain services need custom handling
- business failure behavior differs between services
- a service requires more specific failure interpretation
Service Name(s)
- This field is displayed only when the Service scope is selected.
- Use it to select the service or services to which the rule should apply.

Examples
You may choose services such as:
API-Gateway
Condition(s)
The Condition(s) field accepts an OTTL expression to restrict the rule to specific spans. If this field is left empty, the rule applies to all spans within the selected scope. This is an important field because it allows you to make the rule more precise and avoid applying it too broadly.

Use Conditions When You Want To
- Target only server spans
- Restrict the rule to specific request or response patterns
- Match only spans with certain attributes
- Apply the rule only to client or server spans
- Limit the rule to spans containing exception data
Supported OTTL Expressions
- Failure Detection rules use OTTL expressions to evaluate custom failure conditions. Only the supported subset of OTTL functions, operators, and field references can be used when defining these expressions.
- For the complete list of supported OTTL functions, operators and supported fields, refer Supported OTTL Functions and Operators.
Example Conditions
The following examples show how the Condition(s) field can be used to restrict a failure detection rule to specific spans.
Example 1: Match server spans with HTTP 5xx responses
attributes["http.response.status_code"] >= 500 and kind == SPAN_KIND_SERVER
Matches server spans where the HTTP response status code is 500 or higher.
Example 2: Match client spans with HTTP 4xx or 5xx responses
attributes["http.response.status_code"] >= 400 and kind == SPAN_KIND_CLIENT
Matches client spans where the HTTP response status code is 400 or higher.
Example 3: Match spans containing exception information
IsMatch(attributes["exception.type"], ".+")
Matches spans where the exception.type attribute is present and contains a value.
Error Definitions
- After completing the General Info step, click Proceed to move to the Error Definitions step.
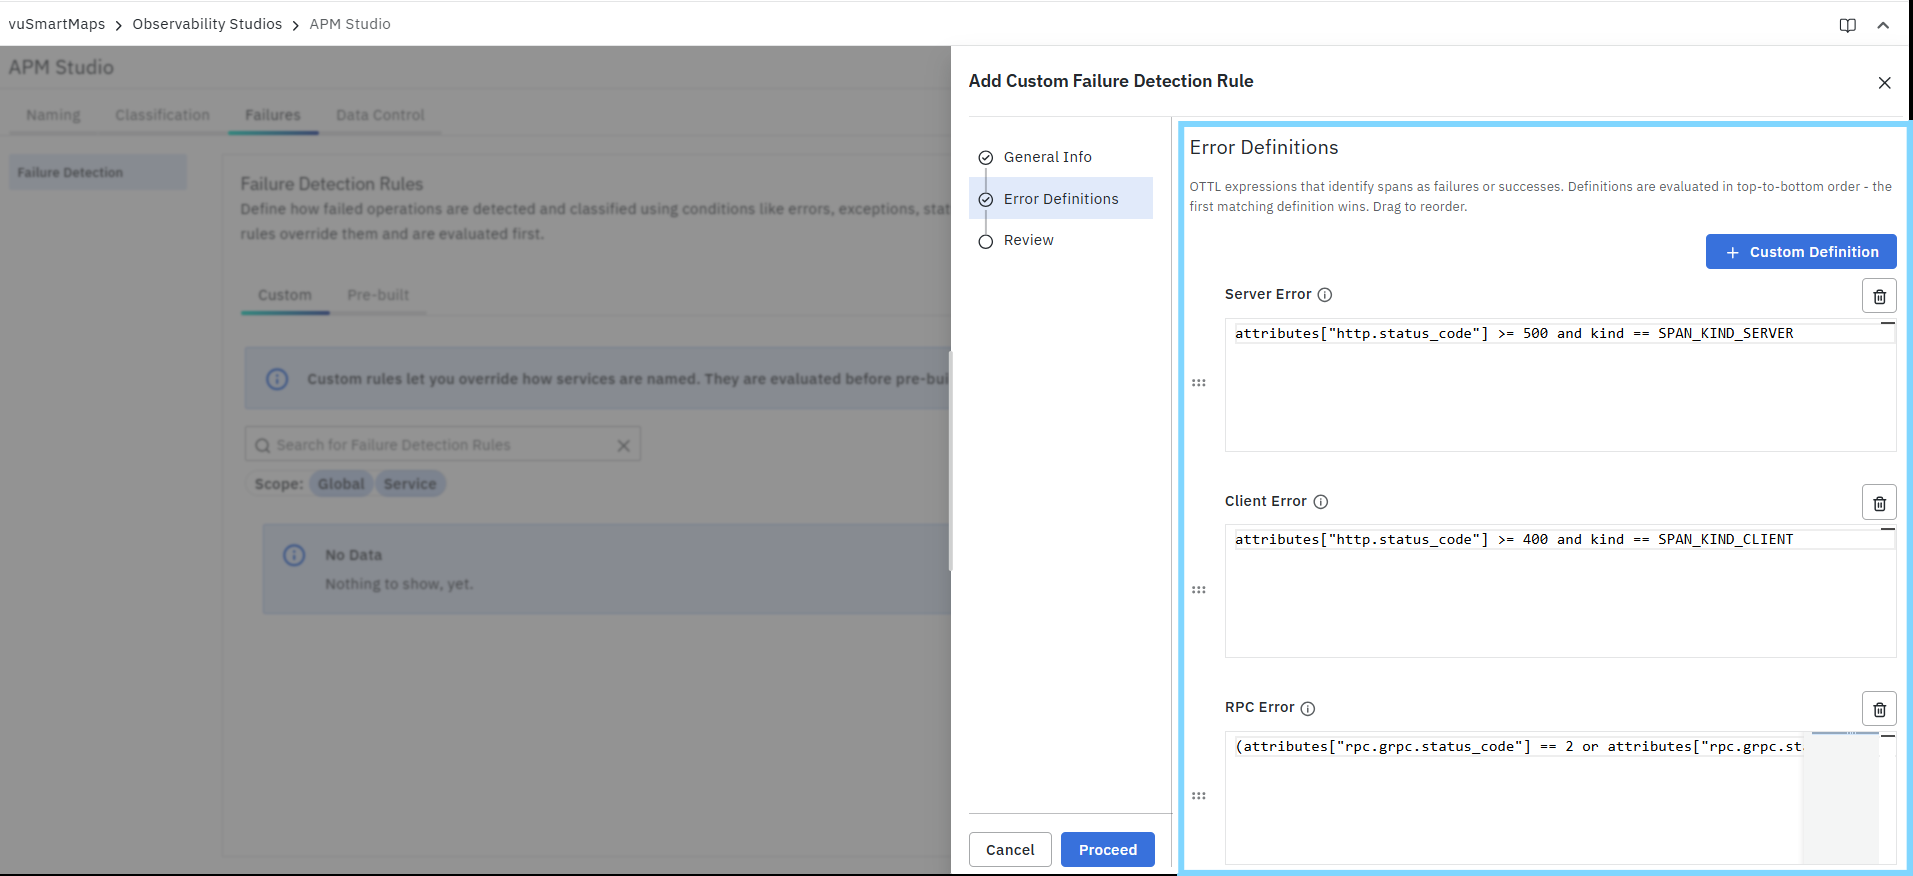
- The Error Definitions step is where you define how matching spans should be identified as failures.
- Once a span matches the selected Scope and optional Condition(s), these definitions are evaluated to determine whether that span should be marked as failed.
- This step provides a set of built-in failure categories that cover common failure patterns across HTTP, gRPC, span status, and exception-based telemetry. You can also add your own custom logic when your application uses business-specific failure indicators.
- Definitions are evaluated from top to bottom, and the first matching definition wins.
You can drag and reorder the definitions to control evaluation priority.
Available Error Definitions
The following built-in definitions are available in the Error Definitions step:
Server Error
- Marks a span as failed based on the HTTP status code on a server span.
- By default, HTTP status code >= 500 is treated as a failure for server-side spans.
- This is useful for detecting backend or application-side failures such as internal server errors, unavailable services, or unhandled exceptions returned by the server.
Default example:
attributes["http.status_code"] >= 500 and kind == SPAN_KIND_SERVER
Client Error
- Marks a span as failed based on the HTTP status code on a client span.
- By default, HTTP status code >= 400 is treated as a failure for client-side spans.
- This helps capture outbound call failures where the client receives an unsuccessful HTTP response, such as bad requests, unauthorized calls, or downstream service failures.
Default example:
attributes["http.status_code"] >= 400 and kind == SPAN_KIND_CLIENT
RPC Error
- Marks a span as failed for specific gRPC error status codes.
- This definition is used for gRPC-based service-to-service communication, where failure is determined by the gRPC status code rather than HTTP status semantics. It helps detect RPC failures such as invalid arguments, permission issues, unavailable services, or internal RPC errors.
Typical use case:
- Use this when your services communicate through gRPC and you want APM to correctly classify RPC failures based on gRPC response codes.
Representative example:
(attributes["rpc.grpc.status_code"] == 2 or
attributes["rpc.grpc.status_code"] == 4
or attributes["rpc.grpc.status_code"] == 12
or attributes["rpc.grpc.status_code"] == 13
or attributes["rpc.grpc.status_code"] == 14
or attributes["rpc.grpc.status_code"] == 15)
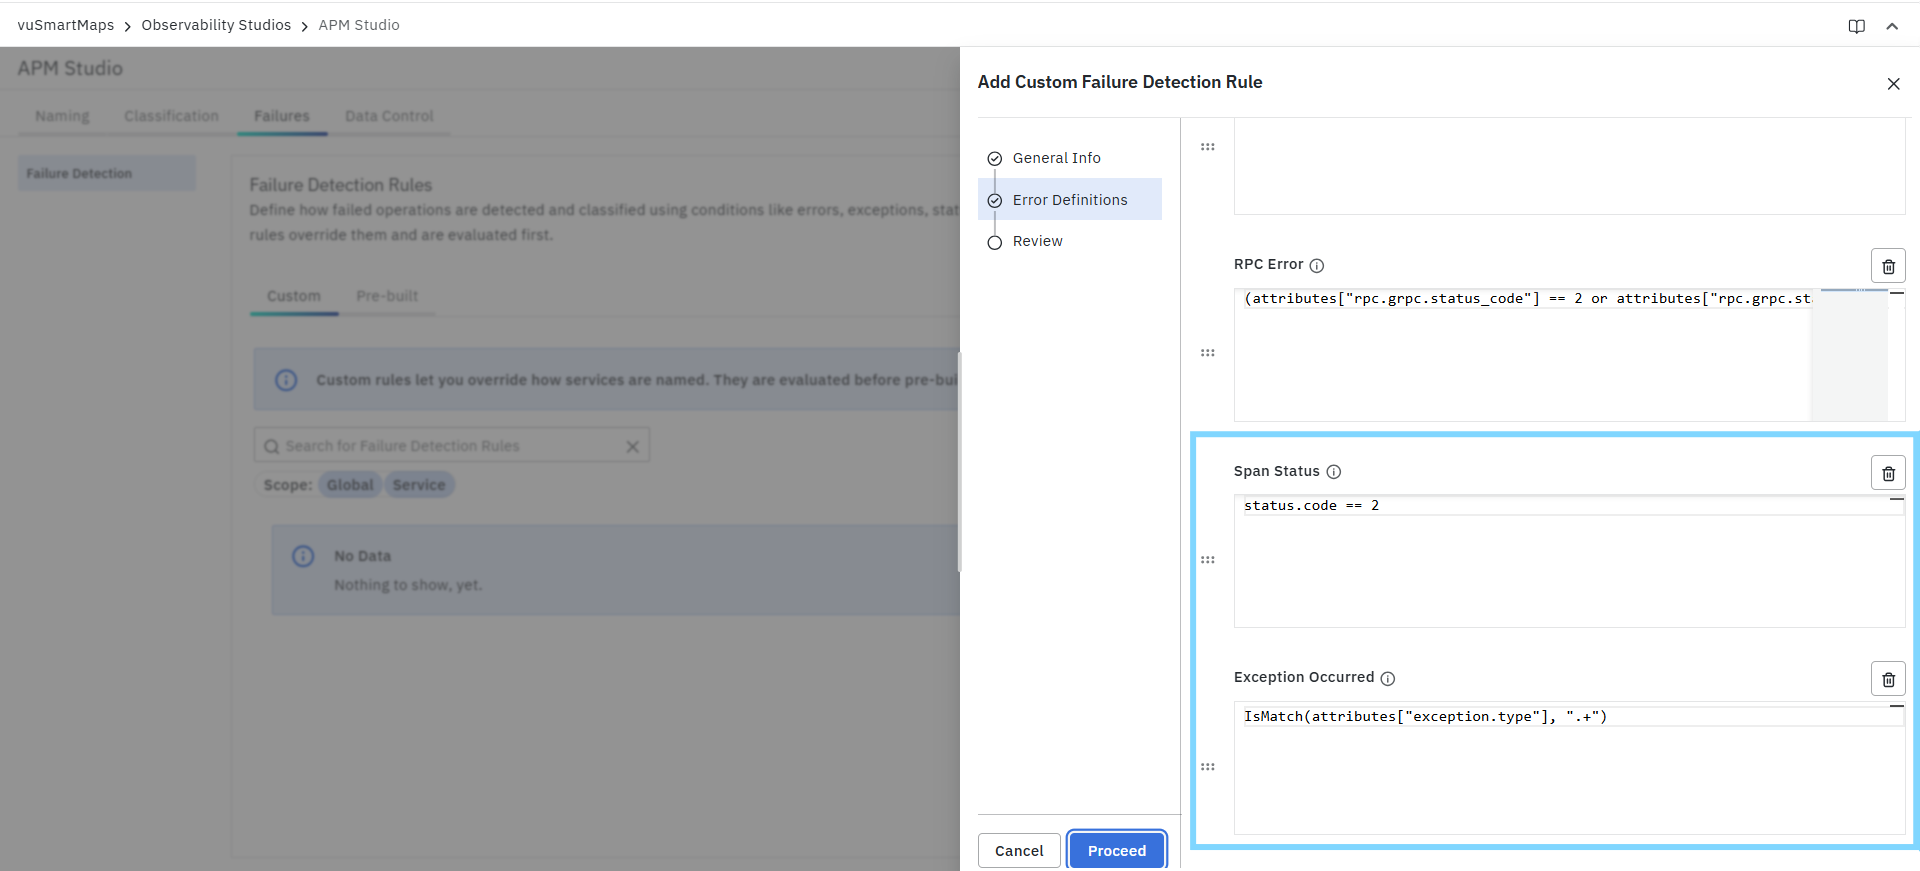
Span Status
- Marks a span as failed based on the span status code.
- If your instrumentation already sets the span status correctly, this definition allows APM to use that status directly to identify failures.
Default example:
status.code == 2
Exception Occurred
- Marks a span as failed if it contains exception information.
- This definition checks whether the span includes an exception-related attribute, which indicates that an application exception occurred during processing. It is useful when failures are represented through exception telemetry rather than protocol status codes.
Default example:
IsMatch(attributes["exception.type"], ".+")
Custom Definition
- Allows you to define a custom OTTL expression for failure detection.
- Use this option when the built-in definitions are not sufficient and your application identifies failures through business-specific attributes, custom tags, or non-standard telemetry patterns.
- This is especially useful when a request may technically return a successful protocol response, but the operation should still be treated as failed based on business logic.
Example use cases:
- A payment response contains
payment.status = "FAILED" - An order API returns HTTP 200 but includes
order.result = "error" - A custom span attribute indicates a retry exhaustion or timeout condition
Representative example:
attributes["payment.status"] == "FAILED"
Add a Custom Definition
To add a custom failure definition:
- In the Error Definitions step, click + Custom Definition.

- Enter an OTTL expression that identifies a failure condition.

- Reorder the definition if needed to control when it is evaluated.
- Click Proceed to move to the Review step.
Custom definitions are evaluated together with the built-in definitions, so their position in the list matters.
Why Definition Order Matters
Definitions are evaluated in sequence from top to bottom. The first matching definition is applied, and later definitions are not evaluated for that span.
This means:
- More specific rules should be placed above more general ones
- Custom business failures should be placed above broad protocol-based checks when needed
- Reordering definitions helps prevent generic rules from matching too early
Example: If you want a payment failure attribute to take priority over a generic HTTP failure rule, place the Custom Definition above Server Error.
Review
- After configuring the Error Definitions, click Proceed to move to the Review step.
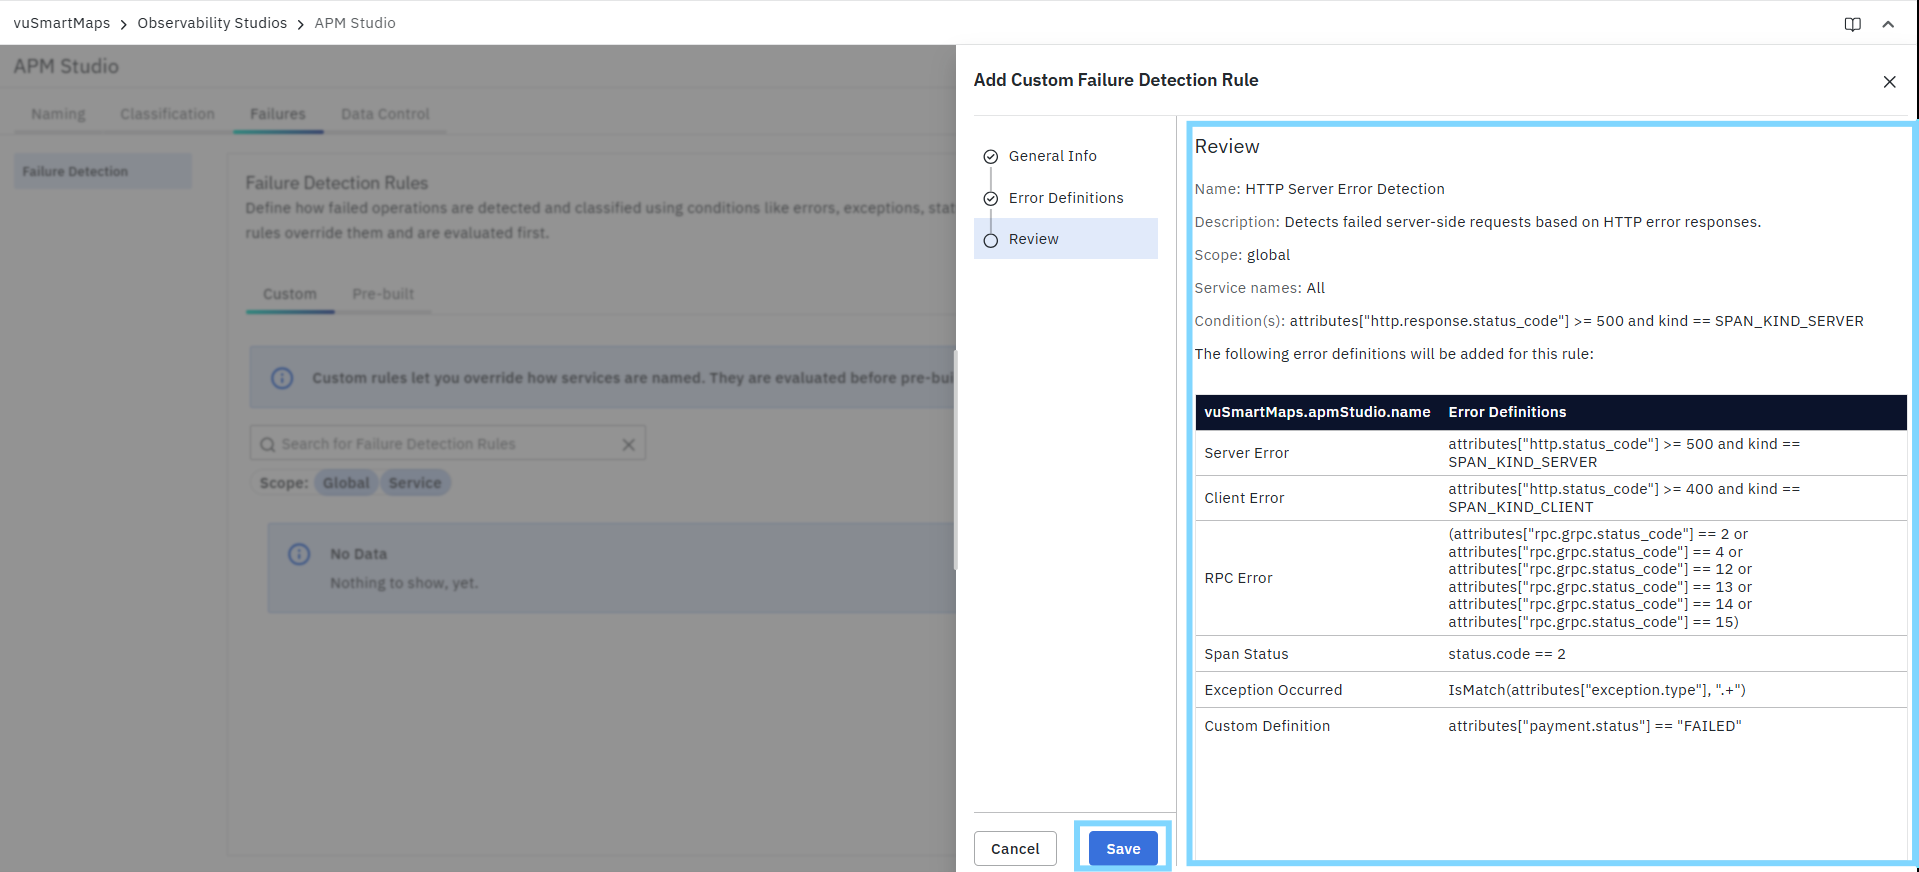
- The Review step provides a complete summary of the rule before it is saved.
- Use this step to verify that all configuration details are correct, especially because failure detection rules directly affect how spans are classified as failed and can influence service health views, failure rates, dashboards, alerts, and troubleshooting workflows.
- This step helps ensure that the rule behaves as expected before it becomes active in the Custom rule set.
What You Can Review
In the Review step, the system displays a consolidated summary of the rule configuration, including:
- Name – the rule name entered in the General Info step
- Description – the rule description entered in the General Info step
- Scope – whether the rule applies at the Global or Service level
- Service names – the selected service(s) when the rule is created with Service scope
- Condition(s) – the optional OTTL expression used to restrict the rule to specific spans
- Error Definitions – the list of built-in and custom failure definitions that will be evaluated for the rule
The Error Definitions section is displayed in a table format, showing each definition name along with its corresponding expression. This makes it easy to confirm that the correct failure logic has been configured before saving the rule.
Save the Rule
After reviewing the configuration:
- Click Save to create the custom failure detection rule.
- The rule is added to the Custom tab under Failure Detection Rules.
- Once active, the rule is evaluated before Pre-built rules and can override default failure classification behavior when its scope and conditions match.
FAQs
What are Failure Detection Rules?
Failure Detection Rules define when requests or operations should be treated as failures based on custom application logic.
Can I create custom failure definitions?
Yes. You can configure custom failure definitions using supported conditions and error criteria.
Do custom rules override pre-built rules?
Yes. Matching custom rules are evaluated before pre-built failure detection rules.
Why should I customize failure detection?
Custom failure detection helps ensure that APM reflects your application's actual business logic instead of relying only on default telemetry.
Where are detected failures displayed?
Detected failures are reflected in APM dashboards, trace views, alerts, and troubleshooting workflows.
