Deep Code
The Deep Code section allows you to enable or disable Code-Level Visibility (CLV) for monitored services. When enabled, the platform captures additional code-level spans such as Controller, Service, Database Connection, and Database Transaction spans within traces, helping users perform deeper root cause analysis.
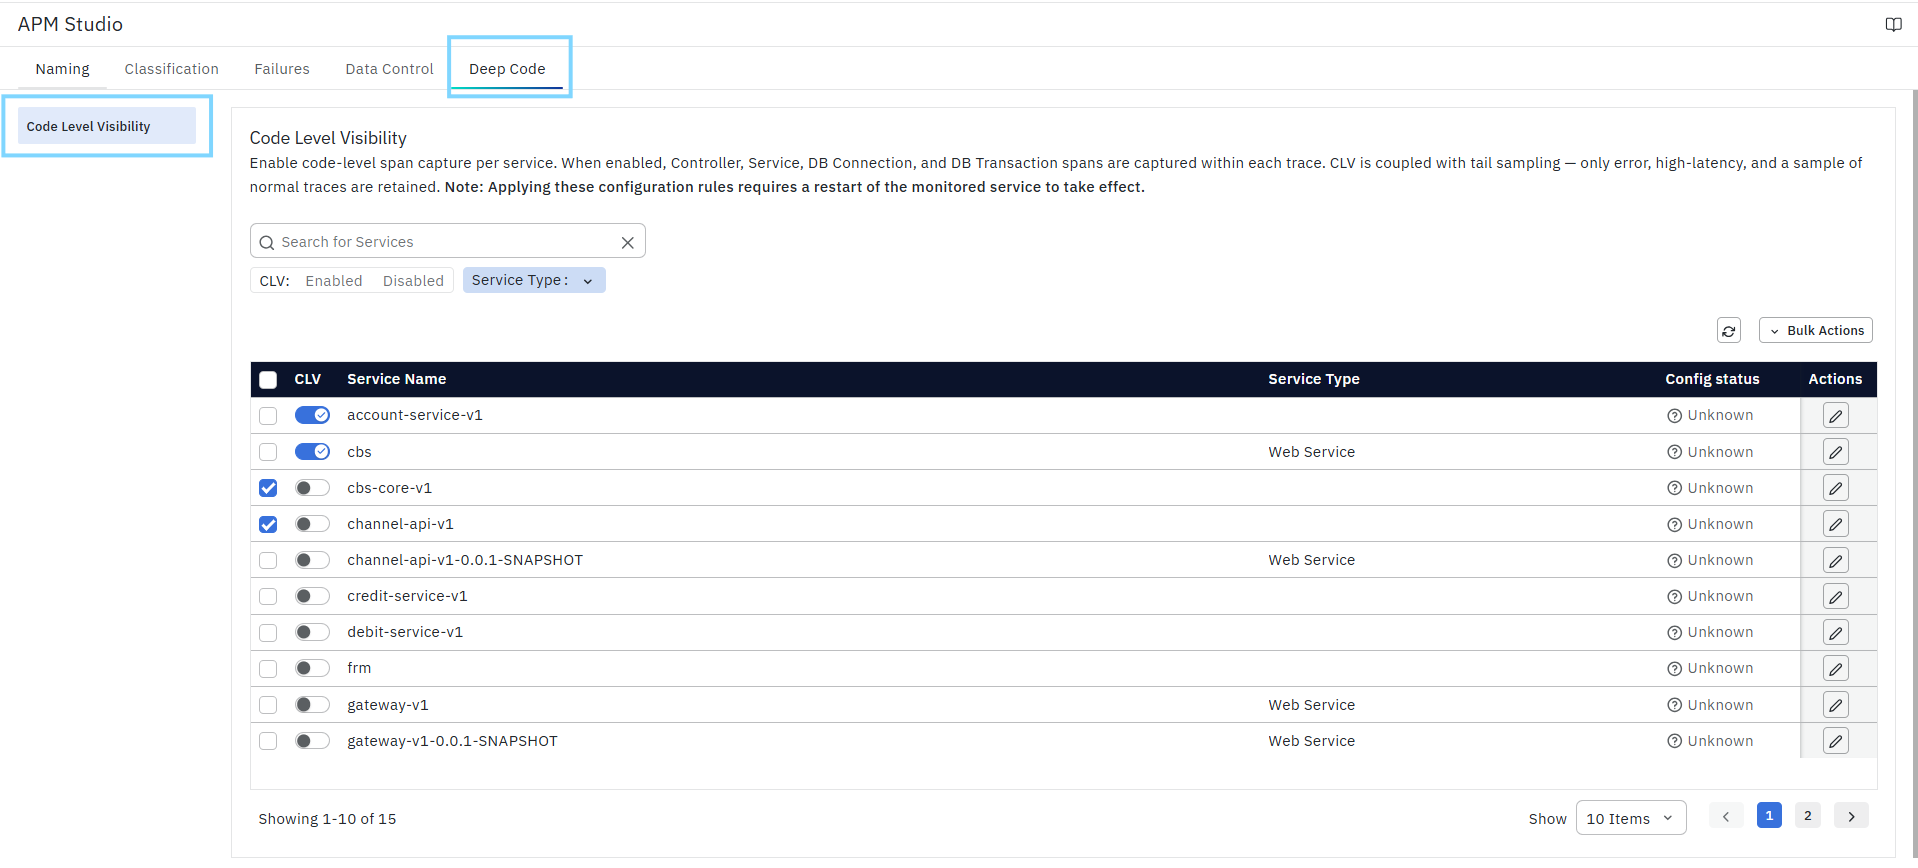
Code-Level Visibility works together with trace sampling to retain error traces, high-latency traces, and a configurable sample of normal traces. After applying configuration changes, restart the monitored service for the new settings to take effect.
Prerequisites
Before enabling Code-Level Visibility, ensure the following prerequisites are met:
- The application or service is already onboarded to APM.
- Distributed tracing is enabled and the application is actively sending trace data.
- Auto Instrumentation or manual instrumentation has been successfully configured for the application.
- The monitored service appears in the Code Level Visibility page.
- You have sufficient permissions to modify APM Studio configurations.
- You have permission to restart the monitored application after applying configuration changes.
- The required application framework and runtime are supported by the configured instrumentation.
Code-Level Visibility captures additional execution spans only for applications where instrumentation supports code-level span generation. Services without compatible instrumentation continue to generate standard trace data.
End-to-End Workflow
The following workflow describes how Code-Level Visibility is typically used.
- Enable Code-Level Visibility for the required service.
- Configure the required capture options.
- Save the configuration.
- Restart the monitored application.
- Generate application traffic.
- Allow traces to be collected.
- Open Application Performance Monitoring (APM).
- Navigate to Trace Explorer.
- Open Trace Details.
- Analyze Trace Waterfall, Span Details, SmartFrames, and TraceMap to investigate application behavior.
Code Level Visibility Page
The Code Level Visibility page provides a centralized view of all discovered services and allows you to configure Code-Level Visibility individually or for multiple services simultaneously.
From this page, you can:
- View all discovered services.
- Enable or disable Code-Level Visibility for a service.
- Filter services based on CLV status.
- Search for a specific service.
- Filter services by service type.
- Configure individual services.
- Perform bulk enable or disable operations.
Page Components
Search for Services
Use the Search for Services field to quickly locate a service by entering its name.
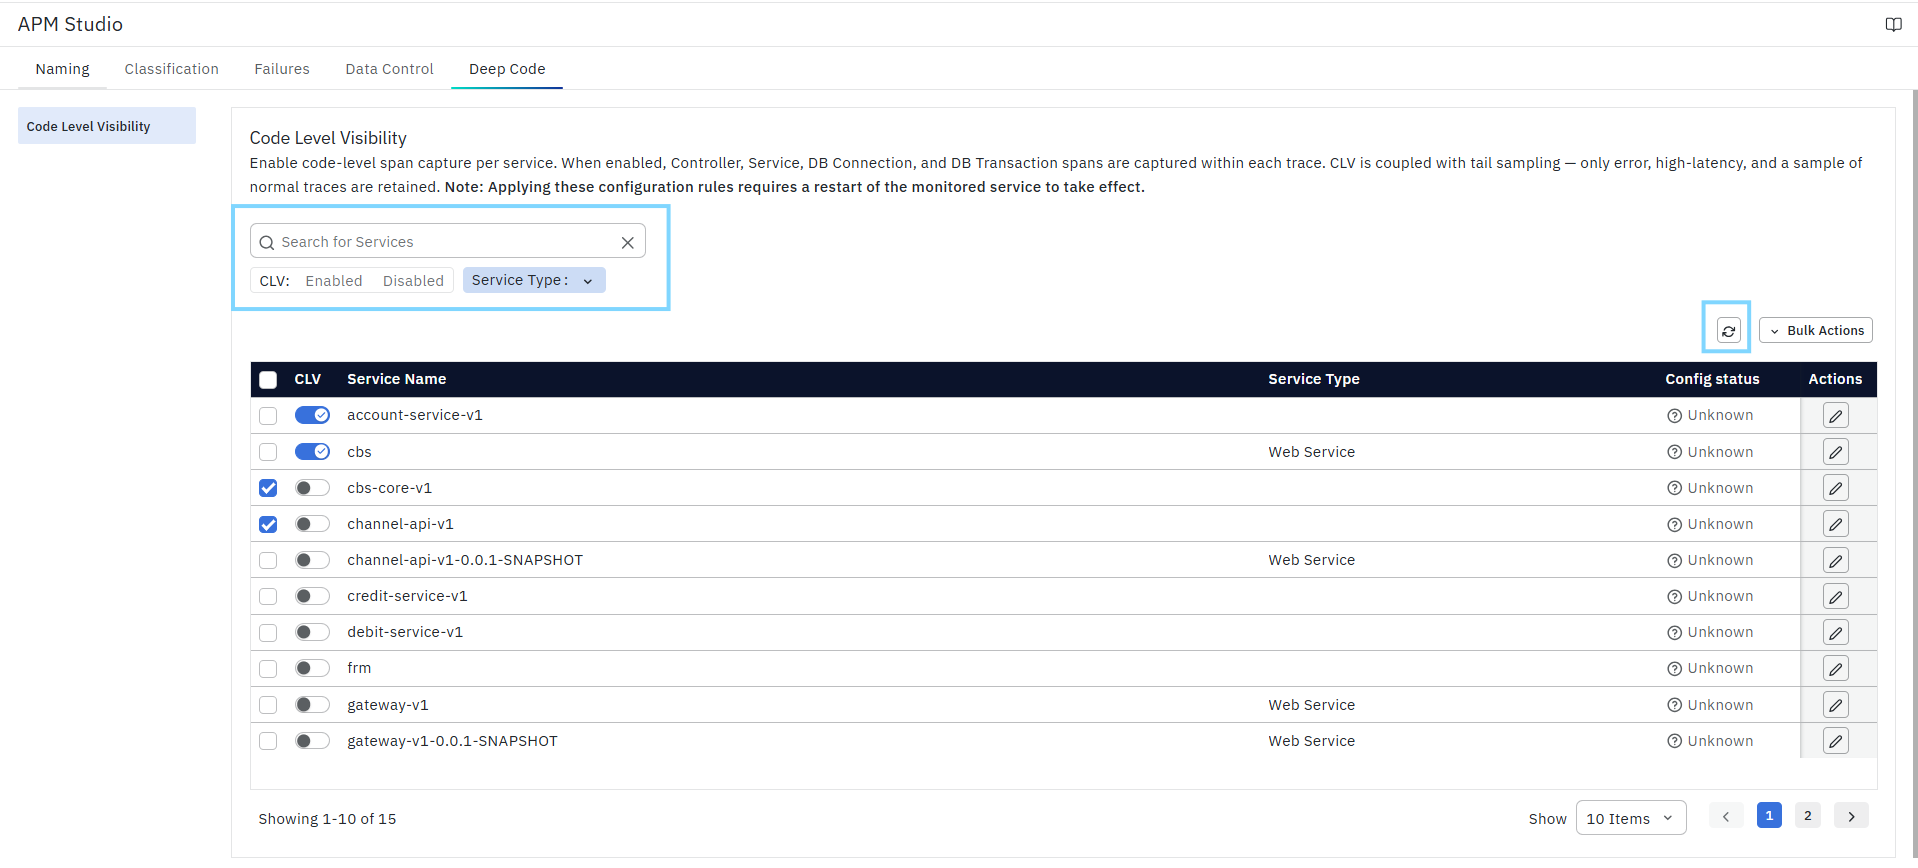
CLV Filter
Use the CLV filter to display services based on their Code-Level Visibility status.
Available options include:
- Enabled – Displays only services with Code-Level Visibility enabled.
- Disabled – Displays only services with Code-Level Visibility disabled.
Service Type Filter
Use the Service Type drop-down to filter services by their type, making it easier to locate specific categories of monitored services.
Refresh
Click the Refresh icon to reload the service list and display the latest configuration status.
Service List
The service table displays all discovered services available for configuration.
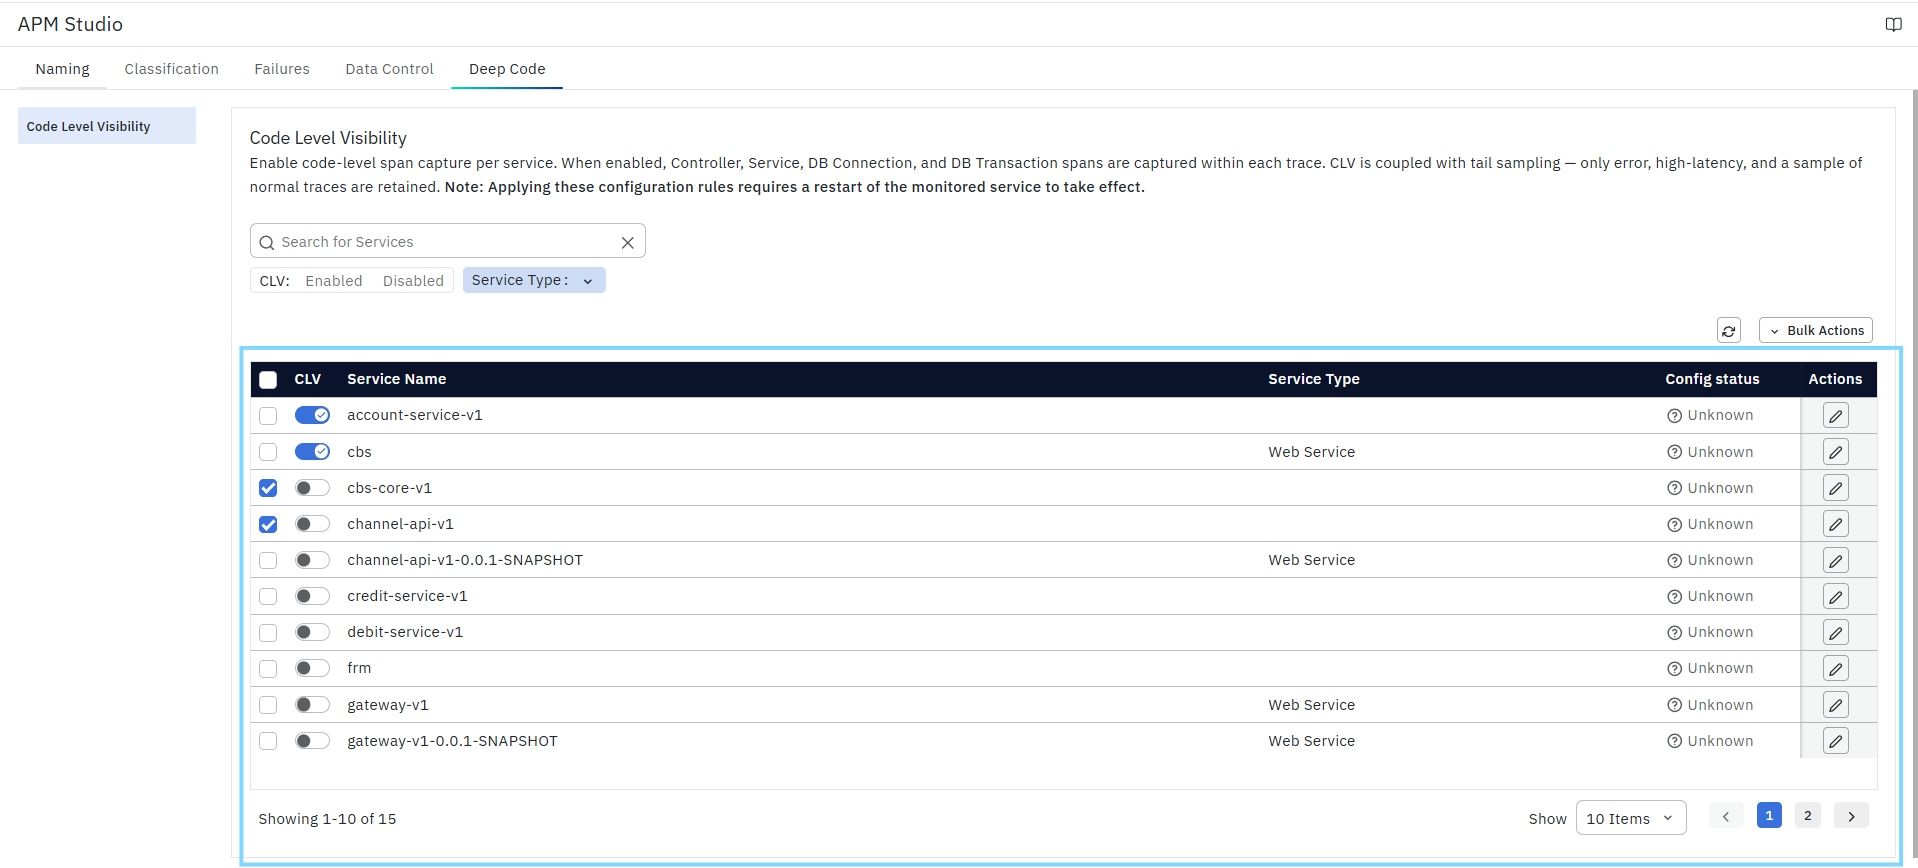
The table includes the following information:
- CLV – Select whether Code-Level Visibility should be enabled or disabled for the service.
- Service Name – Name of the monitored service.
- Service Type – Type of monitored service.
- Config Status – Displays the current configuration status.
- Actions – Provides options to configure an individual service.
Enable or Disable Code-Level Visibility for a Service
You can configure Code-Level Visibility individually for each service.
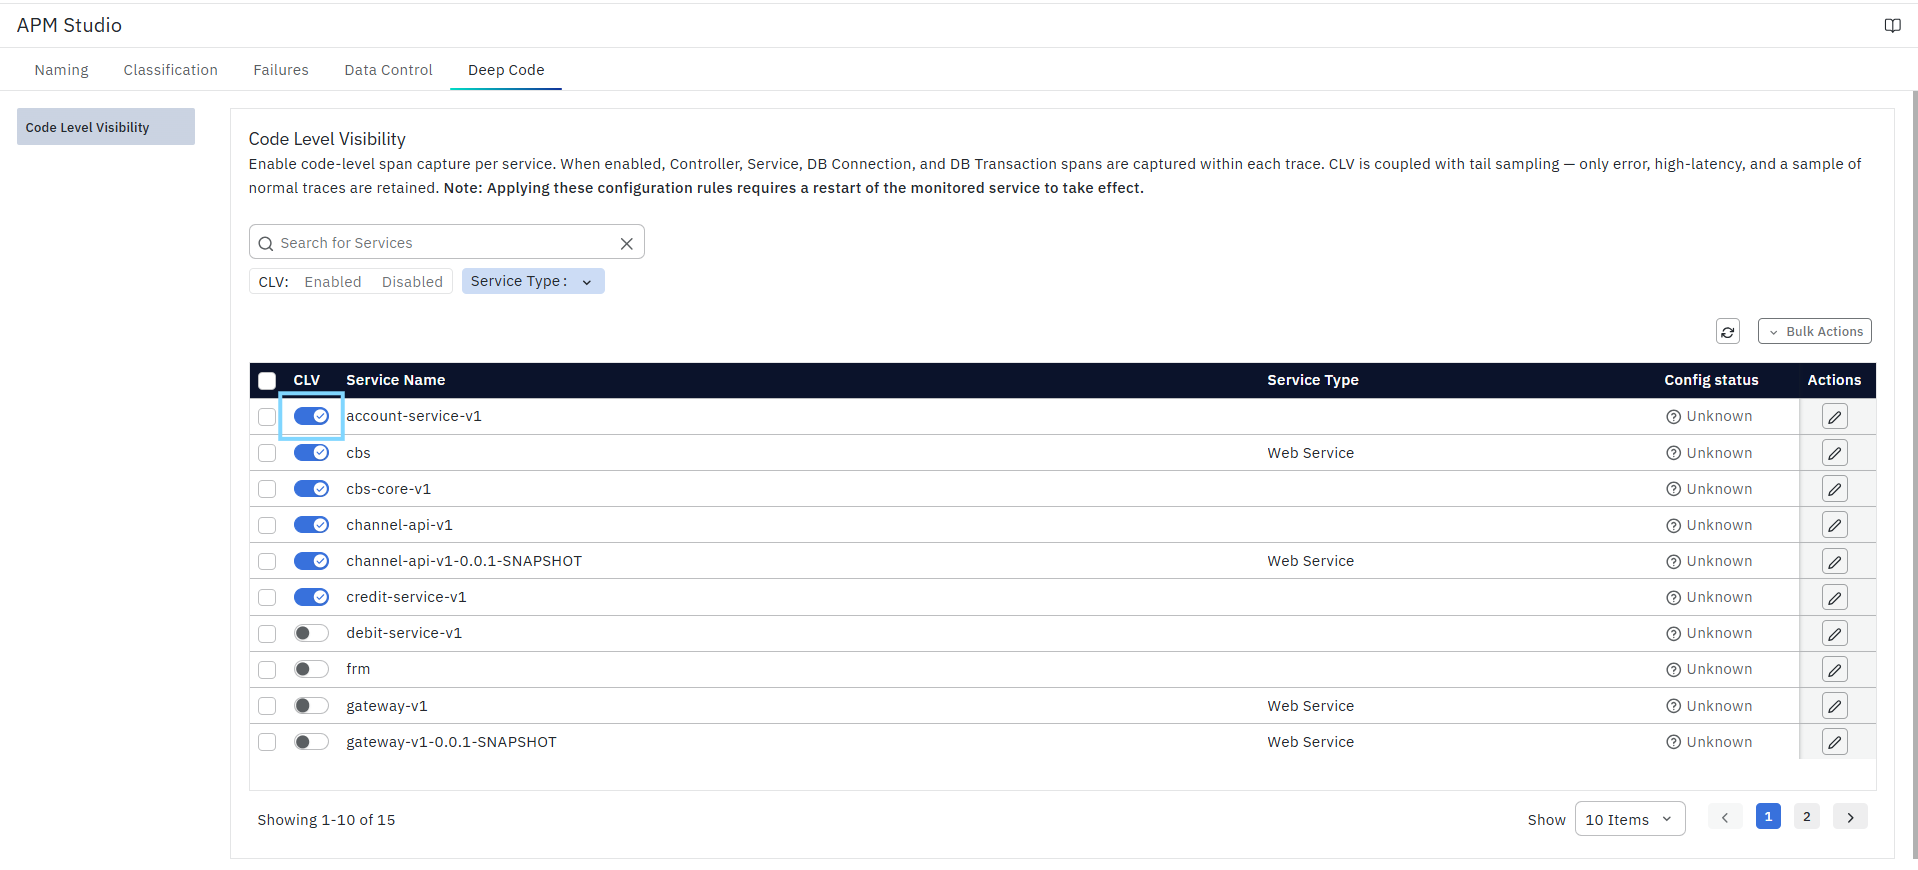
To enable or disable Code-Level Visibility:
- Locate the required service.
- Toggle the CLV switch:
- Enable the toggle to activate Code-Level Visibility.
- Disable the toggle to turn it off.
- Restart the monitored service for the configuration to take effect.
Configure an Individual Service
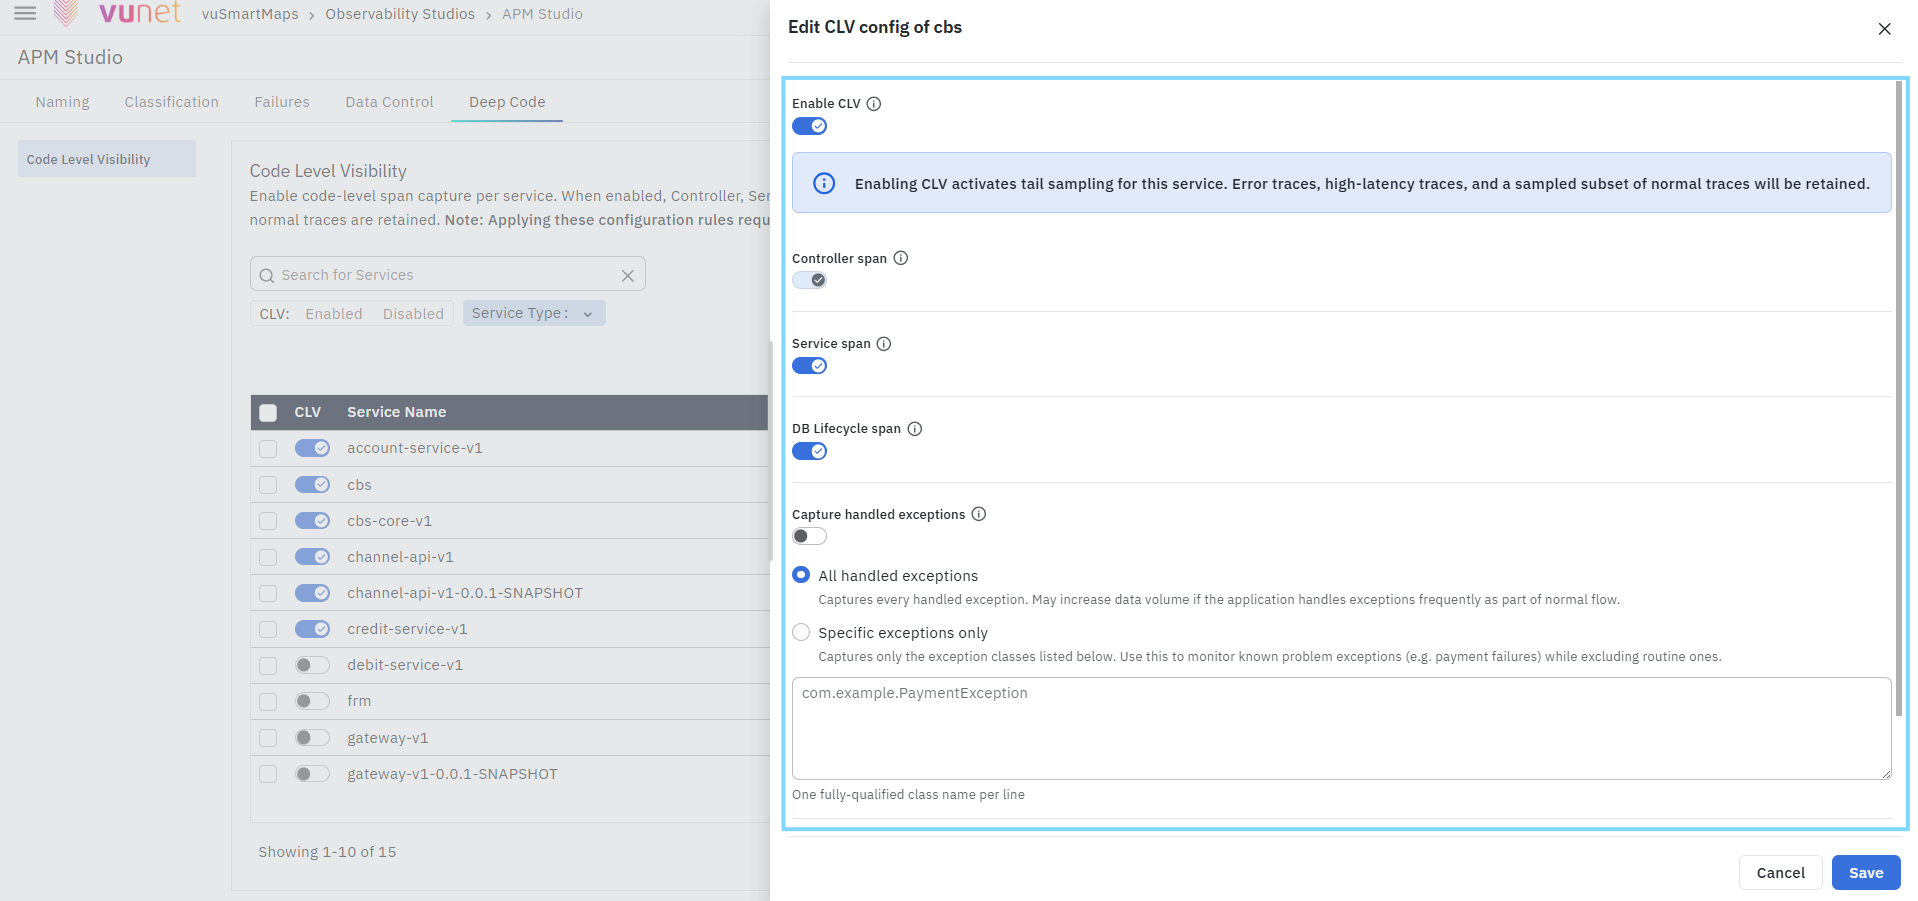
The Edit option allows you to configure Code-Level Visibility settings for an individual monitored service. Selecting the Edit (pencil) icon opens a configuration panel from the right side of the page, where you can enable or disable specific code-level capture options based on your monitoring requirements.
To configure an individual service:
- Navigate to APM Studio > Deep Code > Code Level Visibility.
- Locate the service you want to configure.
- Click the Edit (pencil) icon under the Actions column.
- The Edit CLV Configuration panel opens from the right side of the page.
- Configure the required settings.
Configuration Options
The configuration panel provides the following options:
Enable CLV
- Enables or disables Code-Level Visibility for the selected service.
- When enabled, Code-Level Visibility captures additional execution spans for the configured service. Enabling CLV also activates tail sampling, where error traces, high-latency traces, and a sampled subset of normal traces are retained based on the sampling policies configured for the service.
- Code-Level Visibility creates and maintains the required system-managed sampling policies for the selected service. These policies are automatically managed by the platform and cannot be deleted while Code-Level Visibility remains enabled.
- If Code-Level Visibility is disabled, controller, service, ORM, database lifecycle, and exception-related code-level spans are no longer collected for the selected service.
- Disabling Code-Level Visibility also removes the associated system-managed sampling policies for the service.
ORM Span
Enables the capture of repository-level execution spans and Hibernate operations performed during data access.
When enabled, ORM Span captures:
- Repository method calls.
- Hibernate Session operations.
- Hibernate Query execution.
These spans provide additional visibility into the application's data access layer, making it easier to identify delays and bottlenecks during ORM processing.
Disabling ORM Span reduces the number of repository and Hibernate-related spans collected when this level of detail is not required. JDBC statement spans continue to be captured independently, and Database Lifecycle spans remain unaffected.
Controller Span
Enables the capture of Controller layer spans, providing visibility into request handling at the application entry point.
Service Span
Enables the capture of Service layer spans to monitor the execution of application service logic.
DB Lifecycle Span
Captures spans related to database lifecycle operations, allowing greater visibility into database interactions during request processing.
Capture Handled Exceptions
Captures exceptions that are handled within the application instead of propagating as unhandled errors.
You can choose one of the following options:
- All handled exceptions – Captures every handled exception generated by the application. This may increase the volume of captured data if exceptions are frequently used as part of normal application processing.
- Specific exceptions only – Captures only the exception classes specified in the provided text box. Enter one fully qualified exception class name per line.
Capture Stack Trace
Captures the stack trace associated with the controller to provide additional diagnostic information during troubleshooting.
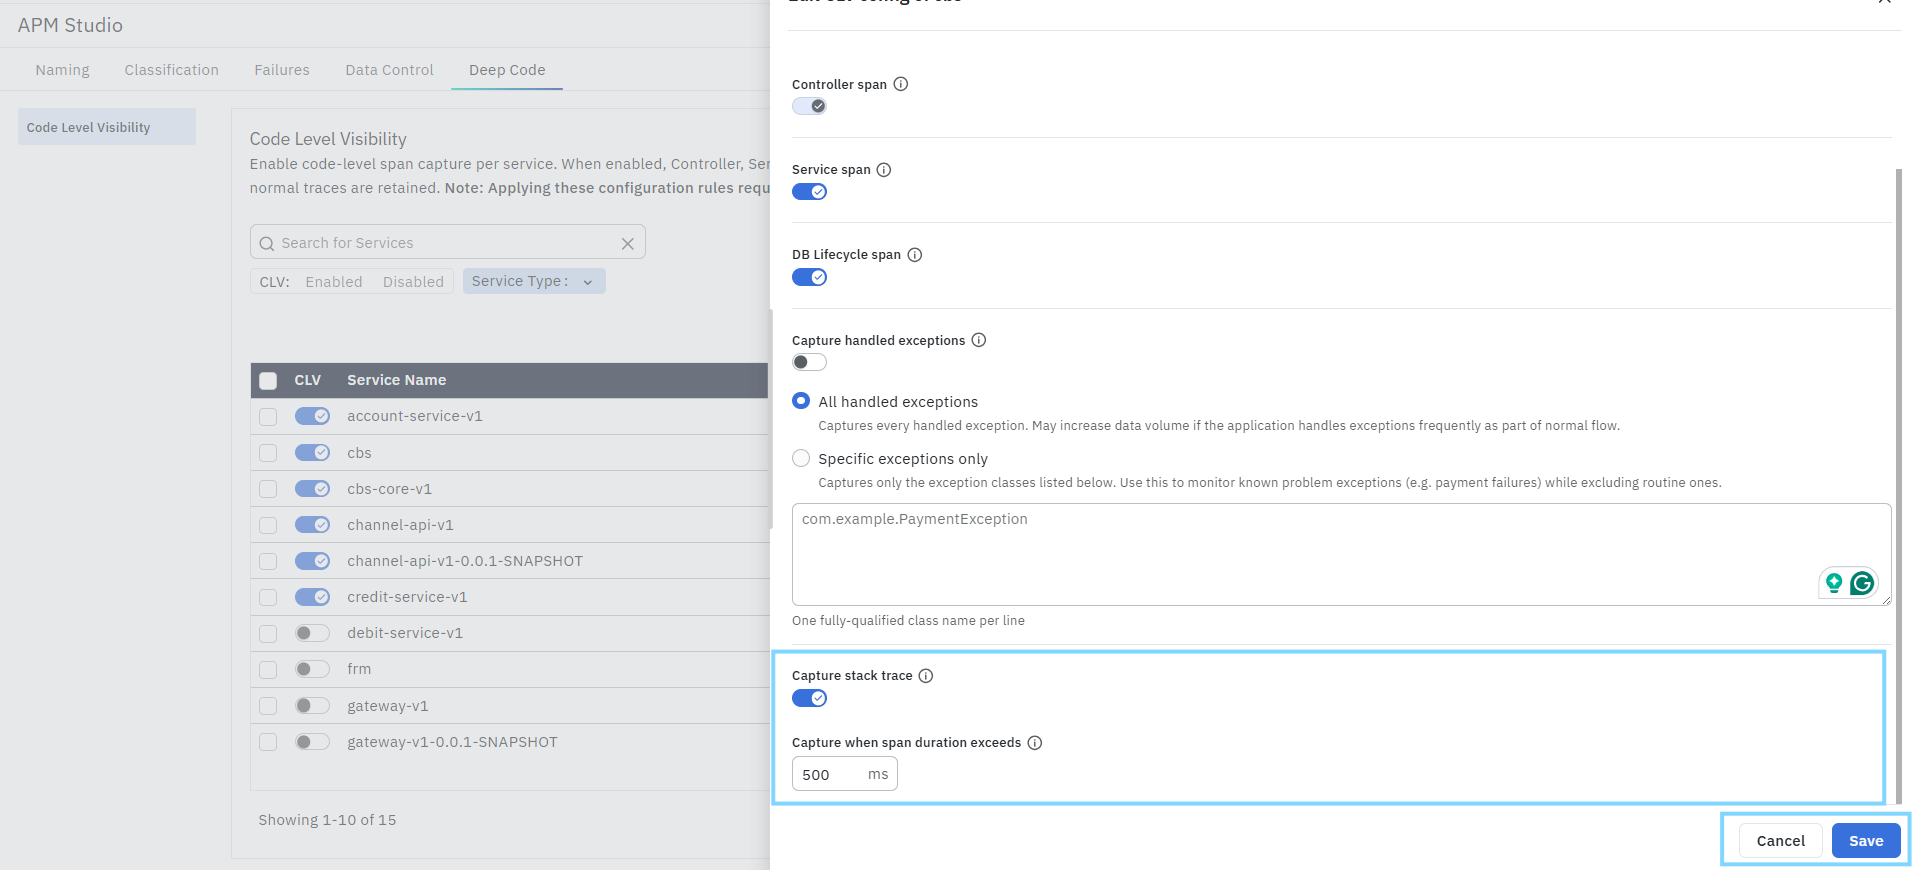
Capture When Span Duration Exceeds
Specifies the minimum span duration threshold (in milliseconds) for capturing stack traces. Stack traces are collected only for controller spans whose execution time exceeds the configured value.
- Click Save to apply the configuration.
- Restart the monitored service for the updated configuration to take effect.
Depending on the monitoring requirements, enabling additional capture options such as ORM spans, handled exceptions, or stack traces may increase the volume of collected telemetry data.
Verify the Configuration
After restarting the monitored service, verify that Code-Level Visibility is active.
To verify the configuration:
- Generate application traffic for the monitored service.
- Open Application Performance Monitoring (APM).
- Navigate to Trace Explorer.
- Open a recently captured trace for the configured service.
- Open Trace Details.
- Confirm that additional Controller, Service, ORM, Database Lifecycle, or Exception spans are displayed according to the selected configuration.
- If Stack Trace capture is enabled, verify that stack trace information is available for qualifying spans.
- Review SmartFrames to ensure additional execution information is available for analysis.
Newly enabled Code-Level Visibility applies only to traces generated after the monitored service is restarted.
Example Configurations
Example 1 – Java Spring Boot REST Service
Suppose you want to investigate slow REST APIs in a Spring Boot application.
Configure:
- Enable CLV
- Controller Span – Enabled
- Service Span – Enabled
- ORM Span – Enabled
- DB Lifecycle Span – Enabled
- Capture Handled Exceptions – Specific Exceptions Only
- Capture Stack Trace – Enabled
- Capture When Span Duration Exceeds – 500 ms
Result
APM captures:
- Controller execution
- Service layer execution
- Hibernate operations
- Database lifecycle spans
- Stack traces for slow requests
This configuration is recommended for production environments where detailed diagnostics are required only for slow requests.
Example 2 – High-Volume Microservice
For high-throughput services where minimizing telemetry overhead is important:
Configure:
- Enable CLV
- Controller Span – Enabled
- Service Span – Enabled
- ORM Span – Disabled
- DB Lifecycle Span – Disabled
- Capture Stack Trace – Disabled
- Capture Handled Exceptions – Disabled
Result
Only essential application execution spans are captured, reducing telemetry volume while maintaining visibility into request processing.
Analyze Code-Level Visibility Data
After Code-Level Visibility is enabled, the captured execution spans become available throughout APM.
You can analyze the captured information in:
- Trace Details to inspect the complete execution path of a request.
- Trace Waterfall to visualize Controller, Service, ORM, Database Lifecycle, and Exception spans in execution order.
- Span Details to review span attributes, execution duration, events, and stack traces.
- SmartFrames to correlate code-level execution with application performance metrics and business context.
- TraceMap to understand service interactions and identify where execution delays occur.
Together, these views provide end-to-end visibility into application execution and help identify performance bottlenecks, slow database operations, and application exceptions.
Bulk Actions
The Bulk Actions option allows administrators to enable or disable Code-Level Visibility for multiple services at once.
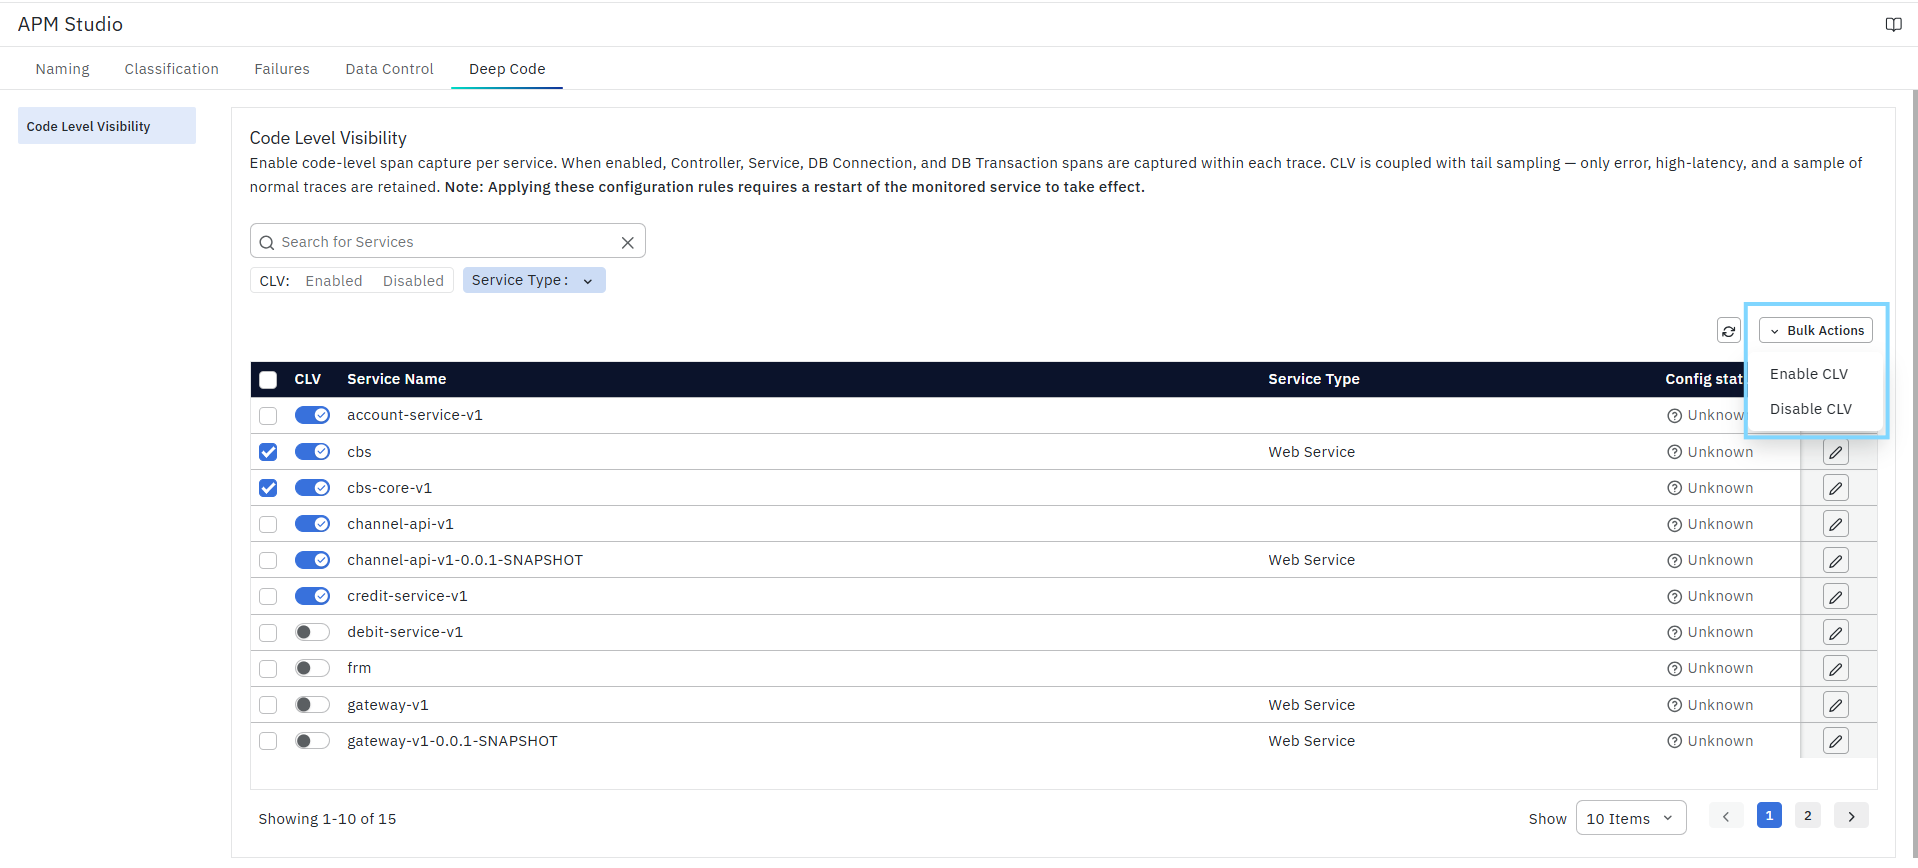
To perform a bulk operation:
- Select one or more services using the check boxes.
- Click Bulk Actions.
- Choose one of the following options:
- Enable CLV
- Disable CLV
- Confirm the operation.
- Restart the affected monitored services for the changes to take effect.
Sampling Policies
Code-Level Visibility uses tail sampling to determine which traces are retained for analysis. Sampling policies define how traces are evaluated after a request has completed and determine whether the trace should be retained or discarded.
- Pass-through policies are created automatically.
- They ensure services without any configured sampling policy still retain traces.
- They are automatically updated whenever policies are added, modified, or deleted.
- Users do not manage them manually.
Sampling policies are configured through the traces_collector O11ySource and are automatically applied to services where Code-Level Visibility is enabled.
Sampling States
Each service has a single control to enable or disable Code-Level Visibility. Depending on the configuration, sampling operates in one of the following states:
Sampling Disabled
Tail sampling is disabled for the service, and all traces generated by the service are retained without filtering.
Auto Disabled
Sampling is automatically disabled when no sampling policies are configured, or when an existing policy already retains all traces. In this case, filtering is skipped because it has no effect.
Sampling Enabled
Tail sampling evaluates every trace against the configured sampling policies before determining whether the trace should be retained.
Disabling sampling retains every trace generated by the service and is useful during troubleshooting when complete trace collection is required.
Sampling Policies
A sampling policy defines the conditions used to retain traces for one or more monitored services.
Each sampling policy consists of:
- Policy Name
- Scope
- Policy Type
- Match Criteria
Multiple sampling policies can be configured for a service to satisfy different monitoring requirements.
Policy Evaluation
- Each configured sampling policy evaluates every trace independently.
- A trace is retained if it matches any one configured sampling policy.
- A trace is discarded only when none of the configured sampling policies match it.
- Adding additional sampling policies increases the likelihood of retaining traces but never removes traces already retained by another matching policy.
Decision Wait
- Tail sampling evaluates traces only after the complete trace has been received.
- The collector waits for the configured decision window before evaluating the trace against the configured sampling policies. This ensures that complete execution information, including downstream spans and request latency, is available before making the sampling decision.
Code-Level Visibility and Sampling Policies
When Code-Level Visibility is enabled for a service, the platform automatically creates system-managed sampling policies for that service.
These policies retain:
- Error traces.
- High-latency traces.
- A sampled percentage of normal traces.
These policies are managed automatically by the platform and do not require manual configuration. These system-managed policies ensure that sufficient trace data is retained for effective code-level diagnostics without requiring additional manual configuration.
System-managed Policies
Sampling policies created automatically by Code-Level Visibility are managed by the platform.
These policies:
- Cannot be deleted from the user interface.
- Can be modified to adjust thresholds and sampling percentages according to monitoring requirements.
- Remain associated with the service while Code-Level Visibility is enabled.
Disabling Code-Level Visibility automatically removes the associated system-managed policies.
Automatic Pass-through Policy
- The platform automatically creates a pass-through policy for services that are not covered by any configured sampling policy.
- This system-generated policy ensures that traces from uncovered services continue to be retained until a user-defined sampling policy is configured.
- The pass-through policy is automatically updated whenever sampling policies are added, modified, or removed.
What Happens After the Steps
After you configure and save the required rules in APM Studio, the changes become active and are applied to incoming application trace data during processing.
Depending on the configured rule type, APM standardizes service, supporting service, request, and operation names, classifies critical services and requests, detects failures based on custom logic, and enriches or filters trace attributes. These configurations are reflected across APM dashboards, Service Maps, trace views, analytics, and troubleshooting workflows, providing more meaningful and business-relevant observability data.
Code-Level Visibility Best Practices
- Enable Controller and Service spans for all production applications to improve request-level visibility.
- Enable ORM and Database Lifecycle spans only when detailed database diagnostics are required.
- Capture handled exceptions selectively to avoid unnecessary telemetry volume.
- Configure stack trace capture with an appropriate duration threshold to reduce storage overhead.
- Review sampling policies before enabling Code-Level Visibility for high-throughput services.
- Validate the configuration using Trace Details after restarting the application.
- Use SmartFrames together with Trace Waterfall for comprehensive root cause analysis.
- Periodically review captured spans to ensure only relevant execution details are collected.
FAQs
Does enabling Code-Level Visibility automatically restart my application?
No. Restart the monitored application after saving the configuration.
Does enabling Code-Level Visibility affect existing traces?
No. Only newly generated traces include additional execution spans.
Where can I view Code-Level Visibility information?
You can analyze Code-Level Visibility information in:
- Trace Details
- Trace Waterfall
- Span Details
- SmartFrames
- TraceMap
Why don't I see Controller or Service spans?
Verify that the corresponding capture options are enabled and the monitored application has been restarted.
Can I enable Code-Level Visibility for multiple services?
Yes. Use Bulk Actions to enable or disable Code-Level Visibility for multiple services simultaneously.
Does Code-Level Visibility increase telemetry volume?
Yes. Additional execution spans increase the amount of trace data collected. Configure sampling policies appropriately for high-volume environments.
