APM Studio
Overview
APM Studio is the central configuration workspace in vuSmartMaps for defining how application trace data is interpreted, standardized, and enriched before it is used in APM Dashboards. It allows you to configure rules that improve the clarity, consistency, and usefulness of observability data by controlling how services, requests, failures, span attributes, and code-level visibility are identified and processed. With APM Studio, you can replace raw technical telemetry with business-meaningful context so that traces, service maps, dashboards, and troubleshooting views are easier to understand and act upon.
APM Studio is organized into five major areas: Naming, Classification, Failures, Data Control, and Deep Code. Together, these areas help standardize, interpret, enrich, and enhance application trace data for more meaningful monitoring and analysis. The Deep Code section extends application observability by enabling Code-Level Visibility, allowing you to configure the capture of additional execution spans for monitored services to support deeper performance analysis and troubleshooting. This helps ensure that APM data accurately reflects application behavior in real-world environments, making monitoring, root cause analysis, and troubleshooting more effective.
Why This Feature Is Useful
The purpose of APM Studio is to help you shape raw telemetry into clean, consistent, and business-relevant observability data. By default, application traces often contain technical names, generic failure signals, and low-value attributes that may not fully reflect how your application should be monitored. APM Studio allows you to define rules that improve this data before it is used across APM.
Use APM Studio to:
- Standardize how services and requests are named
- Classify critical services and requests for focused analysis
- Define failure logic that reflects actual application behavior
- Remove, mask, or retain attributes based on relevance
- Enrich spans with additional business and domain context
This makes APM data easier to read, more aligned with business workflows, and more useful for monitoring, troubleshooting, and analysis.
The rules configured in APM Studio directly influence how services, requests, failures, and attributes are displayed and interpreted across APM dashboards, service maps, trace views, and troubleshooting workflows. For more information on how these configurations are reflected in APM visualizations, see APM Dashboards.
Example Scenario
A retail organization observes that application traces contain technical service names, inconsistent request names, and unnecessary attributes, making troubleshooting difficult. The administrator uses APM Studio to configure custom naming rules, classify critical services, define failure detection rules, and remove unnecessary trace attributes.
After the configurations are applied, APM dashboards, Service Maps, and trace views display business-friendly service names, meaningful request names, accurate failure detection, and enriched trace data. This enables operations teams to identify issues faster and perform more effective root cause analysis.
How APM Studio Fits into APM
APM Studio acts as the configuration layer of Application Performance Monitoring (APM). While APM dashboards and analysis views display metrics, traces, and service relationships, APM Studio defines how that data is interpreted, structured, and enriched before it is visualized. The configurations created in APM Studio directly influence:
- Service names displayed in Service Maps and dashboards
- Request and operation naming across trace views
- Failure detection and error rates
- Service and request prioritization (Key vs Noise)
- Attributes available for filtering, correlation, and analysis
In simple terms:
- APM shows what is happening
- APM Studio defines how that data should be understood
For more information on how this data is visualized, refer to the APM documentation.
When to Use This Feature
Use APM Studio when:
- Service names appear inconsistent or too technical
- Request names are not meaningful for business workflows
- Failures are not accurately reflected based on application logic
- Dashboards contain noisy or low-value requests
- You need to enrich traces with business-specific attributes
- You want to prioritize critical services and transactions
APM Studio is typically used during:
- Initial APM onboarding
- Application architecture changes
- Performance tuning and observability improvements
- Incident analysis and RCA optimization
Step-by-Step Instructions
The typical workflow for using APM Studio is as follows:
- Ensure services are onboarded and trace data is available in APM
- Configure Naming rules to standardize services, requests, and operations
- Classify services and requests to highlight critical components
- Define Failure Detection rules to reflect real application behavior
- Apply Data Control rules to refine and enrich trace data
- Validate configurations using APM dashboards and trace views
- Iterate based on analysis and monitoring requirements
All changes made in APM Studio are reflected across APM dashboards, Service Maps, and trace analysis views.
For more information on how this data is visualized, refer to the APM documentation.
Prerequisites
Before using APM Studio, ensure that the required APM setup and service data are available in your environment.
Before You Begin
Make sure the following prerequisites are met:
- The required application or service is already onboarded to APM.
- The service is actively sending trace data to vuSmartMaps.
- You have the required access permissions to view and configure APM Studio.
- The relevant service appears in APM where rule configuration depends on service-level selection.
- The required telemetry attributes, request data, or method metadata are available for the rule type you want to configure.
- Some APM Studio features depend on the availability of incoming telemetry. If the required service, span, attribute, header, or payload data is not available, the related rule may not behave as expected.
- Custom Attribute rules are configured per service and depend on instrumentation support.
- Some Custom Attribute changes are applied through instrumentation updates and may take effect only after the target service restarts.
- Runtime support may vary depending on the selected custom attribute capture type.
Accessing APM Studio
Navigate to APM Studio
To access APM Studio in vuSmartMaps:
- From the left navigation menu, go to Observability Studios.
- In the Observability Studios page, select APM Studio.
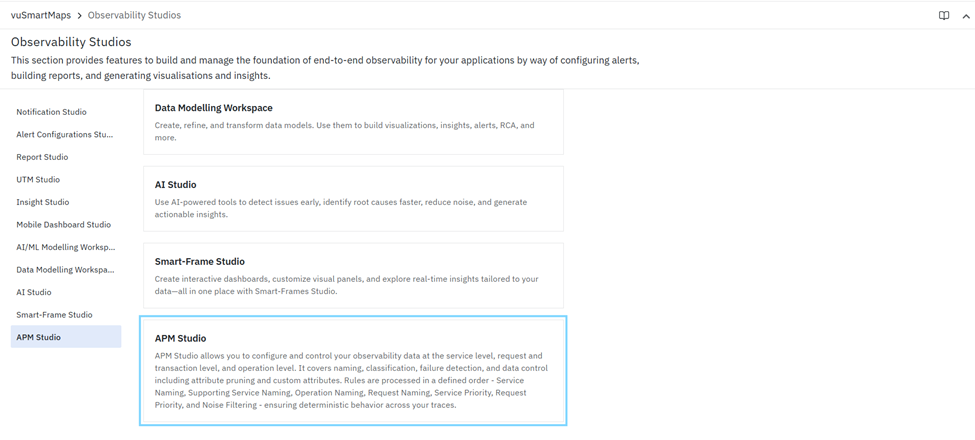
APM Studio opens the central workspace for configuring how application traces are identified, classified, interpreted, and controlled within APM.
Comprehensive Understanding
Overview
The APM Studio landing page is the primary configuration workspace for managing how trace data is interpreted in APM. It allows you to define rules that improve the clarity, consistency, and usefulness of APM data by controlling how services, requests, failures, attributes, and code-level visibility are processed before they appear in observability views.
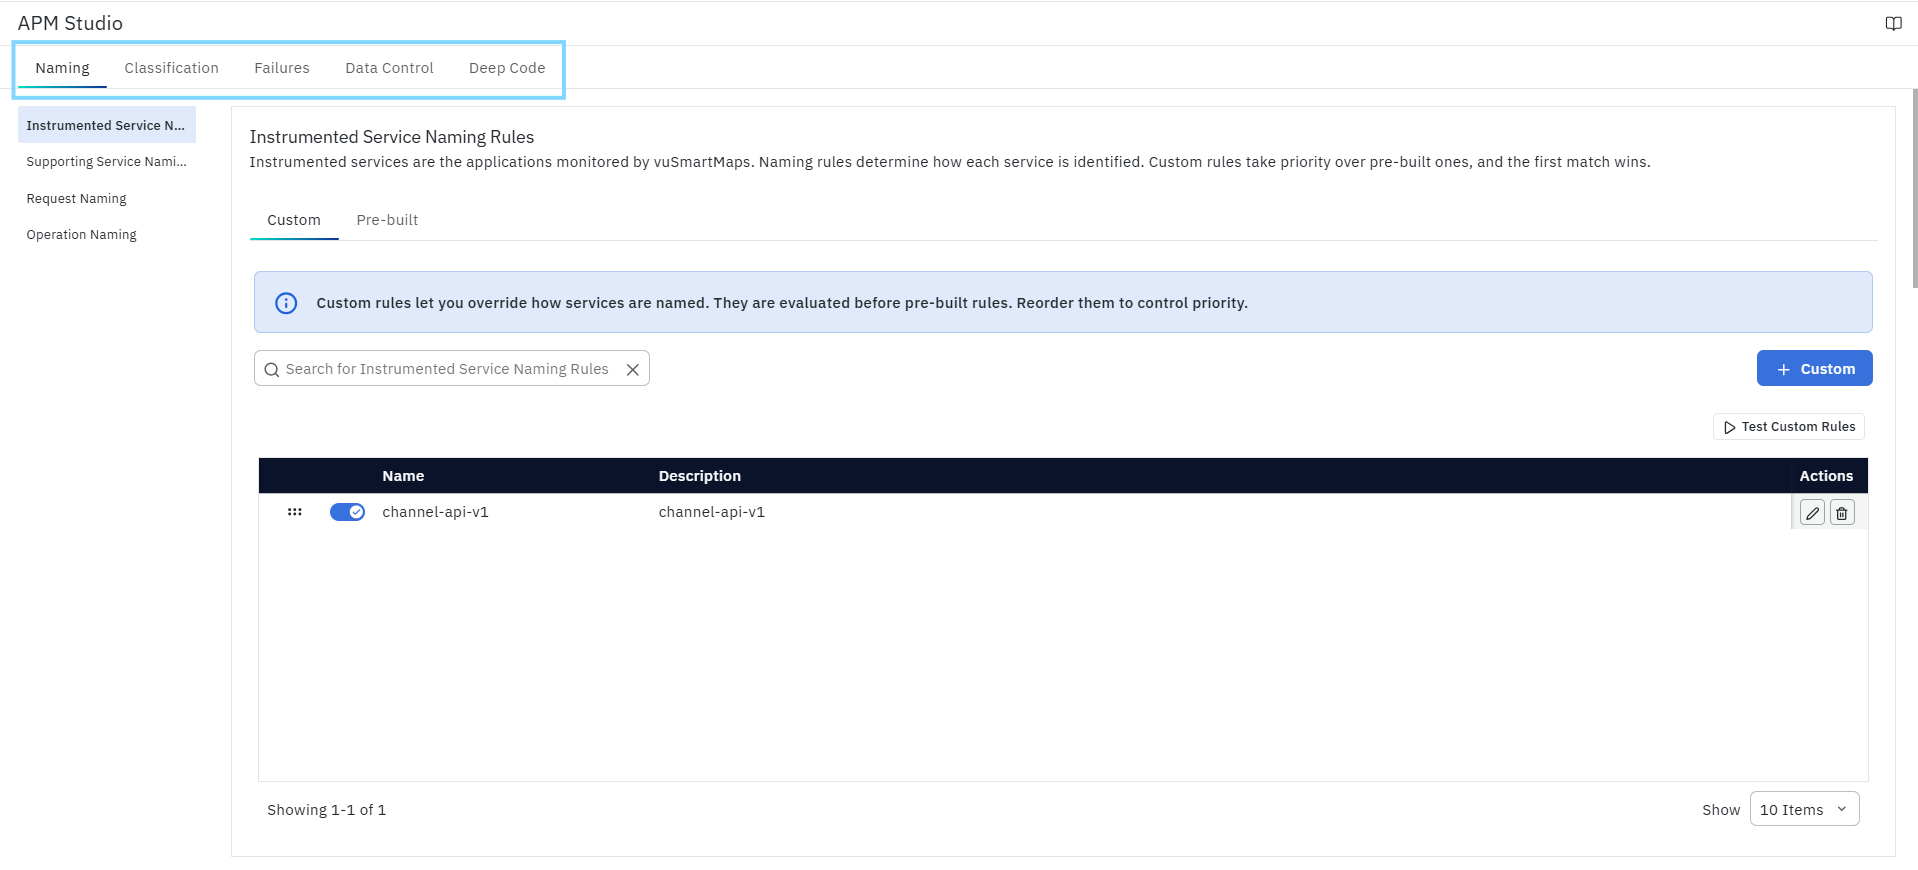
APM Studio is organized into five main sections:
These sections help standardize, enrich, and enhance trace data while providing deeper visibility into application execution. Together, they ensure that dashboards, service maps, request analysis, and troubleshooting views reflect meaningful, consistent, and actionable business context.
Sections Available in APM Studio
The Naming section is used to define how services, supporting services, requests, and operations are named in APM. It helps replace raw or technical telemetry values with cleaner, business-friendly names so that traces are easier to understand and analyze.
This section typically includes:
The Classification section is used to assign importance or business relevance to services and requests. It helps distinguish critical entities from less important or noisy ones, allowing teams to focus on the most meaningful components in their application flows.
This section typically includes:
The Failures section is used to define how failures are detected and interpreted in trace data. It allows you to configure rules that determine when requests or operations should be treated as failures based on status codes, exceptions, span status, or custom conditions. This helps ensure that failure analysis in APM reflects your application’s actual error logic instead of relying only on default telemetry behavior.
The Data Control section is used to manage which trace attributes are retained, removed, masked, enriched, or sampled before they are processed by APM. It helps control data quality, reduce noise, protect sensitive information, and capture additional business context required for analysis.
This section typically includes:
The Deep Code section is used to configure Code-Level Visibility (CLV) for monitored services in APM. It allows you to enable and manage the capture of additional code-level execution details, providing deeper visibility into application processing for performance analysis and troubleshooting.
This section typically includes:
Supported OTTL Functions and Operators
Application Performance Monitoring (APM) Studio uses the OpenTelemetry Transformation Language (OTTL) to evaluate rule conditions and generate dynamic values for naming and failure detection. OTTL enables you to define rule logic using telemetry attributes, resource attributes, operators, and supported functions.
Although OTTL provides many functions, APM Studio currently supports only a predefined subset. When creating or modifying rules, use only the supported functions and operators described in this section. The supported OTTL syntax described in this section applies to all APM Studio features that use OTTL expressions, including Naming rules and Failure Detection rules.
The configuration editor currently validates against the complete OpenTelemetry OTTL grammar. As a result, unsupported functions may be accepted while creating a rule but can fail when the configuration is deployed. To avoid deployment failures, use only the functions and operators documented in this section.
Supported Functions
Functions are predefined operations that help evaluate conditions or generate dynamic values while creating naming and failure detection rules. Depending on the rule type, functions can be used to compare attribute values, construct names, or transform existing values before they are stored.
The following functions are currently supported in APM Studio.
| Function | Used in | What it does |
|---|---|---|
| IsMatch(field, "regex") | Condition | Tests whether a field’s value matches a regular expression. Returns true/false. Example: IsMatch(attributes["http.route"], ".*/upi/.*") |
| Concat([part1, part2, ...], "separator") | Name Template | Joins multiple parts (quoted literals and/or attribute references) into one string, placing separator between each part. Example: Concat(["gRPC ", attributes["rpc.service"], ".", attributes["rpc.method"]], "") |
| replace_pattern(attribute, "regex", "replacement") | Name Template | Finds the part of an attribute’s value that matches regex and replaces just that part, leaving the rest of the value unchanged. Example: replace_pattern(attributes["transaction.name"], "/([0-9]+)", "/{id}") |
| replace_match(attribute, "glob", "replacement") | Name Template | If the attribute’s entire value matches the glob pattern (only * is a wildcard), replaces the whole value with replacement. Example: replace_match(attributes["transaction.name"], "GET /api/accounts/*/transfers/*", "GET /api/accounts/{accountId}/transfers/{transferId}") |
Example:
Concat(attributes["http.request.method"], " ", attributes["http.route"])
Supported Operators
Operators define the logical and comparison conditions used to evaluate telemetry data. They allow you to compare values, combine multiple conditions, check whether an attribute exists, and control the order in which expressions are evaluated.
The following operators are supported when writing OTTL conditions.
| Operator | Meaning |
|---|---|
| and | Logical AND — both sides must be true |
| or | Logical OR — either side must be true |
| not | Logical NOT — negates the following expression |
| == | Equals |
| != | Not equals |
| >, >= | Greater than / greater than or equal (numbers) |
| <, <= | Less than / less than or equal (numbers) |
| != nil | Field is present / has a value |
| == nil | Field is absent / has no value |
| ( ... ) | Parentheses for grouping, to control evaluation order |
Use parentheses to explicitly control evaluation order when combining multiple conditions.
Example:
attributes["http.status_code"] >= 500
Supported Fields
Fields represent the telemetry information that can be referenced while evaluating conditions or constructing naming templates. These fields provide access to span attributes, resource attributes, span metadata, and instrumentation information.
The following field references are supported in APM Studio.
| Field | Refers to |
|---|---|
| attributes["key"] | A span attribute, e.g. attributes["http.route"] |
| resource.attributes["key"] | A resource attribute, e.g. resource.attributes["service.name"] |
| kind | The span kind (see Span Kind values below) |
| parent_span_id | The span’s parent ID — use with == nil to check “is this a root span” |
| name | The span’s own name |
| status.code | The span’s status code (numeric) |
| instrumentation_scope.name | The instrumentation library/scope name |
Example:
attributes["http.route"]
Supported Span Kind Values
The kind field identifies the role played by a span during a request or transaction. You can compare the kind field with one of the supported span kind values when defining rule conditions.
The following span kinds are supported.
| Span Kind | Description |
|---|---|
SPAN_KIND_SERVER | Represents a server-side request. |
SPAN_KIND_CLIENT | Represents an outgoing client request. |
SPAN_KIND_CONSUMER | Represents a message consumer. |
SPAN_KIND_PRODUCER | Represents a message producer. |
SPAN_KIND_INTERNAL | Represents an internal operation within a service. |
Example:
kind == SPAN_KIND_SERVER
Example Expressions
Include a few practical examples like:
kind == SPAN_KIND_SERVER and attributes["http.route"] != nil

IsMatch(attributes["http.route"], "^/api/v1/.*")

Concat([attributes["http.request.method"], " ", attributes["http.route"]], "")

replace_pattern(attributes["transaction.name"], "/([0-9]+)", "/{id}")
Known Limitation
The configuration editor currently validates against the complete OpenTelemetry OTTL grammar rather than the subset supported by APM Studio. As a result, unsupported functions may be accepted during configuration but can fail when the collector loads the configuration. Until editor validation is updated, use only the supported functions and operators documented in this guide.
What Happens After the Steps
After you configure and save the required rules in APM Studio, the changes become active and are applied to incoming application trace data during processing.
Depending on the configured rule type, APM standardizes service, supporting service, request, and operation names, classifies critical services and requests, detects failures based on custom logic, and enriches or filters trace attributes. These configurations are reflected across APM dashboards, Service Maps, trace views, analytics, and troubleshooting workflows, providing more meaningful and business-relevant observability data.
This version is concise, consistent with your other chapters, and covers all four sections of APM Studio—Naming, Classification, Failures, and Data Control—without going into unnecessary detail.
Tips and Best Practices
- Configure naming rules before creating classification or failure detection rules to maintain consistent service identification.
- Use meaningful and descriptive rule names to simplify future maintenance.
- Test custom rules before saving to verify the expected output.
- Use specific and stable telemetry attributes when defining rule conditions.
- Review rule priority regularly, as custom rules are evaluated in order and the first matching rule is applied.
- Remove or disable obsolete rules to avoid unnecessary processing and configuration complexity.
- Validate the applied changes using APM dashboards and trace views after configuration.
Troubleshooting
-
Issue: Unable to create or save an APM Studio rule.
- Possible Cause: Required fields or rule configuration are incomplete.
- Solution: Verify that all mandatory fields, conditions, and templates are configured before saving the rule.
-
Issue: The configured rule is not applied.
- Possible Cause: Rule conditions do not match the incoming telemetry or another higher-priority rule is matched first.
- Solution: Review the rule conditions, evaluation order, and use Test this Rule to validate the configuration.
-
Issue: Service or request names are not updated.
- Possible Cause: Incoming telemetry does not satisfy the configured naming conditions.
- Solution: Verify that the required telemetry attributes are available and that the rule conditions match the incoming trace data.
-
Issue: Failure detection results are incorrect.
- Possible Cause: Failure detection conditions or error definitions are configured incorrectly.
- Solution: Review the configured failure rules and validate the selected error definitions before saving.
-
Issue: Custom attributes are not visible in APM.
- Possible Cause: Required telemetry attributes are unavailable or instrumentation changes have not taken effect.
- Solution: Verify the instrumentation configuration and ensure the required telemetry data is being collected.
-
Issue: Changes are not reflected in APM dashboards or Service Maps.
- Possible Cause: New telemetry matching the configured rules has not been received.
- Solution: Verify that the application is sending trace data and allow new telemetry to be processed after saving the configuration.
-
Issue: Code-Level Visibility spans are not visible.
- Possible Cause: CLV is disabled for the service.
- Solution: Verify that Code-Level Visibility is enabled and restart the monitored service.
-
Issue: Only standard trace spans are visible.
- Possible Cause: The application has not been restarted.
- Solution: Restart the monitored service and generate new application traffic.
-
Issue: Stack traces are not displayed.
- Possible Cause: Capture Stack Trace is disabled or the configured duration threshold has not been exceeded.
- Solution: Enable Capture Stack Trace or reduce the minimum duration threshold.
-
Issue: ORM spans are missing.
- Possible Cause: ORM Span capture is disabled.
- Solution: Enable ORM Span and restart the service.
-
Issue: Database Lifecycle spans are missing.
- Possible Cause: Database Lifecycle Span is disabled.
- Solution: Enable DB Lifecycle Span.
-
Issue: Handled exceptions are not captured.
- Possible Cause: Handled Exception capture is disabled or the exception type is not configured.
- Solution: Enable handled exception capture and verify the configured exception classes.
-
Issue: No additional spans are generated.
- Possible Cause: The application instrumentation does not support Code-Level Visibility.
- Solution: Verify that the application is instrumented with a supported runtime and that code-level instrumentation is enabled.
FAQs
What is APM Studio?
APM Studio is the centralized configuration workspace used to standardize, classify, enrich, and control application trace data before it is displayed across APM dashboards, Service Maps, and trace analysis views.
When should I use APM Studio?
Use APM Studio when you need to customize service naming, classify critical services or requests, define failure detection logic, or control the trace attributes available for analysis.
How does APM Studio improve Application Performance Monitoring?
APM Studio transforms raw telemetry into meaningful business context, making dashboards, traces, and troubleshooting views easier to understand and analyze.
Do configuration changes take effect immediately?
Configuration changes are applied to newly processed telemetry after the rules are saved and activated.
Which areas can be configured in APM Studio?
APM Studio provides configuration capabilities for Naming, Classification, Failure Detection, and Data Control.
