Anomaly Detection
Overview
Modern systems generate thousands of metrics, logs, and traces every second. Within this continuous stream of data lie signals indicating whether systems are operating normally or something unusual is occurring.
A simple real-world example is a car dashboard. While driving, you expect indicators such as engine temperature, fuel consumption, and speed to remain within normal ranges. If the engine temperature suddenly spikes or fuel consumption becomes unusually high, it may indicate an underlying problem that requires attention. Similarly, in software systems, metrics typically follow expected patterns, and unusual deviations often signal potential issues.
Anomaly Detection identifies unusual patterns or deviations in a metric by comparing current behavior against a baseline learned from historical data. An anomaly may represent:
- A sudden spike in error rates or failed API calls
- A drop in application response time or throughput
- Abnormal behavior in critical system metrics, such as CPU or memory usage
Detecting anomalies early is critical, as they often signal underlying issues that can impact system reliability, customer experience, and business outcomes.
vuSmartMaps Approach to Anomaly Detection
vuSmartMaps enhances anomaly detection by using forecast-based adaptive models instead of relying on fixed thresholds. These models learn from historical metric behavior, automatically identify recurring patterns such as daily or weekly trends, and continuously adjust their expected operating ranges as system behavior changes. By comparing real-time values against these dynamically learned expectations, vuSmartMaps can identify unusual deviations as anomalies without requiring constant manual threshold tuning. This adaptive approach helps reduce false positives while improving the detection of meaningful issues.
Key capabilities of anomaly detection in vuSmartMaps include:
- Real-time monitoring: Continuously analyzes incoming metric data (including application, infrastructure, and trace metrics) to detect unusual behavior as it occurs.
- Adaptive learning: Learns and updates what “normal” looks like over time, accounting for trends and recurring patterns.
- Configurable detectors: Allows users to create detectors using default settings for quick setup or advanced configurations for fine-tuned control.
- Actionable insights: Correlates detected anomalies with related metrics, dashboards, and alerts to help teams investigate and resolve issues faster.
How Anomaly Detection Works
The anomaly detection engine follows the process below:
- Historical metric data is collected.
- The system learns normal behavior patterns.
- Seasonality and recurring trends are identified.
- Forecast models generate expected future values.
- Incoming real-time data is continuously compared against expected values.
- Deviations outside the expected range are classified as anomalies.
- Detected anomalies are stored and correlated with related metrics.
- Anomalies become available in Anomaly Explorer for investigation and root cause analysis.
Why This Feature Is Useful
- Proactive Incident Response: Identify issues before they escalate into outages. For example, if response times begin to degrade, anomaly detection can flag the issue early—allowing teams to take corrective action before customers are impacted.
- Reduced MTTD and MTTR: Anomalies are presented with clear context, helping teams quickly identify where and why an issue occurred. This reduces Mean Time to Detect (MTTD) and Mean Time to Resolve (MTTR).
- Improved Operational Efficiency: Traditional threshold-based monitoring often generates excessive false alerts. vuSmartMaps minimizes this noise through adaptive learning, enabling teams to focus on real issues instead of chasing false positives.
- Scalability Across Complex Environments: Seamlessly monitors thousands of metrics across microservices, containers, and cloud environments without requiring manual tuning for each metric.
- Enhanced Service Reliability: By detecting performance degradation and abnormal behavior early, organizations can maintain SLAs more consistently and deliver a more reliable user experience.
- Contextual and Actionable Insights: Anomalies are not viewed in isolation. vuSmartMaps correlates anomalies with related metrics, dashboards, and alerts—helping teams understand not just what went wrong, but also the broader impact, enabling faster and more effective resolution.
Example
Consider an online banking application that typically processes transactions smoothly throughout the day. If transaction failures suddenly increase while successful transactions decrease, vuSmartMaps can detect this unusual behavior based on learned historical patterns. Operations teams can investigate the issue early, identify the underlying cause, and take corrective action before it impacts a larger number of customers or leads to a service disruption.
When to Use This Feature
Anomaly Detection in vuSmartMaps is typically used in the following scenarios:
- Alerting: Detected anomalies can be linked to alerting mechanisms to notify teams when abnormal behavior occurs.
- Monitoring Dashboards: Anomalies are visualized in dashboards to help track system health and performance trends.
- Root Cause Analysis: Users can investigate anomalies across metrics, applications, journeys, and observability sources to identify underlying issues.
- Correlation Analysis: Multiple anomalies can be analyzed together in the Correlation View to understand cross-metric dependencies and system-wide impact.
End-to-End Workflow
A typical workflow for using Anomaly Detection in vuSmartMaps is:
- Create a Detector: Configure anomaly detection for a specific metric using a data model, metric, and dimension.
- Monitor Anomalies: The system continuously monitors incoming data and detects anomalies automatically.
- Explore Anomalies: Use the Anomaly Explorer to view summaries, trends, and affected components.
- Investigate Issues: Drill down into Metric, Journey, Application, or O11ySource views to analyze anomalies in detail.
- Correlate Anomalies: Use the Correlation View to identify relationships across multiple metrics.
- Take Action: Use insights to troubleshoot issues, optimize performance, or configure alerts.
How to Configure and Use Anomaly Detection in vuSmartMaps
Anomaly detection in vuSmartMaps is organized into two primary areas:
- Anomaly Detection: This is where you configure anomaly detectors. Users can define the data to monitor, select metrics and dimensions, set sensitivity levels, and customize detection behavior using default or advanced settings.
- Anomaly Explorer: This is where you analyze detected anomalies. Users can explore patterns, visualize abnormal behavior over time, and gain insights to support root cause analysis.
Together, these modules support a typical anomaly detection workflow. Users first create and manage anomaly detectors in the Anomaly Detection workspace. Once anomalies are identified, they can use the Anomaly Explorer to investigate anomalous behavior, analyze affected metrics and entities, and perform deeper root cause analysis.
Anomaly Detection
Anomaly Detection in vuSmartMaps enables you to proactively identify unusual behavior across your applications, services, and infrastructure. Instead of relying on static thresholds, it uses AI-driven models that continuously learn from historical data and adapt to changing patterns. This approach helps detect issues early, minimize false positives, and provide meaningful insights that support faster and more effective root cause analysis.
Accessing Anomaly Detection
-
The Anomaly Detection workspace in vuSmartMaps can be accessed from the left navigation menu (Observability Studios > AI Studio > Anomaly Detection ).
-
Upon clicking Anomaly Detection, you are taken to the Anomaly Detection landing page.
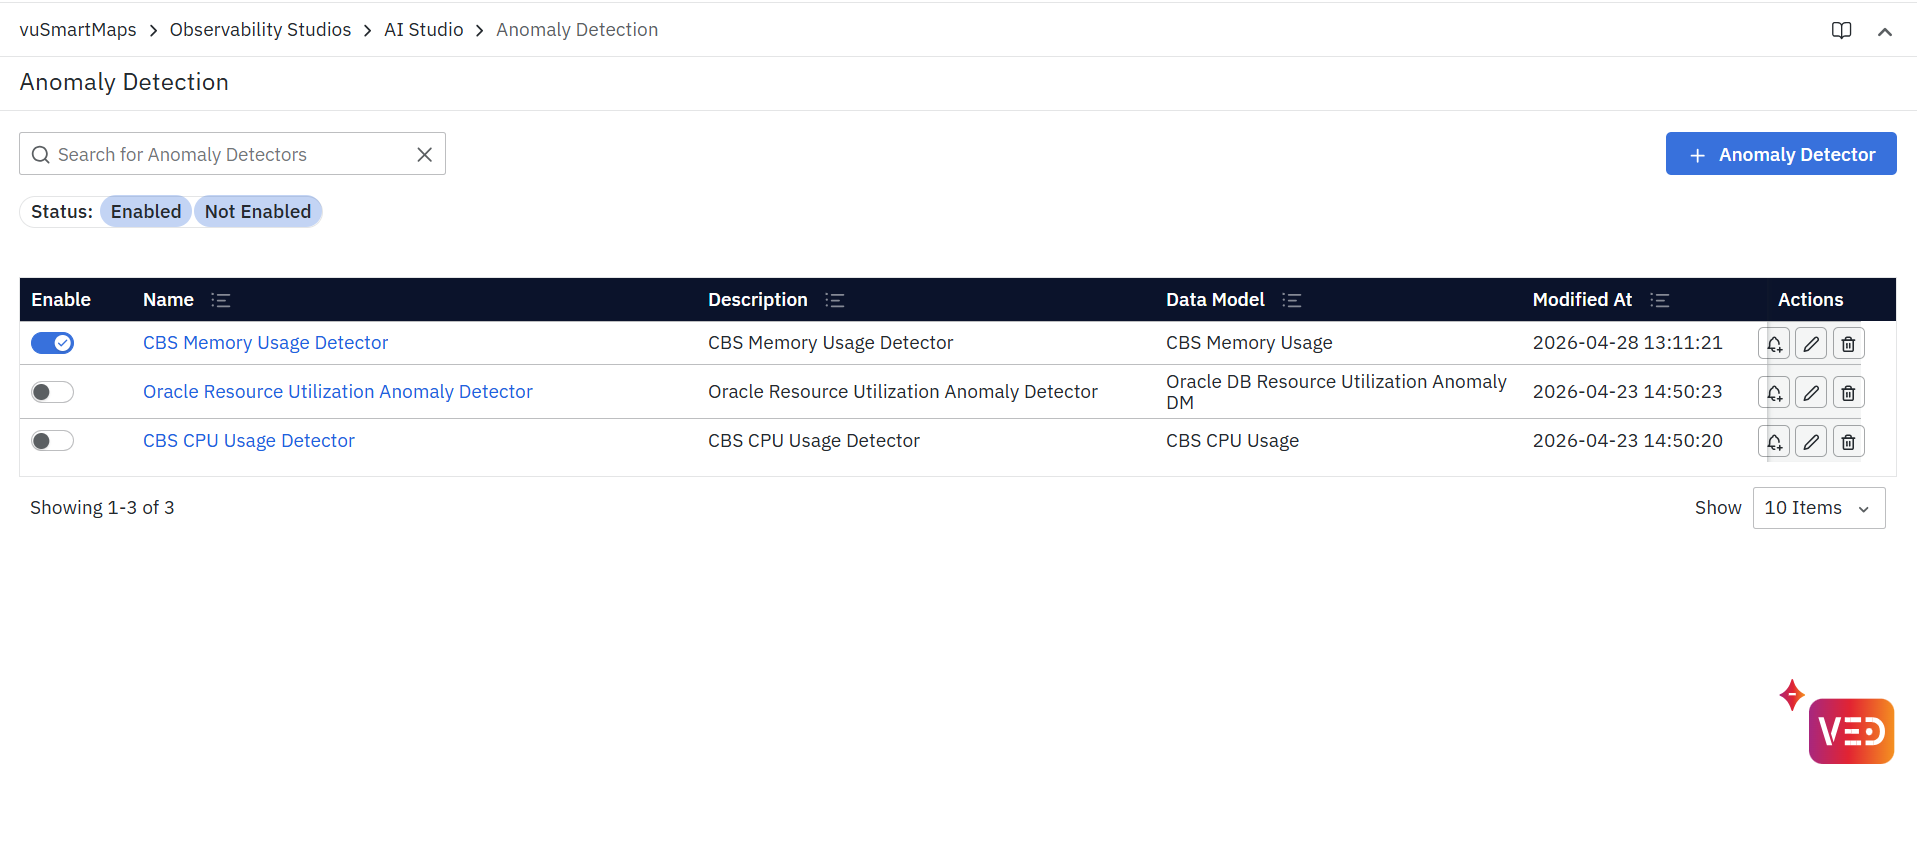
Landing Page
All anomaly detectors created in the system are listed here. The landing page provides a table view where you can:
- Search for anomaly detectors using the search bar.
- Filter detectors by status (Enabled or Not Enabled).
- View key details of each detector, such as:
- Enable: Toggle to activate or pause the detector. Enabled detectors monitor data; disabled ones stay inactive but are not deleted.
- Name: Title of the detector. This is a clickable link; selecting it opens a preview showing the detector’s configuration details.
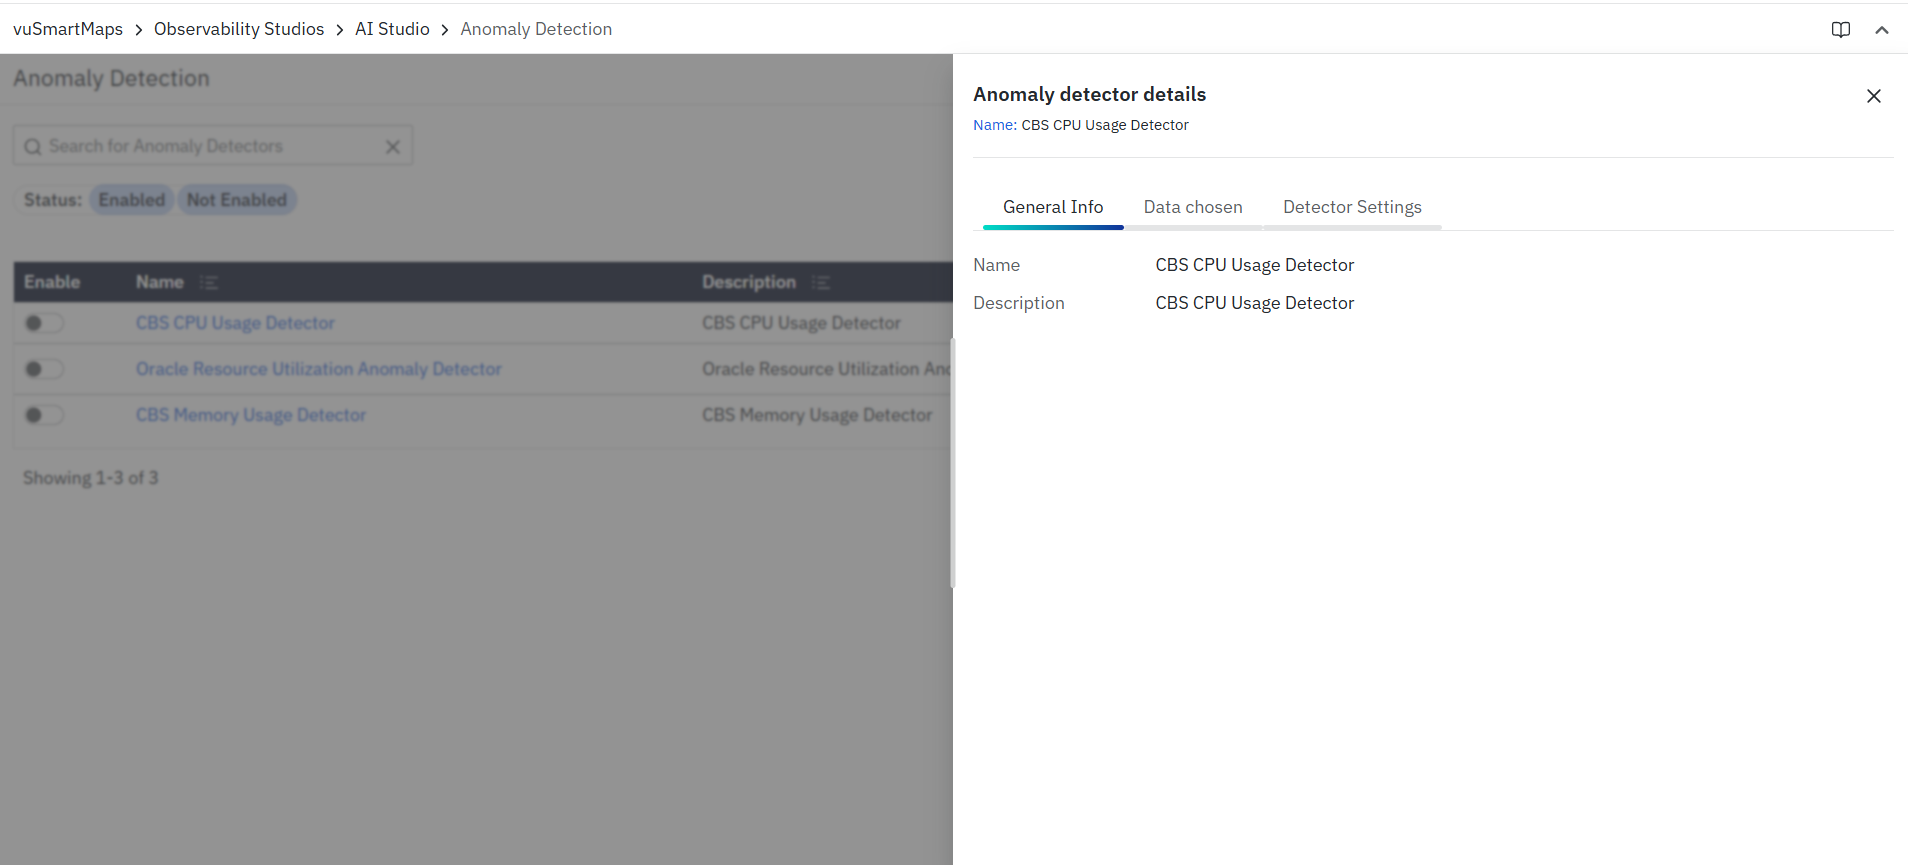
- Description: purpose of the detector.
- Data Model: the associated data source being monitored.
- Modified At: the last updated date and time.
- Perform quick actions from the Actions column, including:
- Create a New Alert for the detector
- Edit a detector
- Delete a detector
- Create new detector: Click + Anomaly Detector to create a new detector.
This workspace provides a centralized view of all anomaly detection configurations, making it easier for users to manage, monitor, and refine detectors as needed.
Actions
The Actions column provides quick options to manage each anomaly detector:
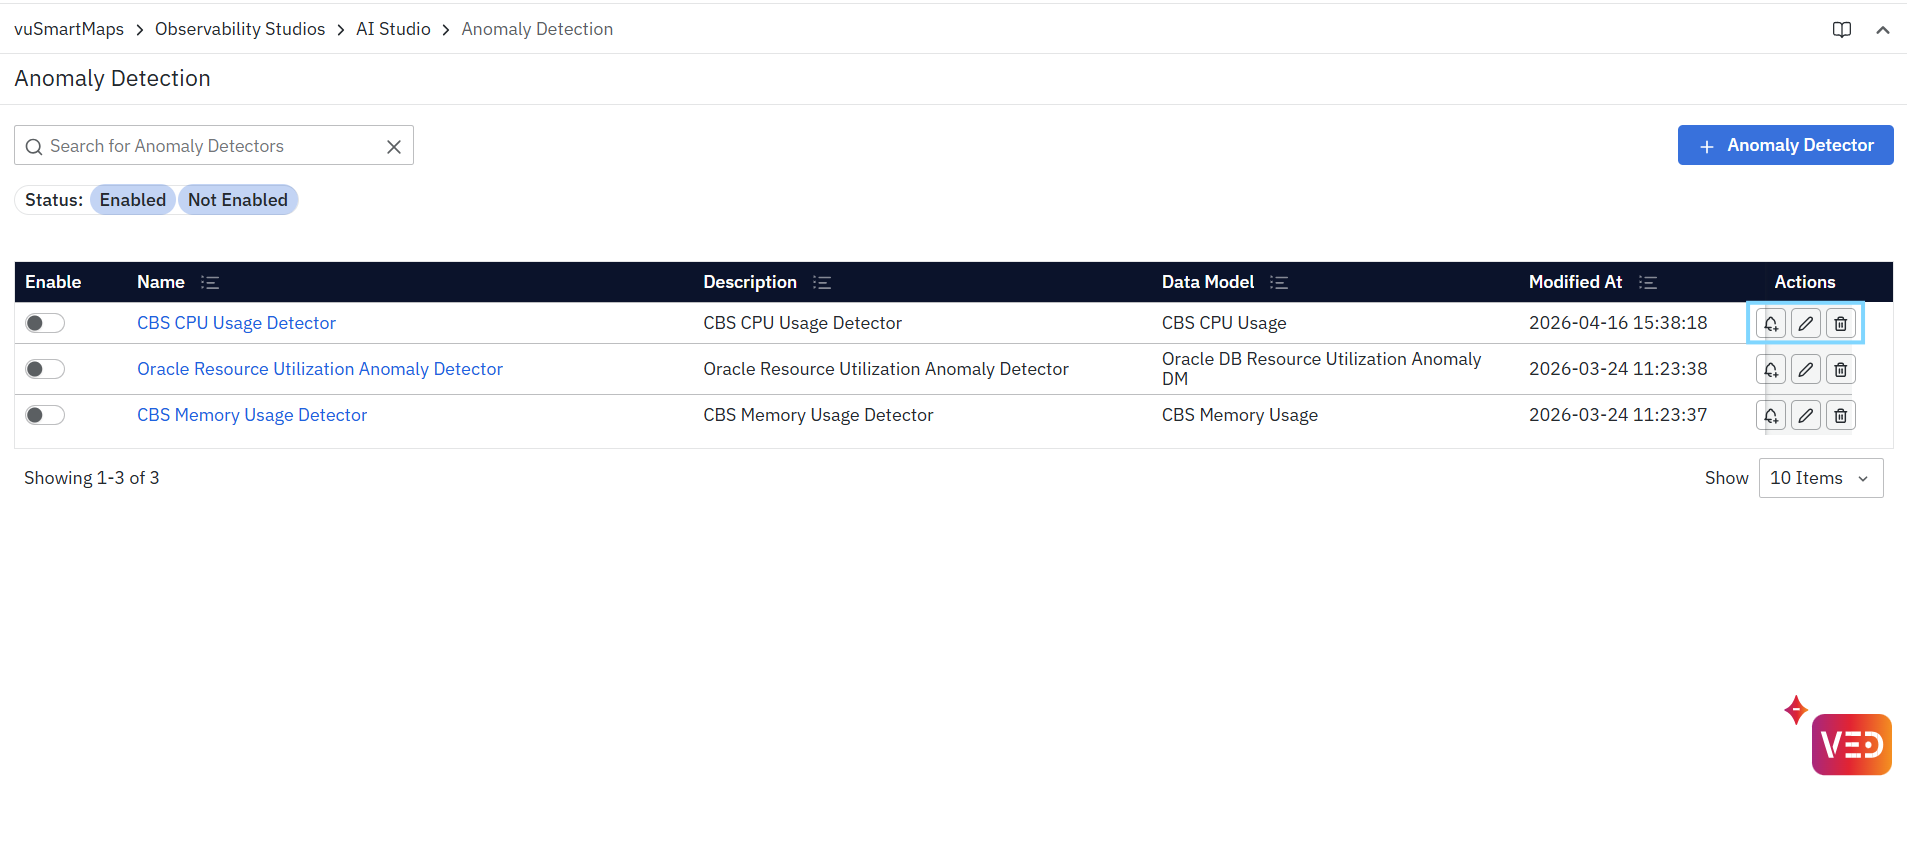
- Alert: Connect the detector to one or more alert channels (such as Email, Teams, or Slack). This ensures notifications are automatically sent whenever an anomaly is detected.
- Edit – Open the detector in edit mode to update its configuration. You can modify:
- General Info: Basic details like name and description.
- Data Chosen: The data model or metrics linked to the detector.
- Detector Settings: Configure type, seasonality, sensitivity, data frequency, and advanced options to control detection behavior.
- Delete: Permanently remove the detector from the system. Once deleted, it cannot be recovered.
Step-by-Step Instructions
To create and use anomaly detection:
- Navigate to Observability Studios → AI Studio → Anomaly Detection.
- Click + Anomaly Detector.
- Enter detector name and description.
- Select the required Data Model.
- Select the Metric to monitor.
- Choose the Dimension for grouping.
- Configure detector settings.
- Select seasonality and sensitivity.
- Configure advanced settings if required.
- Save the detector.
- Enable the detector.
- Allow the system to learn historical patterns.
- Monitor detected anomalies in Anomaly Explorer.
- Investigate anomalies through Metric, Journey, Application, or O11ySource views.
- Configure alerts if automated notification is required.
Creating a New Anomaly Detector
To create a new anomaly detector, click the + Anomaly Detector button on the Anomaly Detection listing page.
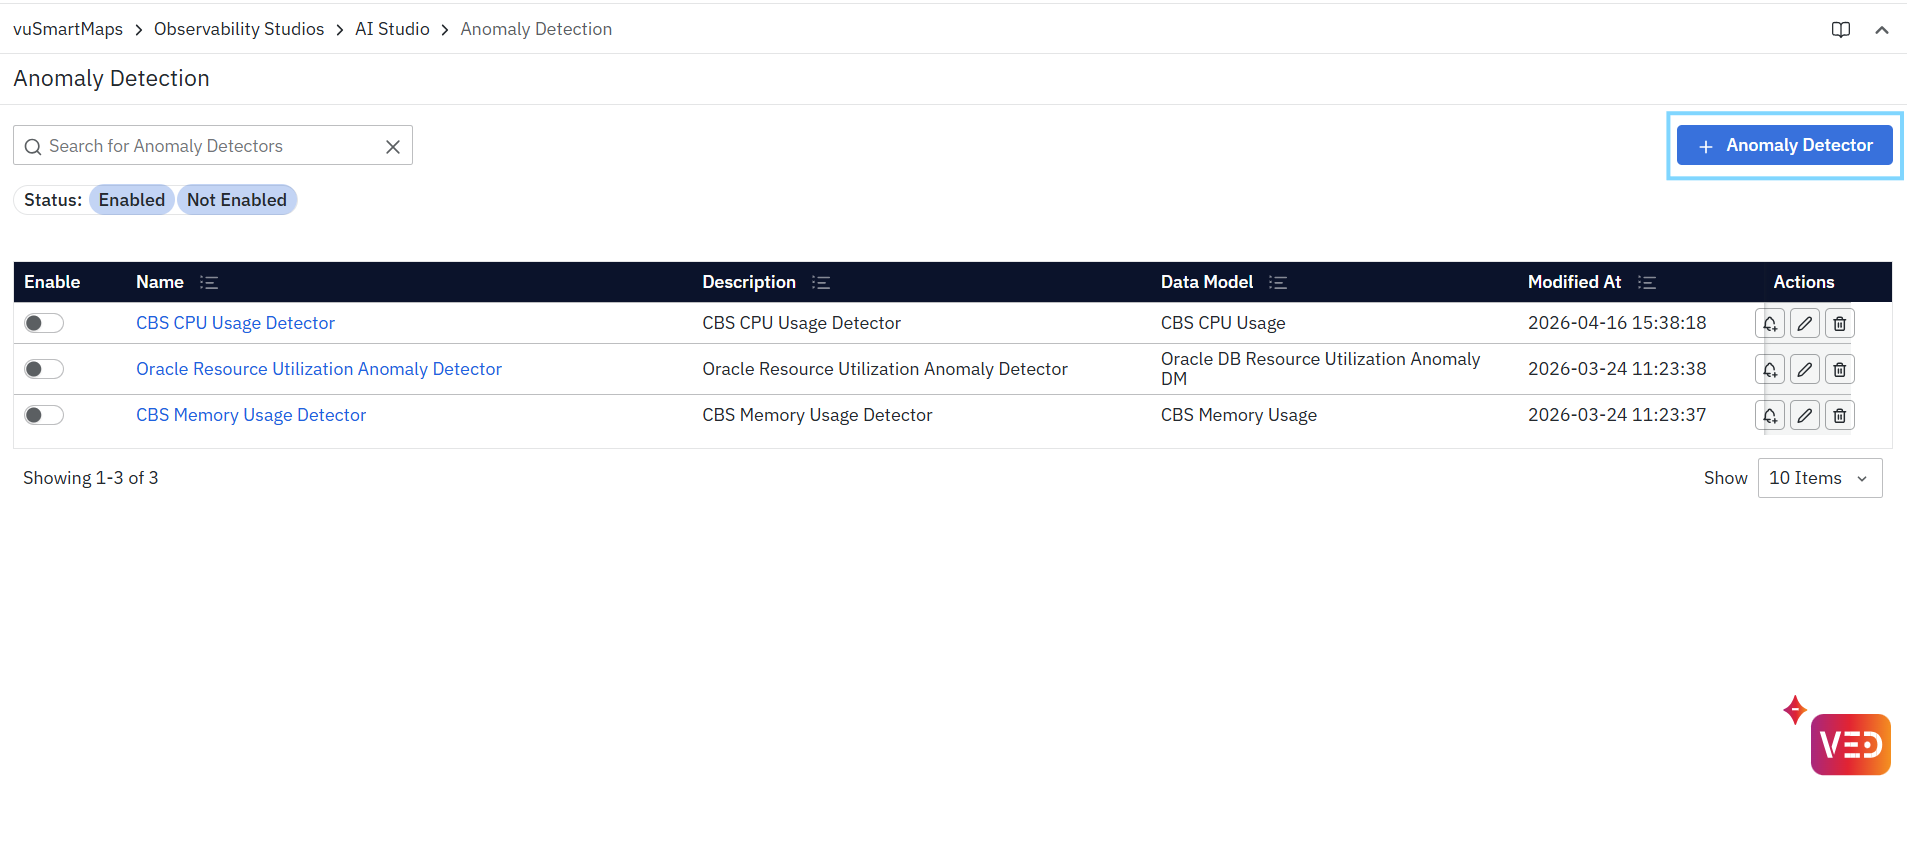
Step 1: General Info
When creating a new anomaly detector, you’ll first provide some basic information:
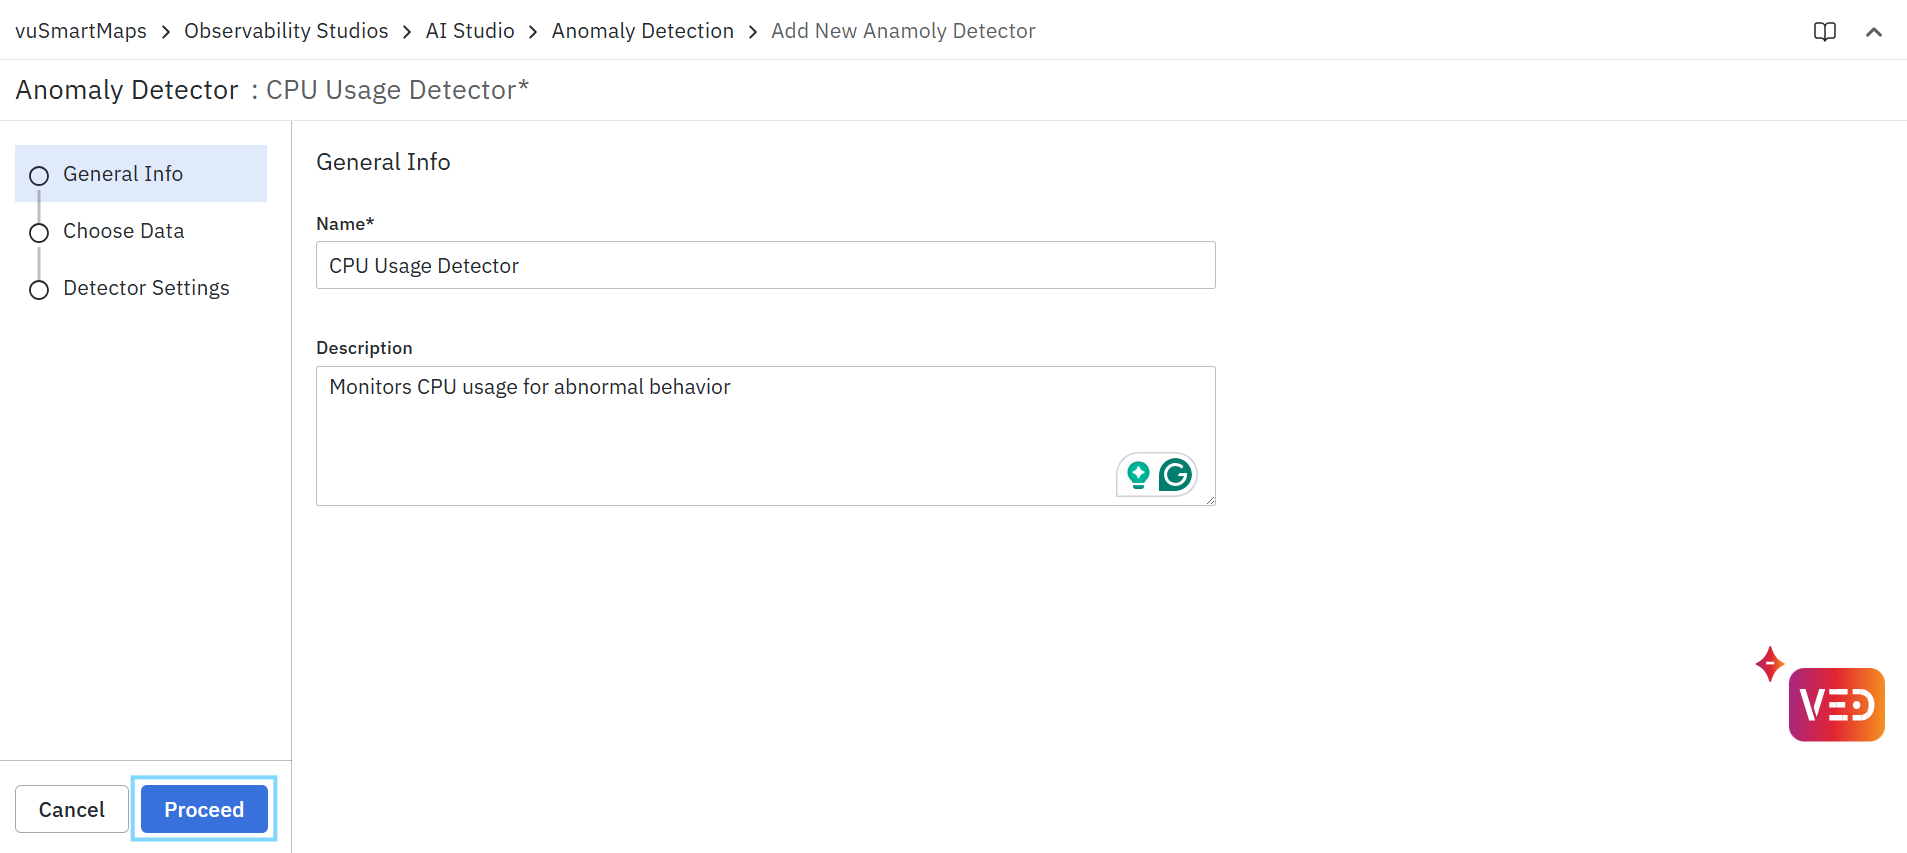
- Name: Enter a clear and descriptive title for the detector. This helps identify it easily in the listing page.
- Description: Add additional context about what the detector is monitoring (e.g., CPU usage, memory, response times).
Example
- Name: CPU Usage Detector
- Description: Monitors CPU usage for abnormal behavior
Once the details are filled in, click Proceed to continue to the next step.
Step 2: Choose Data
In this step, you select the data on which anomaly detection will be performed.
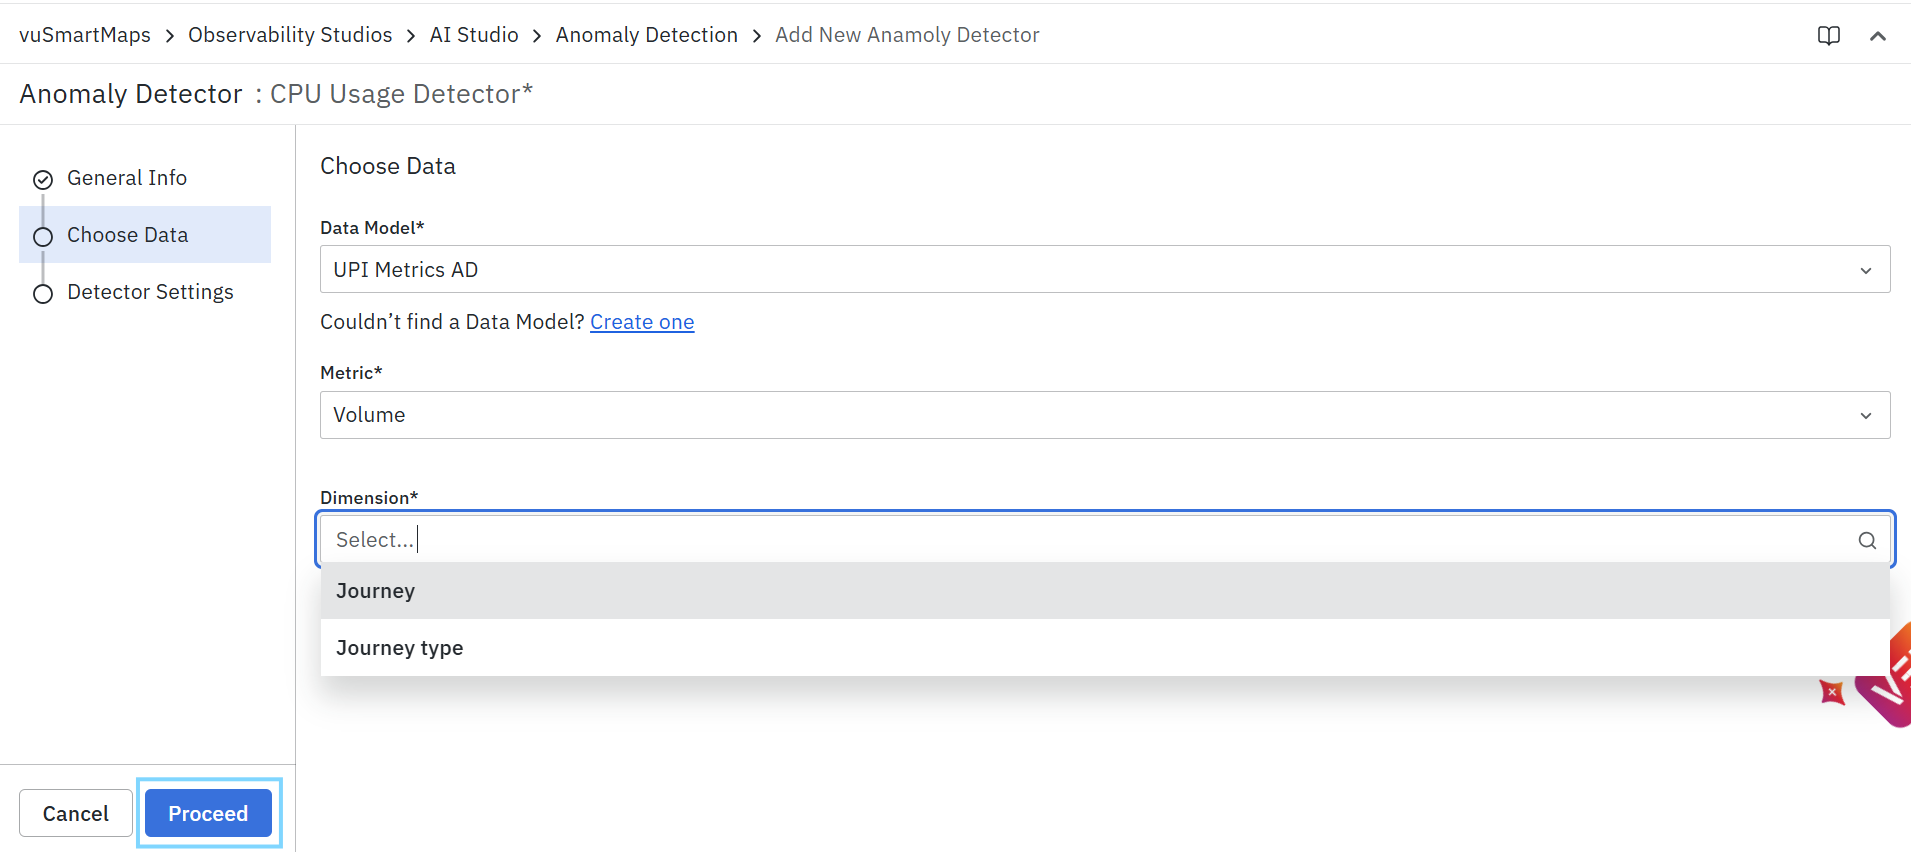
- Data Model: Select a data model that contains the dataset you want to monitor.
If the required data model is not available, click Create one to configure a new data model. For more information, refer to Create a New Data Model.
- Metric: Select the metric from the chosen data model that you want to analyze (for example, CPU or Volume).
- Dimension: Select a dimension to define how the metric should be grouped (for example, Journey or Journey type).
Once all required fields are selected, click Proceed to continue to the next step.
Example
- Data Model: UPI Metrics AD
- Metric: Volume
- Dimension: Journey
Step 3: Detector Settings
In this step, you decide how the anomaly detector should work. There are two types of settings available:
- Default Settings – Basic options that are good enough for most use cases and help you get started quickly.
- Advanced Configuration – Extra options for fine-tuning when you need more control.
Default Settings
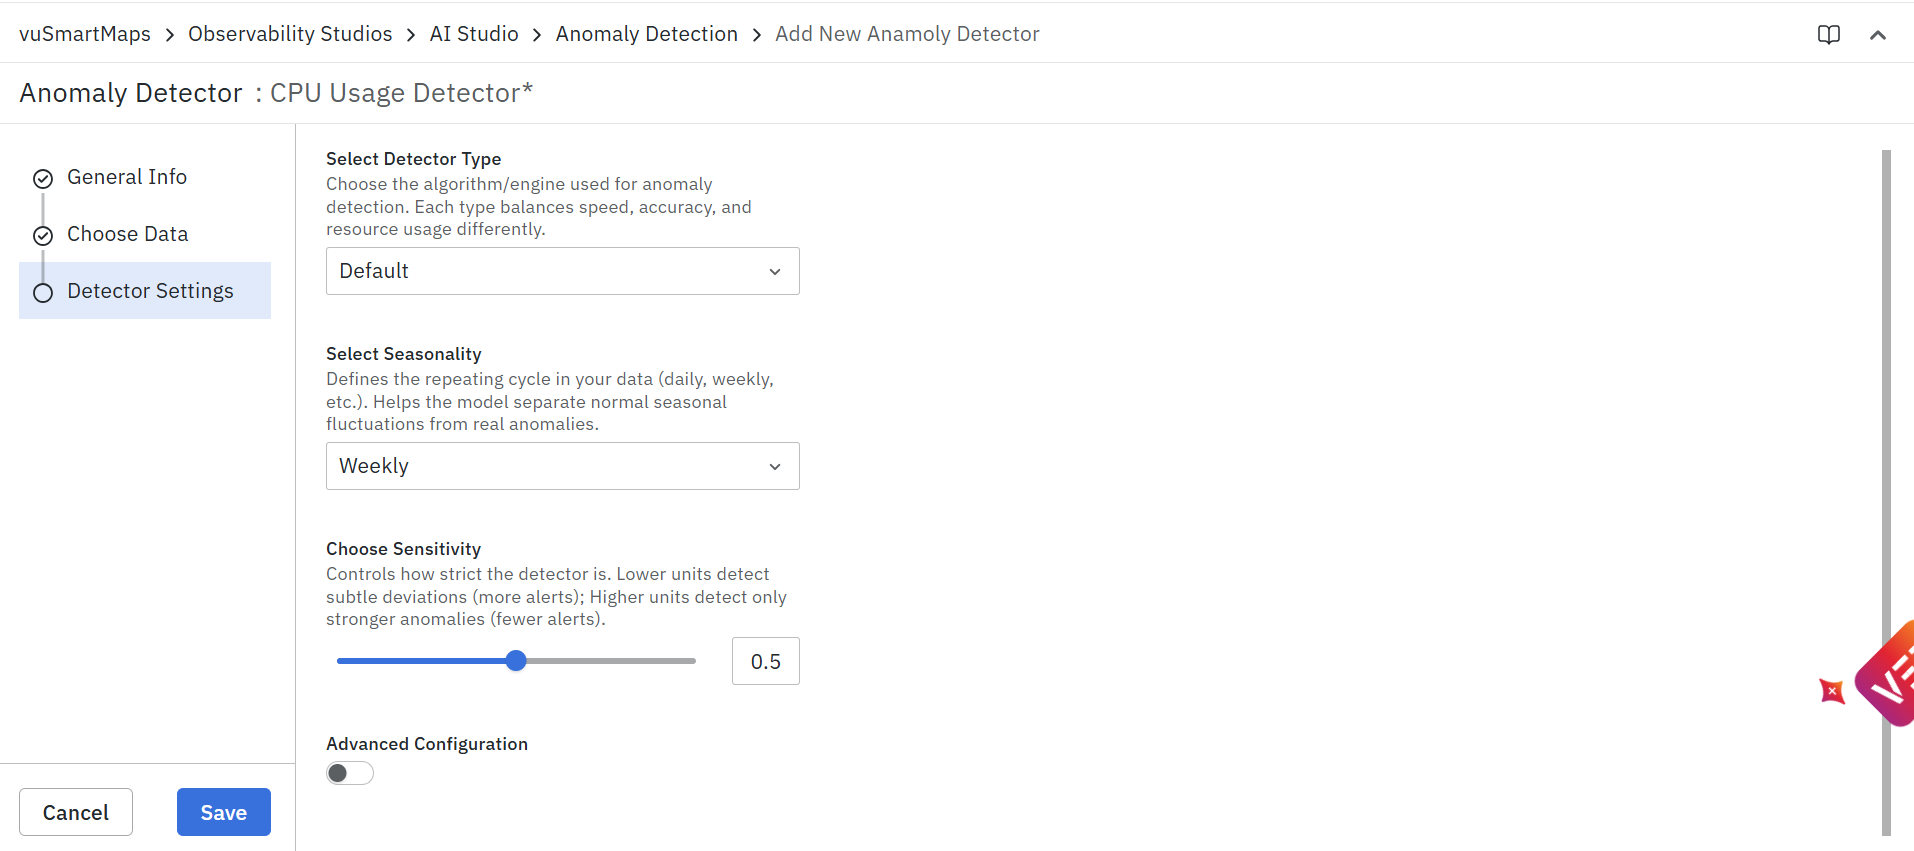
- Detector Type: Choose how the system looks for anomalies. The default option works well for most situations, so you don’t need to change it unless required.
- Seasonality: If your data has repeating patterns (like daily traffic peaks or weekly cycles), set it here. This helps the system understand what is normal and avoid false alerts.
- Threshold: Controls how much deviation from normal behavior is required before an anomaly is detected.
- Lower Threshold
- More sensitive to changes
- Detects even small deviations from expected behavior
- May generate more alerts and potential alert noise
- Higher Threshold
- Less sensitive to changes
- Detects only significant deviations from expected behavior
- Generates fewer alerts but may miss minor issues
- Lower Threshold
| Sensitivity | What It Means | Typical Outcome |
|---|---|---|
| 🔽 Low | Very sensitive to changes | ✅ Catches small anomalies ⚠️ More alerts/noise |
| ⚖️ Medium | Balanced detection | ✅ Good mix of accuracy and noise control |
| 🔼 High | Only reacts to major deviations | ✅ Fewer alerts ⚠️ Small issues may be missed |
- Data Frequency – Select how often data points are collected (for example, every 5 minutes). This should match your dataset’s actual data collection interval. If the selected frequency does not align with the incoming data interval, anomaly detection results may be less accurate because the model may learn incorrect patterns or evaluate incomplete data points.
After setting these options, click Save to finish, or choose Advanced Configuration if you want more detailed control.
Advanced Configuration

Once you enable the Advanced Configuration toggle, additional options appear. These give you more control over how the anomaly detector works:
- Training Period: Defines how much past data is used to learn normal patterns and seasonality. A longer period captures more variations but may take longer to adjust. (e.g., 5 days, 7 days)
- Forecast Horizon: Specifies how far into the future the detector should predict expected values for comparison. (e.g., 7 hours, 12 hours, 24 hours)
- Prediction Frequency: Controls how often anomaly detection runs and produces results. This should match how frequently you want fresh insights. (e.g., every 6 hours)
After setting these options, click Save to finish. After saving, the newly created anomaly detector will appear in the Anomaly Detection listing page.
Example
Below is an example of creating an anomaly detector using all three steps:
Step 1: General Info
- Name: CPU Usage Detector
- Description: Monitors CPU usage for abnormal behavior
This defines what the detector is and helps identify it later in the listing page.
Step 2: Choose Data
- Data Model: CBS CPU Usage
- Metric: CPU
- Dimension: Journey
This detector works as follows:
- The Data Model provides the dataset.
- The Metric (CPU) is what is being monitored.
- The Dimension (Journey) defines how the data is grouped, allowing anomalies to be detected per journey.
Step 3: Detector Settings
- Detector Type: Default
- Seasonality: Daily
- Sensitivity: 0.5(Medium)
Advanced Configuration:
- Training Period: 5 days
- Forecast Horizon: 7 hours
- Prediction Frequency: 6 hours
This detector works as follows:
- It learns normal CPU behavior using the last 5 days of data.
- It understands daily usage patterns (for example, higher usage during peak hours).
- It predicts expected CPU values up to 7 hours ahead.
- It runs anomaly detection every 6 hours.
- With a threshold value of 0.5 (medium sensitivity), it detects meaningful deviations while helping reduce unnecessary anomaly alerts.
Final Outcome
Once saved:
- The detector continuously monitors CPU usage
- It identifies abnormal spikes or drops based on learned patterns
- Detected anomalies can be analyzed in the Anomaly Explorer or used for alerting
What Happens After Creating a Detector
After an anomaly detector is created and enabled:
- The detector begins monitoring the selected metric.
- Historical data is analyzed to establish a behavioral baseline.
- The system continuously evaluates incoming metric values.
- Expected ranges are dynamically calculated using learned patterns.
- Deviations beyond configured sensitivity thresholds are identified as anomalies.
- Detected anomalies become available in Anomaly Explorer.
- Associated alerts can be triggered if alert integrations are configured.
- Investigation workflows can be launched from anomaly summaries and correlation views.
- Anomaly trends contribute to ongoing operational intelligence and root cause analysis activities.
FAQs
What is Anomaly Detection?
Anomaly Detection uses AI-driven models to identify unusual behavior in metrics by comparing current values with learned historical patterns.
What types of metrics can be monitored?
You can monitor application, infrastructure, and observability metrics available through the selected data model.
Can I modify an existing anomaly detector?
Yes. You can edit the detector's General Information, selected data, and detector settings from the Actions menu.
How does detector sensitivity affect anomaly detection?
Lower sensitivity detects ssmaller deviations but may generate more alerts, while higher sensitivity detects only significant deviations and reduces alert noise.
Can anomaly detectors trigger alerts?
Yes. Anomaly detectors can be integrated with configured alert channels such as Email, Microsoft Teams, or Slack.
