vuApp360 Deployment & Configuration
vuSmartMaps Configuration: Enabling Distributed Traces Telemetry
Traces O11ySource collects Distributed Traces telemetry from applications to provide comprehensive observability, offering deep insights into application performance through standard applications performance monitoring dashboards.
Enabling Traces O11ySource
-
Navigate to O11ySources:
- vuSmartMaps O11ySources can be accessed by navigating from the left navigation menu (Integrations > O11ySources).
-
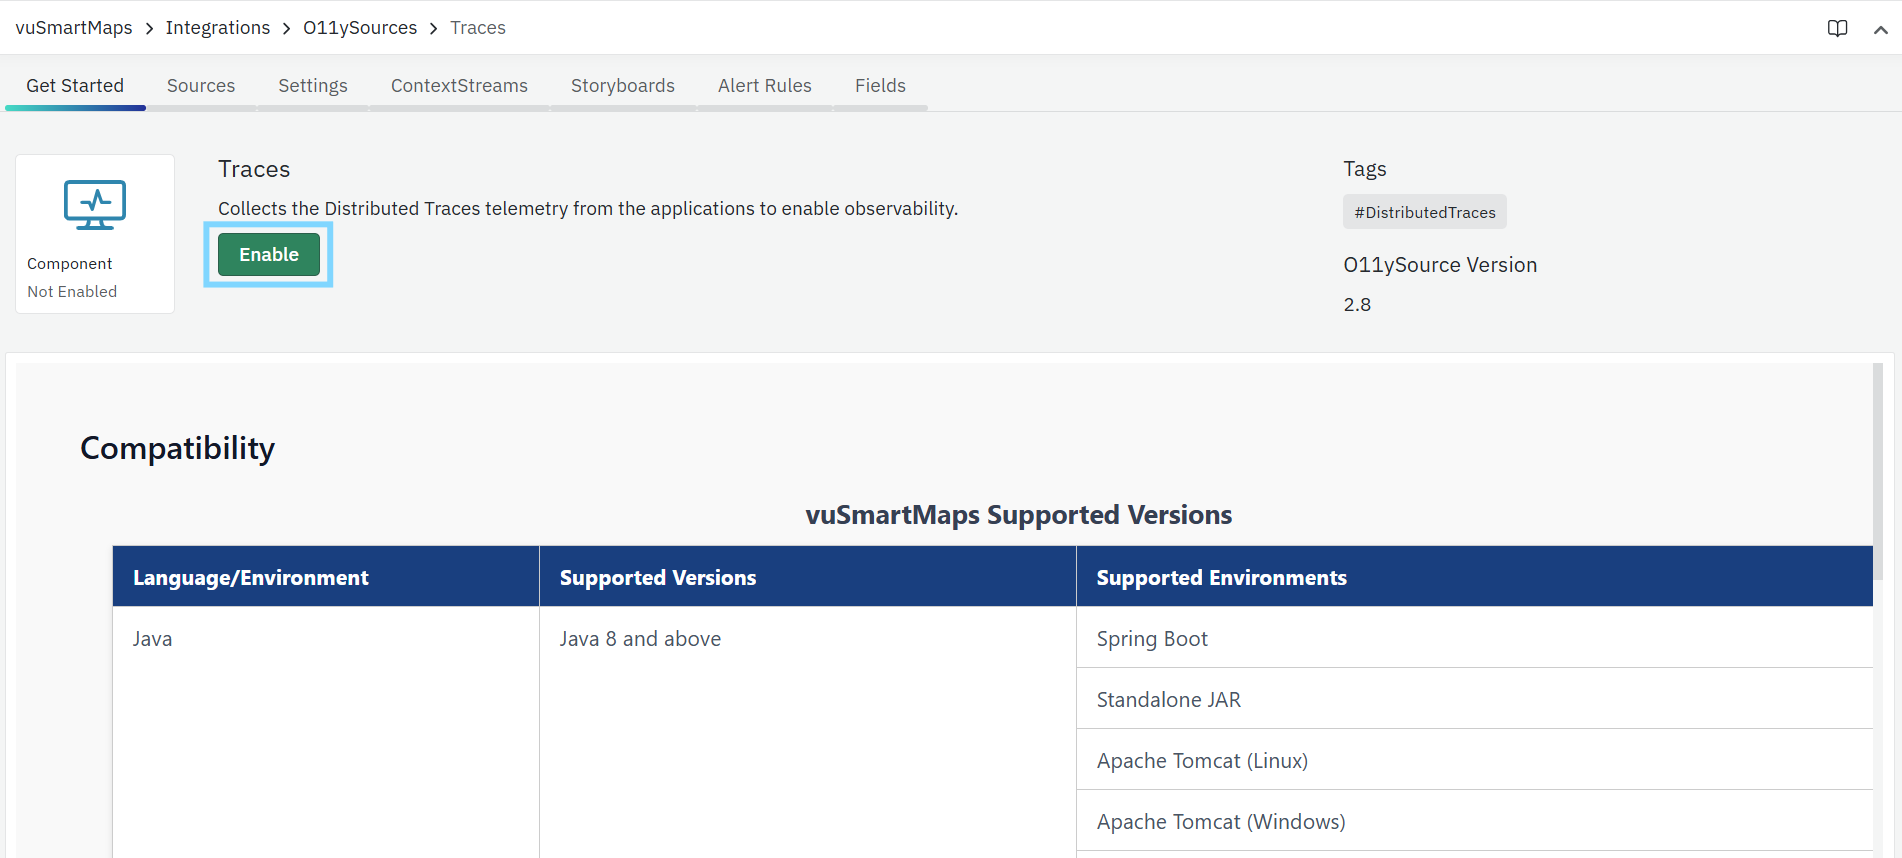
Locate Traces O11ySource on the landing page.
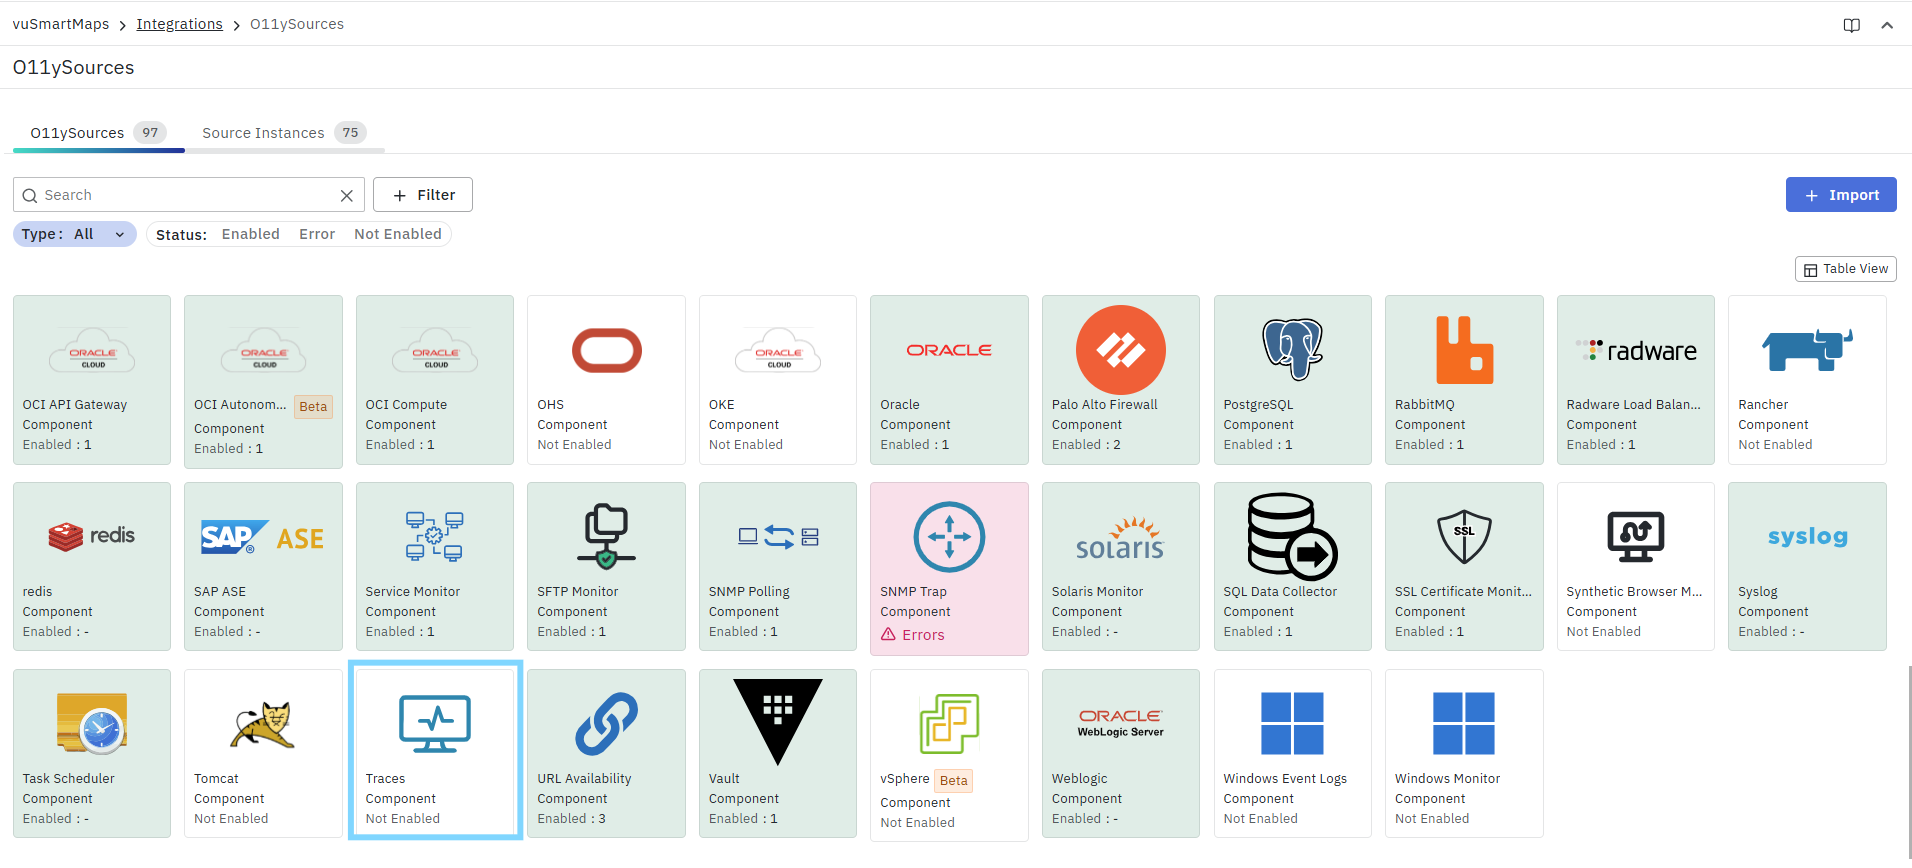
- Enable Traces O11ySources:
- Click the Enable button to activate Traces O11ySource.

Configuring Data Sources
To add and configure a Traces data source:
- Go to the Sources tab inside the Traces O11ySource. Click Source (top-right) → Configure New.

- This opens the Configure New Data Source(s) wizard, which includes:
Step 1: Add Data Source
In this step, you provide the basic details required for configuring Traces.
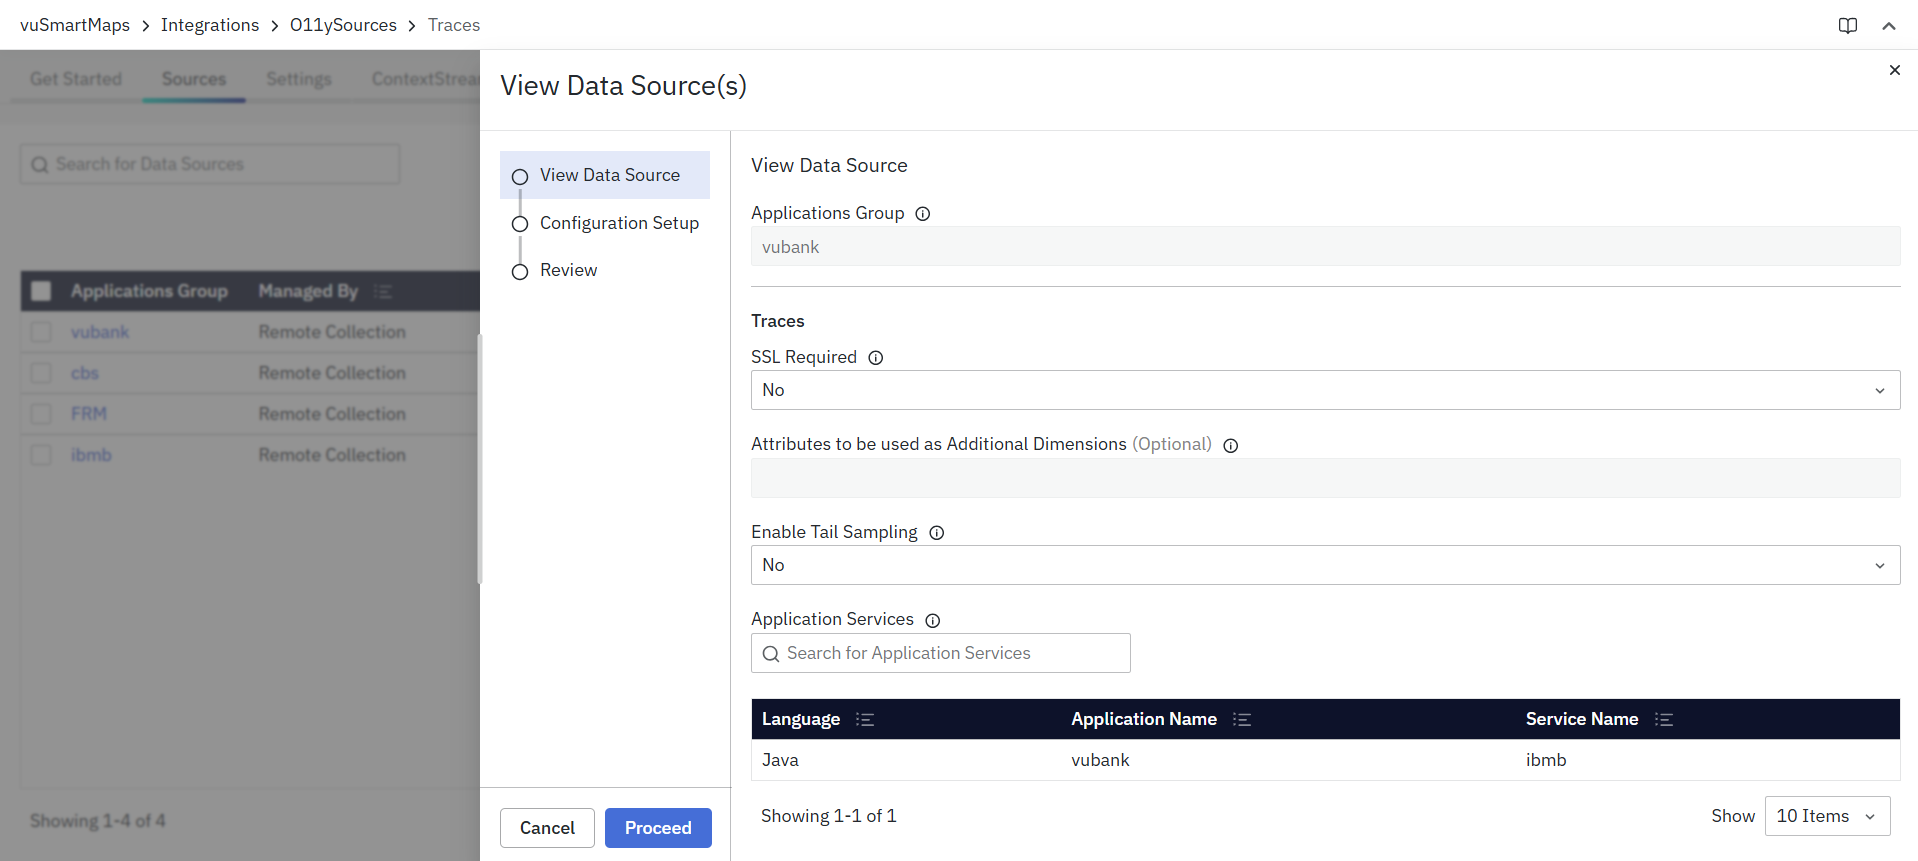
Fill in the following fields:
- Application Group: Enter the name of the application group to which this service belongs.
- SSL Required: Select Yes to enable TLS for secure communication, or No if TLS is not required.
- Attributes to be used as Additional Dimensions (Optional): Specify trace attributes that should be used as additional dimensions while calculating metrics.
- Separate multiple attributes using commas (for example:
attribute1, attribute2). - For HTTP request headers, use the format:
http.request.header.<attribute_name> - For HTTP response headers, use the format:
http.response.header.<attribute_name> - For other attributes, use the exact field name as available in the raw trace data.
- Separate multiple attributes using commas (for example:
- Enable Tail Sampling: Select Yes to apply the tail sampling policies configured in the Settings tab to determine which traces are stored. Select No to store 100% of the collected traces.
- Application Services: Define the application and service names as they should appear in the observability UI.
- In a monolithic application, the application name and service name are usually the same.
- In a microservices architecture, a single application can include multiple services.
- Language: Select the programming language used to develop the service (Java, NodeJS, .NET, or GoLang).
- Application Name: Enter the name of the target application.
- Service Name: Enter the name of the service within the application.
- Export HTTP Header: Enable this option if HTTP headers need to be captured as part of trace data.
After entering the required details, click Proceed.
Step 2: Configuration Setup
In this step, you define how the Traces data source will be managed by the platform. The table displays the configured source with the following details:
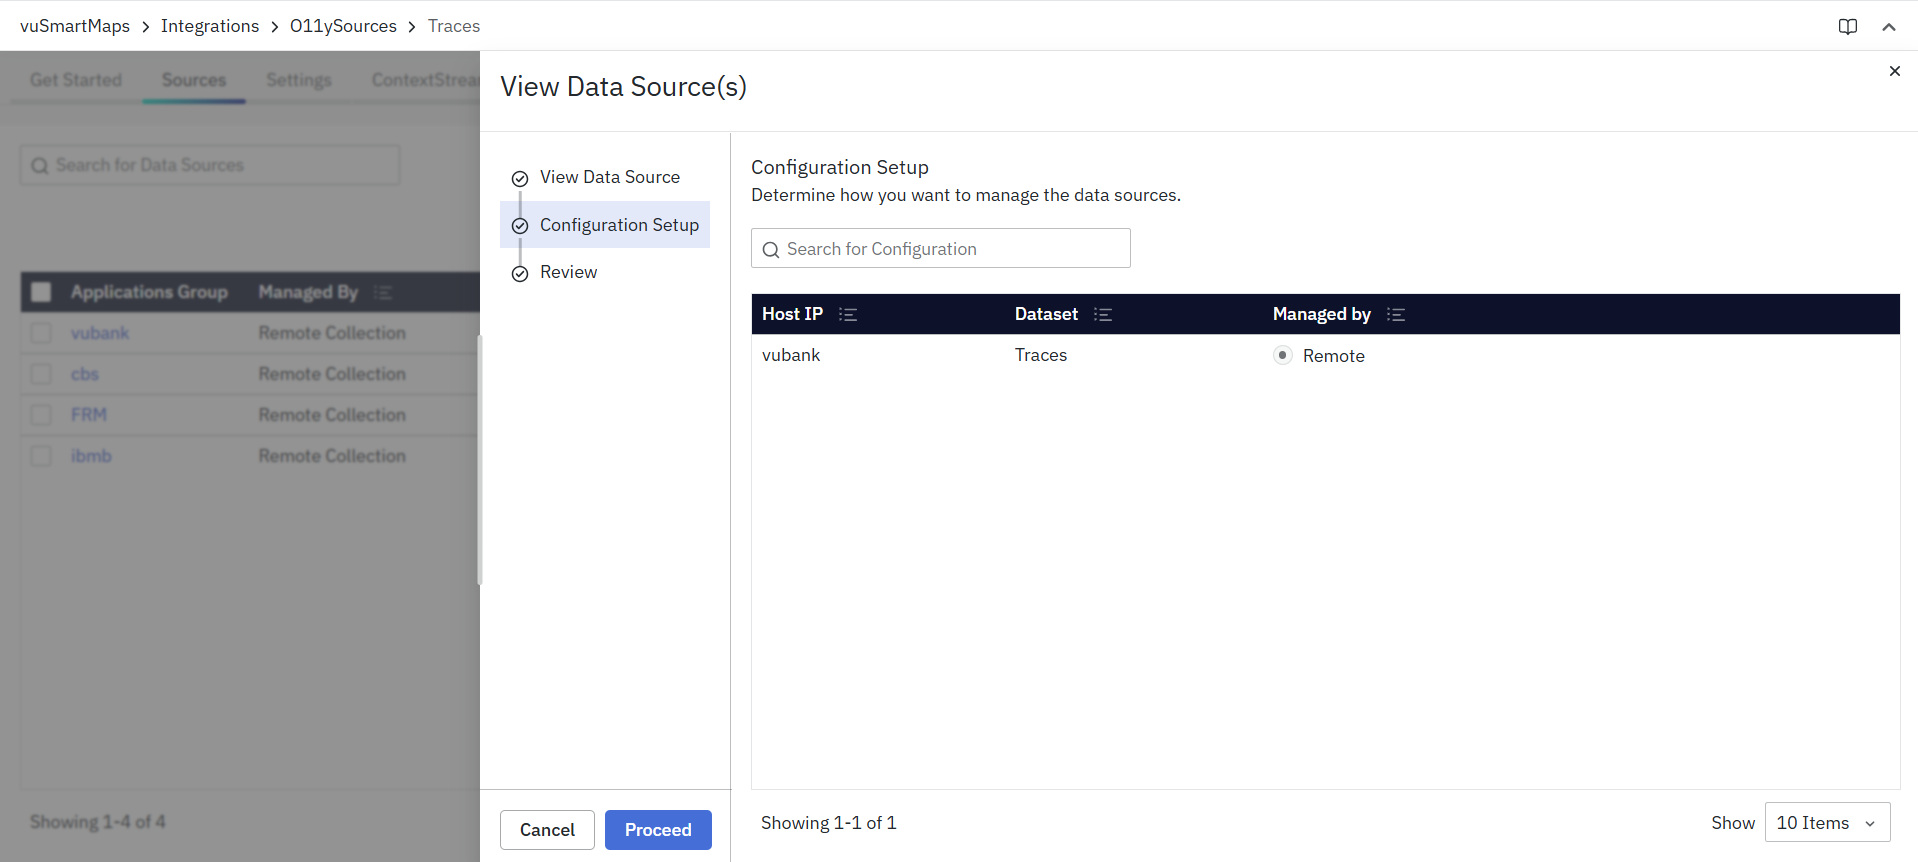
- Host IP – The host or application identifier added in the previous step.
- Dataset – Automatically set to Traces.
- Managed by – Specifies how trace data will be collected for the source. Only management modes supported for Traces are displayed.
Management Modes
- OmniAgent Managed: Tracing is handled automatically by OmniAgent. Once the OmniAgent is discovered on the host, trace collection starts automatically. Until discovery, the source remains in a Pending state.
- Manually Managed: Tracing is managed manually using client-side instrumentation.
- Download the required instrumentation package for the selected programming language, refer Download Source section.
- Deploy and configure the instrumentation manually on the application host.
- Trace data collection starts once the instrumentation is integrated and the application is running.
- Remote Collection: Trace data is collected remotely without installing OmniAgent on the host, where supported. Data collection proceeds automatically once the configuration is applied.
After selecting the appropriate Managed by option, click Proceed to continue to the Review step.
Step 3: Review
The Review step displays the configured Traces data sources and provides guidance on how data collection will proceed based on the selected management mode.
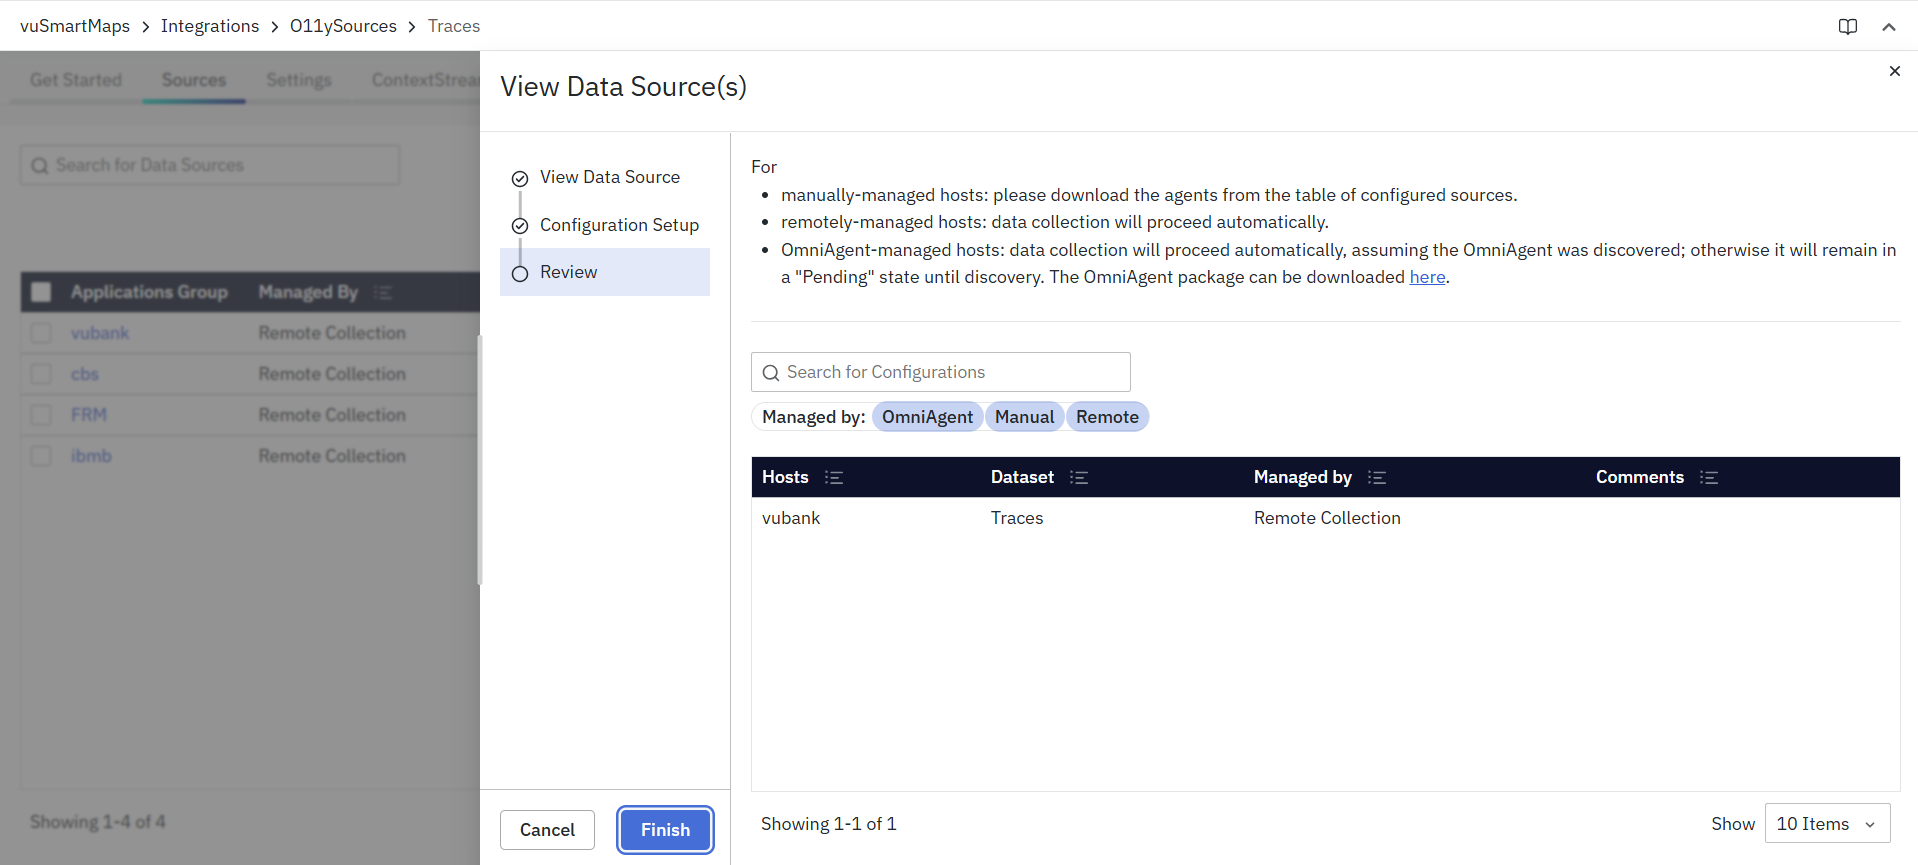
In this view, you can:
- Review the host, dataset, and management mode for each configured source.
- Filter sources using the Managed by options (OmniAgent, Manual, Remote).
- Search for specific configurations using the search bar.
Based on the selected management mode:
- Manually Managed – Download the required client instrumentation packages from the configured Sources table and deploy them manually.
- Remote Collection – Data collection proceeds automatically without requiring agent installation.
- OmniAgent Managed – Data collection proceeds automatically once OmniAgent is discovered. Until then, the source remains in a Pending state. The OmniAgent package can be downloaded if required.
After reviewing the configuration, click Finish to complete the setup. The Traces data source will then be available in the Sources list and begin collecting data according to the selected configuration.
Download Source
If the data source uses Manually Managed mode, you must download the client instrumentation package. To download:
- Go to the Sources table.
- Click the Download icon in the Actions column.
- Select the required configuration for the chosen language.
- Click Submit.
This provides the client instrumentation package required for trace collection. Follow the instructions provided in the Client Side Traces Instrumentation section to complete the setup.
Configuring Sampling Policies
Sampling configuration allows the system to selectively decide on which traces to store. This helps in reducing the amount of data kept in the system.
There are two types of sampling policies that can be configured for traces:
- Global Policies: Apply to all types of traces coming into the system.
- Service-Specific Policies: Apply to a specific set of services.
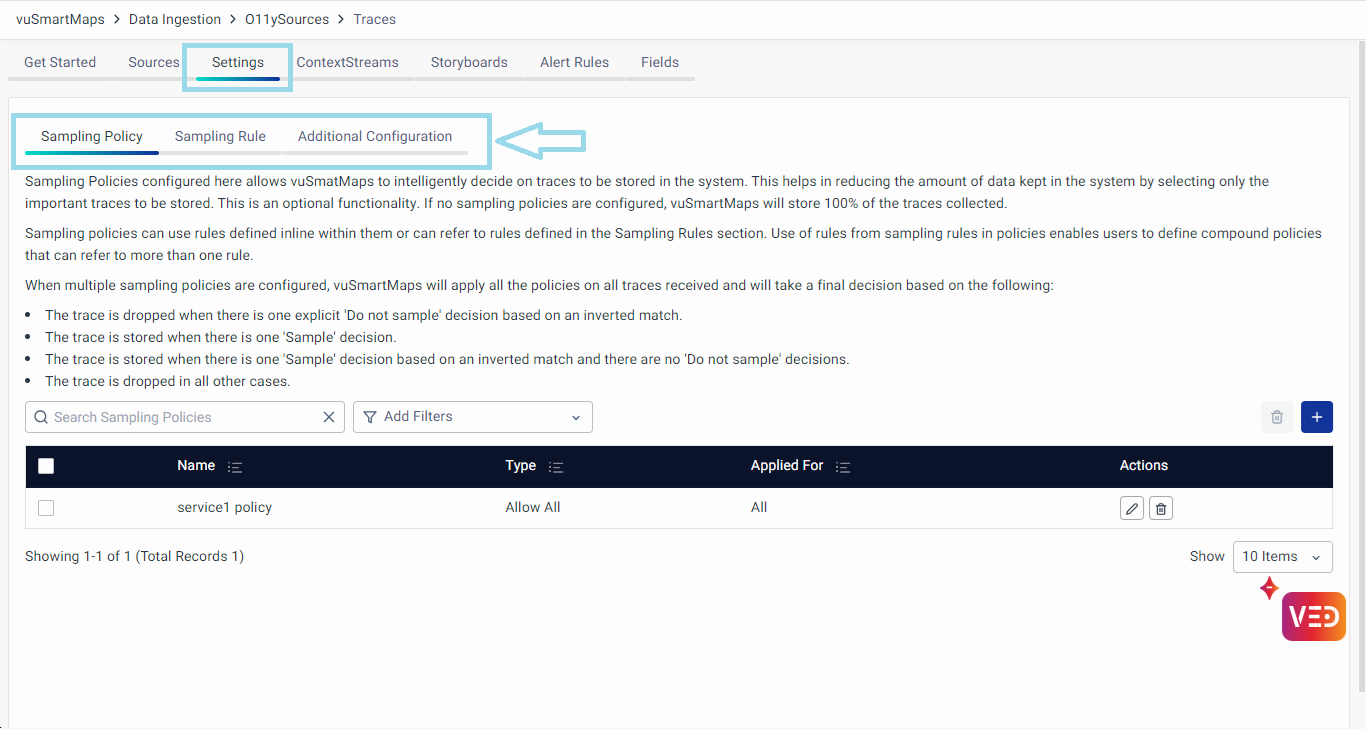
A separate page for sampling-related configurations is introduced. These configurations are controlled from the Settings tab on the Traces O11ySource page. The Settings tab includes three sections:
- Sampling Policy
Defines policies for deciding which traces to store. Policies can use inline rules or refer to rules defined in the Sampling Rules section. - Sampling Rule
Provides a way to define individual rules that can be referred to in Sampling Policies to form compound rules. - Additional Configuration
Controls data enrichments and transformations on received traces using optional YAML configurations.
The dashboards provided in vuApp360 are designed to display pre-sampled data.
Sampling Policy
Sampling Policies configured here allow vuSmartMaps to intelligently decide on which traces to store, helping to reduce the amount of data kept in the system by selecting only important traces. This is an optional functionality. If no sampling policies are configured, vuSmartMaps will store 100% of the traces collected.
Sampling policies can use rules defined inline within them or refer to rules defined in the Sampling Rules section. Using rules from sampling rules in policies enables users to define compound policies that can refer to more than one rule. When multiple sampling policies are configured, vuSmartMaps will apply all the policies to all traces received and will take a final decision based on the following:
- The trace is dropped when there is one explicit 'Do not sample' decision based on an inverted match.
- The trace is stored when there is one 'Sample' decision.
- The trace is stored when there is one 'Sample' decision based on an inverted match and there are no 'Do not sample' decisions.
- The trace is dropped in all other cases.
To configure a new sampling policy, use the + button and provide the following details in the modal:

- Policy Name: Unique name assigned by the user.
- Scope: Specify whether the policy applies to all traces (Global) or to a specific set of services. Options include All, For These Services, For Services Except These.
- Definition Type: Choose to define the policy details inline or refer to a rule defined in the Sampling Rules Section.
- Inline: If this option is selected, the configured policy type becomes applicable:
- Policy Type: Specify the type of sampling policy. vuSmartMaps offers following seven policy types:
- Allow All: Marks all traces received to be stored.
- Data Rate: Tracks spans per second rate of traces and drops traces beyond the configured threshold.
- Spans per Second: Maximum number of spans that can be processed each second.
- Latency: Stores only those traces with latency greater than the configured threshold.
- Threshold in Milliseconds: Only traces with latency greater than the given threshold (in ms) will be allowed.
- Number Attribute: Stores only those traces with the value of the configured attribute falling within a specified range.
- Attribute: Select the attribute key to match data received from applications (e.g., HTTP Status Code).
- Minimum Value: Enter the minimum acceptable value (e.g., 400 for HTTP Status codes).
- Maximum Value: Enter the maximum acceptable value (e.g., 500 for HTTP Status codes).
- Percentage: Stores only a specified percentage of traces received, dropping the rest.
- Sampling Percentage: The percentage rate at which traces are sampled.
- Status: Stores traces with specified statuses, dropping the rest.
- Status Type: Status value for which traces will be retained. Options: Error, OK, Unset.
- String Attribute: Stores only those traces with the value of a configured attribute matching the configured condition.
- Attribute: Select the attribute key to match data received from applications (e.g., Application, Service Name, Host Name, HTTP Host, HTTP Target, HTTP Route, HTTP URL, DB Name, DB System, Messaging System, Transaction).
- Values: Enter the values to match against (e.g., health, metrics, etc.).
- Regular Expression: When 'True', the system will match the attribute values by regular expression string.
- Invert Match: When 'True', the system will reverse the match condition.
- Use Predefined Rule Sets: If this option is selected, choose one of the following policy types and select the relevant rules from the Sampling Rules section:
- AND of Multiple Rules: Build a compound rule with an AND of multiple rules defined in the Sampling Rules section.
- Rate Distribution: Allocate portions of the total allowed rate to a set of rules from the Sampling Rules Section. Traces matching each rule will be allocated a portion of the total rate allowed.
- Single Rule: Use a single rule defined in the Sampling Rules section.
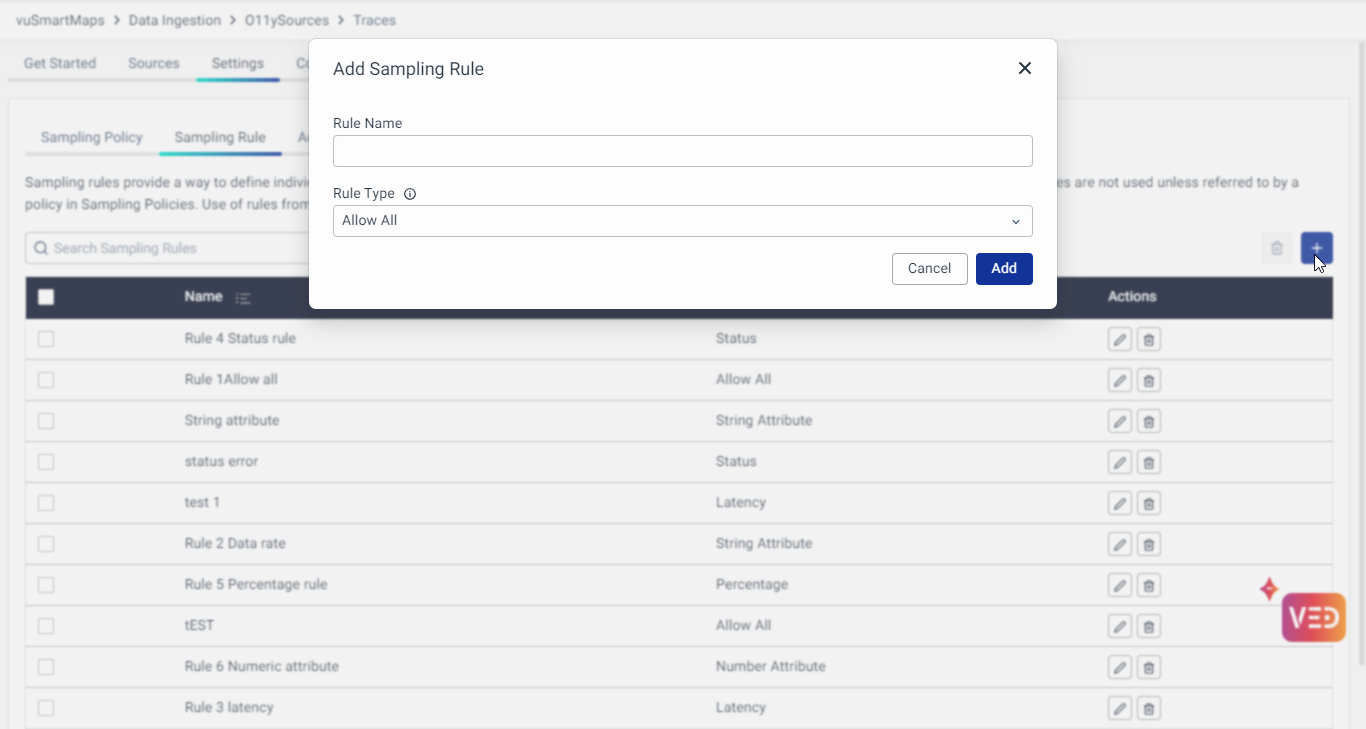
Sampling Rule
Sampling rules provide a way to define individual rules that can be referred to in Sampling Policies to form compound rules. The rules defined in Sampling Rules are not used unless referred to by a policy in Sampling Policies. Using rules from Sampling Rules in policies enables users to define compound policies that can refer to more than one rule.
To configure a new sampling rule, use the + button and provide the following details in the modal:
- Rule Name: Unique name assigned by the user.
- Rule Type: Specify the type of sampling rule. vuSmartMaps offers seven predefined rule types (as explained above for inline policy types).
Additional Configuration
The Additional Configuration section can be used to control data enrichments and transformations done on traces received. Users can add optional YAML configurations. Below is an example:
     transform:
    trace_statements:
      - context: span
        statements:
          - set(attributes["instrumentation_library_name"], instrumentation_scope.name)
          - set(attributes["library"], attributes["db.system"])
          - set(attributes["library"], attributes["messaging.system"])
          - set(attributes["library"], "Express") where instrumentation_scope.name == "@opentelemetry/instrumentation-express"
          - set(attributes["library"], "MongoDB") where instrumentation_scope.name == "io.opentelemetry.mongo-3.1"
          - set(attributes["library"], "Go-kit") where instrumentation_scope.name == "go.opentelemetry.io/contrib/instrumentation/github.com/go-kit/kit/otelkit"
          - set(attributes["library"], "RabbitMQ") where instrumentation_scope.name == "io.opentelemetry.rabbitmq-2.7"
          - set(attributes["library"], "NodeJS HTTP Client / Server") where instrumentation_scope.name == "@opentelemetry/instrumentation-http"
          - set(attributes["library"], "Redis") where instrumentation_scope.name == "@opentelemetry/instrumentation-redis"
          - set(attributes["library"], "Spring MVC") where instrumentation_scope.name == "io.opentelemetry.spring-webmvc-3.1"
          - set(attributes["library"], "Tomcat") where instrumentation_scope.name == "io.opentelemetry.tomcat-7.0"
          - set(attributes["library"], "Servlet") where instrumentation_scope.name == "io.opentelemetry.servlet-3.0"
          - set(attributes["library"], attributes["db.system"]) where instrumentation_scope.name == "io.opentelemetry.jdbc"
          - set(attributes["library"], "Spring Data") where instrumentation_scope.name == "io.opentelemetry.spring-data-1.8"
          - set(attributes["library"], "Hibernate") where instrumentation_scope.name == "io.opentelemetry.hibernate-4.0"
          - set(attributes["library"], "Go HTTP Client / Server") where instrumentation_scope.name == "go.opentelemetry.io/contrib/instrumentation/net/http/otelhttp"
          - set(attributes["library"], "Spring Scheduling") where instrumentation_scope.name == "io.opentelemetry.spring-scheduling-3.1 1.14.0-alpha"
          - set(attributes["destination"], attributes["db.system"])
          - set(attributes["destination"], attributes["messaging.system"])
          - set(attributes["destination"], attributes["net.peer.name"])
          - set(attributes["destination"], replace_match(attributes["http.url"], "https?://[^/]+/([^/]+)", "$1"))
          - set(attributes["transaction"], Concat([attributes["http.method"], attributes["http.target"]], " ")) where (attributes["http.target"] != nil and attributes["http.method"] != nil and attributes["http.target"] != "")
          - set(attributes["transaction"], Concat([attributes["http.method"], attributes["http.route"]], " ")) where (attributes["http.route"] != nil and attributes["http.method"] != nil and attributes["http.route"] != "")
          - set(attributes["site"], "default")
This configuration enriches and transforms trace data, making it more meaningful and useful for analysis.
The Settings tab for Traces O11ySource provides a centralized location for configuring sampling policies, rules, and additional configurations. This setup simplifies the process, reduces user confusion, and enhances the ability to manage and control the data stored in the system effectively. By intelligently sampling traces, users can ensure that they are storing only the most relevant and important data, optimizing both storage and analysis capabilities.
Client Side Traces Instrumentation

- Java
- C# / .NET
- Go
- Kubernetes
- Node.js
- Python
- NGINX
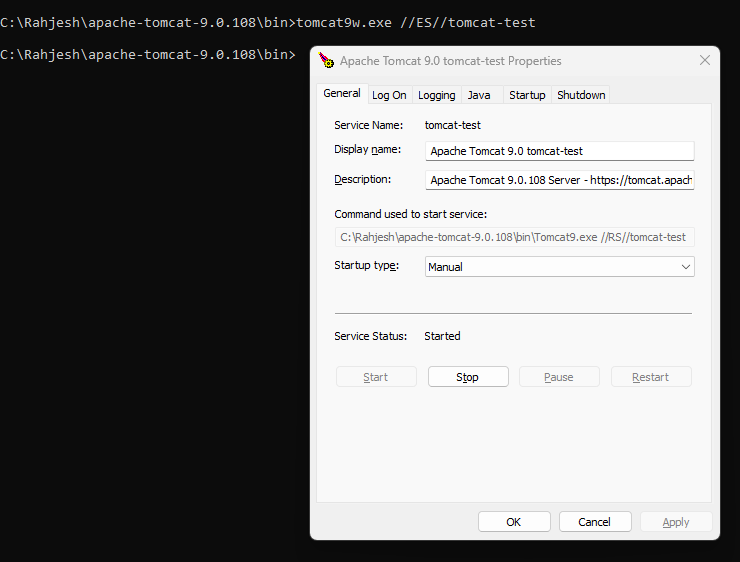
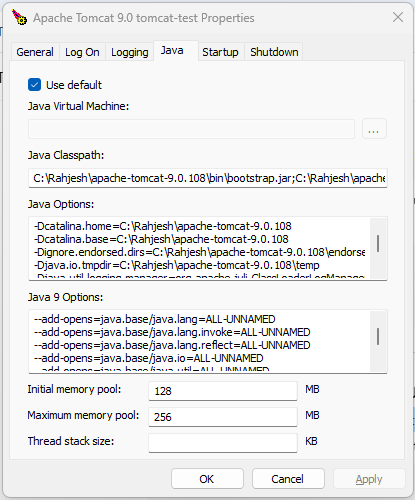
Instrumentation Process SpringBoot / jar Steps to instrument the java application running as a SpringBoot / jar: Download the client instrumentation package from the O11ysource, which contains the Launch the application with the following configuration Ensure to update the following before using this command. Example: JBoss / WildFly (Standalone Mode) in Linux Steps to instrument the java application running in JBoss / WildFly (Standalone Mode) in Linux: Download the client instrumentation package, which contains the Edit the Ensure to update the following before using this command. Example: Restart JBoss JBoss / WildFly (Domain Mode) in Linux Steps to instrument the java application running in JBoss / WildFly (Domain Mode) in Linux: Download the client instrumentation package, which contains the Edit the Ensure to update the following before using this command. Example: Restart JBoss JBoss / WildFly (Standalone Mode) in Windows Steps to instrument the java application running in JBoss / WildFly (Standalone Mode) in Windows: Download the client instrumentation package, which contains the Edit the Ensure to update the following before using this command. Example: Restart JBoss JBoss / WildFly (Domain Mode) in Windows Steps to instrument the java application running in JBoss / WildFly (Domain Mode) in Windows: Download the client instrumentation package, which contains the Edit the Ensure to update the following before using this command. Example: Restart JBoss Apache Tomcat running on Linux Steps to instrument the java application running in Apache Tomcat running on Linux Download the client instrumentation package, which contains the Edit the Ensure to update the following before using this command. Restart Apache Tomcat Apache Tomcat running on Windows Follow the below instructions to instrument the Java application running in Apache Tomcat: Add the following content: Please update the following before using this command: Apache Tomcat Running as Windows Service Follow the below instructions to instrument the Java application running in Apache Tomcat which is running as a Windows Service: Please update the following before using this command: Weblogic (Standalone Weblogic Servers) Steps to instrument the java application running in a standalone Weblogic server: Download the client instrumentation package, which contains the Edit Ensure to update the following before using this command. Restart Weblogic Websphere Liberty Follow the below instructions to instrument the java applications running in Websphere Liberty servers Download the client instrumentation package which contains the vunet-opentelemetry-javaagent.jar. Place the vunet-opentelemetry-javaagent.jar in your preferred directory. Locate the liberty server config. Each Liberty server instance has its own directory, like Inside it, you will find server.xml, jvm.options etc. If you don't find jvm.options, please create the file. Repeat this for all the Liberty servers that need to be instrumented. Once this is done, you will see the traces in the vuSmartMaps dashboard Weblogic (Servers managed by Admin Console) Steps to instrument the java application running in clustered Weblogic server where the admin console is used to manage the instance: Download the client instrumentation package, which contains the For clustered WebLogic servers, you start and stop using Node Manager and configure server startup in the WebLogic Server Administration Console. Open the WebLogic Server Administration Console. Navigate to Environment > Servers and click your server in the Server List Click the Server Start tab. Add the javaagent argument and set the value to the path to the Java Agent Please update the following before using this command. Restart the Weblogic managed server Websphere Application Server ND Steps to instrument the java application running in Websphere Application Server Network Deployment: Download the client instrumentation package which contains the Log in to the WebSphere Integrated Solutions Console Navigate to Servers > Server type > WebSphere application servers. Select the server. Go to Java and Process Management > Process Definition. Select Java Virtual Machine. In Generic JVM arguments, add the following arguments. Please update the following before saving the configuration Save the configuration and restart the server. Docker If your application is running in Docker, then modify the Dockerfile to include the JVM parameters mentioned above. See the extract from a sample Dockerfile. If you don’t want to rebuild the container, then you can re-run the container with the following additional environment variables. Ensure to update the following before using this command. Kubernetes When you run your Java applications in Kubernetes based environments, please follow the kubernetes tab.
vunet-opentelemetry-javaagent.jar.
vunet-opentelemetry-javaagent.jar in your preferred directory.
APPLICATION_NAME: Change it to match your application name.SERVICE_NAME: Change it to match the service name (microservices) or application layer (monolithic)TRACES_INGESTION_ENDPOINT: Change it to match the URL of the vuSmartMaps.
vunet-opentelemetry-javaagent.jar.
vunet-opentelemetry-javaagent.jar in your preferred directory.<JBOss_HOME>/bin/standalone.conf file and update the JAVA_OPTS environment variable
APPLICATION_NAME: Change it to match your application nameSERVICE_NAME:
TRACES_INGESTION_ENDPOINT: Change it to match the URL of the vuSmartMaps. It should be http://<vuSmartMaps Server IP>:4317
vunet-opentelemetry-javaagent.jar.
vunet-opentelemetry-javaagent.jar in your preferred directory.<JBOss_HOME>/bin/domain.conf file and update the JAVA_OPTS environment variable
APPLICATION_NAME: Change it to match your application nameSERVICE_NAME:
TRACES_INGESTION_ENDPOINT: Change it to match the URL of the vuSmartMaps. It should be http://<vuSmartMaps Server IP>:4317.
vunet-opentelemetry-javaagent.jar.
vunet-opentelemetry-javaagent.jar in your preferred directory.<JBOss_HOME>/bin/standalone.conf.bat file and update the JAVA_OPTS environment variable
APPLICATION_NAME: Change it to match your application nameSERVICE_NAME:
TRACES_INGESTION_ENDPOINT: Change it to match the URL of the vuSmartMaps. It should be http://<vuSmartMaps Server IP>:4317.
vunet-opentelemetry-javaagent.jar.
vunet-opentelemetry-javaagent.jar in your preferred directory.<JBOss_HOME>/bin/domain.conf.bat file and update the JAVA_OPTS environment variable
APPLICATION_NAME: Change it to match your application nameSERVICE_NAME:
TRACES_INGESTION_ENDPOINT: Change it to match the URL of the vuSmartMaps. It should be http://<vuSmartMaps Server IP>:4317.
vunet-opentelemetry-javaagent.jar.
vunet-opentelemetry-javaagent.jar in your preferred directory.setenv.sh in the bin directory of Tomcat and add the following content.
setenv.sh in the bin directory if it doesn't exist
APPLICATION_NAME: Change it to match your application nameSERVICE_NAME:
TRACES_INGESTION_ENDPOINT: Change it to match the URL of the vuSmartMaps. It should be http://<vuSmartMaps Server IP>:4317
vunet-opentelemetry-javaagent.jar in your preferred directory.
It should be in the format:
vunet-opentelemetry-javaagent.jar in your preferred directory.
vunet-opentelemetry-javaagent.jar.
vunet-opentelemetry-javaagent.jar in your preferred directory.startWebLogic.sh located at <weblogic_<version#>_install_dir>/user_projects/domains/<domain_name>/bin/startWebLogic.sh.
APPLICATION_NAME: Change it to match your application nameSERVICE_NAME:
TRACES_INGESTION_ENDPOINT: Change it to match the URL of the vuSmartMaps. It should be http://<vuSmartMaps Server IP>:4317
vunet-opentelemetry-javaagent.jar.
vunet-opentelemetry-javaagent.jar in your preferred directory.
APPLICATION_NAME: Change it to match your application nameSERVICE_NAME:
TRACES_INGESTION_ENDPOINT: Change it to match the URL of the vuSmartMaps. It should be http://<vuSmartMaps Server IP>:4317
vunet-opentelemetry-javaagent.jar.
vunet-opentelemetry-javaagent.jar in your preferred directory.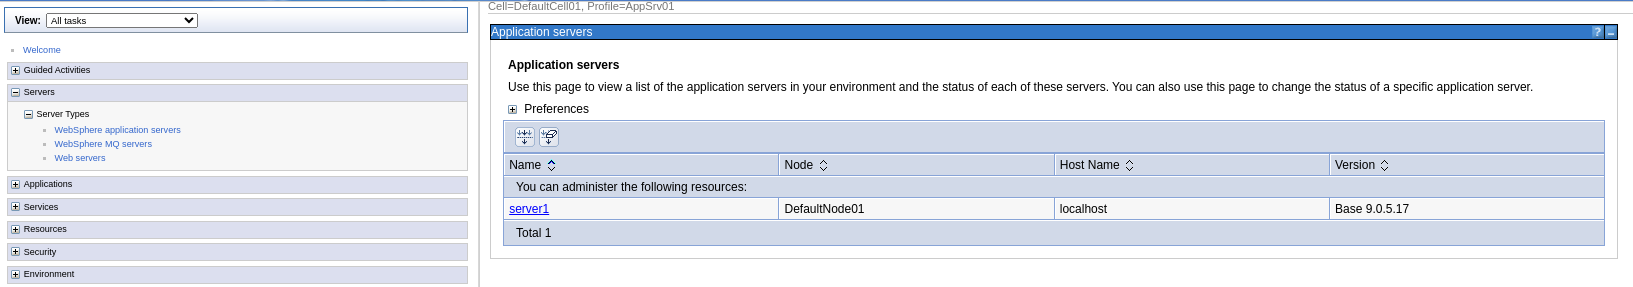

APPLICATION_NAME: Change it to match your application nameSERVICE_NAME:
TRACES_INGESTION_ENDPOINT: Change it to match the URL of the vuSmartMaps. It should be http://<vuSmartMaps Server IP>:4317
APPLICATION_NAME: Change it to match your application nameSERVICE_NAME: Change it to match the service name (microservices) or application layer (monolithic)TRACES_INGESTION_ENDPOINT: Change it to match the URL of the vuSmartMaps. It should be http://<vuSmartMaps Server IP>:4317
Configuration TLS Configuration If the TLS is enabled on the vuSmartMaps traces receiver, please get the certificate from the server and configure the following additional parameters. The server certificate is included in the downloaded instrumentation package. For the TLS case Capture HTTP Headers In some applications, key transaction identifiers are passed as HTTP headers to the APIs. To capture these headers, additional instrumentation configurations are required. Below are the steps and examples for capturing HTTP headers for both HTTP servers and clients. Capture HTTP Request Header for HTTP Server To capture the request headers passed to a service, use the following configuration along with other instrumentation configurations mentioned in the previous sections. You can configure one or more headers to be captured. If capturing multiple headers, separate them with commas. An example is given below Capture HTTP Response Header for HTTP Server To capture the response headers passed from a service, use the following configuration along with other instrumentation configurations mentioned in the previous sections. You can configure one or more headers to be captured. If capturing multiple headers, separate them with commas. An example is given below Capture HTTP Request Header for HTTP Client To capture the request headers passed by a service, use the following configuration along with other instrumentation configurations mentioned in the previous sections. You can configure one or more headers to be captured. If capturing multiple headers, separate them with commas. An example is given below Capture HTTP Response Header for HTTP Client To capture the response headers received by a service, use the following configuration along with other instrumentation configurations mentioned in the previous sections You can configure one or more headers to be captured. If capturing multiple headers, separate them with commas. An example is given belowTRACES_INGESTION_ENDPOINT should be https://<vuSmartMaps Server IP>:4318
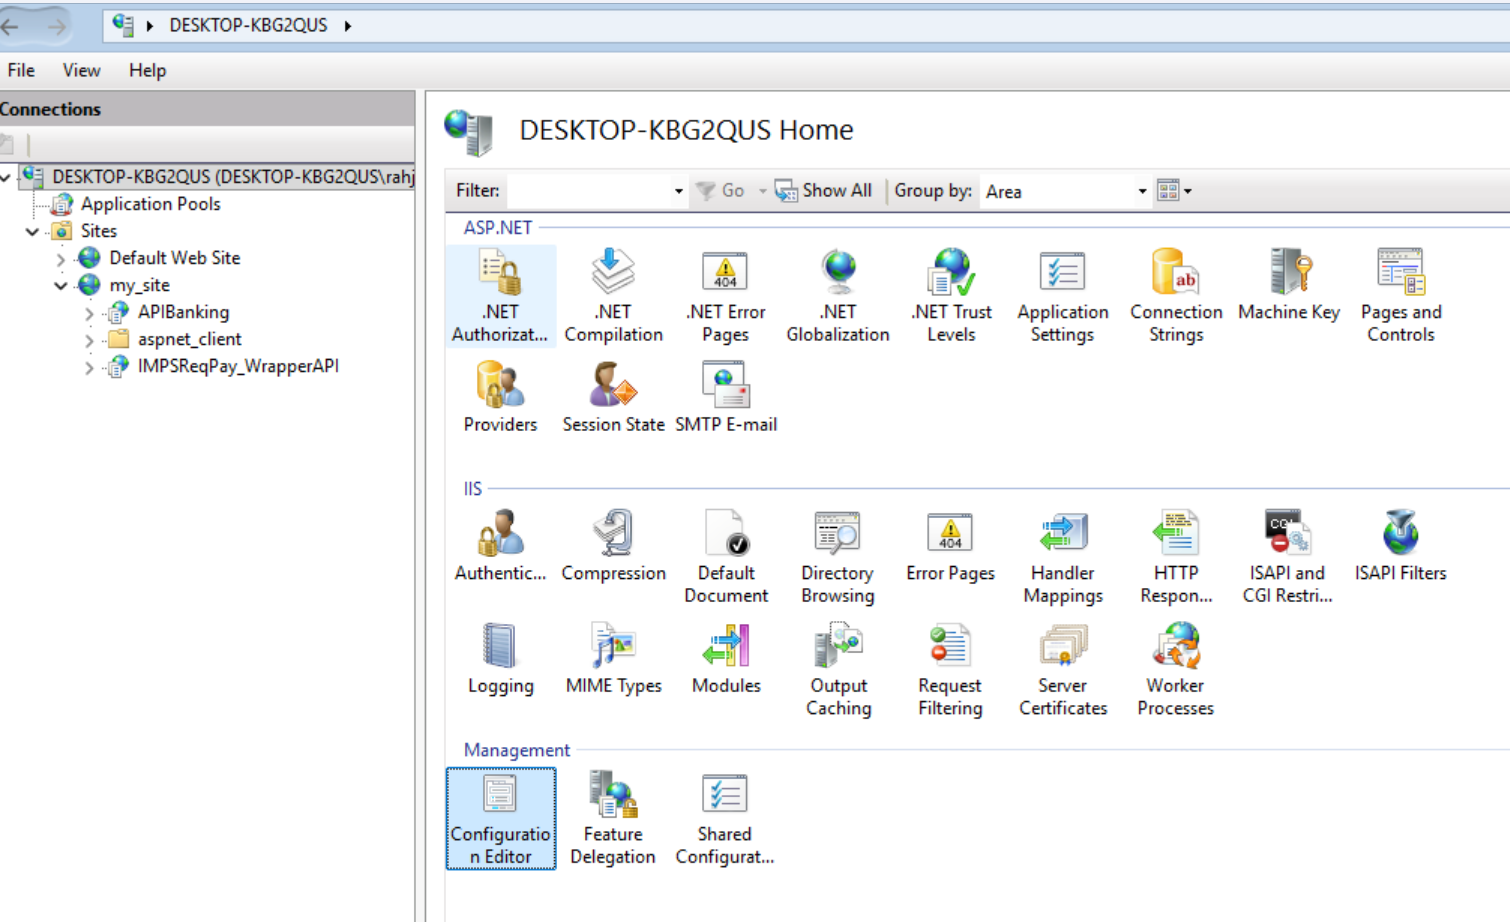
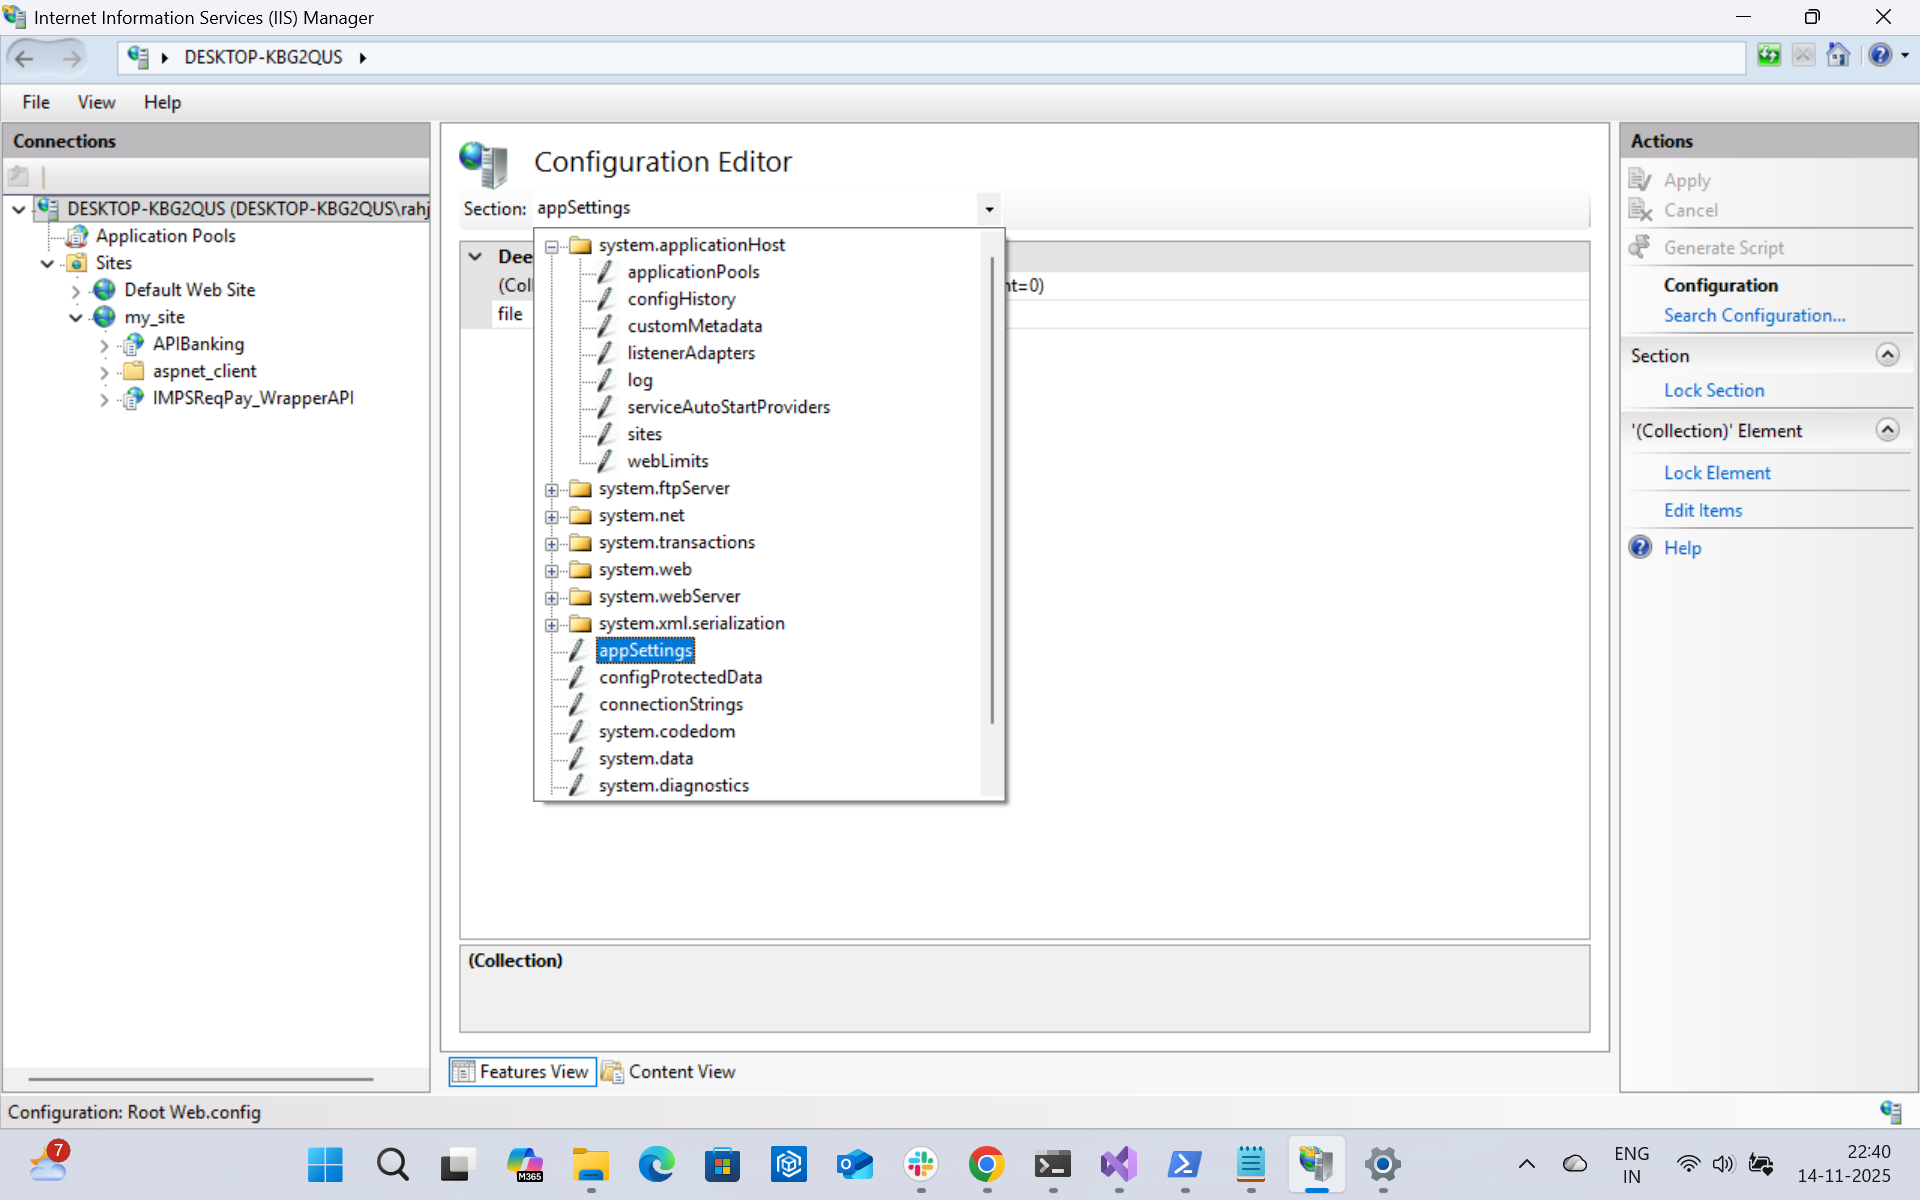
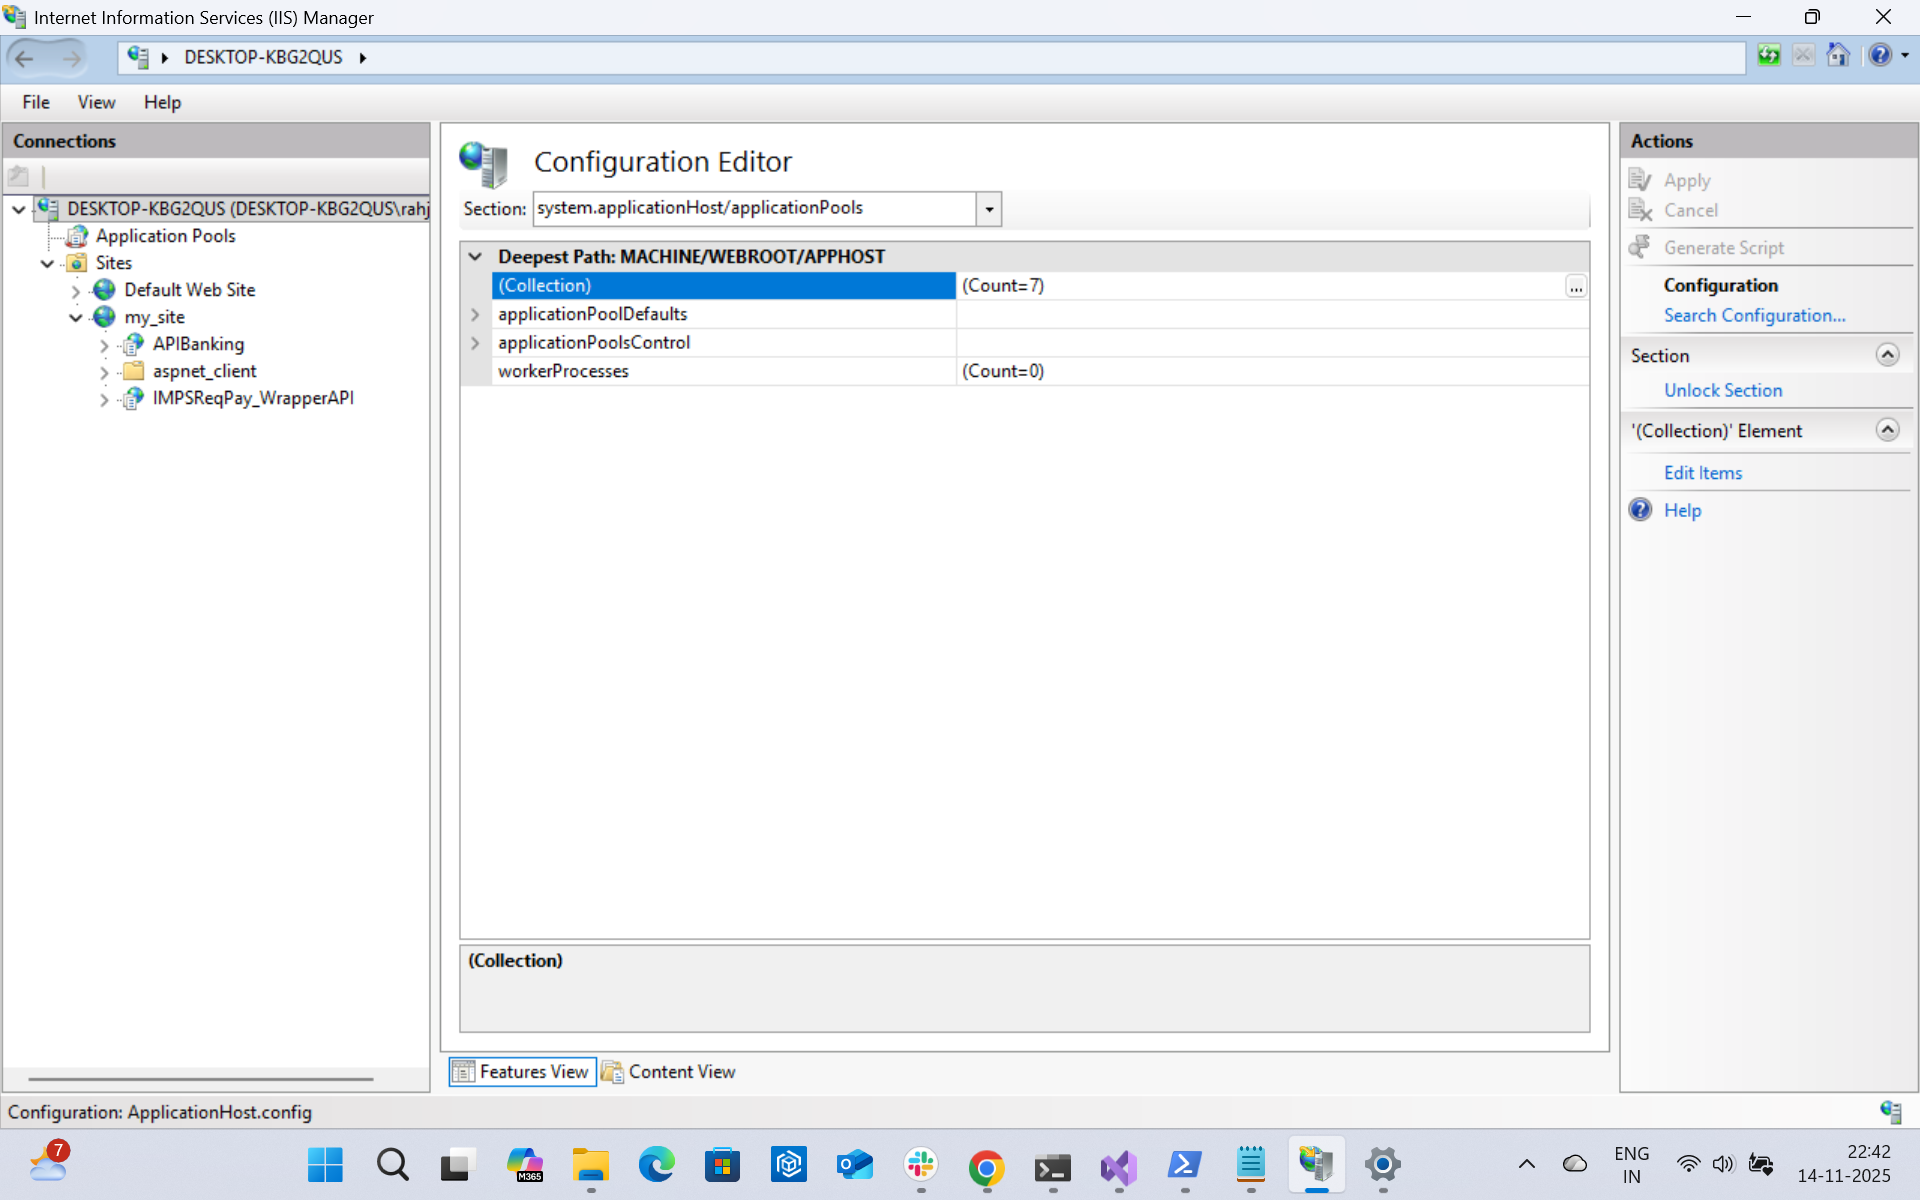
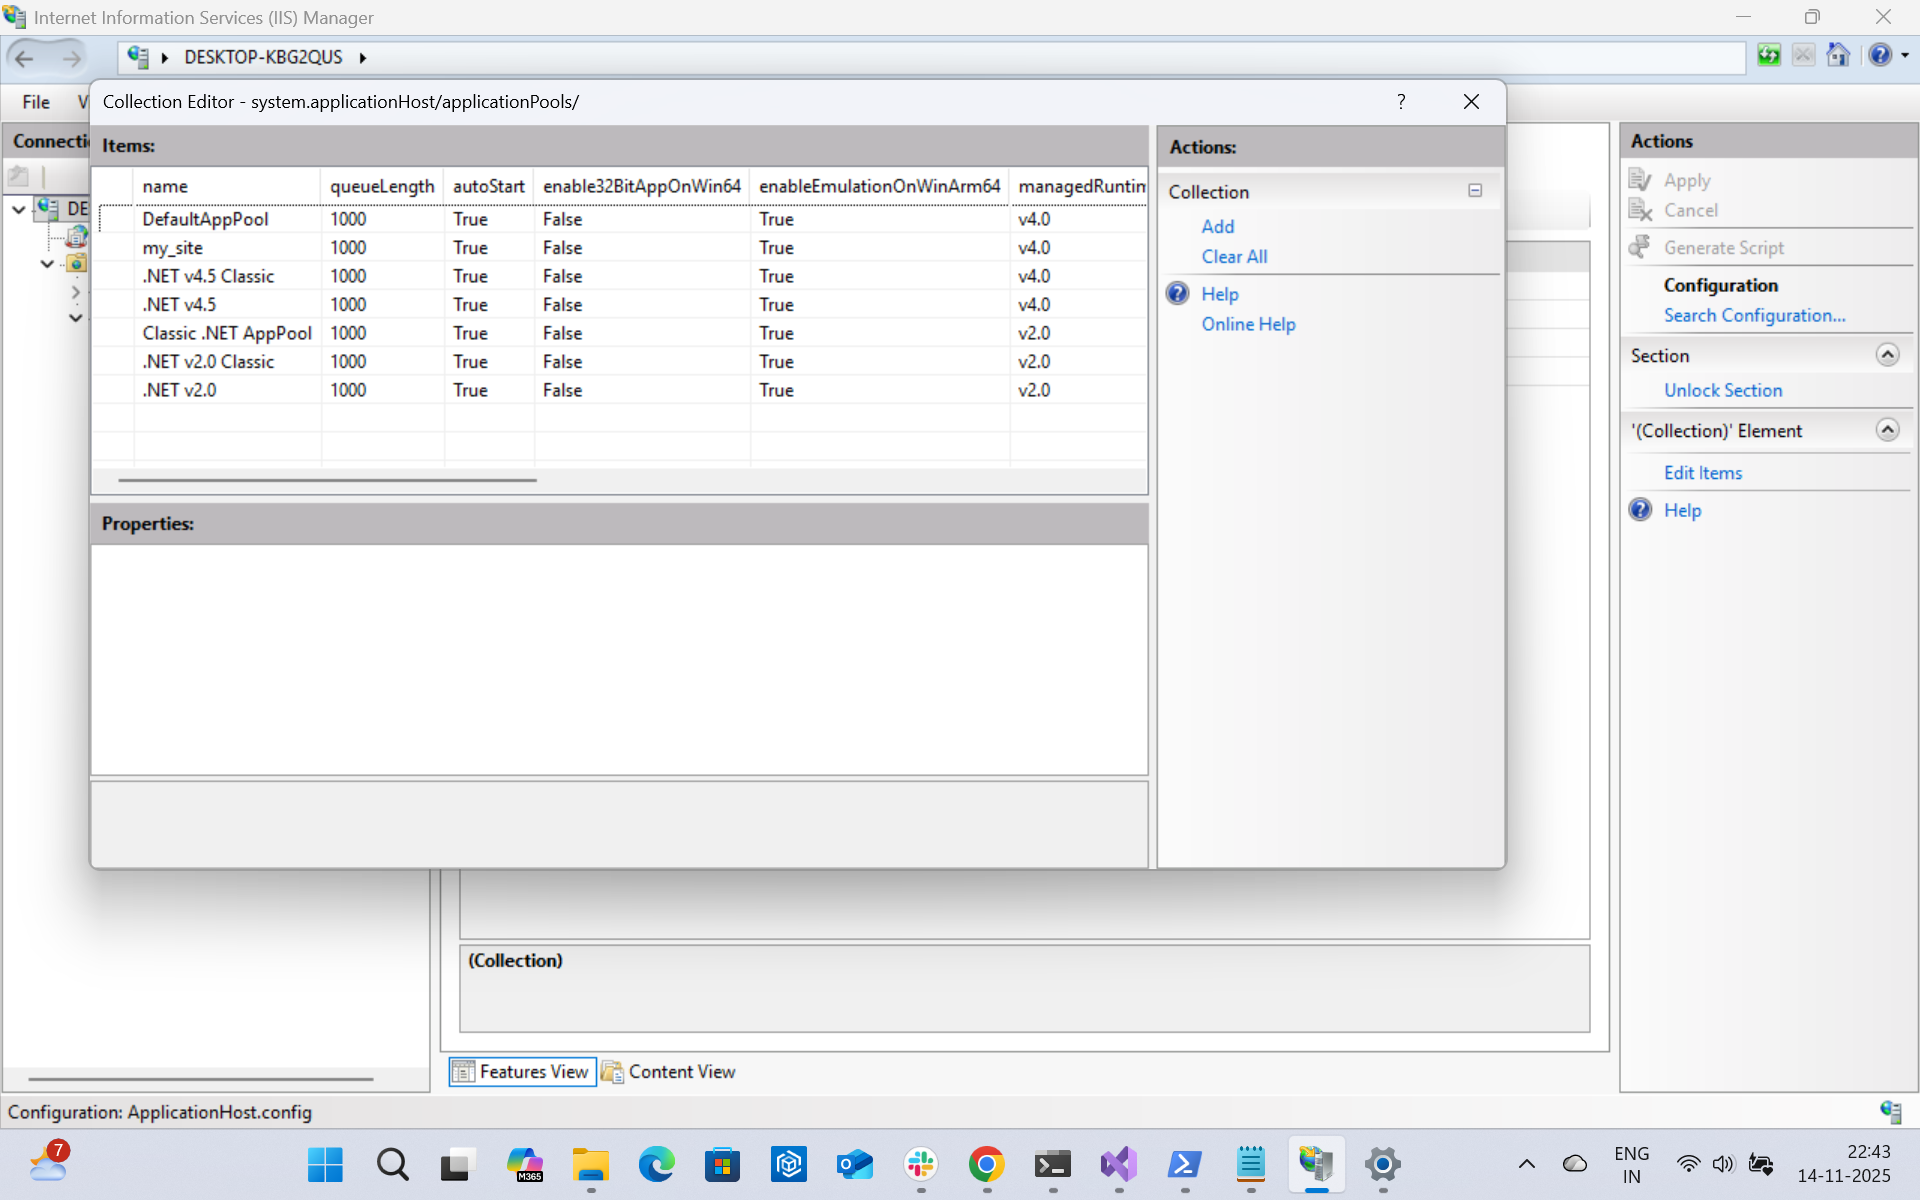
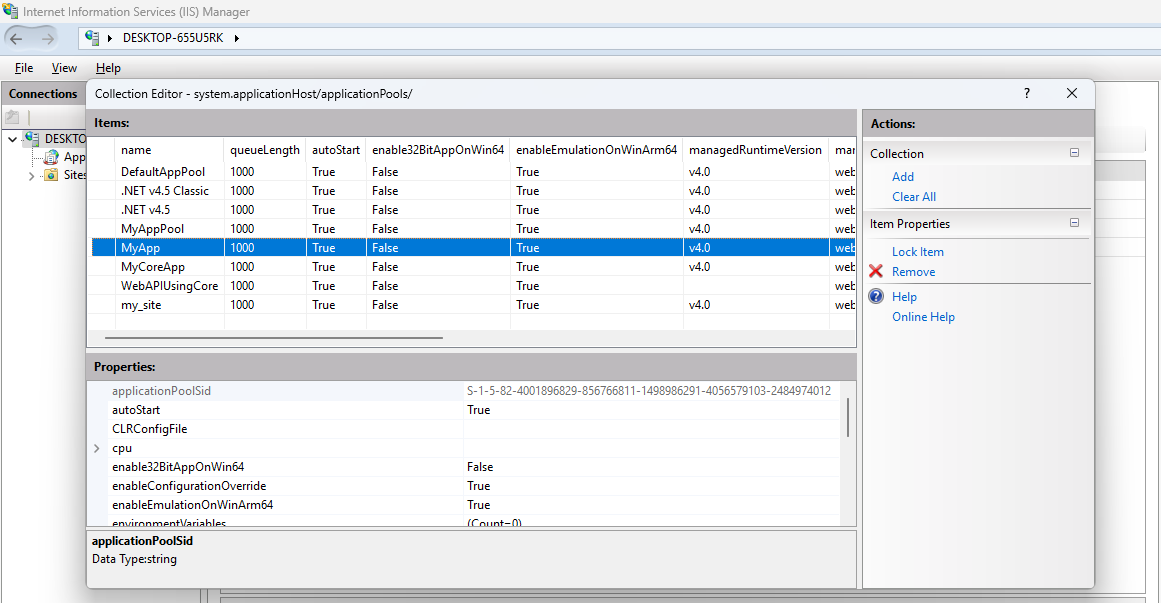
Instrumentation Process .NET Core 3.1 Application The .NET Core 3.1 application does not support full auto instrumentation. It is partial auto instrumentation, which means code changes are required. The code changes are related to initializing the open telemetry. Add the Open telemetry packages Add Open telemetry service. In the Make sure you include the required packages Set the following environment variables Build the application and run it. .NET Application Running in Linux / MacOS (.NET Core) Install Open Telemetry Follow the steps below to install Open Telemetry in Linux / macOS machines. This is a one-time activity for a machine. Instrument the application Every time you run the application, follow the steps below. Remove the instrumentation .NET Application Running on Container (.NET Core) Modify the Dockerfile to include the following lines to enable opentelemetry auto instrumentation Build the docker image Create a file called Run the Docker image with the following environment variables and env file ASP.NET Application running in IIS (.NET Framework & .NET Core) Download the instrumentation package ( Open Powershell in administrator mode. Go into the folder where the instrumentation packages are extracted. Install open telemetry auto instrumentation by running the powershell script By default, this is installed in the “C:\Program Files\OpenTelemetry .NET AutoInstrumentation” directory. You can install this in any folder by changing the “InstallDir” option Run the command Set the setting to the application. Option 1: Using IIS Manager You can set the following settings using the “Application Settings” menu from IIS manager. This is the safest option. Option 2: Add to <appSettings> in Web.config When your application already uses <appSettings> in the Web.config, then go ahead and add the following keys. Note: Only one <appSettings> section is allowed in Web.config. An example is shown below. Option 3: External config file Use this when your Web.config doesn’t currently have <appSettings> and you wanna keep telemetry settings separate. Note: Only one <appSettings> section is allowed in Web.config. Option 4: Add as Environment Variables in the Application Pool (Per-App Pool) When your application runs in its own dedicated Application Pool, you can configure the OpenTelemetry settings as environment variables directly on that pool. These variables apply only to the worker process for that pool. However, if the Application Pool is shared by multiple applications, you should not use this option because the instrumentation settings (such as application name and service name) would incorrectly apply to every app in that shared pool. Press '...' in the first entry of the table (Collection). Select the row with your application pool name. For .NET Core applications. Example: Restart IIS Enable / Disable Instrumentation per Application Pool (.NET Framework only) By default, all the applications are instrumented. But you can disable instrumentation per application pool. To enable the instrumentation for the Application Pool, you can use the below command Warning: Property is not found If you get below error then the instrumentation will not work, To fix above issue we need to run below command Remove Instrumentation .NET Application running as exe in Terminal Install the Opentelemetry Installing the open telemetry is a one-time job for a machine. This will install Open Telemetry on the machine. Download the instrumentation package (dotnet_auto_instrumentation_offline_package.zip) and extract it. Open PowerShell in administrator mode. Go into the folder where the instrumentation packages are extracted. Install OpenTelemetry auto instrumentation by running the powershell script OpenTelemetry.DotNet.Auto.psm1 By default, this is installed in the “C:\Program Files\OpenTelemetry .NET AutoInstrumentation” directory. You can install this in any folder by changing the “InstallDir” option Instrument the application running as an exe Once Open Telemetry is instrumented, the application can be instrumented using the steps below. These steps need to be followed every time you run the application. Instead of running these commands every time, you can create a PowerShell script to automate this. A sample PowerShell script is shown below. Uninstall Open Telemetry for exe .NET Application running as exe in Task Scheduler Download the instrumentation package ( Open Powershell in administrator mode. Go into the folder where the instrumentation packages are extracted. Install open telemetry auto instrumentation by running the powershell script By default, this is installed in the “C:\Program Files\OpenTelemetry .NET AutoInstrumentation” directory. You can install this in any folder by changing the “InstallDir” option Create a wrapper PowerShell script to wrap your exe Configure the following to match your environment Modify your task Example: Uninstall Open telemetry for exe running in Task Scheduler
Startup.cs add the below code
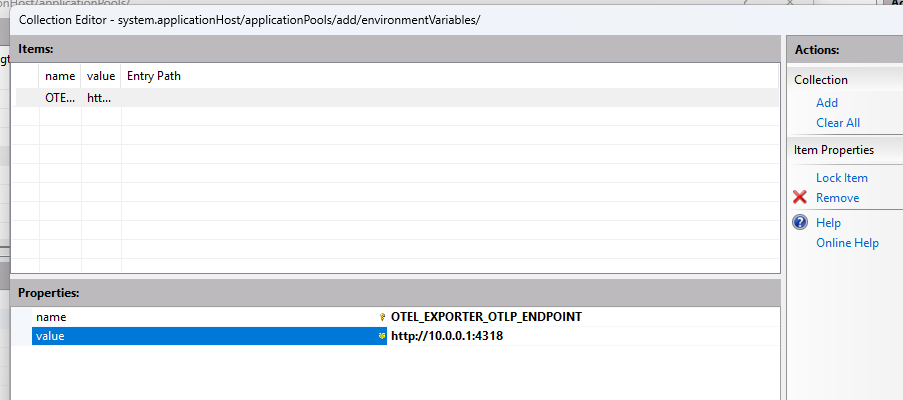
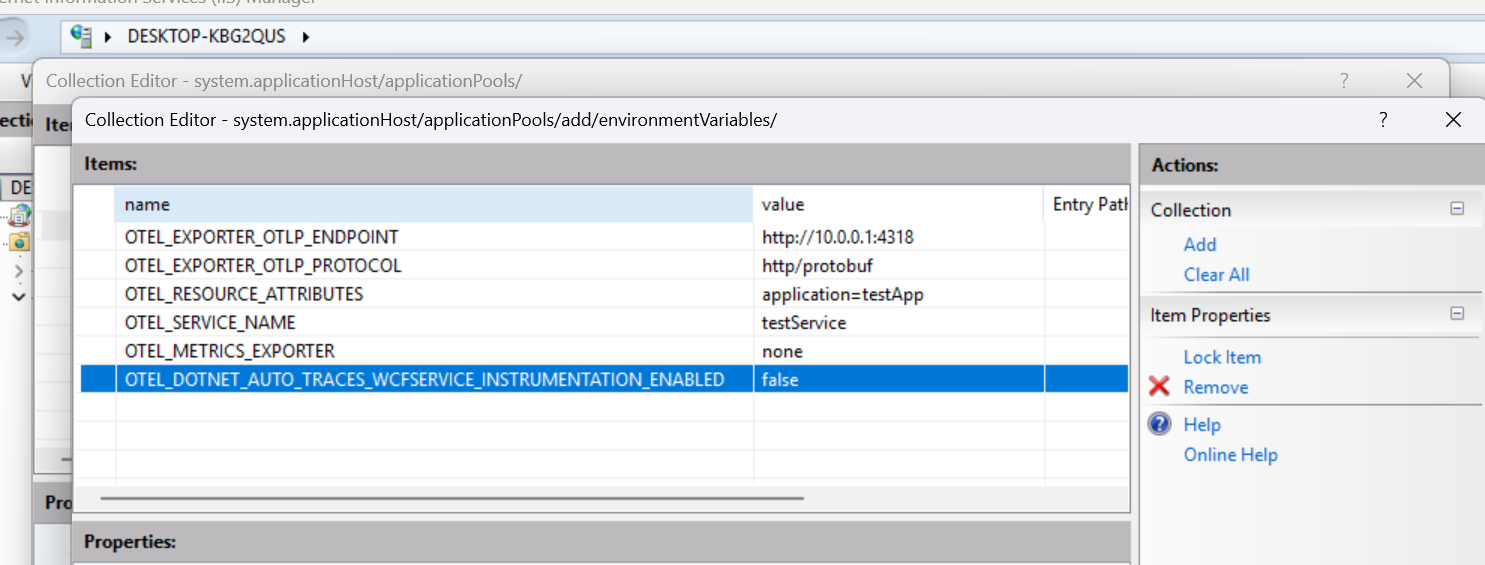
OTEL_EXPORTER_OTLP_ENDPOINT with value “http://<vuSmartMaps Server IP>:4318”OTEL_EXPORTER_OTLP_PROTOCOL with value “http/protobuf”OTEL_RESOURCE_ATTRIBUTES with value “application=<APPLICATION_NAME>”OTEL_SERVICE_NAME with value “<SERVICE_NAME>”
otel-dotnet.env with the following content
dotnet_auto_instrumentation_offline_package.zip) from the O11ysource and extract it.OpenTelemetry.DotNet.Auto.psm1Register-OpenTelemetryForIIS. This will restart the IIS.
For .NET Framework applications.
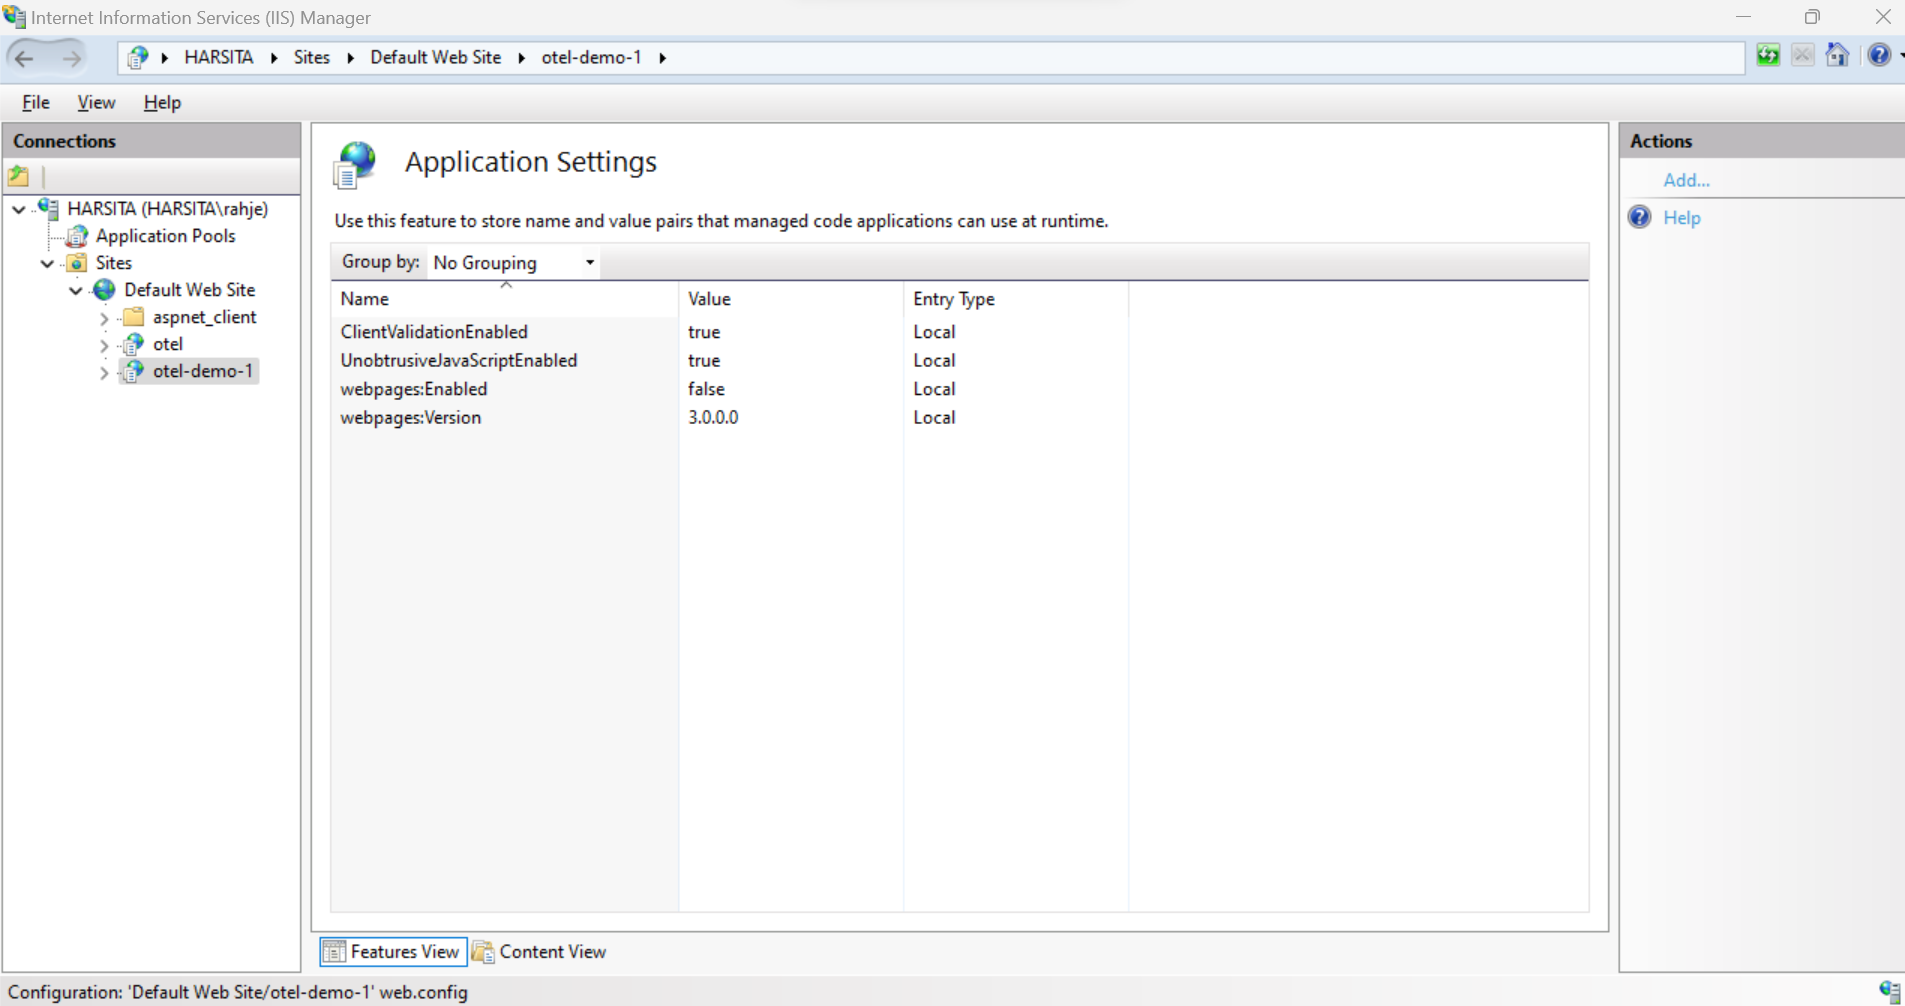

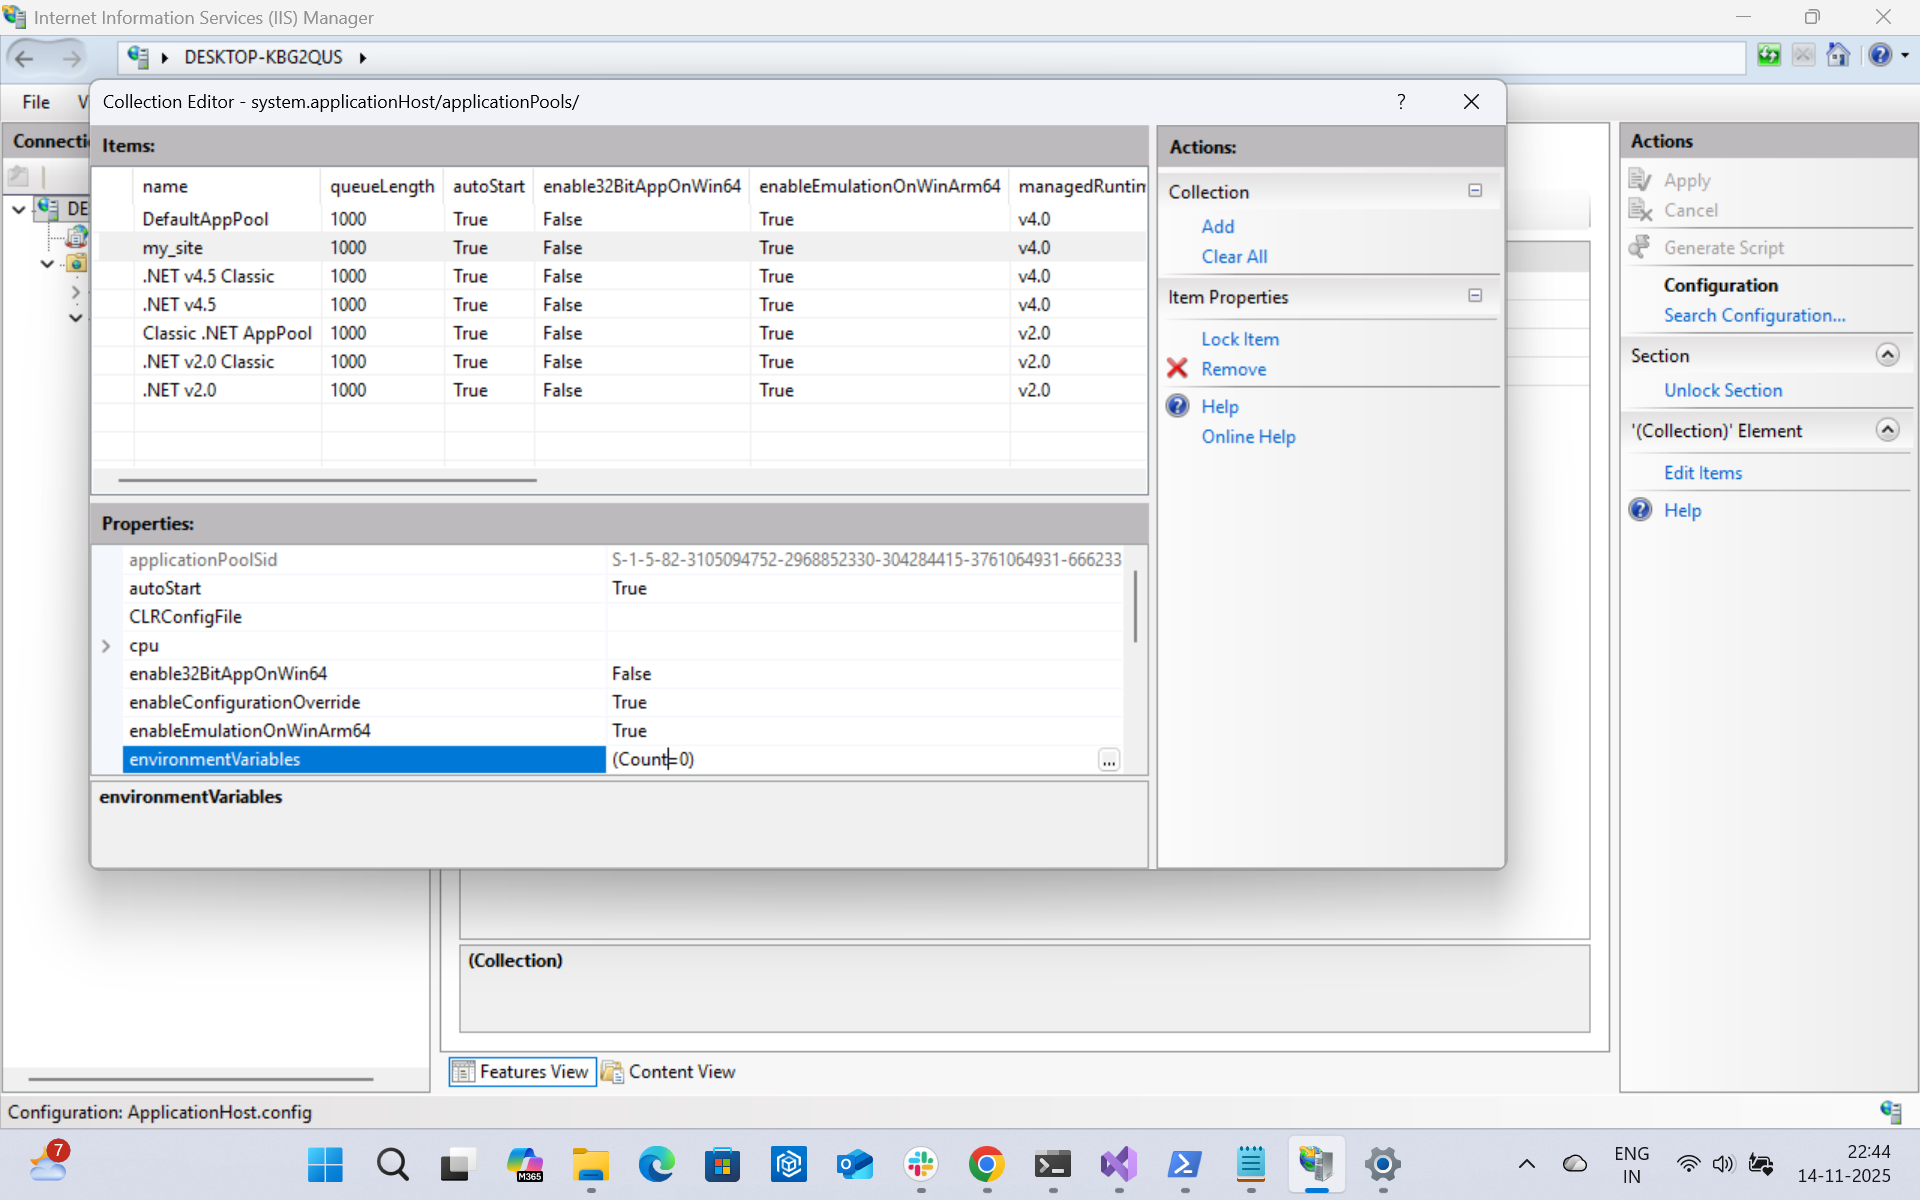


<environmentVariables> in <aspNetCore> section in web.config file
OTEL_EXPORTER_OTLP_ENDPOINT with value “http://<vuSmartMaps Server IP>:4318”OTEL_EXPORTER_OTLP_PROTOCOL with value “http/protobuf”OTEL_RESOURCE_ATTRIBUTES with value “application=<APPLICATION_NAME>,host.name=<host_name>,host.ip=<host_ip>”OTEL_SERVICE_NAME with value “<SERVICE_NAME>”OTEL_METRICS_EXPORTER with value “none”
dotnet_auto_instrumentation_offline_package.zip) from O11ysources and extract it.OpenTelemetry.DotNet.Auto.psm1
$otelResourceAttributes = "application=$applicationName,host.name=$hostName,host.ip=$hostIp"$otelResourceAttributes = "application=$applicationName,host.name=$hostName,host.ip=$hostIp"
powershell.exe. The path is typically “C:\Windows\System32\WindowsPowerShell\v1.0\powershell.exe”
-ExecutionPolicy Bypass -File "<full path of the wrapper powershell script you created>"-ExecutionPolicy Bypass -File "C:\Myne\instrument-exe\MyDotNetApp\MyApp.ps1"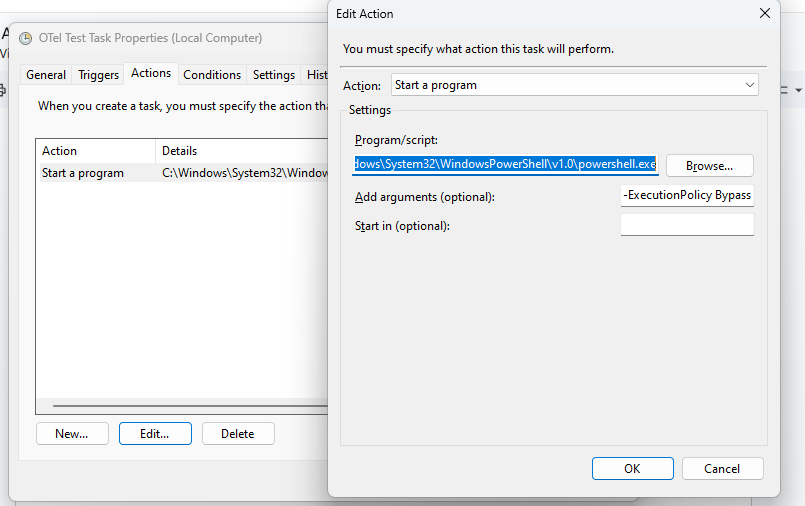
OpenTelemetry.DotNet.Auto.psm1
Configuration Capture HTTP Headers In some applications, key transaction identifiers are passed as HTTP headers to the APIs. To capture these headers, additional instrumentation configurations are required. Below are the steps and examples for capturing HTTP headers for both HTTP servers and clients. Capture HTTP Request Header for ASP.NET Core To capture the request headers of ASP.NET Core, use the following configuration along with other instrumentation configurations mentioned in the previous sections. You can configure one or more headers to be captured. If capturing multiple headers, separate them with commas. Based on the environment, add this additional configuration.
For example Capture HTTP Response Header for ASP.NET Core To capture the response headers of ASP.NET Core, use the following configuration along with other instrumentation configurations mentioned in the previous sections. You can configure one or more headers to be captured. If capturing multiple headers, separate them with commas. Based on the environment, add this additional configuration.
For example Capture HTTP Request Header for ASP.NET To capture the request headers of ASP.NET, use the following configuration along with other instrumentation configurations mentioned in the previous sections. You can configure one or more headers to be captured. If capturing multiple headers, separate them with commas. Based on the environment, add this additional configuration.
For example Capture HTTP Response Header for ASP.NET To capture the response headers of ASP.NE, use the following configuration along with other instrumentation configurations mentioned in the previous sections. You can configure one or more headers to be captured. If capturing multiple headers, separate them with commas. Based on the environment, add this additional configuration.
For example Capture HTTP Attributes for Web Forms and ASMX Applications The .NET auto instrumentation doesn’t capture the HTTP attributes from the ASPX (Web Forms) and ASMX (SOAP Based Web services). You cannot get the HTTP URL, HTTP Status Code etc. To capture this, use a http enrichment module and add it to those specific applications. Please refer Capture HTTP Attributes for Web Forms Applications.
Pre-requisites for Auto-Instrumentation
- Due to how
eBPFworks only linux systems are supported.Autoinstrumentation doesn’t work for windows or MAC. Linuxenvironments with kernel version above4.4. To check your kernel version use the below command:
>> uname -r
6.8.0-57-generic
- Make sure the application to be instrumented uses a supported version of
go. As of 8th Apr 2025 the latest supported version isgo1.24hence the recommended go versions are>=go1.22. - The recommended processor architectures are
ARM64andAMD64. - Additionally, a user with
sudoprivileges is required to run the instrumentation binary on the host if the application is running on the host machine directly.
Supported Packages
Since Auto-Instrumentation using eBPF is a fairly new project, only a very limited and commonly used packages are supported namely:
Any http framework that relies on net/http will work as well(for ex: mux, gin). Also any database driver that implements the database/sql interface will be instrumented.
Running the Instrumentation Binary
All that is required to auto instrument a go application is to run the instrumentation alongside the application with elevated permissions (since it needs access to system level components) and configure it to point to the application binary and the exporter. We shall discuss three deployment options based on how your application is deployed and run.
Instrumentation Process Linux This option is suitable if you are running your application on the host machine directly as a process by running the application binary. We should now be able to see the spans being generated and being pushed to the collector configured. If the instrumentation binary is run before the application is started the instrumentation binary will wait for the application on start up. Docker/Docker-Compose Although not heavily used in production setups, docker-compose is one of the ways to run and orchestrate multi-layered applications. To instrument them, we shall run the instrumentation binary as a side car container to them.
docker-compose.yml file where you defined the application:
docker-compose uppid: “container:payment_switch” allows the instrumentation binary to access and interact with the processes running in the payment_switch container. And this is how the instrumentation binary gets access to the running application.
Steps for Instrumentation
The following steps should be followed:
- Install the OpenTelemetry Operator
- Install the vuTraces Auto Instrumentation CRD
- Add the required annotations to the workload based on the programming language
- Configure the application name
- Configure the HTTP headers to be captured, if required
Step 1: Install OTel Operator / Instrumentation CRD
Using Helm
The detailed instructions for all these steps are shown below.
- Download the OpenTelemetry Operator helm chart and install it using the command below.
Please replace the placeholder with your namespace, e.g.:
<namespace-to-be-used-for-operator>
helm install opentelemetry-operator opentelemetry-operator-0.71.0.tgz \
  --namespace <namespace-to-be-used-for-operator> \
  --create-namespace \
  --set "manager.collectorImage.repository=otel/opentelemetry-collector-k8s" \
  --set admissionWebhooks.certManager.enabled=false \
  --set admissionWebhooks.autoGenerateCert.enabled=true
- Download the vuTraces auto instrumentation helm chart and install it:
helm install vutraces-auto-instrumentation vutraces-auto-instrumentation-1.0.0.tgz \
  --namespace <namespace-to-be-used-for-instrumentation-crd> \
  --create-namespace \
  --set vutracesexporter.endpoint="http://<vuSmartMaps_server>:4317"
Replace
<vuSmartMaps_server>and the namespace placeholders with values appropriate to your environment.
Using Manifest YAML
The complete package is available at K8s Manifest Package
-
Ensure cert-manager is installed in the cluster (required by OpenTelemetry Operator). If it’s not already installed, follow the official installation instructions. Otherwise, use this cert-manager manifest.
-
Install the Open Telemetry Operator using this manifest.
-
Download the manifest of the vuTraces auto instrumentation CRD from here. Modify the following in the manifest to match your environment, and install it
-
namespace - It is recommended to use the application’s namespace.
-
Change the value of the environment variable OTEL_EXPORTER_OTLP_ENDPOINT to point to Vunet’s Traces ingestion endpoint.
-
For Java, use the port 4317
-
For .NET, use the port 4318
-
-
Step 2: Annotate the Workloads
Add the following annotations to your Deployment manifests (in spec.template.metadata.annotations), replacing the <namespace-of-instrumentation-crd> placeholder.
Java workloads
annotations:
  instrumentation.opentelemetry.io/inject-java: "<namespace-of-instrumentation-crd>/vutraces-auto-instrumentation"
.NET workloads
annotations:
  instrumentation.opentelemetry.io/inject-dotnet: "<namespace-of-instrumentation-crd>/vutraces-auto-instrumentation"
Go workloads
annotations:
  instrumentation.opentelemetry.io/inject-go: "<namespace-of-instrumentation-crd>/vutraces-auto-instrumentation"
Python workloads
annotations:
  instrumentation.opentelemetry.io/inject-python: "<namespace-of-instrumentation-crd>/vutraces-auto-instrumentation"
If you are using a musl-based Python image (e.g., Alpine), also add:
annotations:
  instrumentation.opentelemetry.io/otel-python-platform: "musl"
Node.js workloads
annotations:
  instrumentation.opentelemetry.io/inject-nodejs: "<namespace-of-instrumentation-crd>/vutraces-auto-instrumentation"
If there are multiple containers in the Pod, add:
annotations:
  instrumentation.opentelemetry.io/container-names: "your-app-container-name"
If you have many deployments, automate annotation addition (you referenced an automation script for .NET — use that as a template).
Step 3: Configure Application Name
Add this environment variable to your Deployment container spec to set the application name:
- name: OTEL_RESOURCE_ATTRIBUTES
  value: "application=<app_name>"
Step 4: Capture HTTP Headers
Add environment variables to configure headers to capture.
Java workloads
- name: OTEL_INSTRUMENTATION_HTTP_SERVER_CAPTURE_REQUEST_HEADERS
  value: "Header1,Header2"

- name: OTEL_INSTRUMENTATION_HTTP_SERVER_CAPTURE_RESPONSE_HEADERS
  value: "Header3,Header4"

- name: OTEL_INSTRUMENTATION_HTTP_CLIENT_CAPTURE_REQUEST_HEADERS
  value: "Header5,Header6"

- name: OTEL_INSTRUMENTATION_HTTP_CLIENT_CAPTURE_RESPONSE_HEADERS
  value: "Header7,Header8"
.NET workloads
- name: OTEL_DOTNET_AUTO_TRACES_ASPNETCORE_INSTRUMENTATION_CAPTURE_REQUEST_HEADER
  value: "Header1,Header2"

- name: OTEL_DOTNET_AUTO_TRACES_ASPNETCORE_INSTRUMENTATION_CAPTURE_RESPONSE_HEADERS
  value: "Header3,Header4"

- name: OTEL_DOTNET_AUTO_TRACES_ASPNET_INSTRUMENTATION_CAPTURE_REQUEST_HEADERS
  value: "Header5,Header6"

- name: OTEL_DOTNET_AUTO_TRACES_ASPNET_INSTRUMENTATION_CAPTURE_RESPONSE_HEADERS
  value: "Header7,Header8"
Steps for Uninstalling the Instrumentation
- Remove the annotations you added.
- Remove the environment variables you added.
- Uninstall the vuTraces Auto Instrumentation CRD:
helm uninstall vutraces-auto-instrumentation --namespace <namespace-of-instrumentation-crd>
- Uninstall the OpenTelemetry Operator:
helm uninstall opentelemetry-operator --namespace <namespace-of-operator>
**Sample Manifest Files for Reference **
Here are the sample manifest YAM files for your reference. You can see specific examples.
A sample K8s Manifests for Java Application
- A sample yaml file for a java workload is available here.
A sample K8s Manifests for Java Application with Multiple Containers within a pod
- A sample yaml file for a java workload is available here.
A sample K8s Manifests for .NETApplication
- A sample yaml file for a java workload is available here.
Implementation/Procedure
This section provides the detailed instructions for instrumenting node.js services. Zero-code instrumentation for JavaScript provides a way to instrument any Node.js application and capture telemetry data from many popular libraries and frameworks without any code changes.
Instrumentation Procedure
Instrumentation for Node.js requires the installation of a couple of opentelemetry libraries as dependencies in the application regardless of the environment in which they are run. Along with this we can configure the instrumentation through environment variables. We shall explain the steps to achieve them and various options available below: Instrumenting Node.js applications (TypeScript and JavaScript) run using node command Follow the below steps to instrument Node.js application developed using TypeScript and run locally using node command. Step1 - Install the Opentelemetry dependencies Go to the application code and run the following command. If the environment doesn’t have access to the internet to install the packages, use the provided Step2 - Configure the Instrumentation Set the following environment variables Please change the values of <TRACES_INGESTION_ENDPOINT>, <APPLICATION_NAME> and <SERVICE_NAME> Step3 - Register the Instrumentation Register the auto instrumentation by setting the following environment variable Step4 - Run the application Run the Node.js application as usual. You will get the traces data in the vuSmartMaps. Remove Instrumentation To remove the instrumentation, unset the environment variables set for instrumentation Instrumenting Node.js applications (TypeScript and JavaScript) run using PM2 Follow the below steps to instrument Node.js application developed using TypeScript and run using PM2 Step1 - Install the Opentelemetry dependencies Go to the application code and run the following command. --save options saves the installed dependencies to package.json file automatically. After running the command you should see this change in package.json. If the environment doesn’t have access to the internet to install the packages, use the provided tar files of the packages and place them in the same directory as package.json. Once done edit the package.json to include the below two lines in the dependencies section and run npm install --offline. Step2 - Stop the Service Stop and delete the Node.js service using PM2 Step3 - Configure the Instrumentation Right now, you may be using the command pm2 start app.js --name "name of service" to start the Node.js service. Instead, you need to use pm2 start ecosystem.config.js Create a file called “ecosystem.config.js” in your app folder with the following content. Please make sure you use the correct name and script. Please change the values of <TRACES_INGESTION_ENDPOINT>, <APPLICATION_NAME> and <SERVICE_NAME> Verify the environment variables using the below command to confirm all are set correct. Step4 - Start the application Restart the Node.js application as usual using PM2. For example: You will get the traces data in the vuSmartMaps. From now on, you can restart the service using the below command Alternatively, if you modify any environment variables later, use This ensures that PM2 reloads the latest environment settings. Removing Instrumentation To remove OpenTelemetry instrumentation and revert to a normal PM2 setup, Instrumenting Node.js applications (TypeScript and JavaScript) running in Docker Follow the below steps to instrument Node.js application developed using TypeScript running in Docker Step1 - Modify the Dockerfile Modify the Dockerfile and include the following lines. This is used to install the Open telemetry APIs and enable the auto instrumentation Step2 - Build the Docker image Once the above mentioned changes are done in Dockerfile, build the docker image, as usual Step3 - Run the application with additional envs RUn the docker image of the application with the following environment variables Remove Instrumentation To remove the instrumentation, rebuild the docker image by removing the following lines from the Dockerfile and run the docker image without the environment variable mentioned above.--save options saves the installed dependencies to package.json file automatically. After running the command you should see this change in package.json.tar files of the packages and place them in the same directory as package.json. Once done edit the package.json to include the below two lines in the dependencies section and run npm install --offline.
Implementation/Procedure
This section provides the detailed instructions for instrumenting python services. Zero-code instrumentation for python provides a way to instrument any Python application and capture telemetry data from many popular libraries and frameworks without any code changes.
Instrumentation Procedure
Instrumentation for Installing Dependencies The following two libraries are required to be installed as dependencies either by using the Additional optional packages (based on your exporters and protocols): Package Details Configuring the Instrumentation All configurations are done through environment variables as with other languages. Below are some of the mandatory and important OTEL_TRACES_EXPORTER The type of exporter to use for sending the generated traces. Possible values include OTEL_EXPORTER_OTLP_TRACES_ENDPOINT The endpoint where the OTEL collector is running. For example: OTEL_SERVICE_NAME The name of the service being instrumented. This value will be used and saved in the generated traces under the field OTEL_PYTHON_DISABLED_INSTRUMENTATIONS Comma-separated list of libraries to disable auto-instrumentation. By default all libraries supported and available in the environment will be instrumented. Running the Application After the above steps are completed, run the application using the below command: where Python requires the installation of a couple of opentelemetry libraries as dependencies in the application regardless of the environment in which they are run. Along with this we can configure the instrumentation through environment variables. We shall explain the steps to achieve them and various options available below:.whl file provided or directly from the pip repository if connected to the internet.
envs to be added:otlp, console and zipkin. Since we use the OTEL collector to capture the traces, the value must be set to otlp.http://localhost:4317, http://otel-collector:4318 etc.. As a convention usually port 4317 is configured on grpc protocol and 4318 for http protocol in the OTEL collector. Select the port accordingly. In most cases, unless specified, the default port is 4317 with grpc.resource_attributes_service_name.app.py is assumed to be the entrypoint for the application, but change this accordingly for your application. For gunicorn-based apps:
Instrumentation Process
Prebuilt packages of the module are available for easy installation. Follow these steps to install NGINX Open Source with the OTel module. See list of compatible operating systems. Adding Package Repositories and Installing NGINX Open Source Follow the official NGINX Open Source installation steps to set up package repositories for your specific operating system and install NGINX. Installing Nginx on Ubuntu Install the prerequisites: Import an official nginx signing key so apt could verify the packages authenticity. Fetch the key: Verify that the downloaded file contains the proper key: The output should contain the full fingerprint Note that the output can contain other keys used to sign the packages. To set up the apt repository for stable nginx packages, run the following command: If you would like to use mainline nginx packages, run the following command instead: Set up repository pinning to prefer our packages over distribution-provided ones: To install nginx, run the following commands: Installing the OTel Module from Packages Enabling the OTel Module Module configurations can be found here. Following the installation steps above will install the module into Example Configuration: Below is the sample nginx.conf used for vuBank where OTEL module is enabled Restart the nginx for the changes to take effect Generating Load To generate load you can login to vuBank. This would hit the Nginx webserver. Verfiy the OTEL Data To verify if the OTEL data from Nginx , login to to kafka and check the traces-input topic. In the Otel data we should be able to see 573BFD6B3D8FBC641079A6ABABF5BD827BD9BF62 as follows:/etc/nginx/modules by default. Load the module by adding the following line to the top of the main NGINX configuration file, located at /etc/nginx/nginx.conf.resouce_attributes_service_name coming with vubank_nginx.
