Smart-Frames
Introduction
Smart-Frames provide a consolidated access point for viewing and consuming configured Smart Frames across the platform. They enable users to open reusable operational views, analyze observability data, and navigate to relevant investigation pages from a single location. The Smart-Frames page helps users quickly locate available Smart Frames, understand their purpose through descriptions, and access the required view for monitoring, troubleshooting, or analysis.
Accessing Smart-Frames
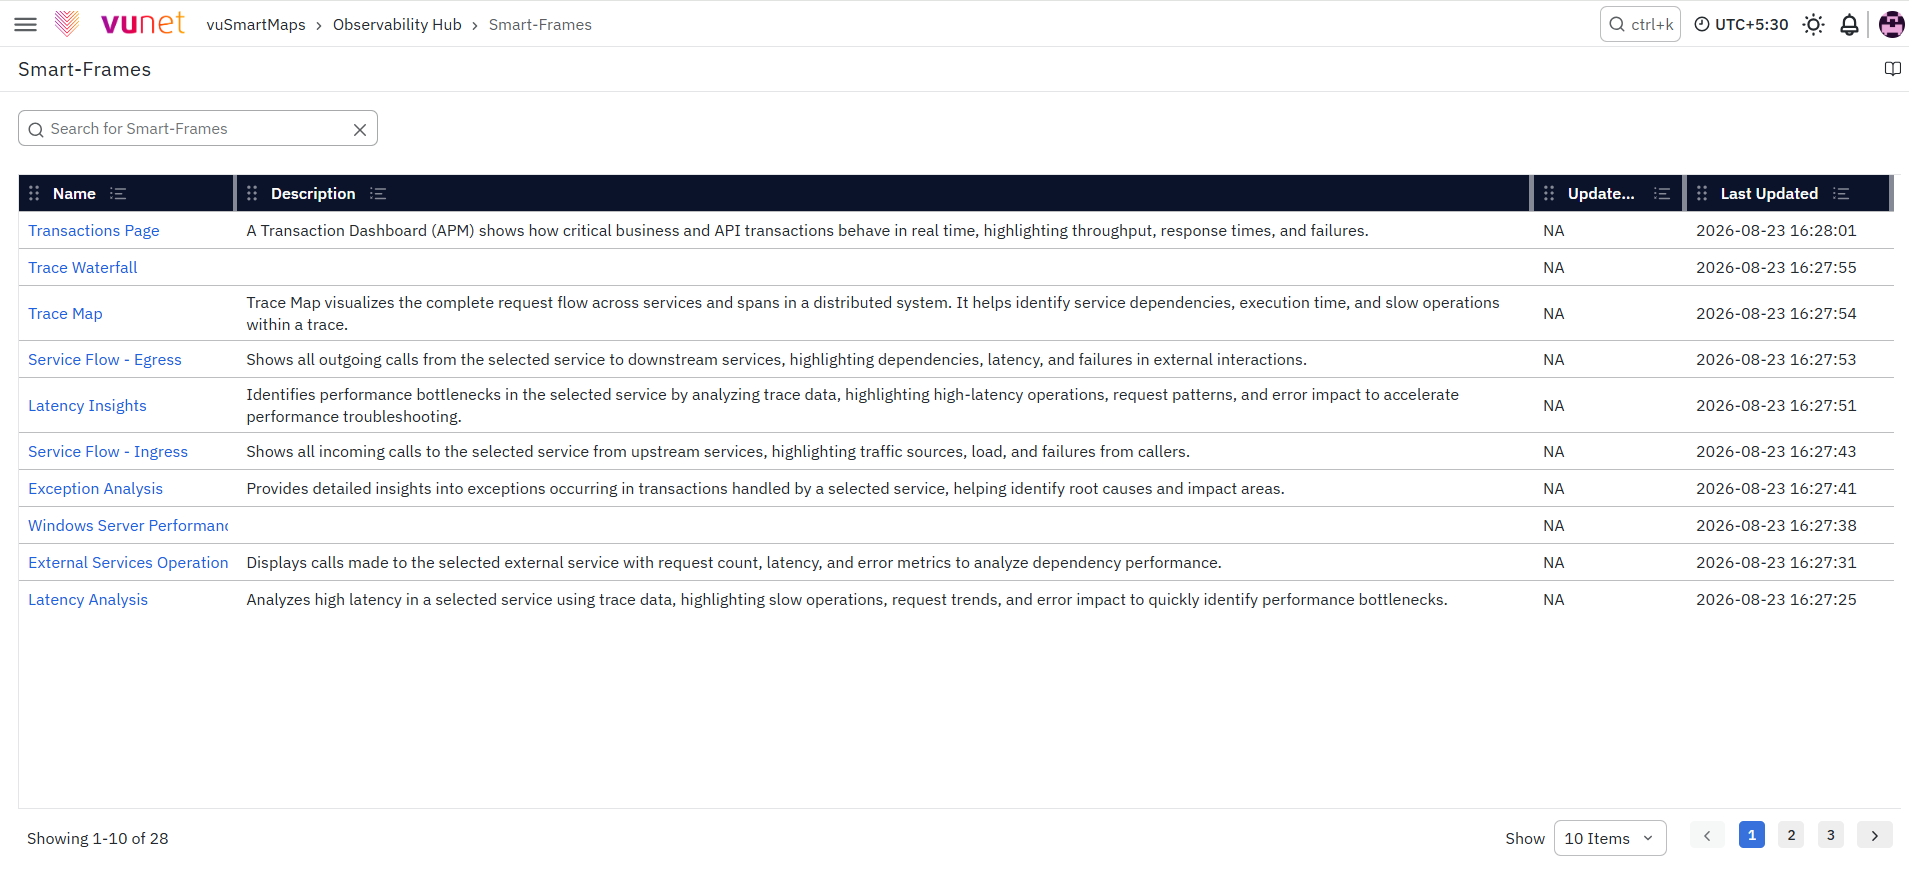
To access Smart-Frames:
-
Navigate to Observability Hub > Smart-Frames.
-
The Smart-Frames page displays the list of Smart Frames available to the user based on their assigned permissions.
Smart-Frames Page
The Smart-Frames page displays Smart Frames in a tabular format. Each row represents a Smart Frame, along with its description and update information. This page helps users quickly locate the required Smart Frame and open it for further analysis.
Search Smart-Frames
-
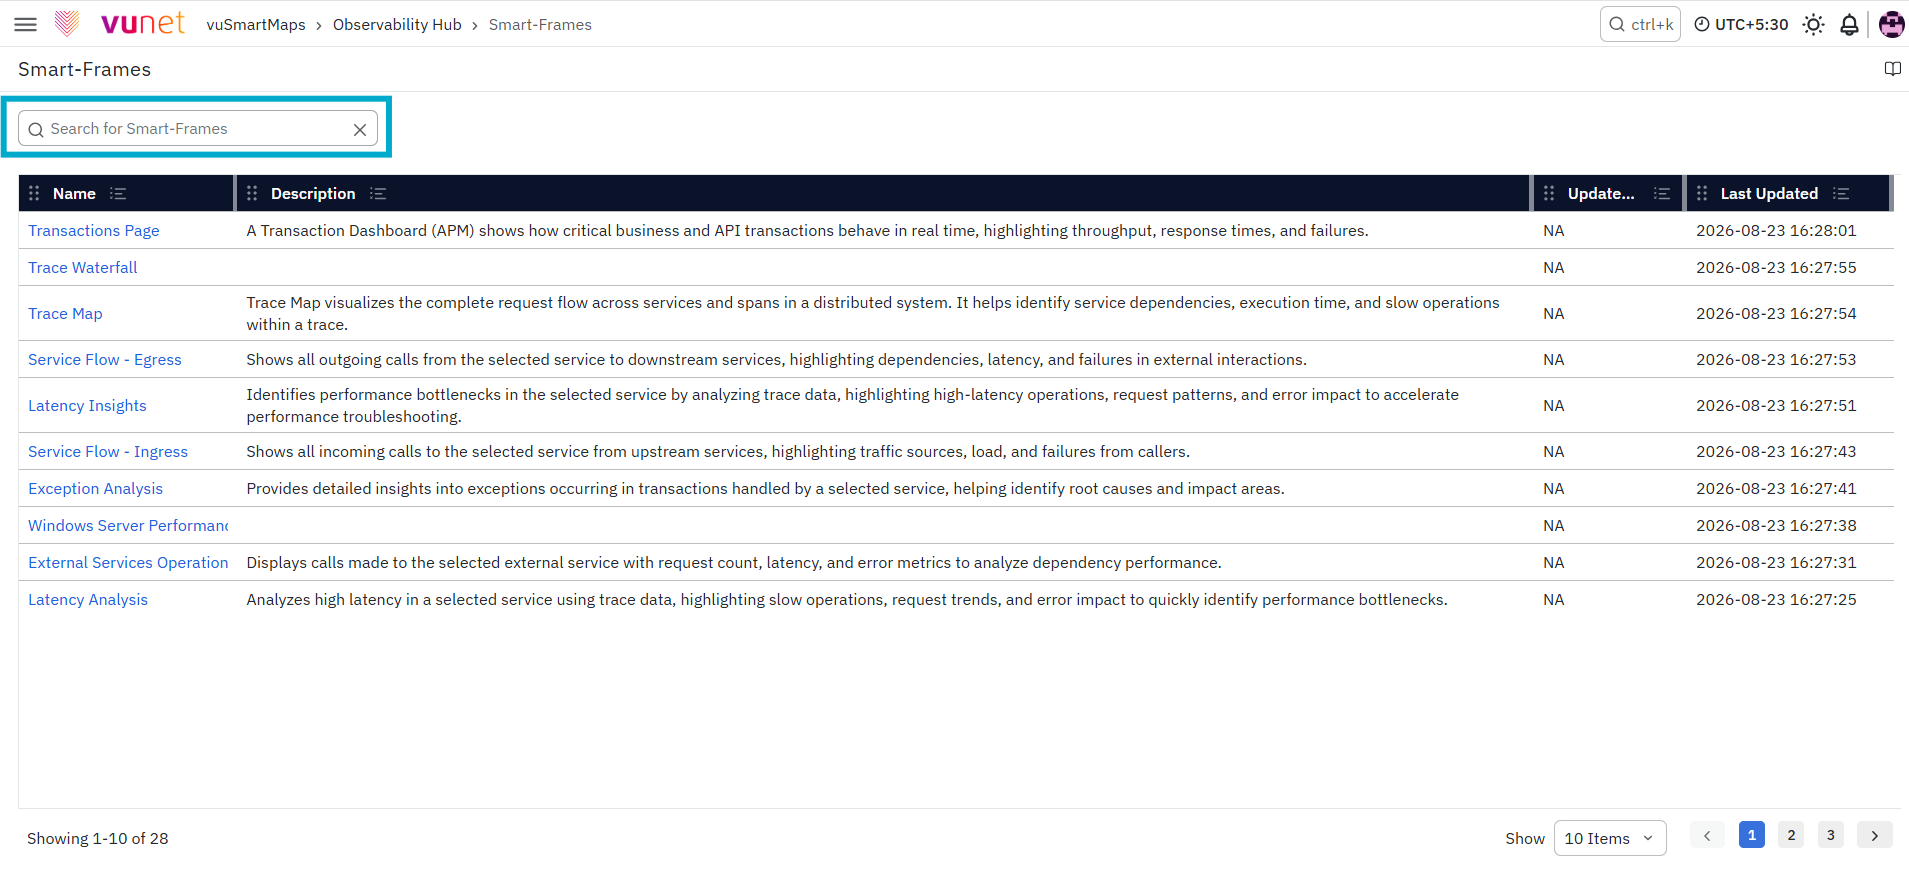
Use the Search for Smart-Frames field to quickly locate a Smart Frame.
-
The list updates based on the entered search text, helping users find the required Smart Frame without manually scrolling through the complete list.
Smart-Frames List
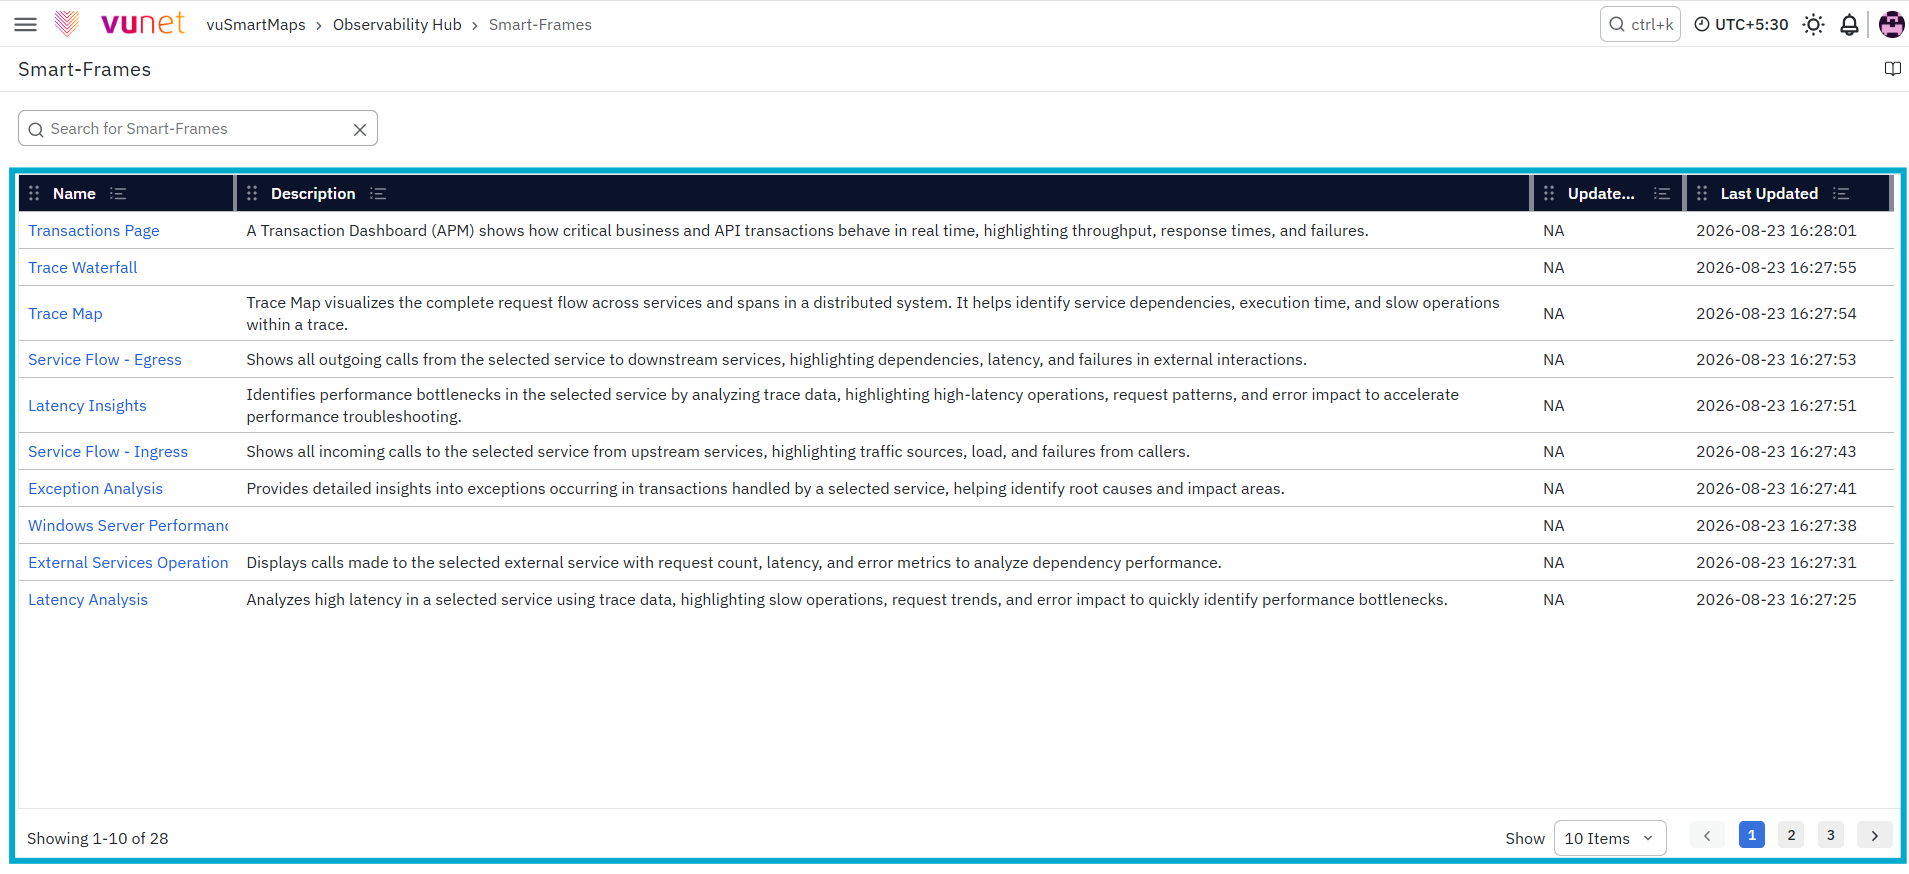
The Smart-Frames list displays the available Smart Frames and their associated information.
| Column | Description |
|---|---|
| Name | Displays the Smart Frame name. Click the name to open the Smart Frame. |
| Description | Provides a brief description of the Smart Frame and its purpose. |
| Updated By | Displays the user who last updated the Smart Frame. |
| Last Updated | Shows the date and time when the Smart Frame was last updated. |
Viewing a Predefined Smart Frame
The Smart-Frames page provides access to predefined Smart Frames for common monitoring and troubleshooting use cases. Users can open a Smart Frame to view panels, apply filters, review metrics, and navigate to related analysis views. For example, the Transactions Page Smart Frame helps users analyze transaction performance, throughput, latency, and error patterns for deeper investigation.
Transactions Page
The Transactions Page Smart Frame provides a transaction-level view of application and API performance over the selected time range. It helps users review transaction throughput, latency, error percentage, and failure distribution for the selected service, host, status, or request attributes.
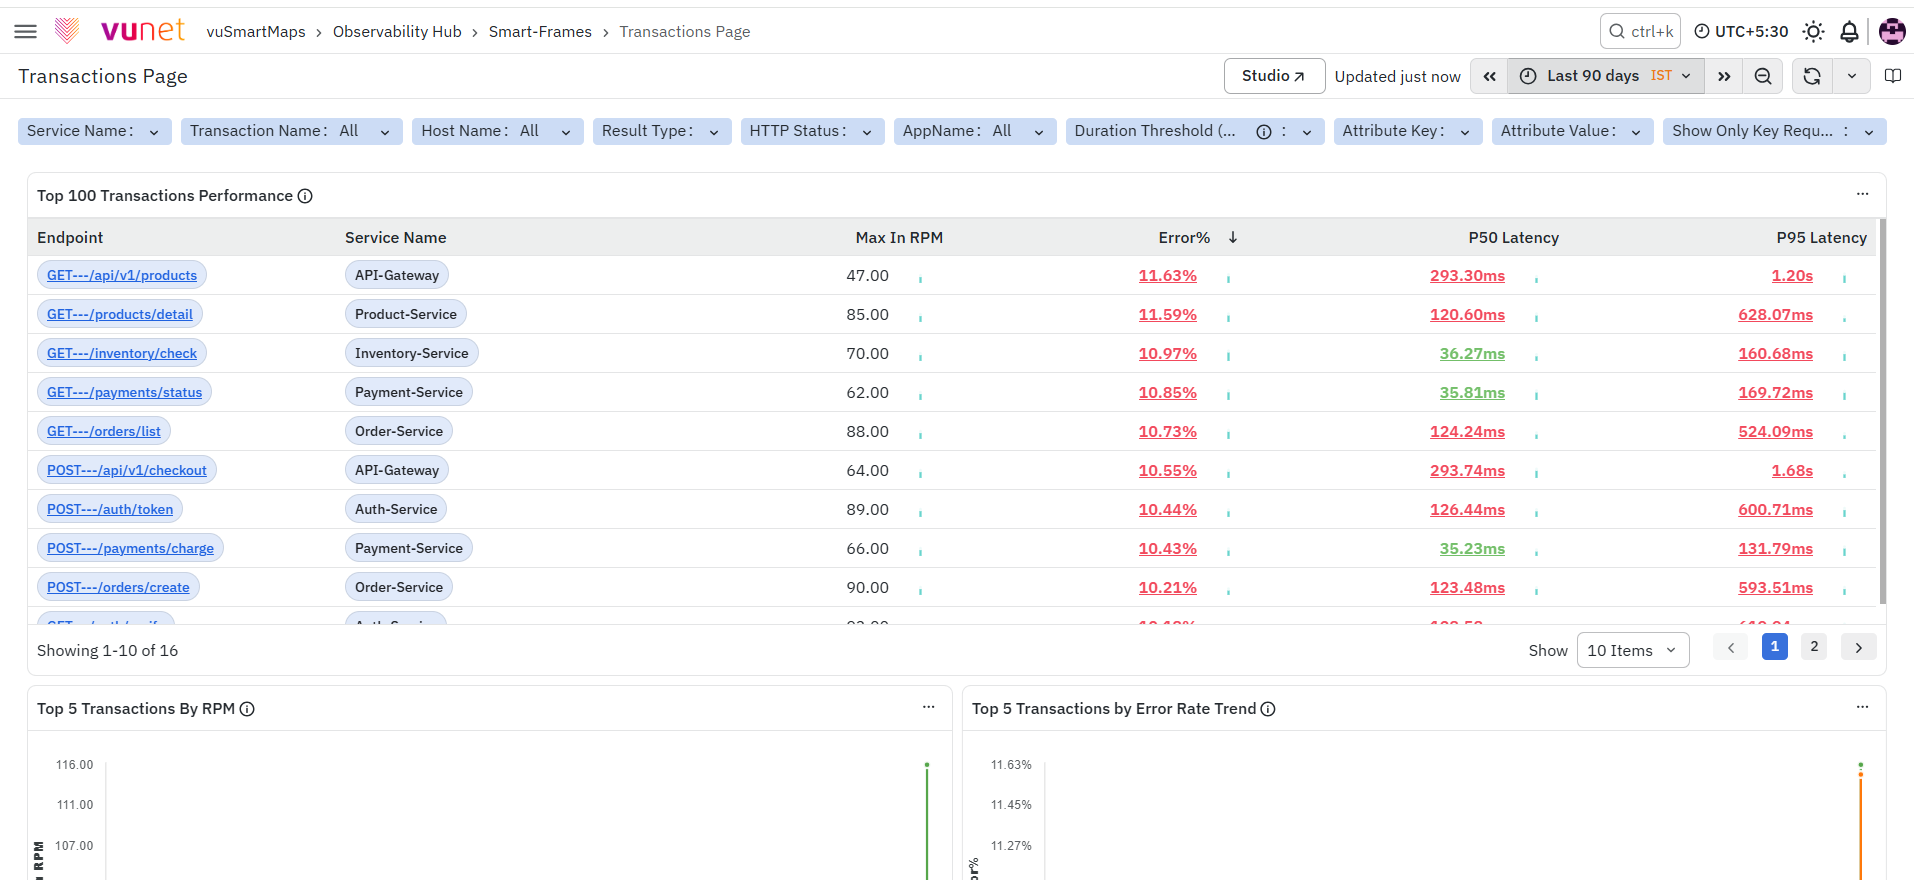
The page includes the Top 100 Transactions Performance table, which displays endpoint-level details such as Endpoint, Service Name, Max In RPM, Error%, P50 Latency, and P95 Latency. It also includes trend panels for the top transactions by RPM, error rate, P50 latency, and P95 latency, helping users analyze transaction behavior over time. The Error Distribution panels show how errors are distributed across HTTP codes and result types, supporting faster identification of transaction-level failure patterns.
Dashboard Controls, Filters, and Panel Actions
The dashboard controls are available at the top-right of the Smart Frame and help users manage how data is viewed, refreshed, and analyzed.
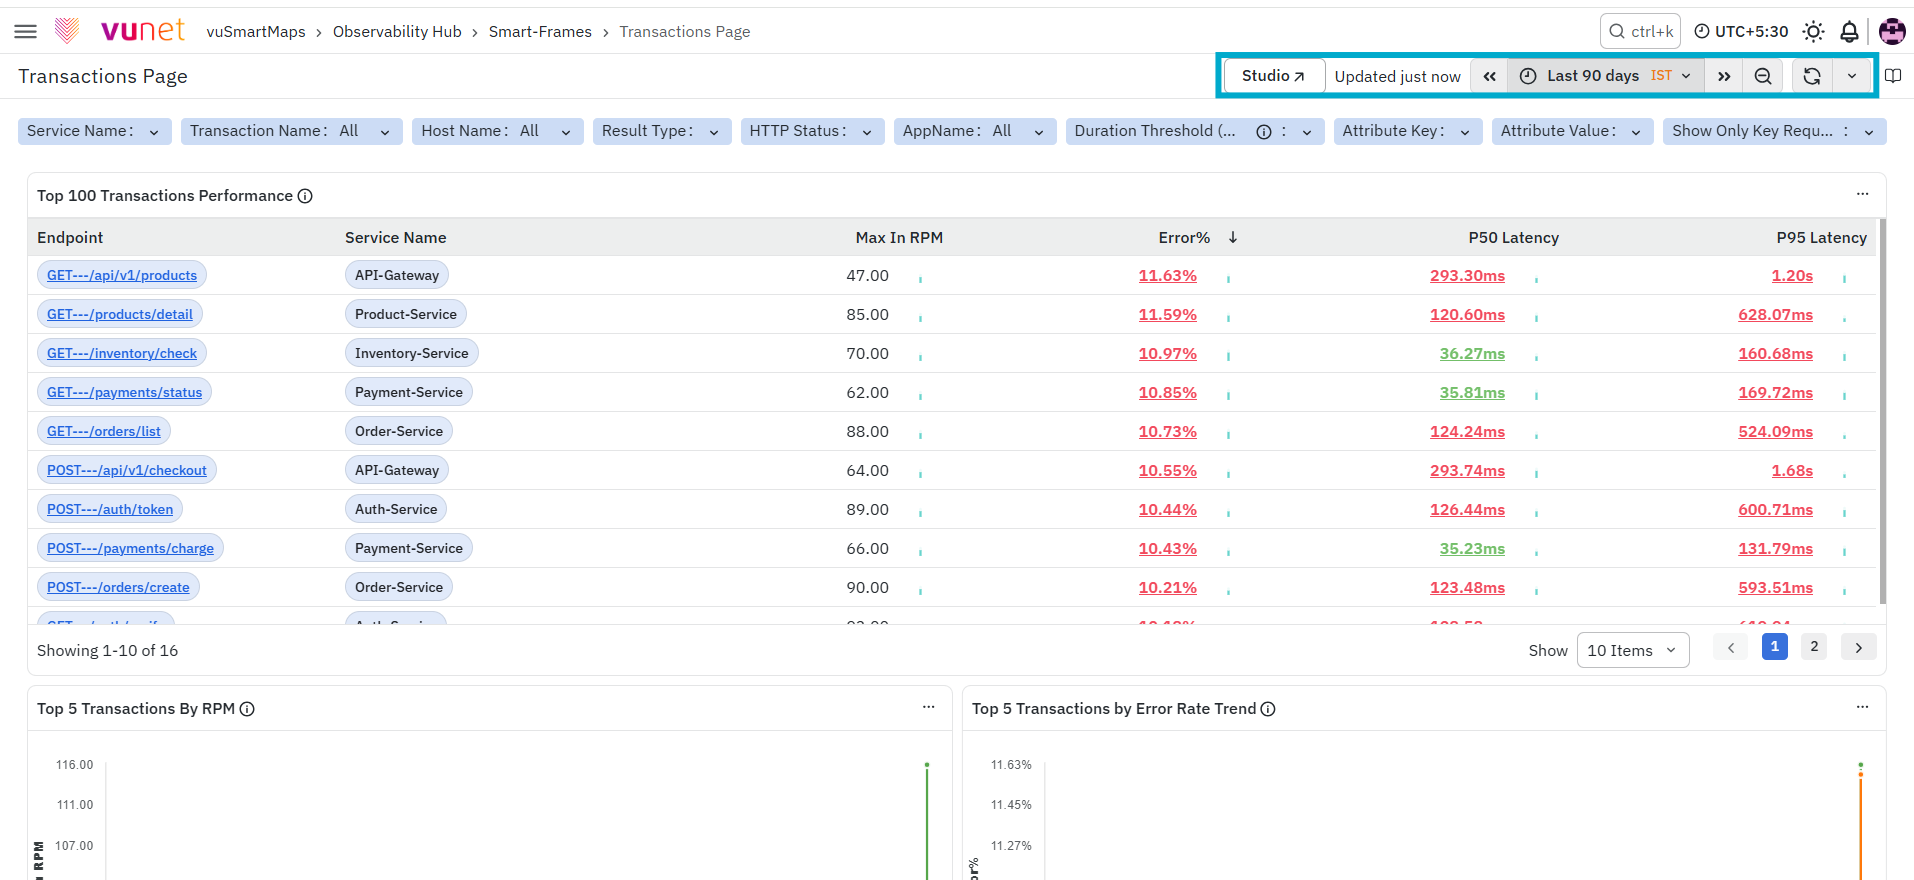
The following controls are available:
- Studio: Opens the Smart Frame in Smart Frame Studio, allowing users to view or modify the Smart Frame configuration based on their permissions. For detailed information about creating or configuring Smart Frames, refer to the Smart Frame Studio section.
- Time Range Selector: Allows users to select the time window for analysis, such as the last 15 minutes, last 3 hours, or last 90 days. The selected time range is applied across the panels in the Smart Frame.
- Search / Zoom: Helps users search or adjust the dashboard view for focused analysis and better visibility.
- Refresh: Reloads the Smart Frame with the latest available data.
Filters
Filters are available at the top of the Smart Frame and allow users to narrow down the data displayed in the panels. The available filters may vary depending on the selected Smart Frame. For detailed information about creating or configuring Filters, refer to the Smart Frame Studio Filters section.
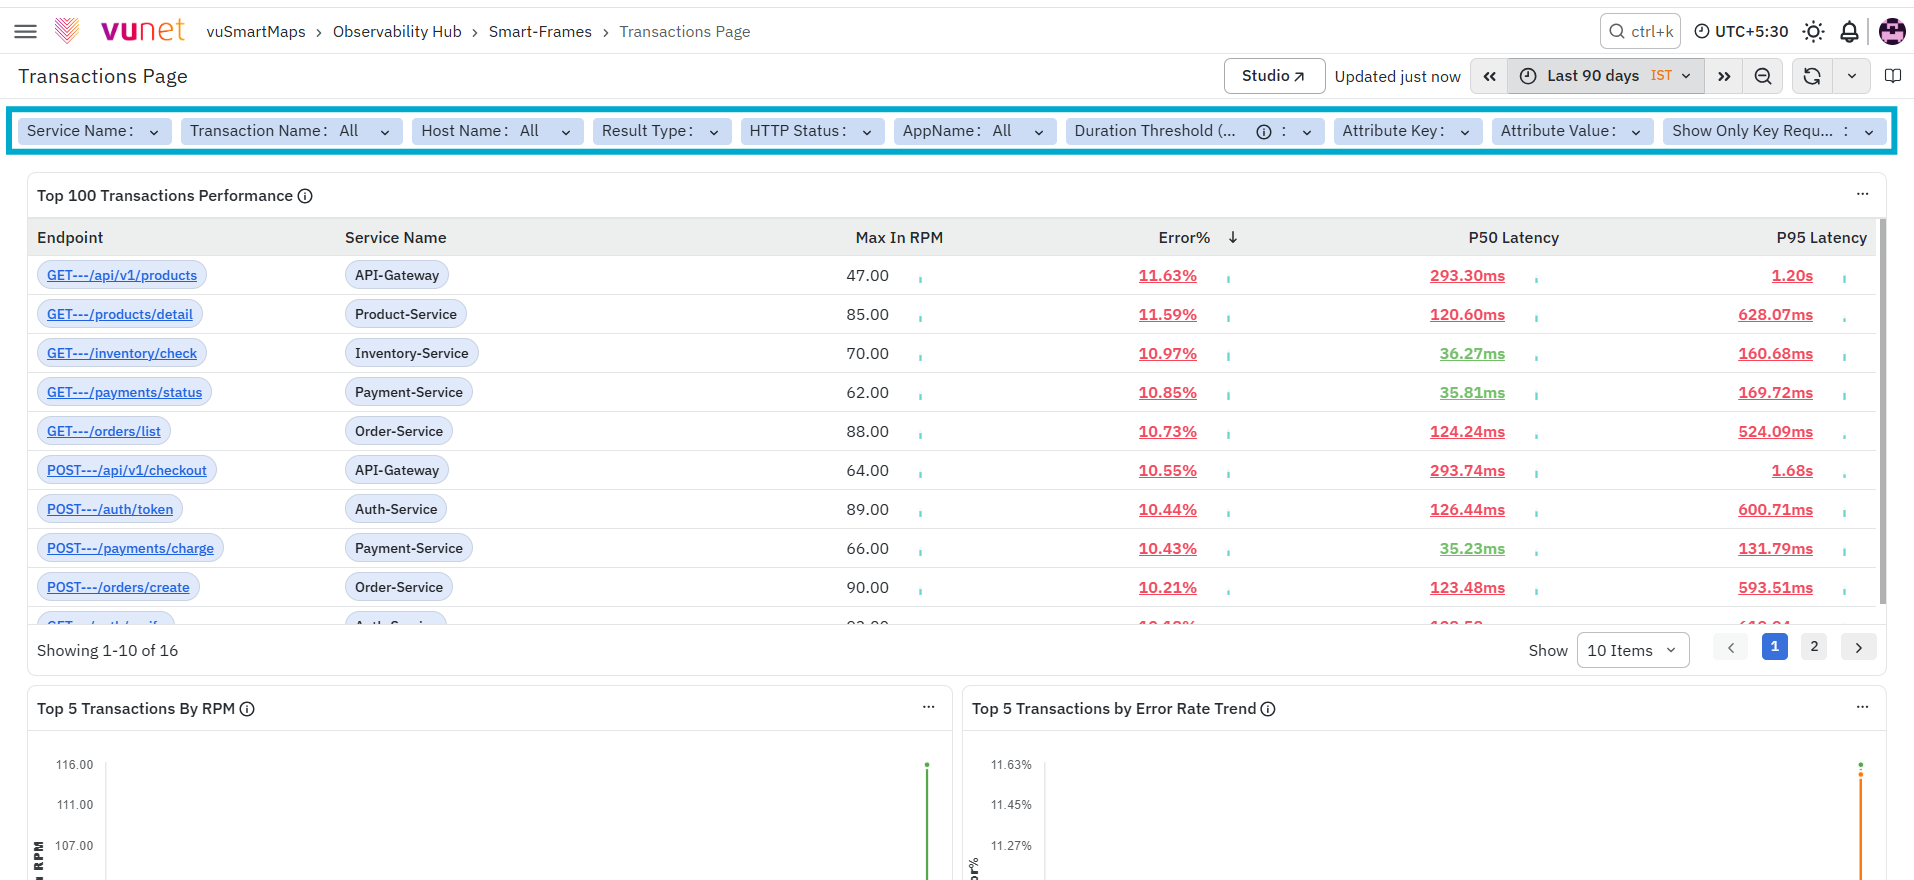
For example, in the Transactions Page Smart Frame, users can filter data by Service Name, Transaction Name, Host Name, Result Type, HTTP Status, AppName, Duration Threshold, Attribute Key, Attribute Value, and key request selection.
Panel Actions
Each panel includes a More options menu that provides additional actions for navigation, inspection, and deeper analysis. The available actions may vary depending on the panel and selected Smart Frame.
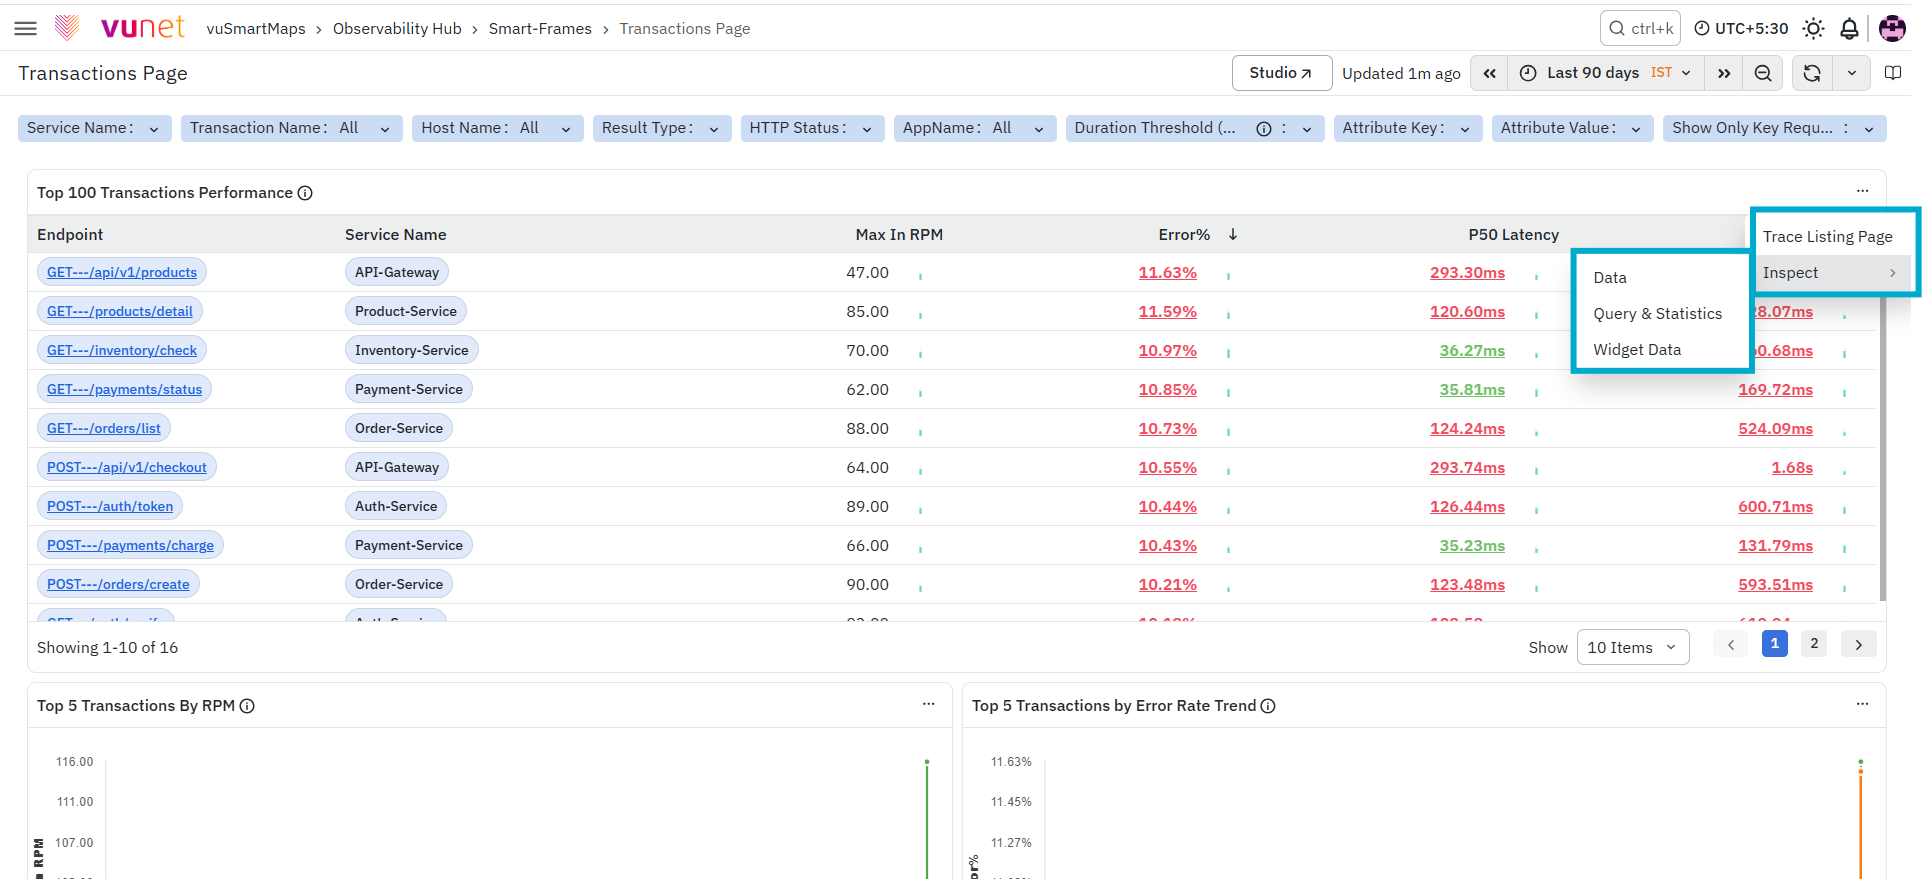
Common panel actions include:
-
Open Detailed / Related View: Opens a more detailed or context-specific view, such as service-level, transaction-level, trace-level, or dependency analysis. This helps users move from summary metrics to deeper investigation without manually reapplying filters.
-
Test: Allows users to validate the panel configuration, where applicable.
-
Inspect: Displays detailed information about the data, query execution, and widget configuration used by the selected panel.
The Inspect option includes the following sections:
-
Data: Displays the actual data used in the panel, including metric values, time-based values, row count, and the option to download the data as CSV.
-
Query & Statistics: Shows query execution details such as query blocks, runtime, memory used, rows scanned, and rows returned.
-
Widget Data: Displays raw query data, processed panel data, and panel configuration used to render the widget.
Available filters and panel actions may vary depending on the Smart Frame, panel type, and selected analysis context.
FAQs
How do I access Smart-Frames?
Navigate to Observability Hub > Smart-Frames. The page displays the Smart Frames available to you based on your assigned permissions.
How can I find a specific Smart Frame?
Use the Search for Smart-Frames field to search for a Smart Frame by entering relevant text.
What information is displayed in the Smart-Frames list?
The list displays the Smart Frame Name, Description, Updated By, and Last Updated information.
What can I do when I open a Smart Frame?
You can view panels, apply filters, review metrics, and navigate to related analysis views. The available options depend on the selected Smart Frame.
What controls are available in a Smart Frame?
Smart Frames provide controls such as Studio, Time Range Selector, Search / Zoom, and Refresh for configuring and analyzing the displayed data.
What filters are available in a Smart Frame?
Available filters depend on the selected Smart Frame. For example, the Transactions Page Smart Frame supports filters such as Service Name, Transaction Name, Host Name, Result Type, HTTP Status, AppName, Duration Threshold, Attribute Key, and Attribute Value.
What actions are available for Smart Frame panels?
The More options menu can provide actions such as Open Detailed / Related View, Test, and Inspect. The Inspect option provides data, query and statistics, and widget configuration details.
