APM Deployment and Configuration
To enable Application Performance Monitoring (APM), trace data must be collected from instrumented applications and ingested into the platform. This is achieved by integrating the instrumentation library with the target application. Once integrated, restarting the application activates trace collection, allowing telemetry data to be captured and forwarded for analysis.
The setup involves two main steps:
1. Platform Configuration (vuSmartMaps)
Configure the platform to receive and process trace data:
- Enable Traces O11ySource
- Configure the required data sources
- Define application and service context
This step establishes the data pipeline required for collecting and analyzing application performance data.
2. Client-Side Instrumentation
Instrument the target application to generate trace data:
- Integrate the instrumentation package with the application
- Configure it based on the deployment environment (Host/VM, Docker, or Kubernetes)
- Restart the application to begin trace collection
Once configured, the application starts generating traces that provide visibility into service behavior, request flows, and performance metrics.
vuSmartMaps Configuration: Enabling Distributed Traces Telemetry
Traces O11ySource collects Distributed Traces telemetry from applications to provide comprehensive observability, offering deep insights into application performance through standard applications performance monitoring dashboards.
Enabling Traces O11ySource
- Navigate to O11ySources:
- vuSmartMaps O11ySources can be accessed by navigating from the left navigation menu (Integrations > O11ySources).
- Locate Traces O11ySource on the landing page.
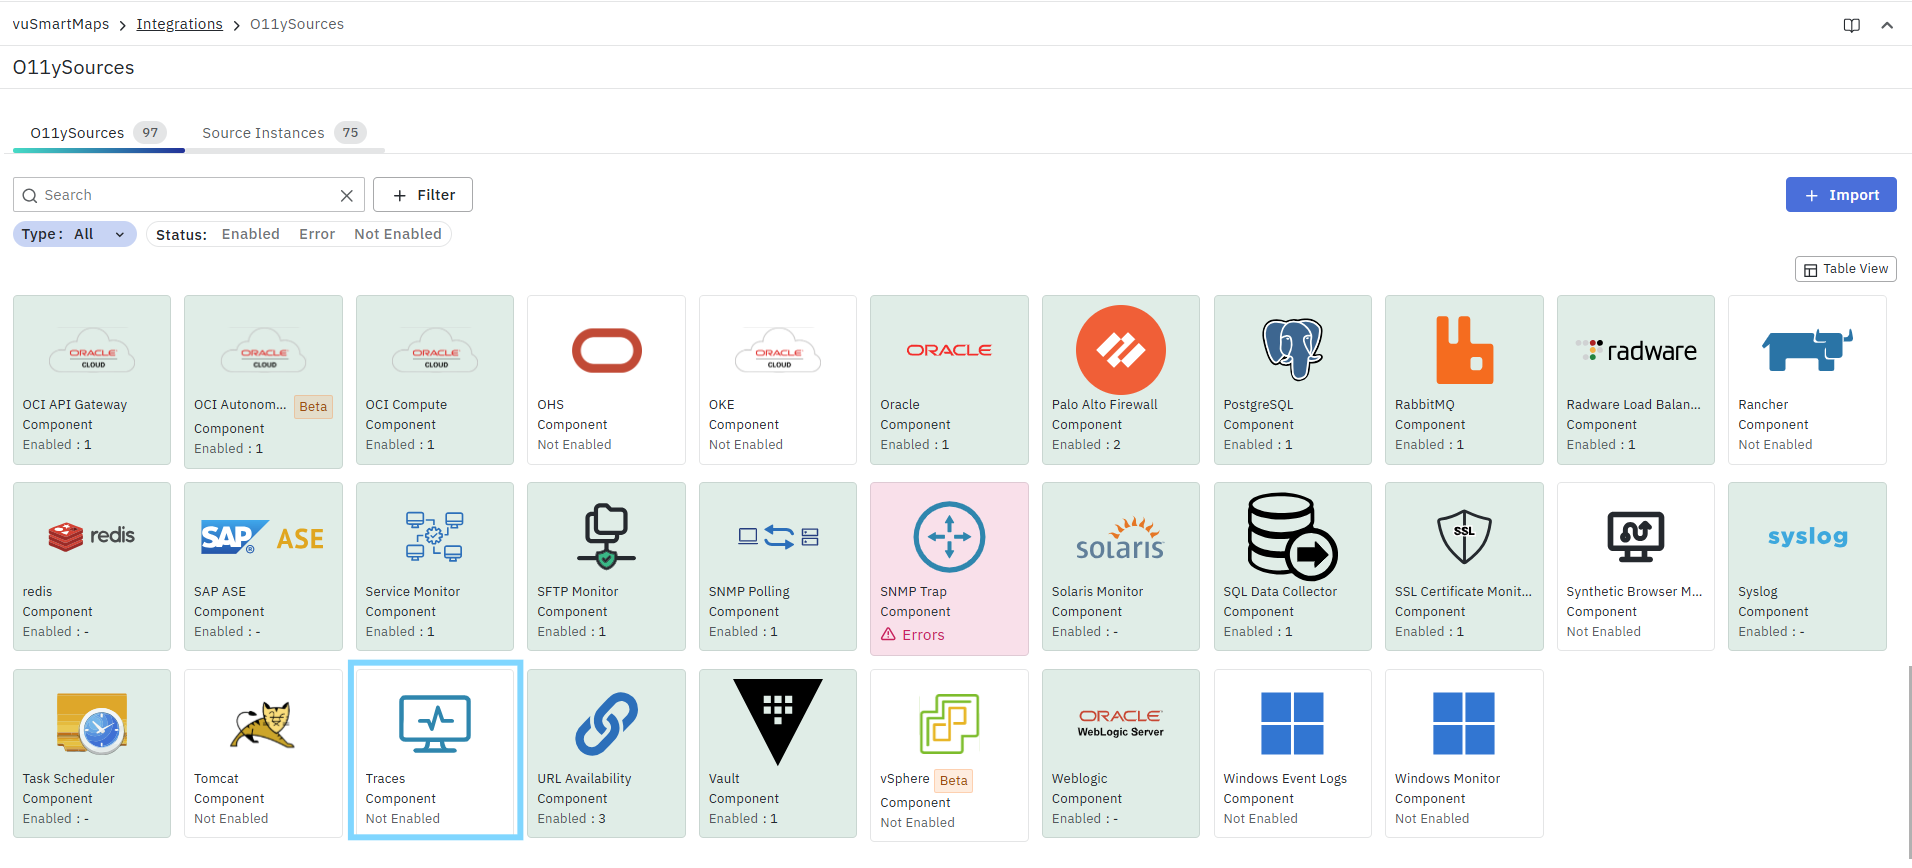
- Enable Traces O11ySources:
- Click the Enable button to activate Traces O11ySource.

Configuring Data Sources
To add and configure a Traces data source:
- Go to the Sources tab inside the Traces O11ySource. Click Source (top-right) → Configure New.
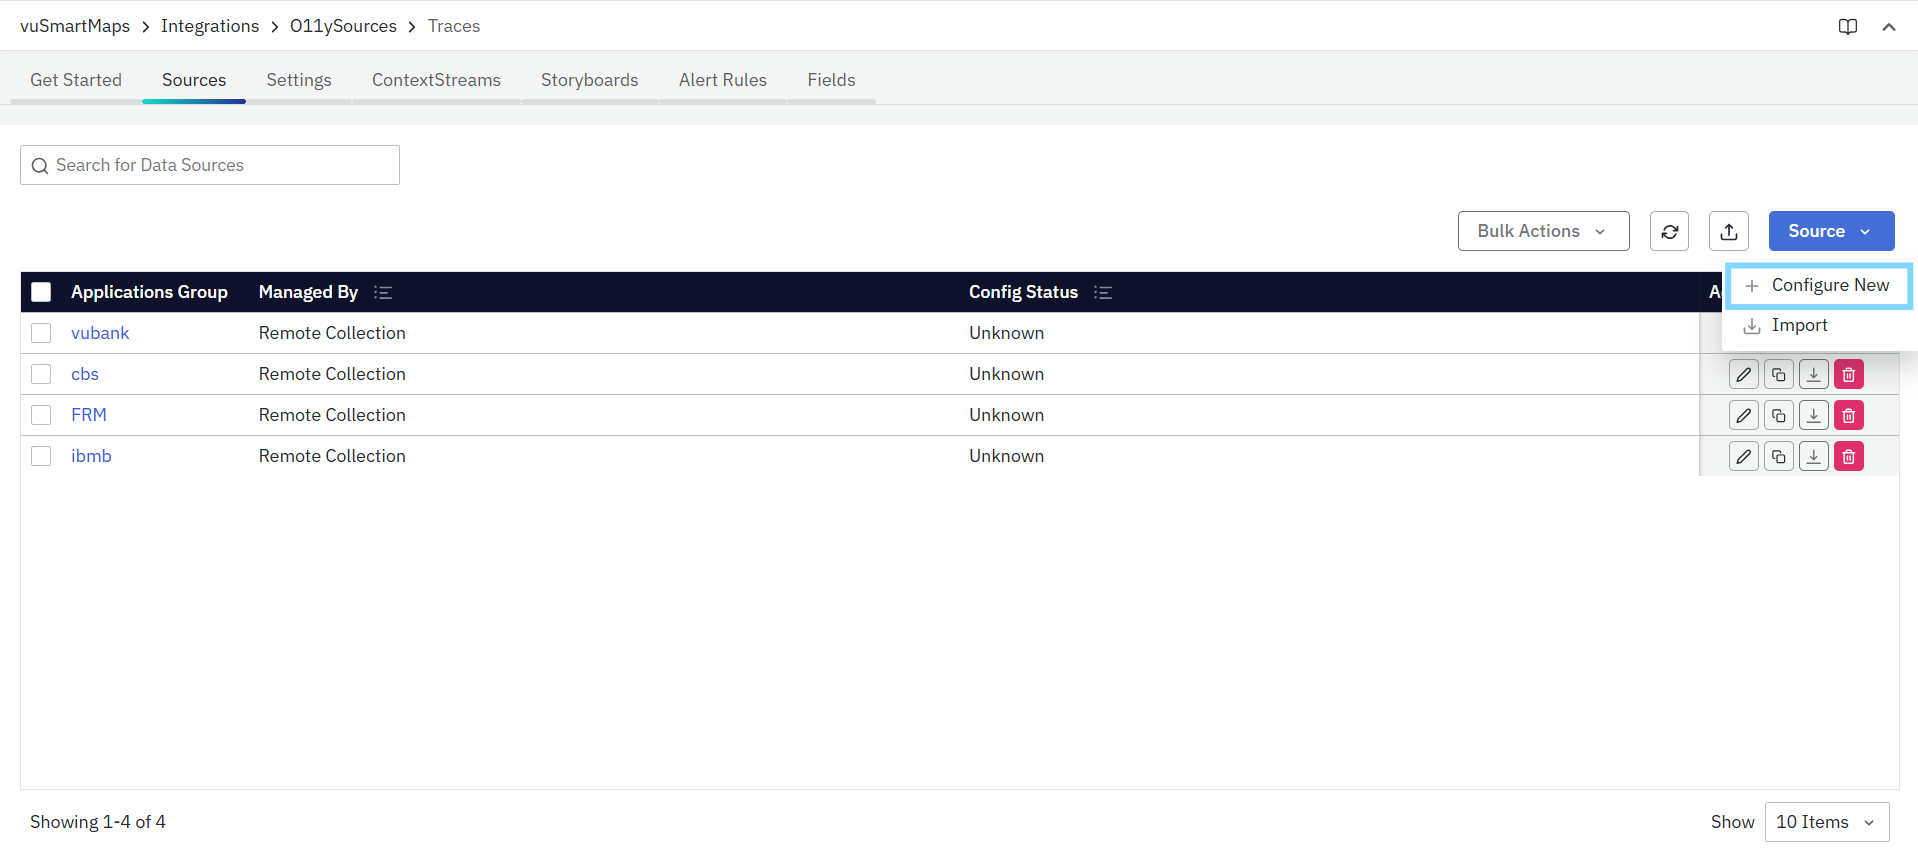
- This opens the Configure New Data Source(s) wizard, which includes:
Step 1: Add Data Source
In this step, you provide the basic details required for configuring Traces.
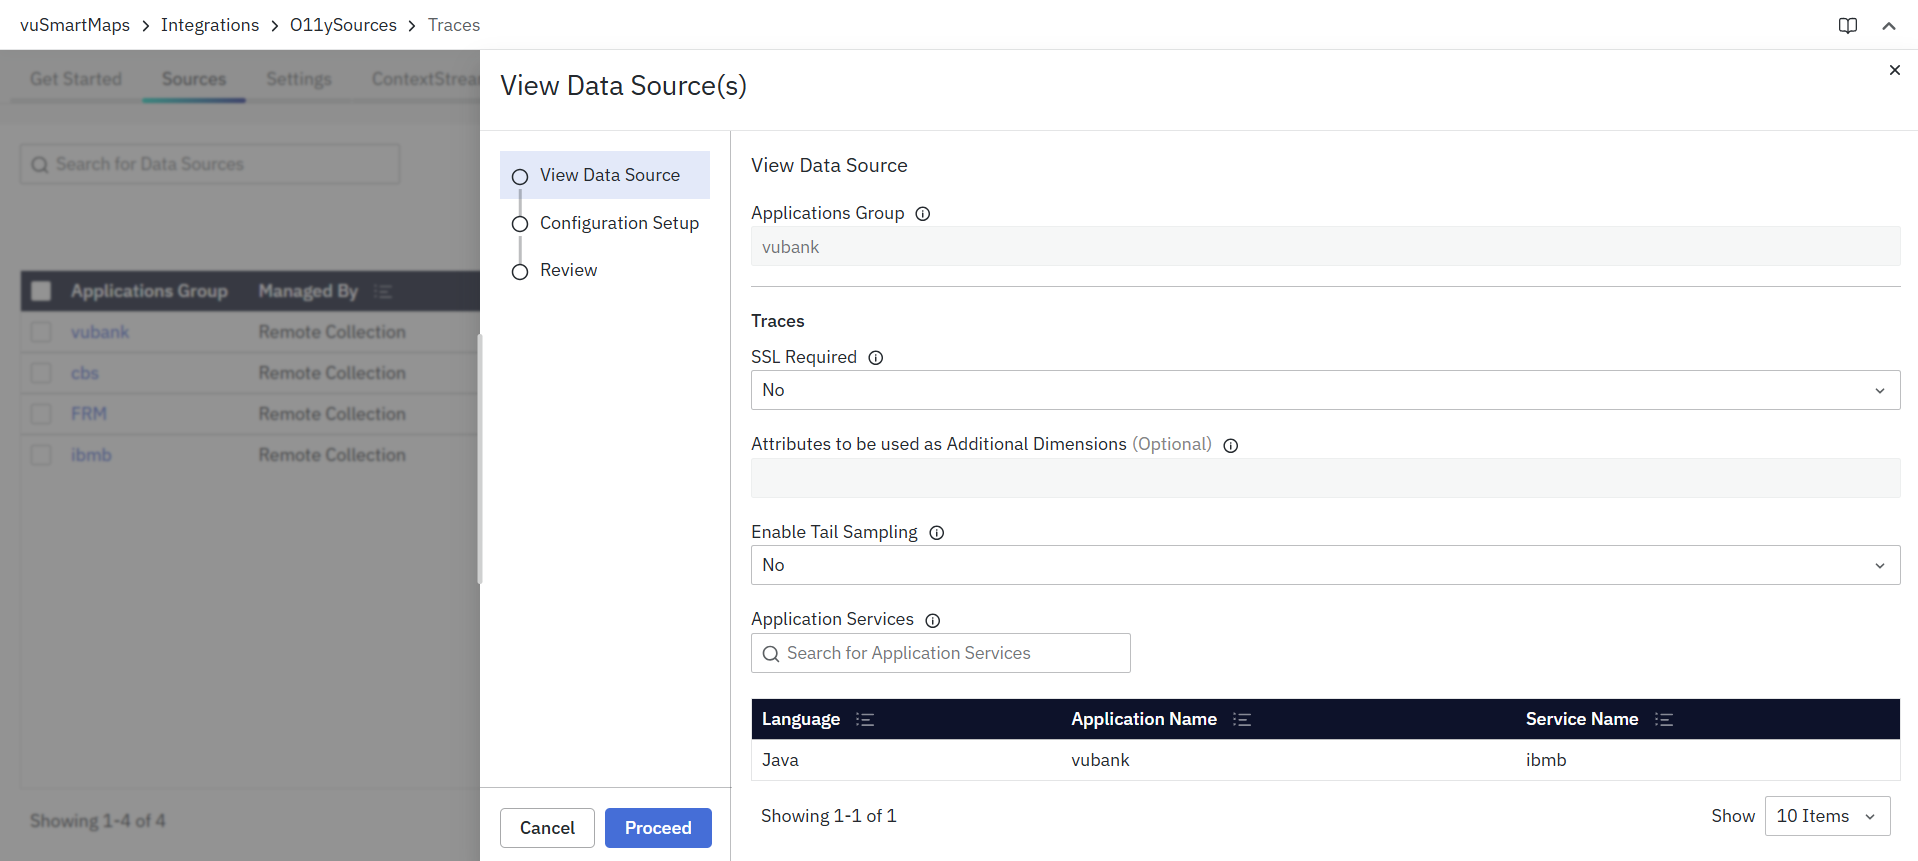
Fill in the following fields:
- Application Group: Enter the name of the application group to which this service belongs.
- SSL Required: Select Yes to enable TLS for secure communication, or No if TLS is not required.
- Attributes to be used as Additional Dimensions (Optional): Specify trace attributes that should be used as additional dimensions while calculating metrics.
- Separate multiple attributes using commas (for example:
attribute1, attribute2). - For HTTP request headers, use the format:
http.request.header.<attribute_name> - For HTTP response headers, use the format:
http.response.header.<attribute_name> - For other attributes, use the exact field name as available in the raw trace data.
- Separate multiple attributes using commas (for example:
- Enable Tail Sampling: Select Yes to enable tail sampling for the configured services. Tail sampling evaluates traces after request completion and retains traces according to the sampling policies configured in the Settings tab. Select No to retain all collected traces without applying sampling policies.
Tail sampling is applied only when sampling policies are configured. If sampling is disabled, all collected traces are retained.
- Application Services: Define the application and service names as they should appear in the observability UI.
- In a monolithic application, the application name and service name are usually the same.
- In a microservices architecture, a single application can include multiple services.
- Language: Select the programming language used to develop the service (Java, NodeJS, .NET, or GoLang).
- Application Name: Enter the name of the target application.
- Service Name: Enter the name of the service within the application.
- Export HTTP Header: Enable this option if HTTP headers need to be captured as part of trace data.
After entering the required details, click Proceed.
Step 2: Configuration Setup
In this step, you define how the Traces data source will be managed by the platform. The table displays the configured source with the following details:
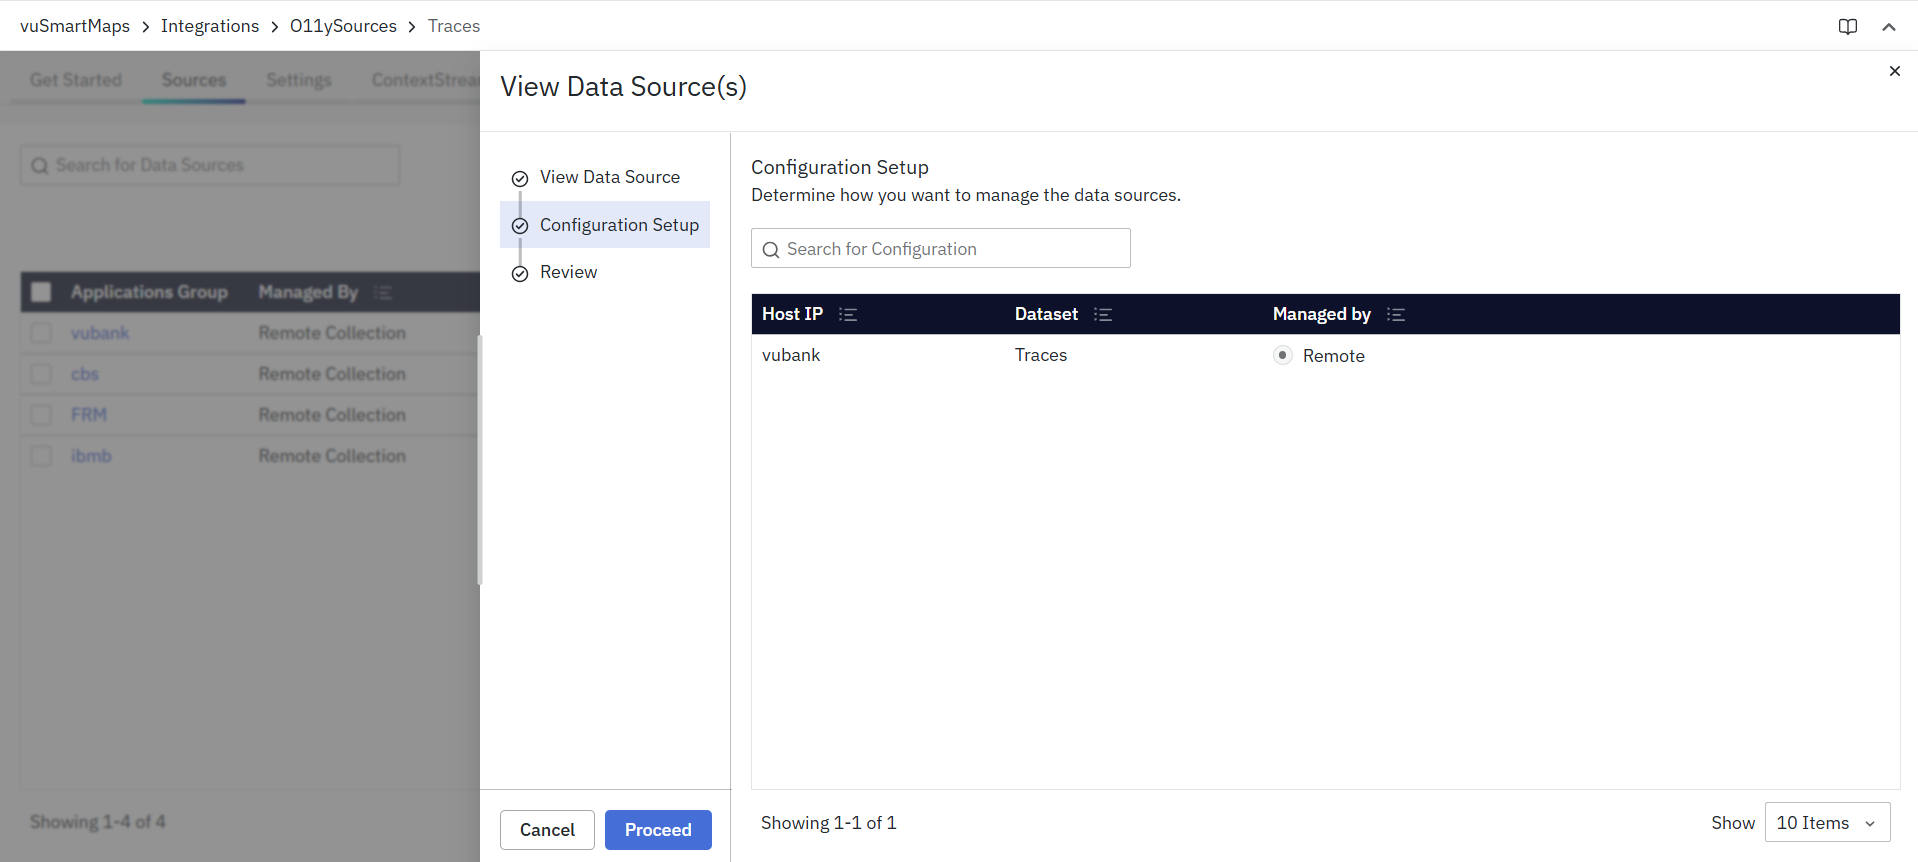
- Host IP – The host or application identifier added in the previous step.
- Dataset – Automatically set to Traces.
- Managed by – Specifies how trace data will be collected for the source. Only management modes supported for Traces are displayed.
Management Modes
- OmniAgent Managed: Tracing is handled automatically by OmniAgent. Once the OmniAgent is discovered on the host, trace collection starts automatically. Until discovery, the source remains in a Pending state.
- Manually Managed: Tracing is managed manually using client-side instrumentation.
- Download the required instrumentation package for the selected programming language, refer Download Source section.
- Deploy and configure the instrumentation manually on the application host.
- Trace data collection starts once the instrumentation is integrated and the application is running.
- Remote Collection: Trace data is collected remotely without installing OmniAgent on the host, where supported. Data collection proceeds automatically once the configuration is applied.
After selecting the appropriate Managed by option, click Proceed to continue to the Review step.
Step 3: Review
The Review step displays the configured Traces data sources and provides guidance on how data collection will proceed based on the selected management mode.

In this view, you can:
- Review the host, dataset, and management mode for each configured source.
- Filter sources using the Managed by options (OmniAgent, Manual, Remote).
- Search for specific configurations using the search bar.
Based on the selected management mode:
- Manually Managed – Download the required client instrumentation packages from the configured Sources table and deploy them manually.
- Remote Collection – Data collection proceeds automatically without requiring agent installation.
- OmniAgent Managed – Data collection proceeds automatically once OmniAgent is discovered. Until then, the source remains in a Pending state. The OmniAgent package can be downloaded if required.
After reviewing the configuration, click Finish to complete the setup. The Traces data source will then be available in the Sources list and begin collecting data according to the selected configuration.
Download Source
If the data source uses Manually Managed mode, you must download the client instrumentation package. To download:
- Go to the Sources table.
- Click the Download icon in the Actions column.
- Select the required configuration for the chosen language.
- Click Submit.
This provides the client instrumentation package required for trace collection. Follow the instructions provided in the Client Side Traces Instrumentation section to complete the setup.
Configuring Sampling Policies
Sampling policies control which traces are retained after a request has completed. Traces O11ySource uses tail sampling, which evaluates the complete trace against one or more configured policies before deciding whether the trace should be retained or discarded. This enables the platform to optimize trace storage while preserving the most valuable traces for troubleshooting and performance analysis.
Sampling policies can be configured based on conditions such as:
- Error status
- Request latency
- Trace attributes
- Percentage-based sampling
- Service scope
The Settings tab in the Traces O11ySource allows you to create and manage sampling policies that are applied during trace collection.
Sampling States
Each configured service operates in one of the following sampling states based on its configuration.
Sampling Disabled
Tail sampling is disabled, and every trace generated by the service is retained without applying any filtering. This mode is useful when complete trace collection is required for troubleshooting or detailed analysis.
Auto Disabled
Sampling is automatically disabled when no sampling policies are configured or when an existing policy already retains all traces. In this state, the platform bypasses sampling because filtering would have no effect.
Sampling Enabled
Tail sampling evaluates every completed trace against the configured sampling policies before determining whether it should be retained.
Sampling Policies
A sampling policy defines the conditions used to retain traces for one or more monitored services.
Each sampling policy consists of the following components:
- Policy Name – Identifies the sampling policy.
- Scope – Defines the services or applications to which the policy applies.
- Policy Type – Specifies the sampling method used for evaluation.
- Match Criteria – Defines the conditions that determine whether a trace is retained.
Multiple sampling policies can be configured for a service to satisfy different monitoring and troubleshooting requirements.
Policy Evaluation
Each completed trace is evaluated independently against every configured sampling policy.
- A trace is retained if it matches any configured sampling policy.
- A trace is discarded only when it does not satisfy any configured policy.
- Configuring multiple sampling policies increases the likelihood of retaining relevant traces without affecting traces already retained by another matching policy.
Decision Wait
Tail sampling evaluates traces only after the complete trace has been received.
Before making a sampling decision, the collector waits for the configured Decision Wait interval. During this period, all spans belonging to the trace are collected to ensure that complete execution details, including downstream operations and overall request latency, are available for policy evaluation.
Code-Level Visibility and Sampling Policies
When Code-Level Visibility is enabled for a service, the platform automatically creates and manages the required sampling policies for that service. These system-managed policies ensure that traces required for code-level diagnostics, such as error traces, high-latency traces, and a sampled subset of normal traces, are retained without requiring additional manual configuration. This prevents services that are not covered by any user-defined sampling policy from being unintentionally excluded from trace collection.
The automatically created policies retain:
- Error traces
- High-latency traces
- A configurable percentage of normal traces
System-managed Policies
Sampling policies created automatically by the platform are managed by the system.
These policies:
- Cannot be deleted from the user interface.
- Can be modified to adjust thresholds and sampling percentages.
- Remain associated with the service while Code-Level Visibility is enabled.
- Display a disabled Delete option in the user interface to indicate that the policy is managed by the platform.
When Code-Level Visibility is disabled, the associated system-managed sampling policies are removed automatically.
Automatic Pass-through Policy
The platform automatically creates a pass-through policy for services that are not covered by any configured sampling policy.
This policy ensures that traces from uncovered services continue to be retained until a user-defined sampling policy is configured. The pass-through policy is updated automatically whenever sampling policies are added, modified, or removed.
- The pass-through policy is generated automatically by the platform and does not require manual creation or maintenance. It ensures that services not covered by any user-defined sampling policy continue to retain traces.
- If no sampling policy is configured, all collected traces are retained.
- The APM dashboards are designed to work with sampled trace data.
- For advanced trace enrichment, naming standardization, failure configuration, and application-level observability settings, refer to APM Studio
Additional Configuration
The Additional Configuration section allows you to configure collector-level tail sampling behavior and collector resource limits. These settings determine how the trace collector buffers incoming traces, evaluates sampling policies, and manages the resources used during the sampling process.
Use these settings to fine-tune collector behavior for different application workloads and traffic volumes.
Decision Wait
Decision Wait specifies how long the trace collector waits before evaluating a completed trace against the configured sampling policies.
During this interval:
- Incoming spans belonging to the same trace are buffered.
- The collector waits for the trace to complete.
- After the configured wait time expires, the trace is evaluated against all sampling policies.
- If the trace satisfies any configured sampling policy, it is retained; otherwise, it is discarded.
Increasing the Decision Wait value allows the collector to evaluate more complete traces, while reducing it enables faster sampling decisions. Configure this value based on the expected duration of application requests to ensure complete traces are evaluated before sampling decisions are made.
Number of Traces
- The Number of Traces setting defines the maximum number of traces that can be buffered in memory while waiting for sampling evaluation.
- Increasing this value allows the collector to buffer more concurrent traces but may increase memory consumption.
- This value determines how many active traces the collector can maintain simultaneously before making sampling decisions. It directly influences the collector's ability to process concurrent requests during periods of high application activity.
Expected Traces Per Second
- The Expected Traces Per Second setting specifies the anticipated trace ingestion rate for the collector.
- This value helps the collector optimize its internal processing and buffering mechanisms based on the expected workload.
- Configure this setting according to the average number of traces your applications generate per second to ensure efficient sampling performance.
Memory Limit
- The Memory Limit setting specifies the maximum amount of memory the trace collector can use while buffering traces for tail sampling.
- This limit helps control overall memory consumption and prevents excessive resource usage during trace collection. When the configured limit is reached, the collector manages buffered traces according to its sampling behavior and resource constraints.
Spike Limit
- The Spike Limit defines the additional memory that the collector can temporarily use during sudden increases in trace volume.
- Traffic spikes can occur during periods of unusually high application activity. The spike limit provides temporary buffer capacity to help the collector continue processing traces without immediately reaching the configured memory limit. After the temporary increase in traffic subsides, collector memory usage returns to operate within the configured memory limit.
- The Additional Configuration section is intended to control collector-level tail sampling behavior and resource management. For advanced trace enrichment, naming standardization, failure configuration, and rule-based customization, use APM Studio.
- The explanations for each parameter (Decision Wait, Number of Traces, Expected Traces Per Second, Memory Limit, and Spike Limit) above are documentation-oriented descriptions based on the PRD's stated purpose. The source documents themselves only identify these parameters and state that they control tail sampling behavior and collector resource limits; they do not define field-level behavior beyond that.
Client Side Traces Instrumentation
Java Zero-code instrumentation
Zero-code instrumentation with Java uses a Java agent JAR attached to any Java 8+ application. It dynamically injects bytecode to capture telemetry from many popular libraries and frameworks. It can be used to capture telemetry data at the “edges” of an app or service, such as inbound requests, outbound HTTP calls, database calls, and so on
Definitions and Acronyms
- Service - The discrete unit of a system that provides some functionality. It is an entity that is instrumented to collect telemetry data such as traces, metrics, and logs. It is typically defined by a unique name that helps to differentiate it from other services in a distributed system.
- Application - The logical name given to a group of services which work together to deliver a specific business functionality. An Application is essentially the top-level entity that encompasses multiple services that may be distributed, but they all contribute to the overall functioning of the application.
- Trace - A trace represents a single request handled by the application. This request can be an HTTP request, a batch job request, or a consumer processing a message from a messaging system like Kafka, Redis, etc.
- Span - A Span represents a unit or works for fulfilling the request. You can consider these as the steps involved in the application to complete a request. Multiple spans form a trace.
Implementation/Procedure
This section provides the detailed instructions for instrumenting Java services.
Instrumentation Procedure
This section provides the instructions for instrumenting different environments.
SpringBoot / jar
Follow the below instructions to instrument the java application run as a jar.
-
Download the client instrumentation package from the o11y source which contains the
vunet-opentelemetry-javaagent.jar. Place thevunet-opentelemetry-javaagent.jarin your preferred directory. -
Launch the application with the following configuration
java -javaagent:path/to/vunet-opentelemetry-javaagent.jar
-Dotel.resource.attributes=application=<APPLICATION_NAME>
-Dotel.service.name=<SERVICE_NAME> -Dotel.metrics.exporter=none
-Dotel.exporter.otlp.endpoint=<TRACES_INGESTION_ENDPOINT> -jar app.jar
- Please update the following before using this command.
APPLICATION_NAME- Please change it to match your application nameSERVICE_NAME- Please Change it to match the service name (microservices) or application layer (monolithic)TRACES_INGESTION_ENDPOINT- Please change it to match the URL of the vuSmartMaps. It should behttp://<vuSmartMaps Server IP>:4317
- See below for the example. Here the vuSmartMaps in running in the host with IP 10.0.0.1
java -javaagent:vunet-opentelemetry-javaagent.jar
-Dotel.resource.attributes=application=UPI -Dotel.service.name=upi-switch
-Dotel.metrics.exporter=none -Dotel.exporter.otlp.endpoint=http://10.0.0.1:4317  -jar upi.jar
JBoss / WildFly (Standalone Mode) in Linux
Follow the below instructions to instrument the java application running in JBoss
-
Download the client instrumentation package which contains the
vunet-opentelemetry-javaagent.jar. Place thevunet-opentelemetry-javaagent.jarin your preferred directory. -
Edit the
<JBOss_HOME>/bin/standalone.conffile and update theJAVA_OPTSenvironment variable
JAVA\_OPTS="-javaagent:path/to/vunet-opentelemetry-javaagent.jar \-Dotel.resource.attributes=application=\<APPLICATION\_NAME\> \-Dotel.service.name=\<SERVICE\_NAME\> \-Dotel.metrics.exporter=none \-Dotel.exporter.otlp.endpoint=\<TRACES\_INGESTION\_ENDPOINT\>"
- Please update the following before using this command.
APPLICATION_NAME- Please change it to match your application nameSERVICE_NAME- Please Change it to match the service name (microservices) or application layer (monolithic)TRACES_INGESTION_ENDPOINT- Please change it to match the URL of the vuSmartMaps. It should behttp://<vuSmartMaps Server IP>:4317
An example configuration is shown below
*JAVA\_OPTS=”$JAVA\_OPTS \-javaagent:D:\\Dev\\OTel\\auto\_instrumentation\_package\_java\\otel-lib\\vunet-opentelemetry-javaagent.jar \-Dotel.resource.attributes=application=APPLICATION\_NAME \-Dotel.service.name=SERVICE\_NAME \-Dotel.metrics.exporter=none \-Dotel.exporter.otlp.endpoint=http://localhost:4317"*
- Restart JBoss
JBoss / WildFly (Domain Mode) in Linux
Follow the below instructions to instrument the java application running in JBoss
-
Download the client instrumentation package which contains the
vunet-opentelemetry-javaagent.jar. Place thevunet-opentelemetry-javaagent.jarin your preferred directory. -
Edit the
<JBOss_HOME>/bin/domain.conffile and update theJAVA_OPTSenvironment variable
JAVA_OPTS="-javaagent:path/to/vunet-opentelemetry-javaagent.jar -Dotel.resource.attributes=application=<APPLICATION_NAME> -Dotel.service.name=<SERVICE_NAME> -Dotel.metrics.exporter=none -Dotel.exporter.otlp.endpoint=<TRACES_INGESTION_ENDPOINT>"
- Please update the following before using this command.
APPLICATION_NAME- Please change it to match your application nameSERVICE_NAME- Please Change it to match the service name (microservices) or application layer (monolithic)TRACES_INGESTION_ENDPOINT- Please change it to match the URL of the vuSmartMaps. It should behttp://<vuSmartMaps Server IP>:4317
An example configuration is shown below
*JAVA\_OPTS=”$JAVA\_OPTS \-javaagent:D:\\Dev\\OTel\\auto\_instrumentation\_package\_java\\otel-lib\\vunet-opentelemetry-javaagent.jar \-Dotel.resource.attributes=application=APPLICATION\_NAME \-Dotel.service.name=SERVICE\_NAME \-Dotel.metrics.exporter=none \-Dotel.exporter.otlp.endpoint=http://localhost:4317"*
- Restart JBoss
JBoss / WildFly (Standalone Mode) in Windows
Follow the below instructions to instrument the java application running in JBoss
-
Download the client instrumentation package which contains the
vunet-opentelemetry-javaagent.jar. Place thevunet-opentelemetry-javaagent.jarin your preferred directory. -
Edit the
<JBOss_HOME>/bin/standalone.conf.batfile and update theJAVA_OPTSenvironment variable
JAVA_OPTS="-javaagent:path/to/vunet-opentelemetry-javaagent.jar -Dotel.resource.attributes=application=<APPLICATION_NAME> -Dotel.service.name=<SERVICE_NAME> -Dotel.metrics.exporter=none -Dotel.exporter.otlp.endpoint=<TRACES_INGESTION_ENDPOINT>"
- Please update the following before using this command.
APPLICATION_NAME- Please change it to match your application nameSERVICE_NAME- Please Change it to match the service name (microservices) or application layer (monolithic)TRACES_INGESTION_ENDPOINT- Please change it to match the URL of the vuSmartMaps. It should behttp://\<vuSmartMaps Server IP\>:4317
An example configuration is shown below
set “JAVA_OPTS=%$JAVA_OPTS% -javaagent:D:\Dev\OTel\auto_instrumentation_package_java\otel-lib\vunet-opentelemetry-javaagent.jar -Dotel.resource.attributes=application=APPLICATION_NAME -Dotel.service.name=SERVICE_NAME -Dotel.metrics.exporter=none -Dotel.exporter.otlp.endpoint=http://localhost:4317"
- Restart JBoss
JBoss / WildFly (Domain Mode) in Windows
Follow the below instructions to instrument the java application running in JBoss
-
Download the client instrumentation package which contains the
vunet-opentelemetry-javaagent.jar. Place thevunet-opentelemetry-javaagent.jarin your preferred directory. -
Edit the
<JBOss_HOME>/bin/domain.conf.batfile and update theJAVA_OPTSenvironment variableJAVA_OPTS="-javaagent:path/to/vunet-opentelemetry-javaagent.jar -Dotel.resource.attributes=application=<APPLICATION_NAME> -Dotel.service.name=<SERVICE_NAME> -Dotel.metrics.exporter=none -Dotel.exporter.otlp.endpoint=<TRACES_INGESTION_ENDPOINT>" -
Please update the following before using this command.
APPLICATION_NAME- Please change it to match your application nameSERVICE_NAME- Please Change it to match the service name (microservices) or application layer (monolithic)TRACES_INGESTION_ENDPOINT- Please change it to match the URL of the vuSmartMaps. It should behttp://\<vuSmartMaps Server IP\>:4317
An example configuration is shown below
set “JAVA_OPTS=%$JAVA_OPTS% -javaagent:D:\Dev\OTel\auto_instrumentation_package_java\otel-lib\vunet-opentelemetry-javaagent.jar -Dotel.resource.attributes=application=APPLICATION_NAME -Dotel.service.name=SERVICE_NAME -Dotel.metrics.exporter=none -Dotel.exporter.otlp.endpoint=http://localhost:4317"
- Restart JBoss
Apache Tomcat running on Linux
Follow the below instructions to instrument the java application running in Apache Tomcat
-
Download the client instrumentation package which contains the
vunet-opentelemetry-javaagent.jar. Place thevunet-opentelemetry-javaagent.jarin your preferred directory. -
Edit the setenv.sh in the bin directory of Tomcat and add the following content. Create the setenv.sh in the bin directory if it doesn't exists
export CATALINA_OPTS="$CATALINA_OPTS -javaagent:path/to/vunet-opentelemetry-javaagent.jar"
export OTEL_EXPORTER_OTLP_ENDPOINT=<TRACES_INGESTION_ENDPOINT>
export OTEL_EXPORTER_OTLP_PROTOCOL="grpc"
export OTEL_RESOURCE_ATTRIBUTES=application=<APPLICATION_NAME>
export OTEL_SERVICE_NAME=<SERVICE_NAME>
export OTEL_METRICS_EXPORTER=none
export OTEL_LOGS_EXPORTER=none
- Please update the following before using this command.
APPLICATION_NAME- Please change it to match your application nameSERVICE_NAME- Please Change it to match the service name (microservices) or application layer (monolithic)TRACES_INGESTION_ENDPOINT- Please change it to match the URL of the vuSmartMaps. It should behttp://\<vuSmartMaps Server IP\>:4317
- Restart Apache Tomcat
Apache Tomcat running on Windows
Follow the below instructions to instrument the java application running in Apache Tomcat
-
Download the client instrumentation package which contains the vunet-opentelemetry-javaagent.jar. Place the vunet-opentelemetry-javaagent.jar in your preferred directory.
-
Edit the setenv.bat in the bin directory of Tomcat and add the following content. Create the setenv.bat in the bin directory if it doesn't exists
set "OTEL_EXPORTER_OTLP_ENDPOINT=<TRACES_INGESTION_ENDPOINT>"
set "OTEL_RESOURCE_ATTRIBUTES=application=<APPLICATION_NAME> -Dotel.service.name=<SERVICE_NAME>"
set "OTEL_METRICS_EXPORTER=none"
- Please update the following before using this command.
APPLICATION_NAME- Please change it to match your application nameSERVICE_NAME- Please Change it to match the service name (microservices) or application layer (monolithic)TRACES_INGESTION_ENDPOINT- Please change it to match the URL of the vuSmartMaps. It should behttp://\<vuSmartMaps Server IP\>:4317
- Restart Apache Tomcat
Apache Tomcat running as Windows Service
Follow the below instructions to instrument the java application running in Apache Tomcat which is running as a Windows Service
-
Download the client instrumentation package which contains the
vunet-opentelemetry-javaagent.jar. Place thevunet-opentelemetry-javaagent.jarin your preferred directory. -
Open the Tomcat Service Configuration
-
Open the command prompt in Administrator mode
-
Navigate to the bin folder of Tomcat
-
Run the below command
tomcat9w.exe //ES//<SERVICE_NAME>Replace <SERVICE_NAME> with the actual internal service name
For ex
tomcat9w.exe //ES//Service_1
-
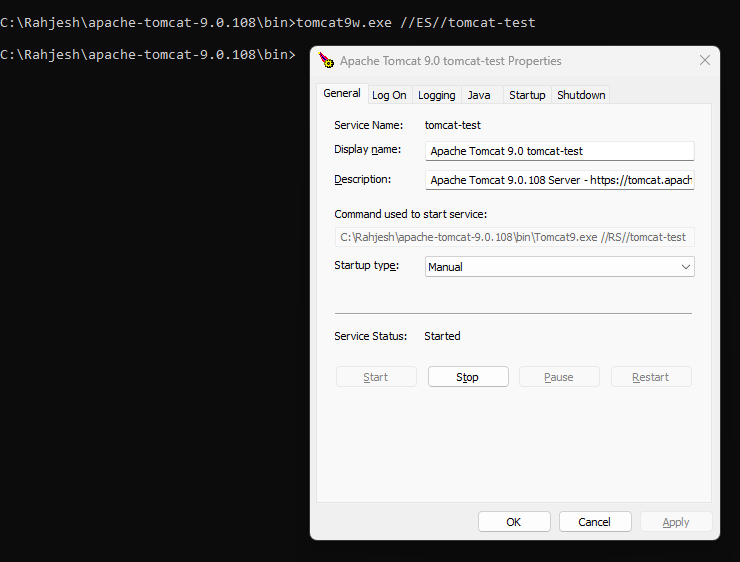
- In the Tomcat Service Configuration, go to the Java tab.
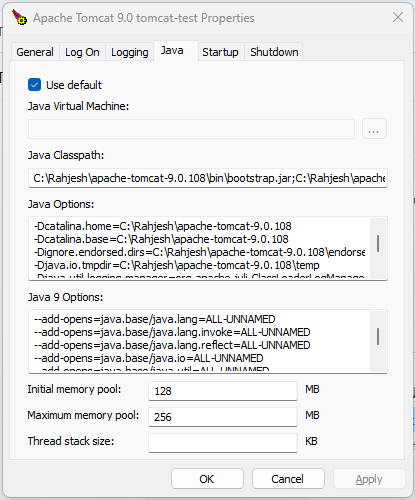
- In the Java Options box add the following
  -javaagent:path\to\vunet-opentelemetry-javaagent.jar
-Dotel.resource.attributes=application=<APPLICATION_NAME>
-Dotel.service.name=<SERVICE_NAME>
-Dotel.metrics.exporter=none
-Dotel.exporter.otlp.endpoint = http://<vuSmartMaps Server IP>:4317
Please update the following before using this command.
APPLICATION_NAME- Please change it to match your application nameSERVICE_NAME- Please Change it to match the service name (microservices) or application layer (monolithic)TRACES_INGESTION_ENDPOINT- Please change it to match the URL of the vuSmartMaps. It should behttp://<vuSmartMaps Server IP\>:4317- Click Apply and OK to save
- Restart Apache Tomcat
Weblogic
Standalone Weblogic Servers
Follow the below instructions to instrument the java application running in standalone Weblogic server
-
Download the client instrumentation package which contains the vunet-opentelemetry-javaagent.jar. Place the vunet-opentelemetry-javaagent.jar in your preferred directory.
-
Edit startWebLogic.sh located at
<weblogic_<version#>_install_dir>/user_projects/domains/<domain_name>/bin/startWebLogic.sh. Add the following to the beginning of your application server start script
export JAVA_OPTIONS="$JAVA_OPTIONS -javaagent:path/to/vunet-opentelemetry-javaagent.jar -Dotel.resource.attributes=application=<APPLICATION_NAME> -Dotel.service.name=<SERVICE_NAME> -Dotel.metrics.exporter=none -Dotel.exporter.otlp.endpoint=<TRACES_INGESTION_ENDPOINT>"
- Please update the following before using this command.
APPLICATION_NAME- Please change it to match your application nameSERVICE_NAME- Please Change it to match the service name (microservices) or application layer (monolithic)TRACES_INGESTION_ENDPOINT- Please change it to match the URL of the vuSmartMaps. It should behttp://<vuSmartMaps Server IP\>:4317
- Restart Weblogic
Weblogic Servers managed by Admin Console
Follow the below instructions to instrument the java application running in clustered Weblogic server where the admin console is used to manage the instance
-
Download the client instrumentation package which contains the
vunet-opentelemetry-javaagent.jar. Place thevunet-opentelemetry-javaagent.jarin your preferred directory. -
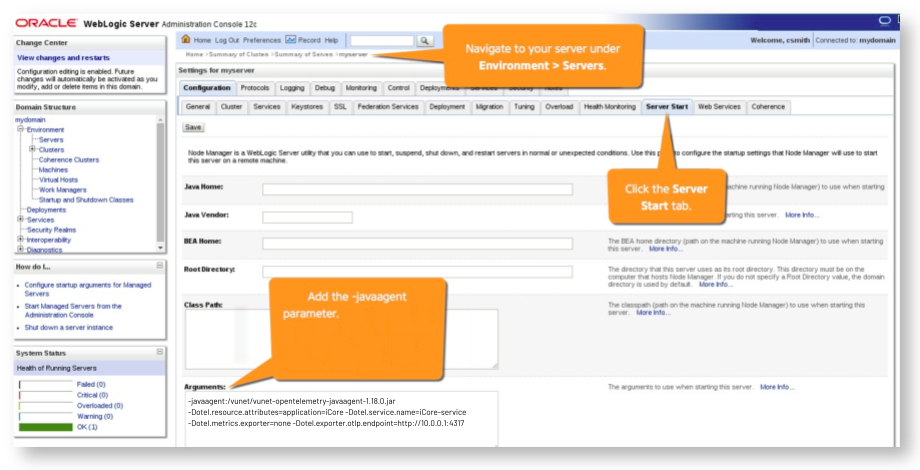
For clustered WebLogic servers, you start and stop using Node Manager, and configure server startup in the WebLogic Server Administration Console.
-
Open the WebLogic Server Administration Console.
-
Navigate to Environment > Servers and click your server in the Server List
-
Click the Server Start tab.
-
Add the javaagent argument and set the value to the path to the Java Agent
-javaagent:path/to/vunet-opentelemetry-javaagent.jar -Dotel.resource.attributes=application=<APPLICATION_NAME> -Dotel.service.name=<SERVICE_NAME> -Dotel.metrics.exporter=none -Dotel.exporter.otlp.endpoint=<TRACES_INGESTION_ENDPOINT> -Dotel.exporter.otlp.compression=gzip -
Restart the Weblogic managed server
Websphere Liberty
Follow the below instructions to instrument the java applications running in Websphere Liberty servers
-
Download the client instrumentation package which contains the
vunet-opentelemetry-javaagent.jar. Place thevunet-opentelemetry-javaagent.jarin your preferred directory. -
Locate the liberty server config. Each Liberty server instance has its own directory, like
$WLP_USER_DIR/servers/<server_name>/
Inside it, you will find server.xml, jvm.options etc. If you don't find jvm.options, please create the file.
- Add the following configurations to the jvm.options file
-javaagent:path/to/vunet-opentelemetry-javaagent.jar -Dotel.resource.attributes=application=<APPLICATION_NAME> -Dotel.service.name=<SERVICE_NAME>
-Dotel.metrics.exporter=none -Dotel.exporter.otlp.endpoint=<TRACES_INGESTION_ENDPOINT> -Dotel.exporter.otlp.compression=gzip
- Please update the following before saving the configuration
APPLICATION_NAME- Please change it to match your application nameSERVICE_NAME- Please Change it to match the service name (microservices) or application layer (monolithic)TRACES_INGESTION_ENDPOINT- Please change it to match the URL of the vuSmartMaps. It should behttp://<vuSmartMaps Server IP>:4317
- Save the file and restart the liberty server using the below commands.
bin/server stop <server_name>
bin/server start <server_name>
-
Repeat this for all the Liberty servers that need to be instrumented.
-
Once this is done, you will see the traces in the vuSmartMaps dashboard
Websphere Application Server ND
Follow the below instructions to instrument the java application running in Websphere Application Server Network Deployment
-
Download the client instrumentation package which contains the
vunet-opentelemetry-javaagent.jar. Place thevunet-opentelemetry-javaagent.jarin your preferred directory. -
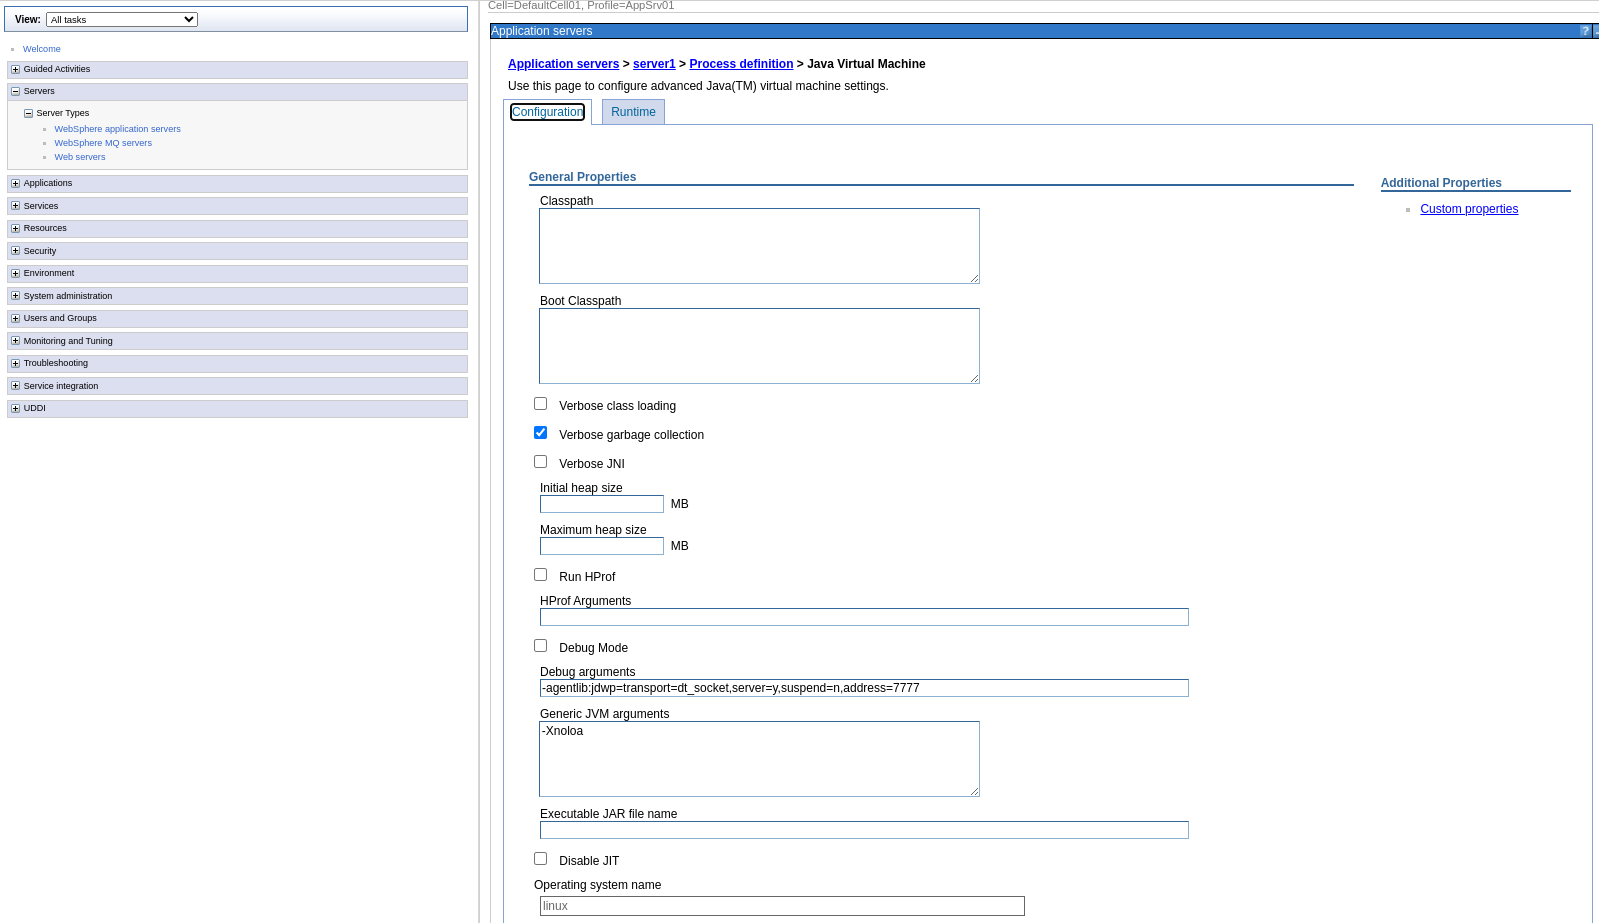
Login to the WebSphere Integrated Solutions Console
-
Navigate to Servers > Server type > WebSphere application servers.
-
Select the server.

-
Go to Java and Process Management > Process Definition.

-
Select Java Virtual Machine.
-
In Generic JVM arguments, add the following arguments.
-javaagent:path/to/vunet-opentelemetry-javaagent.jar -Dotel.resource.attributes=application=<APPLICATION_NAME> -Dotel.service.name=<SERVICE_NAME> -Dotel.metrics.exporter=none -Dotel.exporter.otlp.endpoint=<TRACES_INGESTION_ENDPOINT> -Dotel.exporter.otlp.compression=gzip -
Please update the following before saving the configuration
APPLICATION_NAME- Please change it to match your application nameSERVICE_NAME- Please Change it to match the service name (microservices) or application layer (monolithic)TRACES_INGESTION_ENDPOINT- Please change it to match the URL of the vuSmartMaps. It should behttp://<vuSmartMaps Server IP>:4317
-
Save the configuration and restart the server.
Docker
If your application is running in Docker, then modify the Dockerfile to include the JVM parameters mentioned above.
See the extract from a sample Dockerfile.
ENV JAVA_TOOL_OPTIONS "-javaagent:/usr/local/lib/vunet-opentelemetry-javaagent.jar"
ENV OTEL_RESOURCE_ATTRIBUTES "application=<Application Name>"
ENV OTEL_SERVICE_NAME "<Service Name>"
ENV OTEL_EXPORTER_OTLP_ENDPOINT "<TRACES_INGESTION_ENDPOINT>"
ENV OTEL_METRICS_EXPORTER "none"
ENTRYPOINT ["java","-Djava.security.egd=file:/dev/urandom","-jar","./app.jar", "--port=80"]
If you don’t want to rebuild the container, then you can re-run the container with the following additional environment variables.
docker run -d \
  -v ./vunet-opentelemetry-javaagent.jar:/app/opentelemetry-javaagent.jar \
  -e OTEL_EXPORTER_OTLP_ENDPOINT=<TRACES_INGESTION_ENDPOINT>\
  -e OTEL_SERVICE_NAME=<Service Name> \
  --entrypoint java \
  -javaagent:/app/opentelemetry-javaagent.jar \
  -jar /app/myapp.jar
Kubernetes
When you run your Java applications in Kubernetes based environments, please follow Kubernetes Zero-code Instrumentation
Enabling JVM Metrics Collection
Since the application is already instrumented with the OpenTelemetry Java agent for distributed tracing, the same agent can also be used to collect JVM and application runtime metrics (heap/non-heap memory, garbage collection, thread counts, class loading, and more). This removes the need for a separate JMX-based metrics agent vuAppagent, as both traces and metrics are now collected through a single agent.
Configuration Change Required
To enable metrics collection, update the existing instrumentation configuration for the target environment as follows:
-
Change OTEL_METRICS_EXPORTER / -Dotel.metrics.exporter from none to otlp.
-
Optionally set OTEL_METRIC_EXPORT_INTERVAL / -Dotel.metric.exporter.interval (in milliseconds) to control how frequently metrics are pushed to vuSmartMaps. If not set, the default is 60000 (60 seconds).
-
Metrics are sent to the same OTLP endpoint already configured for traces (OTEL_EXPORTER_OTLP_ENDPOINT / -Dotel.exporter.otlp.endpoint). No separate metrics endpoint or port is required.
No new package or additional agent needs to be downloaded — the existing vunet-opentelemetry-javaagent.jar used for tracing already supports metrics collection.
Example (Kubernetes)
The snippet below shows the environment variable changes needed in the container spec to enable metrics, in addition to the existing tracing configuration:
env:
- name: OTEL_METRICS_EXPORTER
value: "otlp" # was "none" — enables metrics export
- name: OTEL_METRIC_EXPORT_INTERVAL
value: "15000" # optional — export every 15 seconds
Example (JAVA_OPTS / System Properties)
For environments configured using -D system properties (SpringBoot/jar, JBoss, Tomcat, Weblogic, Websphere), add or update:
-Dotel.metrics.exporter=otlp
-Dotel.metric.export.interval=15000
Note on Kubernetes Resource Attributes
For Kubernetes deployments, it's recommended to enrich OTEL_RESOURCE_ATTRIBUTES with pod and node identity so metrics can be correlated back to the specific pod they originated from:
- name: OTEL_RESOURCE_ATTRIBUTES
value: >
k8s.pod.name=$(POD_NAME),
k8s.namespace.name=$(POD_NAMESPACE),
k8s.node.name=$(NODE_NAME),
k8s.pod.uid=$(POD_UID),
k8s.cluster.name=<CLUSTER_NAME>
This requires exposing POD_NAME, POD_NAMESPACE, NODE_NAME, and POD_UID via the Kubernetes Downward API (fieldRef) in the container's env section, as shown below:
- name: POD_NAME
valueFrom:
fieldRef:
fieldPath: metadata.name
- name: POD_NAMESPACE
valueFrom:
fieldRef:
fieldPath: metadata.namespace
- name: NODE_NAME
valueFrom:
fieldRef:
fieldPath: spec.nodeName
- name: POD_UID
valueFrom:
fieldRef:
fieldPath: metadata.uid
Please refer to the sample deployment.
Configuration
TLS Configuration
If the TLS is enabled on the vuSmartMaps traces receiver, please get the certificate from the server and configure the following additional parameters.
-Dotel.exporter.otlp.protocol=http/protobuf
-Dotel.exporter.otlp.certificate='/path/to/server/certificate'
The server certificate is included in the downloaded instrumentation package
For the TLS case TRACES_INGESTION_ENDPOINT should be https://\<vuSmartMaps Server IP\>:4318
Capture HTTP Headers
In some applications, key transaction identifiers are passed as HTTP headers to the APIs. To capture these headers, additional instrumentation configurations are required. Below are the steps and examples for capturing HTTP headers for both HTTP servers and clients.
Capture HTTP Request Header for HTTP Server
To capture the request headers passed to a service, use the following configuration along with other instrumentation configurations mentioned in the previous sections.
OTEL_INSTRUMENTATION_HTTP_SERVER_CAPTURE_REQUEST_HEADERS
You can configure one or more headers to be captured. If capturing multiple headers, separate them with commas.
An example is given below
-Dotel.resource.attributes=application=UPI -Dotel.service.name=upi-switch
-Dotel.metrics.exporter=none -Dotel.exporter.otlp.endpoint=http://10.0.0.1:4317
-Dotel.instrumentation.http.server.capture-request-headers=client_id,txn_id
 -jar upi.jar
Capture HTTP Response Header for HTTP Server
To capture the response headers passed from a service, use the following configuration along with other instrumentation configurations mentioned in the previous sections.
OTEL_INSTRUMENTATION_HTTP_SERVER_CAPTURE_RESPONSE_HEADERS
You can configure one or more headers to be captured. If capturing multiple headers, separate them with commas.
An example is given below
-Dotel.resource.attributes=application=UPI -Dotel.service.name=upi-switch
-Dotel.metrics.exporter=none
-Dotel.exporter.otlp.endpoint=http://10.0.0.1:4317  -Dotel.instrumentation.http.server.capture-response-headers=resp_code,resp_status
-jar  upi.jar
Capture HTTP Request Header for HTTP Client
To capture the request headers passed by a service, use the following configuration along with other instrumentation configurations mentioned in the previous sections.
OTEL_INSTRUMENTATION_HTTP_CLIENT_CAPTURE_REQUEST_HEADERS
You can configure one or more headers to be captured. If capturing multiple headers, separate them with commas.
An example is given below
-Dotel.resource.attributes=application=UPI -Dotel.service.name=upi-switch
-Dotel.metrics.exporter=none -Dotel.exporter.otlp.endpoint=http://10.0.0.1:4317
-Dotel.instrumentation.http.client.capture-request-headers=client_id,txn_id
-jar  upi.jar
Capture HTTP Response Header for HTTP Client
To capture the response headers received by a service, use the following configuration along with other instrumentation configurations mentioned in the previous sections
OTEL_INSTRUMENTATION_HTTP_CLIENT_CAPTURE_RESPONSE_HEADERS
You can configure one or more headers to be captured. If capturing multiple headers, separate them with commas.
An example is given below
-Dotel.resource.attributes=application=UPI -Dotel.service.name=upi-switch
-Dotel.metrics.exporter=none -Dotel.exporter.otlp.endpoint=http://10.0.0.1:4317
-Dotel.instrumentation.http.client.capture-response-headers=resp_code,resp_status
-jar upi.jar
C# / .NET Zero-code Instrumentation
Use the OpenTelemetry .NET Automatic Instrumentation to send traces and metrics from .NET applications and services to observability backends without having to modify their source code.
Definitions and Acronyms
- Service - The discrete unit of a system that provides some functionality. It is an entity that is instrumented to collect telemetry data such as traces, metrics, and logs. It is typically defined by a unique name that helps to differentiate it from other services in a distributed system.
- Application - The logical name given to a group of services which work together to deliver a specific business functionality. An Application is essentially the top-level entity that encompasses multiple services that may be distributed, but they all contribute to the overall functioning of the application.
- Trace - A trace represents a single request handled by the application. This request can be an HTTP request, a batch job request, or a consumer processing a message from a messaging system like Kafka, Redis, etc.
- Span - A Span represents a unit or works for fulfilling the request. You can consider these as the steps involved in the application to complete a request. Multiple spans form a trace.
Implementation/Procedure
This section provides the detailed instructions for instrumenting C# / .NET services.
Instrumentation Procedure
This section provides the instructions for instrumenting different environments.
.NET Core 3.1 Application
- The .NET Core 3.1 application does not support full auto instrumentation. It is partial auto-instrumentation, which means code changes are required. The code changes are related to initializing Open Telemetry.
- Add the Open telemetry packages
  <PackageReference Include="OpenTelemetry.Exporter.Console" Version="1.8.1" />
  <PackageReference Include="OpenTelemetry.Instrumentation.AspNetCore" Version="1.8.1" />
  <PackageReference Include="OpenTelemetry.Instrumentation.Http" Version="1.8.1" />
  <PackageReference Include="OpenTelemetry.Instrumentation.SqlClient" Version="1.8.0-beta.1" />
  <PackageReference Include="OpenTelemetry.Instrumentation.Runtime" Version="1.8.0" />
  <PackageReference Include="OpenTelemetry.Exporter.OpenTelemetryProtocol" Version="1.8.1" />
- Add Open telemetry service. In the Startup.cs add the below code
 .ConfigureResource(resource => resource.AddService(serviceName))
            .WithTracing(tracing => tracing
                            .AddAspNetCoreInstrumentation()
                           .AddHttpClientInstrumentation()
                           .AddOtlpExporter()
                           );
- Make sure you include the required packages
using OpenTelemetry.Resources;
using OpenTelemetry.Trace;
using OpenTelemetry.Exporter;
- Set the following environment variables
   1. OTEL_EXPORTER_OTLP_ENDPOINT with value “http://<vuSmartMaps Server IP>:4318”
   2. OTEL_EXPORTER_OTLP_PROTOCOL with value “http/protobuf”
   3. OTEL_RESOURCE_ATTRIBUTES with value “application=<APPLICATION_NAME>”
   4. OTEL_SERVICE_NAME with value “<SERVICE_NAME>”
- Build the application and run it
.NET Application running in Linux / MacOS (.NET Core)
Install Open Telemetry
Follow the steps below to install Open Telemetry in Linux / macOS machines. This is a one-time activity for a machine.
- Download the instrumentation package from o11ySource and extract it to your favourite folder. This is the OTel home directory.
- Install opentelemetry core files by running the bash script install.sh. This will install it in the dist folder.
Instrument the application
Every time you run the application, follow the steps below.
- Activate the auto instrumentation by running the following commands
chmod +x dist/instrument.sh
export OTEL_DOTNET_AUTO_HOME=dist
. dist/instrument.sh
-
This sets the required environment variables for the current terminal session
-
Set the following environment variables in the same terminal session
OTEL_EXPORTER_OTLP_ENDPOINTwith value“http://<vuSmartMaps Server IP>:4318”OTEL_EXPORTER_OTLP_PROTOCOLwith value“http/protobuf”OTEL_RESOURCE_ATTRIBUTESwith value“application=<APPLICATION_NAME>”OTEL_SERVICE_NAMEwith value“<SERVICE_NAME>”OTEL_TRACES_SAMPLERwith value“always_on"”
-
In the same terminal session, run the .NET application
Remove the instrumentation
- Go to the OTel Home directory
- Run the following commands
chmod +x remove_instrumentation.sh
. ./remove_instrumentation.sh
- This removes the instrumentation and you can run the application as usual.
.NET Application running in Linux using PM2
Install Open Telemetry
Follow the steps below to install Open Telemetry in Linux / macOS machines. This is a one-time activity for a machine.
- Create or go to the vunet’s folder. This is called
<VUNET_HOME> - Under this folder create a folder called otel-dotnet. Go into this folder.
- Download the instrumentation package from o11ySource and extract it to your favourite folder.
- Install opentelemetry core files by running the bash script install.sh. This will install it in the dist folder.
Instrument the application
- Find out the details of the service to be instrumented using the below command. This will show the script used to run the application. Note this information which is required when you want to remove the instrumentation.
pm2 show <application_name>
- Stop the application
pm2 stop <application_name>
- Delete the application
pm2 delete <application_name>
-
Create a wrapper script for the application.
- Create an env config file named
<VUNET_HOME>/otel-dotnet/otel-common.env
- Create an env config file named
export DOTNET_ADDITIONAL_DEPS=<VUNET_HOME>/otel-dotnet/dist/AdditionalDeps
export DOTNET_SHARED_STORE=<VUNET_HOME>/otel-dotnet/dist/store
export DOTNET_STARTUP_HOOKS=<VUNET_HOME>/otel-dotnet/dist/net/OpenTelemetry.AutoInstrumentation.StartupHook.dll
export CORECLR_ENABLE_PROFILING=1
export CORECLR_PROFILER='{918728DD-259F-4A6A-AC2B-B85E1B658318}'
export CORECLR_PROFILER_PATH=<VUNET_HOME>/otel-dotnet/dist/linux-x64/OpenTelemetry.AutoInstrumentation.Native.so
export OTEL_EXPORTER_OTLP_ENDPOINT=http://<vuSmartMaps_Server_IP>:4318
export OTEL_EXPORTER_OTLP_PROTOCOL=http/protobuf
export OTEL_TRACES_SAMPLER=always_on
Please change the following to match your environment.
<VUNET_HOME> - This is the folder where you run the install.sh
<vuSmartMaps_Server_IP> - The ip / host of the server where the OTel collector is running
- Create the wrapper script called
<VUNET_HOME>/otel-dotnet/otel-common.envwith the below content
#!/bin/bash

# Source common OTel environment
source <VUNET_HOME>/otel-dotnet/otel-common.env

# App-specific configuration
export OTEL_RESOURCE_ATTRIBUTES=aplication=<APPLICATION_NAME>
export OTEL_SERVICE_NAME=<SERVICE_NAME>

# Navigate to app directory and run
cd <app_directory>
dotnet <app.dll>
- Make the wrapper executable
chmod +x <VUNET_HOME>/otel-dotnet/start-<app_name>.sh
- Change the application startup using the PM2 command
pm2 start <VUNET_HOME>/otel-dotnet/start-<app_name>.sh --name <app_name>
pm2 save
pm2 list
Remove the instrumentation
- Revert the PM2 startup command. This information is fetched through the pm2 show command before instrumentation
.NET Application running on Container (.NET Core)
- Modify the Dockerfile to include the following lines to enable opentelemetry auto instrumentation
# install OpenTelemetry .NET Automatic Instrumentation
ARG OTEL_VERSION=1.4.0
ADD https://github.com/open-telemetry/opentelemetry-dotnet-instrumentation/releases/download/v${OTEL_VERSION}/otel-dotnet-auto-install.sh otel-dotnet-auto-install.sh
RUN apt-get update && apt-get install -y curl
RUN apt-get update && apt-get install -y unzip && \
    OTEL_DOTNET_AUTO_HOME="/otel-dotnet-auto" sh otel-dotnet-auto-install.sh
- Build the docker image
- Create a file called otel-dotnet.env with the following content
# enable OpenTelemetry .NET Automatic Instrumentation
CORECLR_ENABLE_PROFILING="1"
CORECLR_PROFILER='{918728DD-259F-4A6A-AC2B-B85E1B658318}'
CORECLR_PROFILER_PATH="/otel-dotnet-auto/linux-x64/OpenTelemetry.AutoInstrumentation.Native.so"
DOTNET_ADDITIONAL_DEPS="/otel-dotnet-auto/AdditionalDeps"
DOTNET_SHARED_STORE="/otel-dotnet-auto/store"
DOTNET_STARTUP_HOOKS="/otel-dotnet-auto/net/OpenTelemetry.AutoInstrumentation.StartupHook.dll"
OTEL_DOTNET_AUTO_HOME="/otel-dotnet-auto"
- Run the Docker image with the following environment variables and env file
-env-file ./otel-dotnet.env --env OTEL_EXPORTER_OTLP_ENDPOINT="http://<vuSmartMaps Server IP>:4318" OTEL_EXPORTER_OTLP_PROTOCOL="http/protobuf" OTEL_RESOURCE_ATTRIBUTES="application=<APPLICATION_NAME>" OTEL_SERVICE_NAME="<SERVICE_NAME>"
OTEL_TRACES_SAMPLER=”always_on”
ASP.NET Application running in IIS (.NET Framework & .NET Core)
- Download the instrumentation package (dotnet_auto_instrumentation_offline_package.zip) from o11ySource and extract it.
- Open PowerShell in administrator mode. Navigate to the folder where the instrumentation packages have been extracted.
- Install OpenTelemetry auto instrumentation by running the PowerShell script OpenTelemetry.DotNet.Auto.psm1
# Import the module
Import-Module ".\OpenTelemetry.DotNet.Auto.psm1"

If you get error like this

Import-Module : File OpenTelemetry.DotNet.Auto.psm1 cannot be loaded. The file
OpenTelemetry.DotNet.Auto.psm1 is not digitally signed. You cannot run this script on the
current system. For more information about running scripts and setting execution policy, see about_Execution_Policies at https:/go.microsoft.com/fwlink/?LinkID=135170.
At line:1 char:1
+ Import-Module ".\OpenTelemetry.DotNet.Auto.psm1"
+ ~~~~~~~~~~~~~~~~~~~~~~~~~~~~~~~~~~~~~~~~~~~~~~~~
    + CategoryInfo          : SecurityError: (:) [Import-Module], PSSecurityException
    + FullyQualifiedErrorId : UnauthorizedAccess,Microsoft.PowerShell.Commands.ImportModuleCommand

Run the below command

Set-ExecutionPolicy -Scope Process -ExecutionPolicy Bypass -Force

# Install core files
Install-OpenTelemetryCore -InstallDir "C:\Program Files\OpenTelemetry .NET AutoInstrumentation" -LocalPath ".\opentelemetry-dotnet-instrumentation-windows.zip"
By default, this is installed in the “C:\Program Files\OpenTelemetry .NET AutoInstrumentation” directory. You can install this in any folder by changing the “InstallDir” option
- Run the command Register-OpenTelemetryForIIS. This will restart the IIS.
# Setup IIS instrumentation
Register-OpenTelemetryForIIS
Security warning
Run only scripts that you trust. While scripts from the internet can be useful, this script can potentially harm your computer. If
you trust this script, use the Unblock-File cmdlet to allow the script to run without this warning message. Do you want to run
D:\Dev\dotnet-instrumentation\madrid\instrumentation-package\dotnet\auto-instrumentation\pkg\otel\OpenTelemetry.DotNet.Auto.psm1?
[D] Do not run  [R] Run once  [S] Suspend  [?] Help (default is "D"): R

Attempting stop...
Internet services successfully stopped
Attempting start...
Internet services successfully restarted
- Set the setting for the application.
- For .NET Framework applications.
Option 1: Using IIS Manager
You can set the following settings using the “Application Settings” menu from IIS manager. This is the safest option.
- Open IIS manager.
- Select your application and double click on “Application Settings”
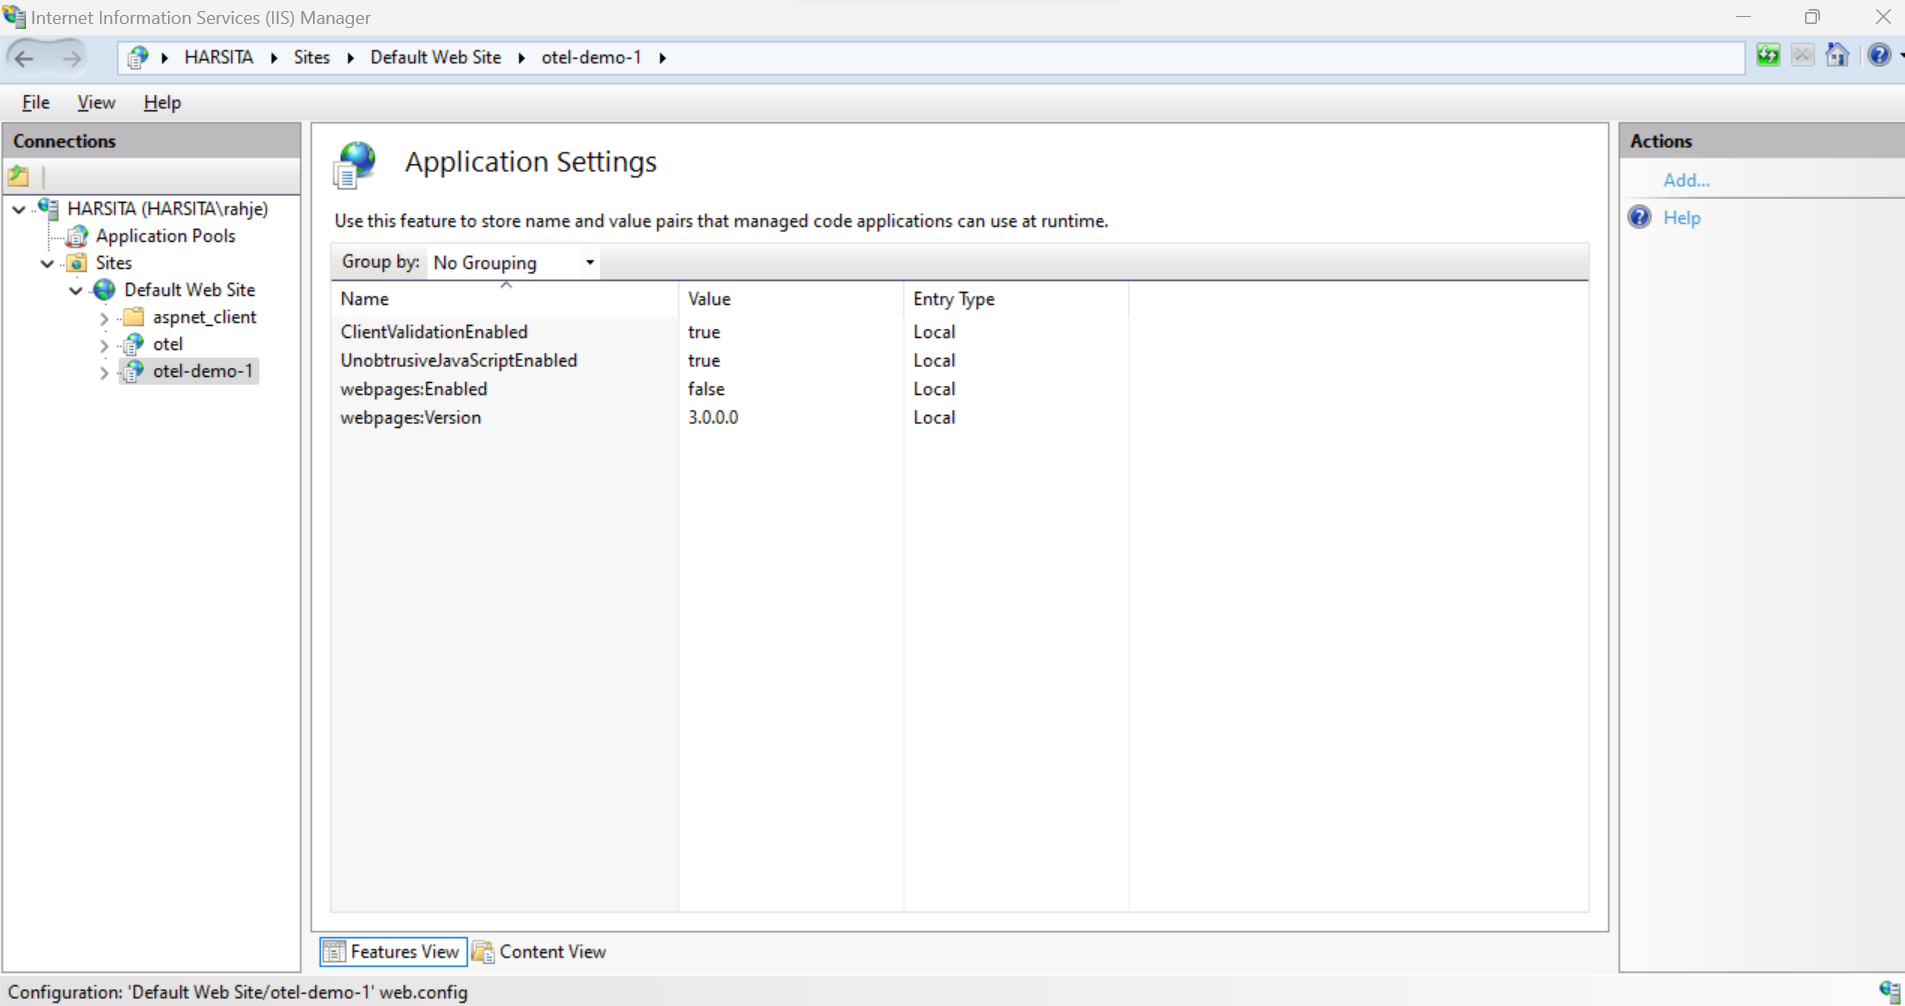
- Add the following application settings.
OTEL_EXPORTER_OTLP_ENDPOINTwith value“http://<vuSmartMaps Server IP>:4318”OTEL_EXPORTER_OTLP_PROTOCOLwith value“http/protobuf”OTEL_RESOURCE_ATTRIBUTESwith value“application=<APPLICATION_NAME>,host.name=<host_name>,host.ip=<host_ip>”OTEL_SERVICE_NAMEwith value“<SERVICE_NAME>”OTEL_METRICS_EXPORTERwith value“none”OTEL_DOTNET_AUTO_TRACES_WCFSERVICE_INSTRUMENTATION_ENABLEDwith value“false”OTEL_TRACES_SAMPLERwith valuealways_on
- Restart IIS
Option 2: Add to <appSettings> in Web.config
When your application already uses <appSettings> in the Web.config, then go ahead and add the following keys.
Only one <appSettings> section is allowed in Web.config.
- Open the Web.config file of your application
- Add the following keys to the
<appSettings>OTEL_EXPORTER_OTLP_ENDPOINTwith value“http://<vuSmartMaps Server IP>:4318”OTEL_EXPORTER_OTLP_PROTOCOLwith value“http/protobuf”OTEL_RESOURCE_ATTRIBUTESwith value“application=<APPLICATION_NAME>,host.name=<host_name>,host.ip=<host_ip>”OTEL_SERVICE_NAMEwith value“<SERVICE_NAME>”OTEL_METRICS_EXPORTERwith value“none”OTEL_DOTNET_AUTO_TRACES_WCFSERVICE_INSTRUMENTATION_ENABLEDwith value“false”OTEL_TRACES_SAMPLERwith value"always_on"
An example is shown below.
<appSettings>
        <add key="OTEL_EXPORTER_OTLP_ENDPOINT" value="http://10.0.0.1:4318" />
    <add key="OTEL_EXPORTER_OTLP_PROTOCOL" value="http/protobuf" />
    <add key="OTEL_RESOURCE_ATTRIBUTES" value="application=TestApp" />
    <add key="OTEL_SERVICE_NAME" value="application=TestService" />
    <add key="OTEL_METRICS_EXPORTER" value="none" />
              <add key="OTEL_TRACES_SAMPLER" value="always_on" />
    <add key="OTEL_DOTNET_AUTO_TRACES_WCFSERVICE_INSTRUMENTATION_ENABLED" value="false" />
    </appSettings>
Option 3: External config file
Use this when your Web.config doesn’t currently have <appSettings> and you wanna keep telemetry settings separate.
Only one <appSettings> section is allowed in Web.config.
- Create a new file called
“Instrumentation_Config.xml”in the publish folder and append it with the content shown below
  <add key="OTEL_EXPORTER_OTLP_ENDPOINT" value="http://10.0.0.1:4318" />
  <add key="OTEL_EXPORTER_OTLP_PROTOCOL" value="http/protobuf" />
  <add key="OTEL_RESOURCE_ATTRIBUTES" value="application=TestApp" />
  <add key="OTEL_SERVICE_NAME" value="TestService" />
  <add key="OTEL_METRICS_EXPORTER" value="none" />
  <add key="OTEL_DOTNET_AUTO_TRACES_WCFSERVICE_INSTRUMENTATION_ENABLED" value="false" />
<add key="OTEL_TRACES_SAMPLER" value="always_on" />
</appSettings>
- Open the Web.config file of your application
- Add the
<appSettings>section with file option that points to theInstrumentation\_Config.xmlas shown below
     <appSettings file="Instrumentation_Config.xml" />
   </configuration>
- Save the Web.config file
- Restart IIS
Option 4: Add as Environment Variables in the Application Pool (Per-App Pool)
When your application runs in its own dedicated Application Pool, you can configure the OpenTelemetry settings as environment variables directly on that pool. These variables apply only to the worker process for that pool.
However, if the Application Pool is shared by multiple applications, you should not use this option because the instrumentation settings (such as application name and service name) would incorrectly apply to every app in that shared pool.
- Find out the application pool used by your application
- Open IIS manager and select the application
- Click on the “Basic Settings”. You can see the application pool name.
- Select the server from the left panel. Open 'Configuration Editor' from the Management section.

- Open section 'system.applicationHost/applicationPools'
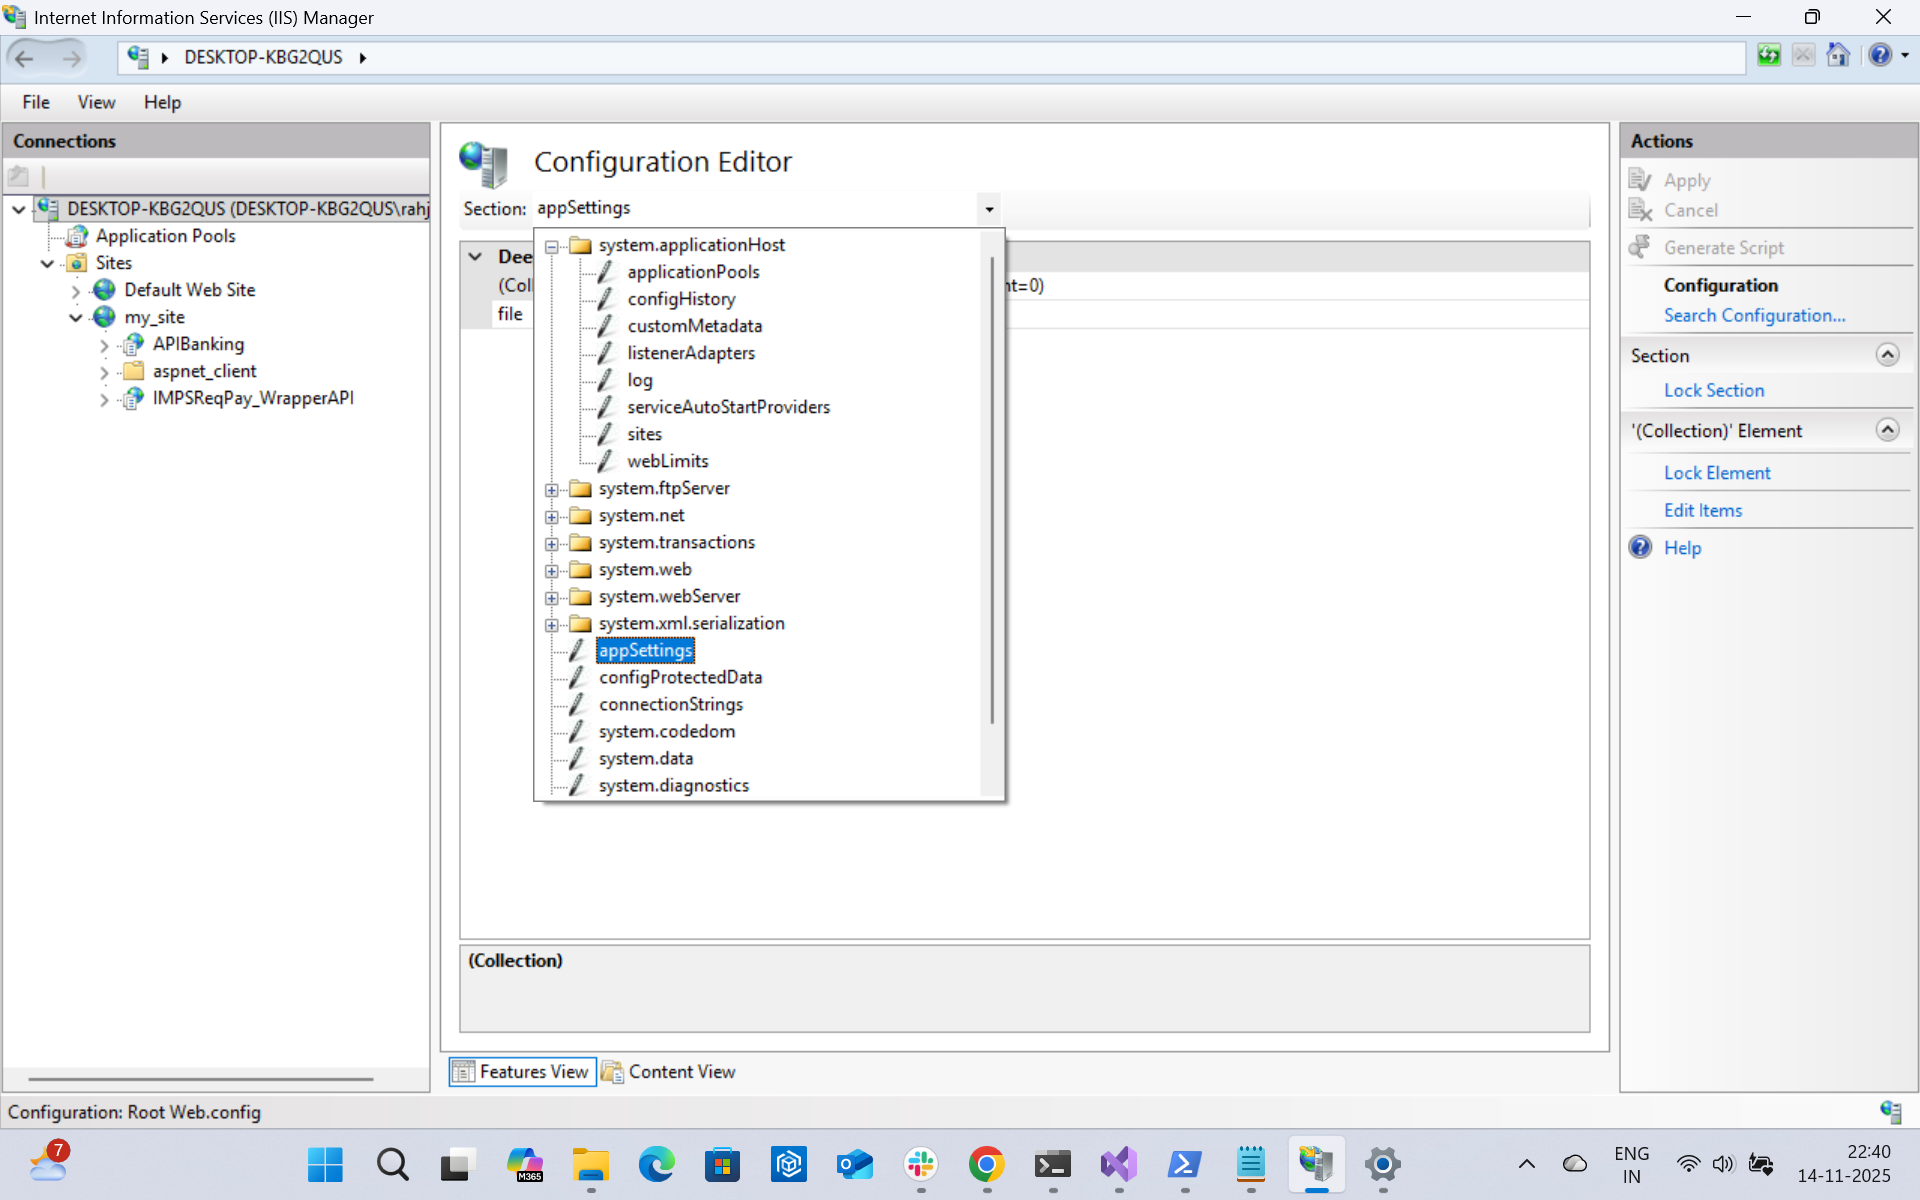
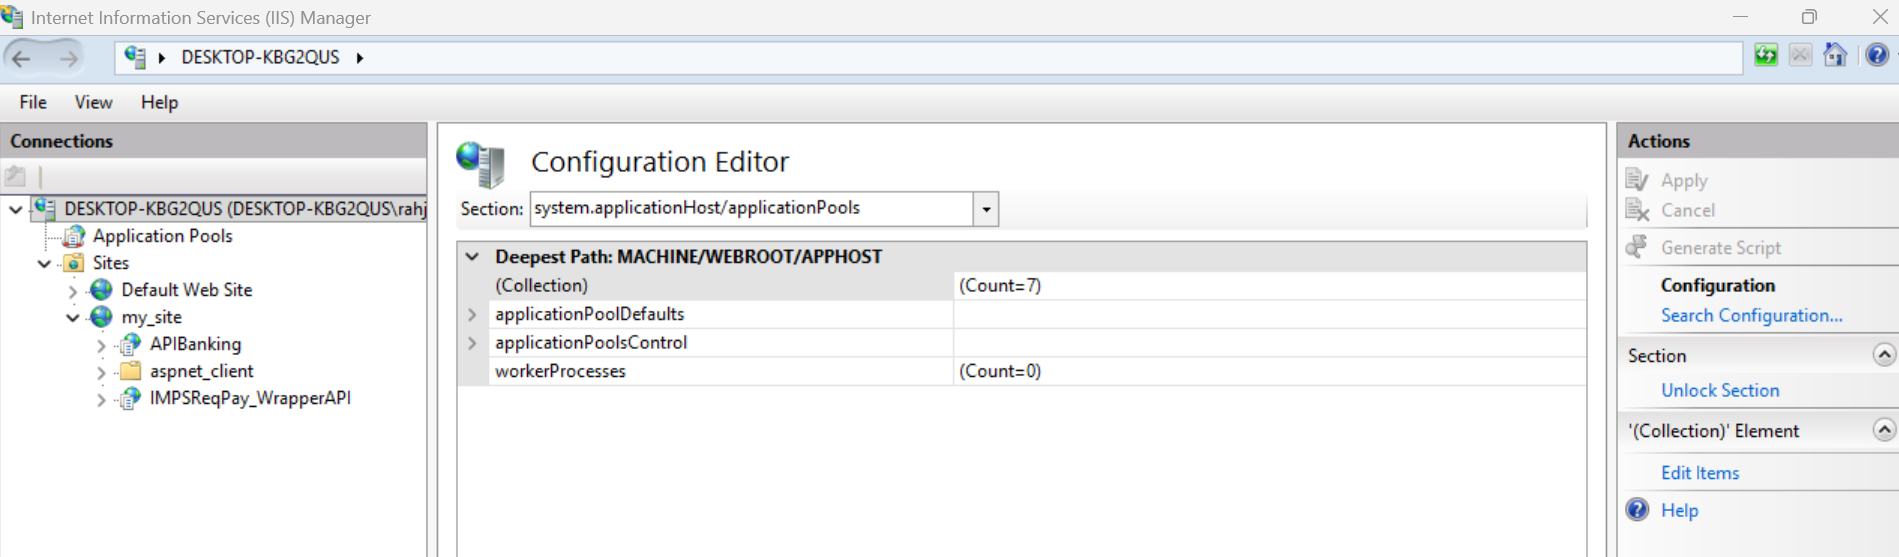
-
Press '...' in the first entry of the table (Collection).

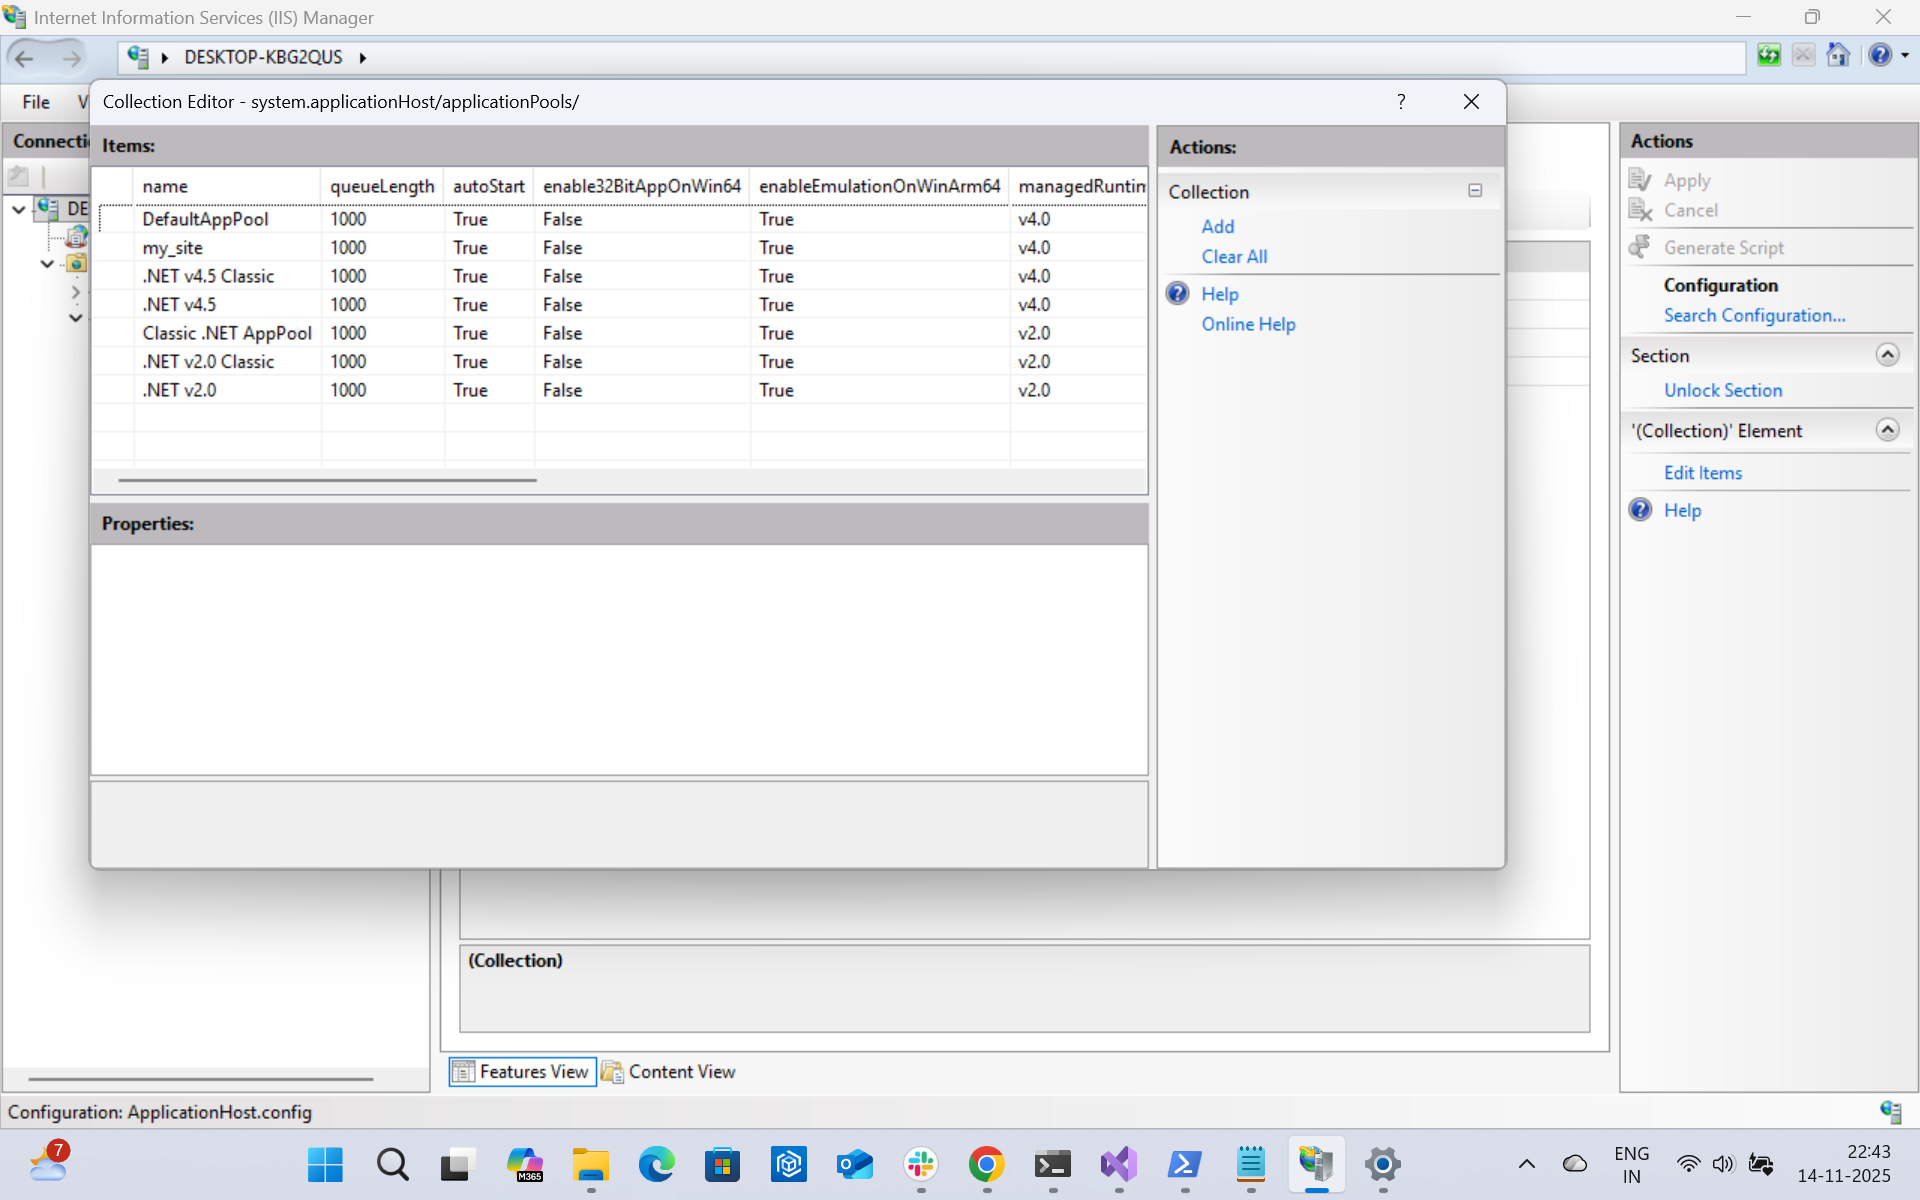
-
Select the row with your application pool name.
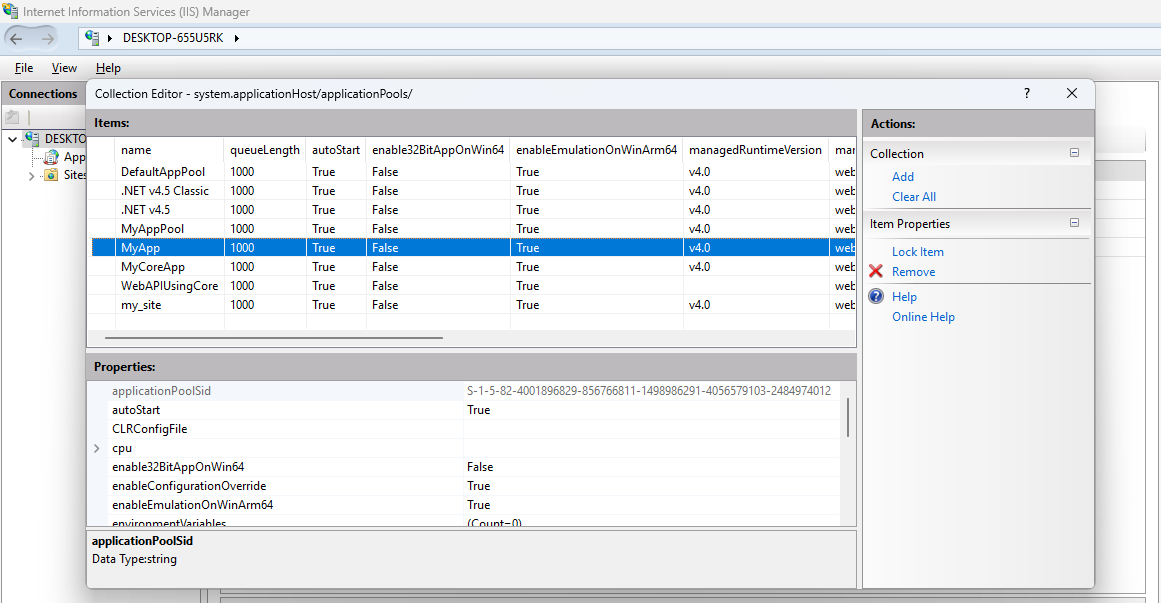
- At the 'Properties' section, select 'environmentVariables' and press '...'.
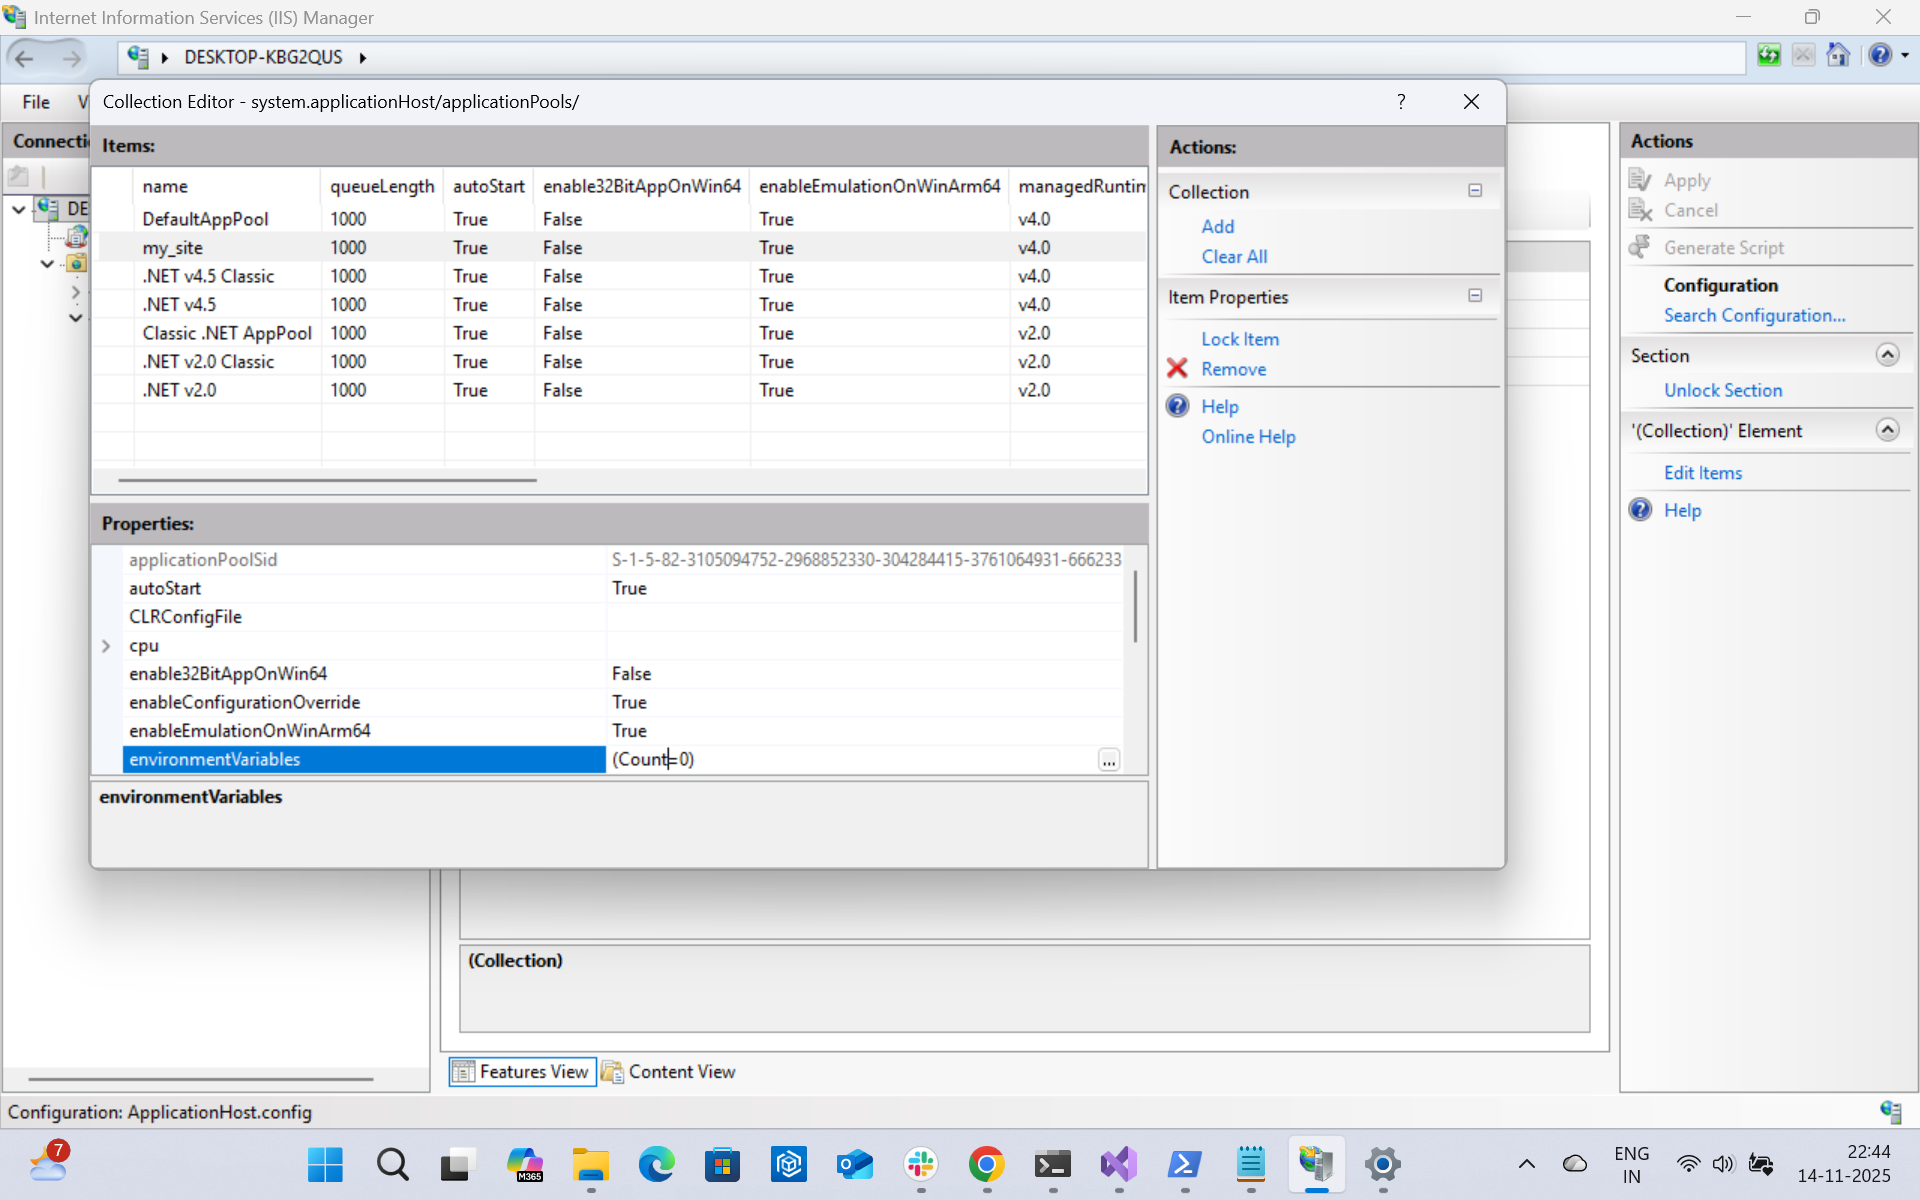

- Add the environment variables shown below.
OTEL_EXPORTER_OTLP_ENDPOINTwith value“http://<vuSmartMaps Server IP>:4318”OTEL_EXPORTER_OTLP_PROTOCOLwith value“http/protobuf”OTEL_RESOURCE_ATTRIBUTESwith value“application=<APPLICATION_NAME>,host.name=<host_name>,host.ip=<host_ip>”OTEL_SERVICE_NAMEwith value“<SERVICE_NAME>”OTEL_METRICS_EXPORTERwith value“none”OTEL_DOTNET_AUTO_TRACES_WCFSERVICE_INSTRUMENTATION_ENABLEDwith value“false”OTEL_TRACES_SAMPLERwith the value"always_on"
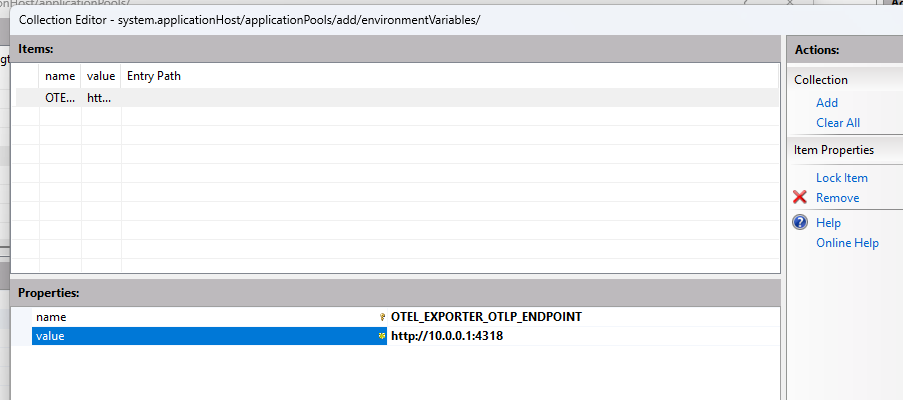
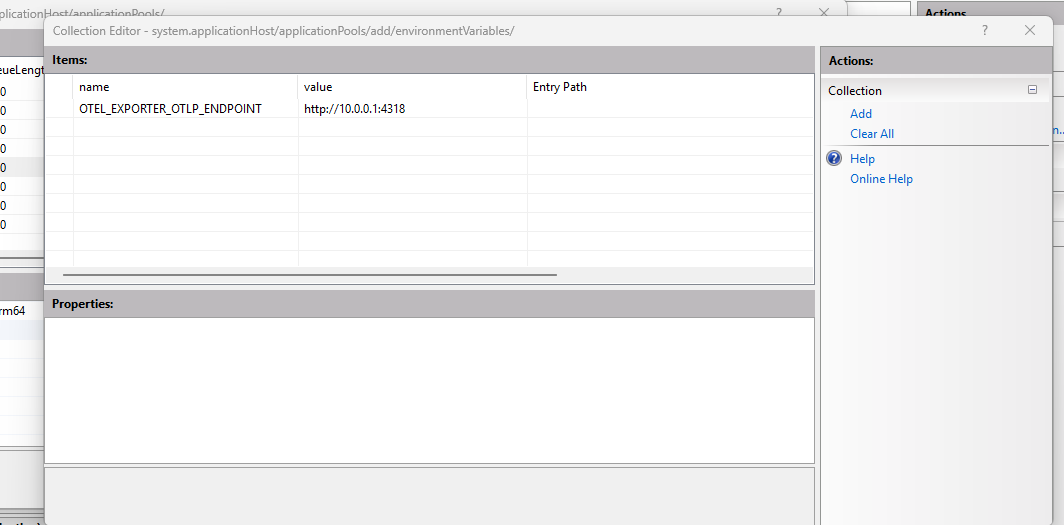
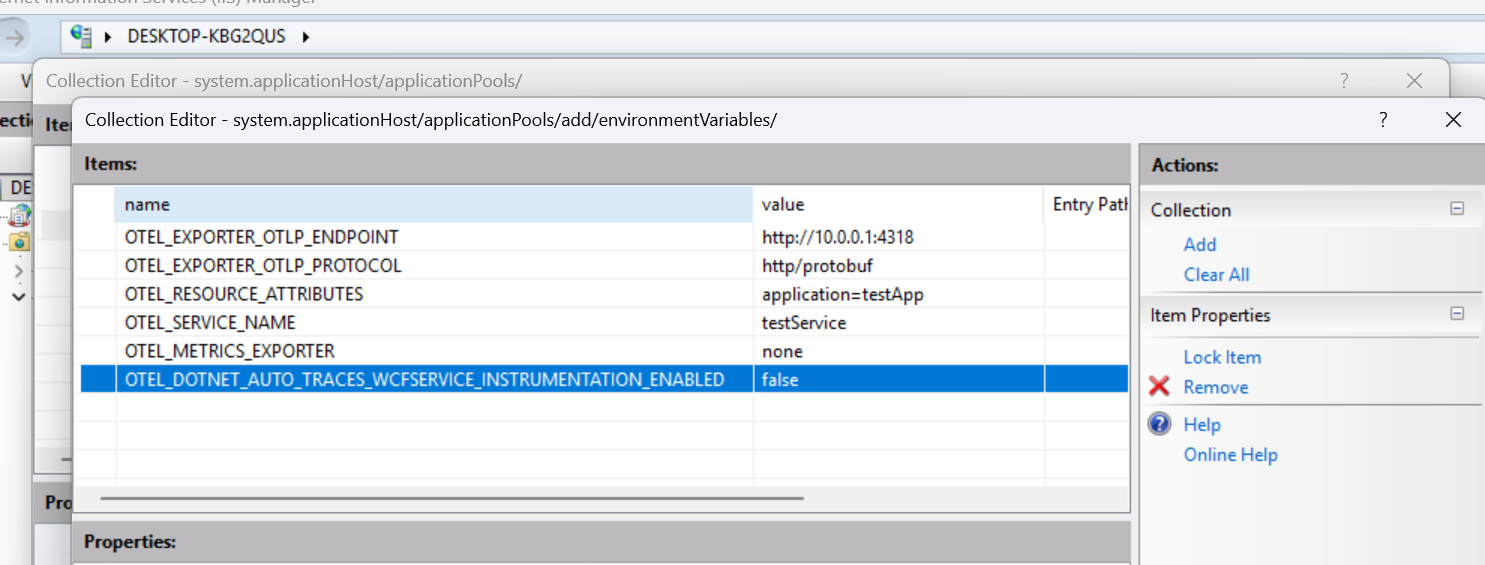
-
Close all external windows and press 'Apply' in the main 'Configuration Editor' view.
-
Restart your application.
- For .NET Core applications.
- Add the following application settings under the
<environmentVariablesin the<aspNetCore>section in the web.config file-
OTEL_EXPORTER_OTLP_ENDPOINTwith value“http://<vuSmartMaps Server IP>:4318” -
OTEL_EXPORTER_OTLP_PROTOCOLwith value“http/protobuf” -
OTEL_RESOURCE_ATTRIBUTESwith value“application=<APPLICATION_NAME>,host.name=<host_name>,host.ip=<host_ip>” -
OTEL_SERVICE_NAMEwith value“<SERVICE_NAME>” -
OTEL_METRICS_EXPORTERwith value“none” -
OTEL_TRACES_SAMPLERwith the value"always_on"For example:
-
- Add the following application settings under the
- For .NET Core applications.
<aspNetCore processPath="dotnet" arguments=".\WebApplication2.dll" stdoutLogEnabled="true" stdoutLogFile=".\logs\stdout" hostingModel="inprocess" >
    <environmentVariables>
            <environmentVariable name="OTEL_EXPORTER_OTLP_ENDPOINT" value="http://<vuSmartMaps Server IP>:4318" />
<environmentVariable name="OTEL_EXPORTER_OTLP_PROTOCOL" value="http/protobuf" />
        <environmentVariable name="OTEL_METRICS_EXPORTER" value="none" />
        <environmentVariable name="OTEL_SERVICE_NAME" value="<SERVICE_NAME>" />
        <environmentVariable name="OTEL_RESOURCE_ATTRIBUTES" value="application=<APPLICATION_NAME>,host.name=<HOST_NAME>,host.ip=<HOST_IP>" />
<environmentVariable name="OTEL_TRACES_SAMPLER" value="always_on" />
    </environmentVariables>
      </aspNetCore>
6. Restart IIS
Enable / Disable Instrumentation per Application Pool (.NET Framework only)
By default, all the applications are instrumented. But you can disable instrumentation per application pool.
Import-Module ".\OpenTelemetry.DotNet.Auto.psm1"

# Disable the instrumentation for the app pool
Disable-OpenTelemetryForIISAppPool -AppPoolName <App_Pool_Name>

# Restart Application Pool
Restart-WebAppPool -Name "MyAppPool"
To enable the instrumentation for the Application Pool, you can use the following command
Import-Module ".\OpenTelemetry.DotNet.Auto.psm1"

# Disable the instrumentation for the app pool
Enable-OpenTelemetryForIISAppPool -AppPoolName <App_Pool_Name>

# Restart Application Pool
Restart-WebAppPool -Name "MyAppPool"
Warning: Property . is not found
If you get below error then the instrumentation will not work,
WARNING: Property . is not found on
/system.applicationHost/applicationPools/add[@name='DefaultAppPool']/environmentVariables at index @{name="COR_ENABLE_PROFILING"}.
To fix above issue we need to run below command
PS C:\WINDOWS\system32> Set-ItemProperty IIS:\AppPools\DefaultAppPool -Name environmentVariables -Value @{name='COR_ENABLE_PROFILING';value='1'}
Remove Instrumentation
- Run the following commands to remove the instrumentation.
# Import the module
Import-Module ".\OpenTelemetry.DotNet.Auto.psm1"
Unregister-OpenTelemetryForIIS
Uninstall-OpenTelemetryCore
.NET Application running as exe in Terminal
Install the Opentelemetry
Installing the open telemetry is a one-time job for a machine. This will install Open Telemetry on the machine.
- Download the instrumentation package (dotnet_auto_instrumentation_offline_package.zip) from here and extract it.
- Open PowerShell in administrator mode. Go into the folder where the instrumentation packages are extracted.
- Install OpenTelemetry auto instrumentation by running the powershell script OpenTelemetry.DotNet.Auto.psm1
# Import the module
Import-Module ".\OpenTelemetry.DotNet.Auto.psm1"

# Install core files
Install-OpenTelemetryCore -InstallDir "C:\Program Files\OpenTelemetry .NET AutoInstrumentation" -LocalPath ".\opentelemetry-dotnet-instrumentation-windows.zip"
By default, this is installed in the “C:\\Program Files\\OpenTelemetry .NET AutoInstrumentation” directory. You can install this in any folder by changing the “InstallDir” option
Instrument the application running as an exe
Once Open Telemetry is instrumented, the application can be instrumented using the steps below. These steps need to be followed every time you run the application.
- Run the command Register-OpenTelemetryForCurrentSession
Register-OpenTelemetryForCurrentSession
- Set the following environment variables
# Set environment variables for OpenTelemetry
$env:OTEL_EXPORTER_OTLP_ENDPOINT = "http://<vuSmartMaps Server IP>:4318"
$env:OTEL_EXPORTER_OTLP_PROTOCOL = "http/protobuf"
$env:OTEL_METRICS_EXPORTER = "none"
$env:OTEL_SERVICE_NAME = "<SERVICE_NAME>"
$env:OTEL_RESOURCE_ATTRIBUTES = "application=<APPLICATION_NAME>,host.name=<HOST_NAME>,host.ip=<HOST_IP>"
$env:OTEL_TRACES_SAMPLER= "always_on"
- Run the application exe
Instead of running these commands every time, you can create a PowerShell script to automate this. A sample PowerShell script is shown below.
$otelServiceName = “MyDotNetService”
$applicationName = “MyApp"
$exporterEndpoint = “http://<vuSmartMaps Server IP>:4318”
$hostName=”server1”
$hostIP=”10.0.0.1”

Register-OpenTelemetryForCurrentSession -OTelServiceName $otelServiceName

# Set environment variables
$env:OTEL_EXPORTER_OTLP_ENDPOINT = $exporterEndpoint
$env:OTEL_EXPORTER_OTLP_PROTOCOL = "http/protobuf"
$env:OTEL_METRICS_EXPORTER = "none"
$env:OTEL_SERVICE_NAME = $otelServiceName
$env:OTEL_RESOURCE_ATTRIBUTES = "application=$applicationName,host.name=$hostName,host.ip=$hostIP"
$env:OTEL_TRACES_SAMPLER= "always_on"
# Run the application
.\xyz.exe
Uninstall Open Telemetry for exe
- Install OpenTelemetry auto instrumentation by running the PowerShell script OpenTelemetry.DotNet.Auto.psm1
# Import the module
Import-Module ".\OpenTelemetry.DotNet.Auto.psm1"

Unregister-OpenTelemetryForCurrentSession

Uninstall-OpenTelemetryCore

Remove-Item -Path env:OTEL_EXPORTER_OTLP_ENDPOINT
Remove-Item -Path env:OTEL_EXPORTER_OTLP_PROTOCOL
Remove-Item -Path env:OTEL_METRICS_EXPORTER
Remove-Item -Path env:OTEL_SERVICE_NAME
Remove-Item -Path env:OTEL_RESOURCE_ATTRIBUTES
Remove-Item -Path env:OTEL_TRACES_SAMPLER
.NET Application running as an exe in the Task Scheduler
- Download the instrumentation package (dotnet_auto_instrumentation_offline_package.zip) from here and extract it.
- Open PowerShell in administrator mode. Navigate to the folder where the instrumentation packages have been extracted.
- Install OpenTelemetry auto instrumentation by running the PowerShell script OpenTelemetry.DotNet.Auto.psm1
# Import the module
Import-Module ".\OpenTelemetry.DotNet.Auto.psm1"

# Install core files
Install-OpenTelemetryCore -InstallDir "C:\Program Files\OpenTelemetry .NET AutoInstrumentation" -LocalPath ".\opentelemetry-dotnet-instrumentation-windows.zip"
By default, this is installed in the “C:\Program Files\OpenTelemetry .NET AutoInstrumentation” directory. You can install this in any folder by changing the “InstallDir” option
- Create a wrapper PowerShell script to wrap your exe
# Configure the Service Name
$OTelServiceName = "SERVICE_NAME"

# Configure the OTel installation path
$installDir = "C:\Program Files\OpenTelemetry .NET AutoInstrumentation"

# Configure your exe path
$exePath = "C:\MyDotNetApp.exe"

# Configure the resource attributes
$applicationName = "APPLICATION_NAME"
$hostName = "HOST_NAME"
$hostIp = "HOST_IP"

# Configure OpenTelemetry Exporter settings
$otelExporterOtlpEndpoint = "http://<vuSmartMaps Server IP>:4318"
$otelExporterOtlpProtocol = "http/protobuf"
$otelMetricsExporter = "none"

$otelResourceAttributes = "application=$applicationName,host.name=$hostName,host.ip=$hostIp"

# Create the environment variables directly in the script
$varsTable = @{
    "OTEL_SERVICE_NAME" = $OTelServiceName
    "OTEL_RESOURCE_ATTRIBUTES" = $otelResourceAttributes
    "OTEL_EXPORTER_OTLP_ENDPOINT" = $otelExporterOtlpEndpoint
    "OTEL_EXPORTER_OTLP_PROTOCOL" = $otelExporterOtlpProtocol
    "OTEL_METRICS_EXPORTER" = $otelMetricsExporter
    "COR_ENABLE_PROFILING" = "1"
    "COR_PROFILER" = "{918728DD-259F-4A6A-AC2B-B85E1B658318}"
    "COR_PROFILER_PATH_64" = "$installDir\win-x64\OpenTelemetry.AutoInstrumentation.Native.dll"
    "COR_PROFILER_PATH_32" = "$installDir\win-x86\OpenTelemetry.AutoInstrumentation.Native.dll"
    "CORECLR_ENABLE_PROFILING" = "1"
    "CORECLR_PROFILER" = "{918728DD-259F-4A6A-AC2B-B85E1B658318}"
    "CORECLR_PROFILER_PATH_32" = "$installDir\win-x86\OpenTelemetry.AutoInstrumentation.Native.dll"
    "CORECLR_PROFILER_PATH_64" = "$installDir\win-x64\OpenTelemetry.AutoInstrumentation.Native.dll"
    "ASPNETCORE_HOSTINGSTARTUPASSEMBLIES" = "OpenTelemetry.AutoInstrumentation.AspNetCoreBootstrapper"
    "DOTNET_ADDITIONAL_DEPS" = "$installDir\AdditionalDeps"
    "DOTNET_SHARED_STORE" = "$installDir\store"
    "DOTNET_STARTUP_HOOKS" = "$installDir\net\OpenTelemetry.AutoInstrumentation.StartupHook.dll"
    "OTEL_DOTNET_AUTO_HOME" = $installDir
}

# Set environment variables for the current session
foreach ($var in $varsTable.Keys) {
    [System.Environment]::SetEnvironmentVariable($var, $varsTable[$var], [System.EnvironmentVariableTarget]::Process)
}

# Run the .NET application
& $exePath
Please configure the following to match your environment
- Service Name - Configure the correct
SERVICE_NAME - Install Dir - Configure the correct install directory of OTel
- Exe Path - Make sure you mention the correct path of the exe
- Application Name - Provide the correct application name
- Host Name - You can provide the host name. If you don't need the hostname then remove it from
$otelResourceAttributes = "application=$applicationName,host.name=$hostName,host.ip=$hostIp" - Host IP - You can provide the host IP. If you don't need the hostname then remove it from
$otelResourceAttributes = "application=$applicationName,host.name=$hostName,host.ip=$hostIp" - OTel Exporter Otlp Endpoint - Change this to the OTel collector endpoint
- Modify your task
- Open Task Scheduler and find your task.
- Right-click the task and select Properties.
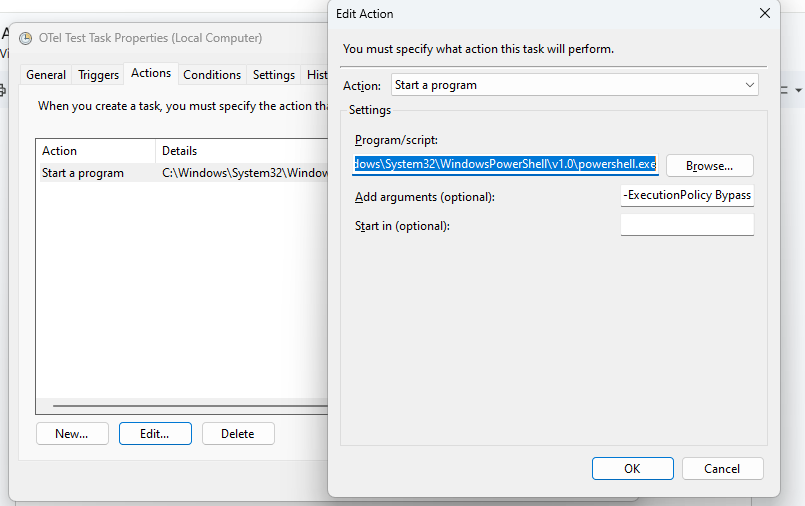
- Go to the Actions tab and click Edit.
- In the Action section, choose Start a program.
- For the Program/script, enter the full path to powershell.exe. The path is typically
“C:\\Windows\\System32\\WindowsPowerShell\\v1.0\\powershell.exe” - In the Add arguments (optional) field, enter the following
-ExecutionPolicy Bypass \-File "\<full path of the wrapper powershell script you created>"
For ex -ExecutionPolicy Bypass \-File "C:\\Myne\\instrument-exe\\MyDotNetApp\\MyApp.ps1"
Uninstall Open Telemetry for the exe running in Task Scheduler
- Uninstall Open Telemetry auto instrumentation by running the PowerShell script OpenTelemetry.DotNet.Auto.psm1
# Import the module
Import-Module ".\OpenTelemetry.DotNet.Auto.psm1"

Uninstall-OpenTelemetryCore
- Modify your task
- Open Task Scheduler and find your task.
- Right-click the task and select Properties.
- Go to the Actions tab and click Edit.
- In the Action section, choose Start a program.
- For the Program/script, enter your exe path and save.
Configuration
Capture HTTP Headers
In some applications, key transaction identifiers are passed as HTTP headers to the APIs. To capture these headers, additional instrumentation configurations are required. Below are the steps and examples for capturing HTTP headers for both HTTP servers and clients.
Capture HTTP Request Header for ASP.NET Core
To capture the request headers of ASP.NET Core, use the following configuration along with other instrumentation configurations mentioned in the previous sections.
OTEL_DOTNET_AUTO_TRACES_ASPNETCORE_INSTRUMENTATION_CAPTURE_REQUEST_HEADERS
You can configure one or more headers to be captured. If capturing multiple headers, separate them with commas. Based on the environment, add this additional configuration.
For example
OTEL_DOTNET_AUTO_TRACES_ASPNETCORE_INSTRUMENTATION_CAPTURE_REQUEST_HEADERS=client_id,applicationid
Capture HTTP Response Header for ASP.NET Core
To capture the response headers of ASP.NET Core, use the following configuration along with other instrumentation configurations mentioned in the previous sections.
OTEL_DOTNET_AUTO_TRACES_ASPNETCORE_INSTRUMENTATION_CAPTURE_RESPONSE_HEADERS
You can configure one or more headers to be captured. If capturing multiple headers, separate them with commas. Based on the environment, add this additional configuration.
For example
OTEL_DOTNET_AUTO_TRACES_ASPNETCORE_INSTRUMENTATION_CAPTURE_RESPONSE_HEADERS=respo_code,resp_status
Capture HTTP Request Header for ASP.NET
To capture the request headers of ASP.NET, use the following configuration along with other instrumentation configurations mentioned in the previous sections.
OTEL_DOTNET_AUTO_TRACES_ASPNET_INSTRUMENTATION_CAPTURE_REQUEST_HEADERS
You can configure one or more headers to be captured. If capturing multiple headers, separate them with commas. Based on the environment, add this additional configuration.
For example
OTEL_DOTNET_AUTO_TRACES_ASPNET_INSTRUMENTATION_CAPTURE_REQUEST_HEADERS=client_id,applicationid
Capture HTTP Response Header for ASP.NET
To capture the response headers of ASP.NE, use the following configuration along with other instrumentation configurations mentioned in the previous sections.
OTEL_DOTNET_AUTO_TRACES_ASPNET_INSTRUMENTATION_CAPTURE_RESPONSE_HEADERS
You can configure one or more headers to be captured. If capturing multiple headers, separate them with commas. Based on the environment, add this additional configuration.
For example
OTEL_DOTNET_AUTO_TRACES_ASPNET_INSTRUMENTATION_CAPTURE_RESPONSE_HEADERS=respo_code,resp_status
Capture HTTP Attributes for Web Forms and ASMX Applications
The .NET auto instrumentation doesn’t capture the HTTP attributes from the ASPX (Web Forms) and ASMX (SOAP Based Web services). You cannot get the HTTP URL, HTTP Status Code etc. To capture this, use a http enrichment module and add it to those specific applications. Please refer Capture HTTP Attributes for Web Forms Applications
Go Zero-code Instrumentation
Zero-code instrumentation for Go provides a way to instrument any Go application and capture telemetry data from many popular libraries and frameworks without any code changes.
Instrumenting Go applications for observability traditionally required manual code changes or the use of instrumentation libraries. However, with advancements in eBPF (extended Berkeley Packet Filter) technology, it's now possible to achieve zero-code automatic instrumentation. This guide mainly explores how to instrument Go applications using eBPF without modifying your application's source code.
eBPF is a powerful feature in modern Linux kernels that allows the execution of sandboxed programs within the kernel space. Initially designed for network monitoring, eBPF has evolved to support various observability tasks, including application tracing and monitoring. By leveraging eBPF, tools can dynamically instrument running applications, capturing essential telemetry data without requiring any code modifications.
Definitions and Acronyms
- Service - The discrete unit of a system that provides some functionality. It is an entity that is instrumented to collect telemetry data such as traces, metrics, and logs. It is typically defined by a unique name that helps to differentiate it from other services in a distributed system.
- Application - The logical name given to a group of services which work together to deliver a specific business functionality. An Application is essentially the top-level entity that encompasses multiple services that may be distributed, but they all contribute to the overall functioning of the application.
- Trace - A trace represents a single request handled by the application. This request can be an HTTP request, a batch job request, or a consumer processing a message from a messaging system like Kafka, Redis, etc.
- Span - A Span represents a unit or works for fulfilling the request. You can consider these as the steps involved in the application to complete a request. Multiple spans form a trace.
Pre-requisites for Auto-Instrumentation
- Due to how
eBPFworks only linux systems are supported.Autoinstrumentation doesn’t work for windows or MAC. Linuxenvironments with kernel version above4.4. To check your kernel version use the below command:
>> uname -r
6.8.0-57-generic
- Make sure the application to be instrumented uses a supported version of
go. As of 8th Apr 2025 the latest supported version isgo1.24hence the recommended go versions are>=go1.22. - The recommended processor architectures are
ARM64andAMD64. - Additionally, a user with
sudoprivileges is required to run the instrumentation binary on the host if the application is running on the host machine directly.
Supported Packages
Since Auto-Instrumentation using eBPF is a fairly new project, only a very limited and commonly used packages are supported namely:
Any http framework that relies on net/http will work as well(for ex: mux, gin). Also any database driver that implements the database/sql interface will be instrumented.
Implementation/Procedure
This section provides the detailed instructions for instrumenting Go services.
Running the Instrumentation Binary
All that is required to auto instrument a go application is to run the instrumentation alongside the application with elevated permissions (since it needs access to system level components) and configure it to point to the application binary and the exporter. We shall discuss three deployment options based on how your application is deployed and run.
Linux
This option is suitable if you are running your application on the host machine directly as a process by running the application binary.
- Download the instrumentation binary from here or get it from the Vunet team.
- Run your application as usual.
- Add the following environment variables: (To see list of all available configurations see here)
# Use grpc protocol while exporting traces
OTEL_EXPORTER_OTLP_PROTOCOL=grpc

# endpoint to which the spans are to be exported
OTEL_EXPORTER_OTLP_ENDPOINT=http://collector:4317

# path where the application binary is placed in the system
OTEL_GO_AUTO_TARGET_EXE=/go/payment_switch

# whether to include and parse sql statements for the database calls
OTEL_GO_AUTO_INCLUDE_DB_STATEMENT=true

# Sets whether to parse the SQL statement for trace data, setting       # db.operation.name. Only valid if OTEL_GO_AUTO_INCLUDE_DB_STATEMENT is # also set.
OTEL_GO_AUTO_PARSE_DB_STATEMENT=true

# name of the application
OTEL_SERVICE_NAME=payment_switch
OTEL_PROPAGATORS=tracecontext,baggage
- Finally, start the instrumentation binary:
sudo ./otel-go-instrumentation
We should now be able to see the spans being generated and being pushed to the collector configured. If the instrumentation binary is run before the application is started the instrumentation binary will wait for the application on start up.
Go Applications running on Linux using PM2
This option is suitable if you are running your application on the host machine directly as a process by running the application binary using PM2
You can run your application as usual using PM2. There is no need for application restart or any changes to the application.
Follow the below steps to run the auto instrumentation agent. This needs to be done per application.
- Download the instrumentation binary from here or get it from the Vunet team. Copy this to
<VUNET_HOME>/otel-go/directory - Create the systemd service file. Create a file called
/etc/systemd/system/\<service\_name\>-instrumentation.service with the following content
[Unit]
Description=Vunet Go Instrumentation for <SERVICE_NAME>
After=network.target

[Service]
Type=simple
User=root
WorkingDirectory=<VUNET_HOME>/otel-go
Environment="OTEL_GO_AUTO_TARGET_EXE=<application_binary_path>"
Environment="OTEL_EXPORTER_OTLP_PROTOCOL=http/protobuf"
Environment="OTEL_EXPORTER_OTLP_ENDPOINT=http://<vuSmartMaps_Server_IP>:4318"
Environment="OTEL_GO_AUTO_INCLUDE_DB_STATEMENT=true"
Environment="OTEL_GO_AUTO_PARSE_DB_STATEMENT=true"
Environment="OTEL_PROPAGATORS=tracecontext,baggage"
Environment="OTEL_RESOURCE_ATTRIBUTES=application=<APPLICATION_NAME>"
Environment="OTEL_SERVICE_NAME=<SERVICE_NAME>"
ExecStart=<VUNET_HOME>/otel-go/otel-go-instrumentation
Restart=always
RestartSec=5

[Install]
WantedBy=multi-user.target
Please change the <application_binary_path\, <vuSmartMaps_Server_IP>, <APPLICATIO_NAME\> and <SERVICE_NAME\> accordingly
<application_binary_path> can be identified by running the pm2 show command and look for script path
- Enable and start the instrumentation systemd service for the specific service
# Reload systemd to recognize the new service
sudo systemctl daemon-reload

# Enable to start on boot
sudo systemctl enable <service_name>-instrumentation

# Start the service
sudo systemctl start <service_name>-instrumentation

# Check status
sudo systemctl status <service_name>-instrumentation

# View logs
sudo journalctl -u <service_name>-instrumentation -f
We should now be able to see the spans being generated and being pushed to the collector configured. If the instrumentation binary is run before the application is started the instrumentation binary will wait for the application on start up.
Windows
Windows is not supported.
Docker
To instrument a Go application running on plain Docker, run the Go instrumentation agent using the below command.
docker run -d \
  --name vunet-otel-auto \
  --privileged \
  --pid=container:<container-name>  \
  -e OTEL_GO_AUTO_TARGET_EXE=<binary-path> \
  -e OTEL_RESOURCE_ATTRIBUTES=application=<app-name> \
  -e OTEL_SERVICE_NAME=<service-name> \
  -e OTEL_EXPORTER_OTLP_PROTOCOL=grpc \
  -e OTEL_EXPORTER_OTLP_ENDPOINT=http://<otel-collector-ip>:4317 \
  -e OTEL_GO_AUTO_INCLUDE_DB_STATEMENT=true \
  -e OTEL_GO_AUTO_PARSE_DB_STATEMENT=true \
  otel/autoinstrumentation-go
Please change the following information before running it.
- container-name - The container to be instrumented. Please use the docker ps command to find this out.
- binary-path - The binary path being executed by the container. Please use
docker exec <container> ls /proc/1/exe-lacommand to find this out - app-name - The application name to be used
- service-name - The service name to be used
- otel-collector-ip - The IP or Hostname of the OTel collector
Example:
command: docker ps
CONTAINER ID   IMAGE                       COMMAND                  CREATED         STATUS         PORTS                                         NAMES
0dd6f788231f   simple-http-server:latest   "/app/simple-http-se…"   9 minutes ago   Up 9 minutes   0.0.0.0:8090->8090/tcp, [::]:8090->8090/tcp   simple-http-app
Here simple-http-app is the container-name
command: docker exec <container> ls /proc/1/exe -la
ubuntu@rahjesh-vm:~$ docker exec keen_payne ls /proc/1/exe -la
lrwxrwxrwx    1 root     root             0 Feb 17 07:34 /proc/1/exe -> /app/simple-http-server
Here /app/simple-http-server is the binary-path
You can check the logs of the Go zero code instrumentation using docker logs vunet-otel-auto
Docker/Docker-Compose
Although not heavily used in production setups, docker-compose is one of the ways to run and orchestrate multi-layered applications. To instrument them, we shall run the instrumentation binary as a side car container to them.
- Add the below service to the docker-compose.yml file where you defined the application:
   go-auto:
    depends_on:
      - payment_switch
    image: otel/autoinstrumentation-go
    privileged: true
    pid: "host"
    volumes:
      - /proc:/host/proc
    environment:
      - OTEL_EXPORTER_OTLP_PROTOCOL=grpc
      - OTEL_EXPORTER_OTLP_ENDPOINT=http://collector:4317
      - OTEL_GO_AUTO_TARGET_EXE=/go/payment_switch
      - OTEL_GO_AUTO_INCLUDE_DB_STATEMENT=true
      - OTEL_GO_AUTO_PARSE_DB_STATEMENT=true
      - OTEL_SERVICE_NAME=payment_switch
  payment_switch:
    pid: "host"
    volumes:
      - /proc:/host/proc
    ...
- Save the file and run
docker-compose up
pid: “constainer:payment_switch” allows the instrumentation binary to access and interact with the processes running in the payment_switch container. And this is how the instrumentation binary gets access to the running application.
Configuration
TLS Configuration
This section explains the additional configurations that needed for sending the traces from Go applications when the TLS is enabled on the OTel Collector
Kubernetes Zero-code Instrumentation
An implementation of a Kubernetes Operator called Open telemetry Operator that manages collectors and auto-instrumentation of the workload using OpenTelemetry instrumentation libraries.
Definitions and Acronyms
- Kubernetes Operator - Operators are software extensions to Kubernetes that make use of custom resources to manage applications and their components.
- Service - The discrete unit of a system that provides some functionality. It is an entity that is instrumented to collect telemetry data such as traces, metrics, and logs. It is typically defined by a unique name that helps to differentiate it from other services in a distributed system.
- Application - The logical name given to a group of services which work together to deliver a specific business functionality. An Application is essentially the top-level entity that encompasses multiple services that may be distributed, but they all contribute to the overall functioning of the application.
- Trace - A trace represents a single request handled by the application. This request can be an HTTP request, a batch job request, or a consumer processing a message from a messaging system like Kafka, Redis, etc.
- Span - A Span represents a unit or works for fulfilling the request. You can consider these as the steps involved in the application to complete a request. Multiple spans form a trace.
Prerequisites
Opentelemetry Operator Deployment
vuTraces Exporter Endpoint
Implementation/Procedure
This section provides the detailed instructions for instrumenting Java, .NET, Go and Python applications running in Kubernetes without any code changes.
Steps for Instrumentation
The following steps should be followed.
- Install the Open Telemetry Operator
- Install the vuTraces Auto Instrumentation CRD
- Add the required annotations to the workload based on the programming languages
- Configure the application name
- Configure the HTTP Headers to be captured, if required
Step 1: Install OTel Operator Instrumentation CRD
Using Helm
The detailed instructions for all these steps are shown below.
- Download the OpenTelemetry Operator helm chart from here and install it using the command below
Please make sure that you mention the correct namespace instead of <namespace to be used for operator\
helm install opentelemetry-operator opentelemetry-operator-0.71.0.tgz \
  --namespace <namespace to be used for operator> \
  --create-namespace \
  --set "manager.collectorImage.repository=otel/opentelemetry-collector-k8s" \
  --set admissionWebhooks.certManager.enabled=false \
  --set admissionWebhooks.autoGenerateCert.enabled=true
- Download the vuTraces auto instrumentation helm chart from here and install it
helm install vutraces-auto-instrumentation vutraces-auto-instrumentation-1.0.0.tgz \
  --namespace <namespace to be used for Instrumentation CRD> \
  --create-namespace \
  --set vutracesexporter.endpoint="http://<vuSmartMaps_server:4317"
Please make sure that you mention the correct namespace instead of <namespace to be used for Instrumentation CRD>
Using Manifest YAML

The complete package is available at K8s Manifest Package
- Ensure cert-manager is installed in the cluster (required by OpenTelemetry Operator). If it’s not already installed, follow the official installation instructions. Otherwise, use this cert-manager manifest.
- Install the Open Telemetry Operator using this manifest.
- Download the manifest of the vuTraces auto instrumentation CRD from here. Modify the following in the manifest to match your environment, and install it
- namespace - It is recommended to use the application’s namespace.
- Change the value of the environment variable OTEL_EXPORTER_OTLP_ENDPOINT to point to Vunet’s Traces ingestion endpoint.
- For Java, use the port 4317
- For .NET, use the port 4318
Step 2: Annotate the Workloads
- Add the following annotation to your deployments.
- Java workloads
  annotations:
        instrumentation.opentelemetry.io/inject-java: "<namespace of the Instrumentation CRD>/vutraces-auto-instrumentation"
- .NET workloads
  annotations:
        instrumentation.opentelemetry.io/inject-dotnet: "<namespace of the Instrumentation CRD>/vutraces-auto-instrumentation"
- Go workloads
  annotations:
        instrumentation.opentelemetry.io/inject-go: "<namespace of the Instrumentation CRD>/vutraces-auto-instrumentation"
- Python workloads
  annotations:
        instrumentation.opentelemetry.io/inject-python: "<namespace of the Instrumentation CRD>/vutraces-auto-instrumentation"
By default, the annotation defined above works for applications running under glibc-based Python images. If you are using a musl-based Python image for your application, add the below annotation as well.
instrumentation.opentelemetry.io/otel-python-platform: "musl"
- Node.js workloads
  annotations:
        instrumentation.opentelemetry.io/inject-nodejs: "<namespace of the Instrumentation CRD>/vutraces-auto-instrumentation"
- If you have a limited number of deployments in your cluster, modify your application Helm charts or k8s manifests. In the deployment, add the annotation in spec -> template -> metadata
- If you have many deployments and it is not possible to manually update them, then do some automation. One such automation script (for .NET workload) is available here. Please use this as a reference and create an automation script that works for your environment.
- The annotations can also be added to the namespace
- If there are multiple containers in the pod, then add the below annotation too
  annotations:
        instrumentation.opentelemetry.io/container-names: <name of the application container>
Step 3: Configure Application Name
- Add the following environment variable in the deployment to set the application name.
name: OTEL_RESOURCE_ATTRIBUTES
        value: "application=<app_name>"
Step 4: Capture HTTP Headers
- Add the following environment variable in the deployment to configure the HTTP Headers to be captured
- Java Workloads
- Capture HTTP Request Header for HTTP Server
- Java Workloads
name: OTEL_INSTRUMENTATION_HTTP_SERVER_CAPTURE_REQUEST_HEADERS
        value: "Header1,Header2"
- Capture HTTP Response Header for HTTP Server
name: OTEL_INSTRUMENTATION_HTTP_SERVER_CAPTURE_RESPONSE_HEADERS
        value: "Header3,Header4"
- Capture HTTP Request Header for HTTP Client
name: OTEL_INSTRUMENTATION_HTTP_CLIENT_CAPTURE_REQUEST_HEADERS
        value: "Header5,Header6"
- Capture HTTP Response Header for HTTP Client
name: OTEL_INSTRUMENTATION_HTTP_SERVER_CAPTURE_REQUEST_HEADERS
        value: "Header7,Header8"
-
.NETWorkloads
- Capture HTTP Request Header for ASP.NET Core
name: OTEL_DOTNET_AUTO_TRACES_ASPNETCORE_INSTRUMENTATION_CAPTURE_REQUEST_HEADER
        value: "Header1,Header2"
- Capture HTTP Response Header for ASP.NET Core
name: OTEL_DOTNET_AUTO_TRACES_ASPNETCORE_INSTRUMENTATION_CAPTURE_RESPONSE_HEADERS
        value: "Header3,Header4"
- Capture HTTP Request Header for ASP.NET
name:OTEL_DOTNET_AUTO_TRACES_ASPNET_INSTRUMENTATION_CAPTURE_REQUEST_HEADERS
        value: "Header5,Header6"
- Capture HTTP Response Header for ASP.NET
name: OTEL_DOTNET_AUTO_TRACES_ASPNET_INSTRUMENTATION_CAPTURE_RESPONSE_HEADERS
        value: "Header7,Header8
Steps for Uninstalling the Instrumentation
The following steps should be followed.
- Remove the annotations added
- Remove the environment variables added
- Uninstall the vuTraces Auto Instrumentation CRD
Run the following command to uninstall the vuTraces Auto Instrumentation CRD.
helm uninstall vutraces-auto-instrumentation --namespace <namespace of the Instrumentation CRD>
- Uninstall the Open Telemetry Operator
Run the following command to uninstall the Opentelemetry Operator
helm uninstall opentelemetry-operator --namespace <namespace of the Operator>
Appendix
Offline Install
Sample Manifest Files for Reference
Here are the sample manifest YAM files for your reference. You can see specific examples.
A sample K8s Manifests for Java Application
A sample yaml file for a java workload is available here.
A sample K8s Manifests for Java Application with Multiple Containers within a pod
A sample yaml file for a java workload is available here.
A sample K8s Manifests for .NETApplication
A sample yaml file for a java workload is available here.
Node.js Zero-code Instrumentation
Use the OpenTelemetry Node.js Automatic Instrumentation to send traces and metrics from node.js applications and services to observability backends without having to modify their source code.
Definitions and Acronyms
- Service - The discrete unit of a system that provides some functionality. It is an entity that is instrumented to collect telemetry data such as traces, metrics, and logs. It is typically defined by a unique name that helps to differentiate it from other services in a distributed system.
- Application - The logical name given to a group of services which work together to deliver a specific business functionality. An Application is essentially the top-level entity that encompasses multiple services that may be distributed, but they all contribute to the overall functioning of the application.
- Trace - A trace represents a single request handled by the application. This request can be an HTTP request, a batch job request, or a consumer processing a message from a messaging system like Kafka, Redis, etc.
- Span - A Span represents a unit or works for fulfilling the request. You can consider these as the steps involved in the application to complete a request. Multiple spans form a trace.
Supported libraries
Below is the list of supported libraries by the instrumentation procedure explained in the document. The spans are created for the code that uses these libraries.
- amqplib>=0.5.5 <1
- aws-lambda
- aws-sdk/client-*>=3.0.0 <4
- bunyan>=1.0.0 <2
- cassandra-driver>=4.4.0 <5
- connect>=3.0.0 <4
- cucumber>=8.0.0 <11
- dataloader>=2.0.0 <3
- dns `nodejs>=14.10`
- express>=4.0.0 <5
- generic-pool>=2.0.0 <4
- graphql>=14.0.0 <17
- grpc^1.0.0
- hapi>=17.0.0 <22
- http `nodejs>=14.10`
- ioredis>=2.0.0 <6
- kafkajs>=0.3.0 <3
- knex>=0.10.0 <4
- koa>=2.0.0 <3,@koa/router>=8.0.0
- lru-memoizer>=1.3.0 <3
- memcached>=2.2.0 <3
- mongodb>=3.3.0 <7
- mongoose>=5.9.7 <9
- mysql>=2.0.0 <3
- mysql2>=1.4.2 <4
- nestjs-core>=4.0.0 <12
- net `nodejs>=14)
- oracledb>=6.7.0 <7
- pg>=8.0.3 <9, pg-pool>=2.0.0 <4
- pino>=5.14.0 <10
- redis>=2.6.0 <4
- restify `nodejs>=14.10`
- runtime-node `nodejs>=14.10`
- socket.io>=2.0.0 <5
- undici>=5.12.0
- winston>=1.0.0 <4
Implementation/Procedure
This section provides the detailed instructions for instrumenting node.js services. Zero-code instrumentation for JavaScript provides a way to instrument any Node.js application and capture telemetry data from many popular libraries and frameworks without any code changes.
Instrumentation Procedure
Instrumentation for Node.js requires the installation of a couple of opentelemetry libraries as dependencies in the application regardless of the environment in which they are run. Along with this we can configure the instrumentation through environment variables. We shall explain the steps to achieve them and various options available below:
Instrumenting Node.js applications (TypeScript and JavaScript) run using node command
Follow the below steps to instrument Node.js application developed using TypeScript and run locally using node command.
Step1 - Install the Opentelemetry dependencies
Go to the application code and run the following command.
npm install --save @opentelemetry/api
npm install --save @opentelemetry/auto-instrumentations-node
save options saves the installed dependencies to package.json file automatically. After running the command you should see this change in package.json.
    "@opentelemetry/api": "^1.9.0",
    "@opentelemetry/auto-instrumentations-node": "^0.57.1",
    …
  }
If the environment doesn’t have access to the internet to install the packages, use the provided tar files of the packages and place them in the same directory as package.json. Once done edit the package.json to include the below two lines in the dependencies section and run npm install --offline.
    "@opentelemetry/api": "file:./api-1.9.0.tgz",
    "@opentelemetry/auto-instrumentations-node": "file:./auto-instrumentations-node-0.59.0.tgz",
    ...
  }
Step2 - Configure the Instrumentation
Set the following environment variables
export OTEL_EXPORTER_OTLP_PROTOCOL=grpc
export OTEL_EXPORTER_OTLP_ENDPOINT=<TRACES_INGESTION_ENDPOINT>
export OTEL_RESOURCE_ATTRIBUTES=application=<APPLICATION_NAME>
export OTEL_SERVICE_NAME=<SERVICE_NAME>
export OTEL_METRICS_EXPORTER=none
Please change the values of <TRACES_INGESTION_ENDPOINT>, <APPLICATION_NAME> and <SERVICE_NAME\>
Step3 - Register the Instrumentation
Register the auto instrumentation by setting the following environment variable
export NODE_OPTIONS="--require @opentelemetry/auto-instrumentations-node/register"
Step4 - Run the application
Run the Node.js application as usual. You will get the traces data in the vuSmartMaps.
Remove Instrumentation
To remove the instrumentation, unset the environment variables set for instrumentation
unset OTEL_EXPORTER_OTLP_PROTOCOL
unset OTEL_EXPORTER_OTLP_ENDPOINT
unset OTEL_RESOURCE_ATTRIBUTES
unset OTEL_SERVICE_NAME
unset OTEL_METRICS_EXPORTER
unset NODE_OPTIONS
Instrumenting Node.js applications (TypeScript and JavaScript) run using PM2
Follow the below steps to instrument Node.js application developed using TypeScript and run using PM2
Step1 - Install the Opentelemetry dependencies
Go to the application code and run the following command.
npm install --save @opentelemetry/api
npm install --save @opentelemetry/auto-instrumentations-node
save options saves the installed dependencies to package.json file automatically. After running the command you should see this change in package.json.
"dependencies": {
    "@opentelemetry/api": "^1.9.0",
    "@opentelemetry/auto-instrumentations-node": "^0.57.1",
    …
  }
If the environment doesn’t have access to the internet to install the packages, use the provided tar files of the packages and place them in the same directory as package.json. Once done edit the package.json to include the below two lines in the dependencies section and run npm install --offline.
    "@opentelemetry/api": "file:./api-1.9.0.tgz",
    "@opentelemetry/auto-instrumentations-node": "file:./auto-instrumentations-node-0.59.0.tgz",
    ...
  }
Step2 - Stop the Service
Stop and delete the Node.js service using PM2
pm2 stop <name of service>
pm2 delete <name of service>
Step3 - Configure the Instrumentation
Right now, you may be using the command pm2 start app.js --name "name of service" to start the Node.js service. Instead, you need to use pm2 start ecosystem.config.js
Create a file called “ecosystem.config.js” in your app folder with the following content.
module.exports = {
  apps: [
    {
      name: "<name of service>",
      script: "app.js",
      env: {
        OTEL_TRACES_EXPORTER: "otlp",
        OTEL_EXPORTER_OTLP_PROTOCOL: "grpc",
        OTEL_EXPORTER_OTLP_ENDPOINT: "<TRACES_INGESTION_ENDPOINT>",
        OTEL_RESOURCE_ATTRIBUTES: "application=<APPLICATION_NAME>",
        OTEL_SERVICE_NAME: "<SERVICE_NAME>",
        OTEL_METRICS_EXPORTER: "none",
        NODE_OPTIONS: "--require @opentelemetry/auto-instrumentations-node/register"
      }
    }
  ]
}
Please make sure you use the correct name and script.
name - Name of the service
script - Node.js script name like app.js
Please change the values of <TRACES_INGESTION_ENDPOINT>, <APPLICATION_NAME> and <SERVICE_NAME
Verify the environment variables using the below command to confirm all are set correct.
pm2 env <id> | grep OTEL
Step4 - Start the application
Restart the Node.js application as usual using PM2.
For example
pm2 start ecosystem.config.js
You will get the traces data in the vuSmartMaps.
From now on, you can restart the service using the below command
pm2 restart ecosystem.config.js
Alternatively, if you modify any environment variables later, use
pm2 restart <name of service> --update-env
This ensures that PM2 reloads the latest environment settings.
Removing Instrumentation
To remove OpenTelemetry instrumentation and revert to a normal PM2 setup,
-
Delete the ecosystem.config.js file
-
Revert to direct PM2 startup
pm2 delete <name of service>
pm2 start app.js --name "<name of service>"
Instrumenting Node.js applications (TypeScript and JavaScript) running in Docker
Follow the below steps to instrument Node.js application developed using TypeScript running in Docker
Step1 - Modify the Dockerfile
Modify the Dockerfile and include the following lines. This is used to install the Open telemetry APIs and enable the auto instrumentation
RUN npm install @opentelemetry/api @opentelemetry/auto-instrumentations-node

# --- Enable auto-instrumentation for all Node modules ---
ENV NODE_OPTIONS="--require @opentelemetry/auto-instrumentations-node/register"
Step2 - Build the Docker image
Once the above mentioned changes are done in Dockerfile, build the docker image, as usual
Step3 - Run the application with additional envs
RUn the docker image of the application with the following environment variables
-e OTEL_EXPORTER_OTLP_PROTOCOL=grpc
-e OTEL_EXPORTER_OTLP_ENDPOINT=<TRACES_INGESTION_ENDPOINT>
-e OTEL_SERVICE_NAME=<SERVICE_NAME>
-e OTEL_RESOURCE_ATTRIBUTES=application=<APPLICATION_NAME>
-e OTEL_METRICS_EXPORTER=none
Please change the values of <TRACES_INGESTION_ENDPOINT>, <APPLICATION_NAME> and <SERVICE_NAME>
Important Note: <TRACES_INGESTION_ENDPOINT> must be reachable from inside the Docker container.
Remove Instrumentation
To remove the instrumentation, rebuild the docker image by removing the following lines from the Dockerfile and run the docker image without the environment variable mentioned above.
RUN npm install @opentelemetry/api @opentelemetry/auto-instrumentations-node

# --- Enable auto-instrumentation for all Node modules ---
ENV NODE_OPTIONS="--require @opentelemetry/auto-instrumentations-node/register"
Python Zero-code Instrumentation
Use the OpenTelemetry Python Automatic Instrumentation to send traces and metrics from python applications and services to observability backends without having to modify their source code.
Definitions and Acronyms
- Service - The discrete unit of a system that provides some functionality. It is an entity that is instrumented to collect telemetry data such as traces, metrics, and logs. It is typically defined by a unique name that helps to differentiate it from other services in a distributed system.
- Application - The logical name given to a group of services which work together to deliver a specific business functionality. An Application is essentially the top-level entity that encompasses multiple services that may be distributed, but they all contribute to the overall functioning of the application.
- Trace - A trace represents a single request handled by the application. This request can be an HTTP request, a batch job request, or a consumer processing a message from a messaging system like Kafka, Redis, etc.
- Span - A Span represents a unit or works for fulfilling the request. You can consider these as the steps involved in the application to complete a request. Multiple spans form a trace.
Supported Libraries
Below is the list of python libraries supported by the instrumentation procedure defined below
- aio_pika >= 7.2.0, < 10.0.0
- aiohttp ~= 3.0
- aiohttp ~= 3.0
- aiokafka >= 0.8, < 1.0
- aiopg >= 0.13.0, < 2.0.0
- asgiref ~= 3.0
- asyncclick ~= 8.0
- asyncio
- asyncpg >= 0.12.0
- aws_lambda
- boto~=2.0
- boto3 ~= 1.0
- botocore ~= 1.0
- cassandra-driver ~= 3.25,scylla-driver ~= 3.25
- celery >= 4.0, < 6.0
- click >= 8.1.3, < 9.0.0
- confluent-kafka >= 1.8.2, <= 2.7.0
- dbapi
- django >= 1.10
- elasticsearch >= 6.0
- falcon >= 1.4.1, < 5.0.0
- fastapi ~= 0.92
- flask >= 1.0
- grpcio >= 1.42.0
- httpx >= 0.18.0
- jinja2 >= 2.7, < 4.0
- kafka-python >= 2.0, < 3.0,kafka-python-ng >= 2.0, < 3.0
- logging
- mysql-connector-python >= 8.0, < 10.0
- mysqlclient < 3
- pika >= 0.12.0
- psycopg >= 3.1.0
- psycopg2 >= 2.7.3.1,psycopg2-binary >= 2.7.3.1
- pymemcache >= 1.3.5, < 5
- pymongo >= 3.1, < 5.0
- pymssql >= 2.1.5, < 3
- PyMySQL < 2
- pyramid >= 1.7
- redis >= 2.6
- remoulade >= 0.50
- requests ~= 2.0
- sqlalchemy >= 1.0.0, < 2.1.0
- sqlite3
- starlette >= 0.13
- psutil >= 5
- threading
- tornado >= 5.1.1
- tortoise-orm >= 0.17.0
- urllib
- urllib3 >= 1.0.0, < 3.0.0
- wsgi
Implementation/Procedure
This section provides the detailed instructions for instrumenting python services. Zero-code instrumentation for python provides a way to instrument any Python application and capture telemetry data from many popular libraries and frameworks without any code changes.
Instrumentation Procedure
Instrumentation for Python requires the installation of a couple of opentelemetry libraries as dependencies in the application regardless of the environment in which they are run. Along with this we can configure the instrumentation through environment variables. We shall explain the steps to achieve them and various options available below:
Installing dependencies
The following two libraries are required to be installed as dependencies either by using the .whl file provided or directly from the pip repository if connected to the internet.
pip install opentelemetry-distro
# pip install opentelemetry_distro-0.54b0-py3-none-any.whl
Additional optional packages (based on your exporters and protocols):
pip install opentelemetry-exporter-otlp
# pip install opentelemetry_exporter_otlp-1.33.0-py3-none-any.whl

pip install opentelemetry-instrumentation
# pip install opentelemetry_instrumentation-0.54b0-py3-none-any.whl
Package details:
- opentelemetry-distro: Sets up OpenTelemetry with sensible defaults and zero-code instrumentation.
- opentelemetry-exporter-otlp: Allows exporting telemetry data to the OpenTelemetry Collector.
- opentelemetry-instrumentation: Provides auto-instrumentation for various popular Python libraries.
Configuring the instrumentation
All configurations are done through environment variables as with other languages. Below are some of the mandatory and important envs to be added:
OTEL_TRACES_EXPORTER
The type of exporter to use for sending the generated traces. Possible values include otlp, console and zipkin. Since we use the OTEL collector to capture the traces, the value must be set to otlp.
OTEL_EXPORTER_OTLP_TRACES_ENDPOINT
The endpoint where the OTEL collector is running. For example: http://localhost:4317, http://otel-collector:4318 etc.. As a convention usually port 4317 is configured on grpc protocol and 4318 for http protocol in the OTEL collector. Select the port accordingly. In most cases, unless specified, the default port is 4317 with grpc.
OTEL_SERVICE_NAME
The name of the service being instrumented. This value will be used and saved in the generated traces under the field resource_attributes_service_name.
OTEL_PYTHON_DISABLED_INSTRUMENTATIONS
Comma-separated list of libraries to disable auto-instrumentation. By default all libraries supported and available in the environment will be instrumented.
Running the application
After the above steps are completed, run the application using the below command:
opentelemetry-instrument python app.py
where app.py is assumed to be the entrypoint for the application, but change this accordingly for your application. For gunicorn-based apps:
opentelemetry-instrument gunicorn app:app
Zero Code Instrumentation Apache HTTP Server on Windows
Apache HTTP Server is one of the most widely deployed web servers in the world. It handles incoming HTTP/HTTPS requests and serves web content or proxies requests to backend application services. Zero-code instrumentation means no changes are needed to your application source code. The module hooks into Apache's request processing pipeline automatically once it is deployed and configured.
Definitions and Acronyms
| Term | Definition |
|---|---|
| Apache HTTP Server | Open-source web server software that receives and responds to HTTP/HTTPS requests. |
| Module (.so file) | A dynamically loadable plugin that extends Apache's built-in functionality. |
| OTel / OpenTelemetry | An open-source observability framework for collecting traces, metrics, and logs. |
| Collector | A service that receives, processes, and forwards telemetry data (e.g., to a monitoring platform). |
| Trace | A record of a single request as it travels through a system, composed of one or more spans. |
| Span | A named unit of work within a trace, e.g., a single HTTP request handled by Apache. |
| DLL | Dynamic Link Library — a Windows binary that contains code shared by multiple programs. |
| OTLP | OpenTelemetry Protocol — the standard wire format used to transmit telemetry data. |
| vcpkg | A C++ library manager used to build and supply the DLL dependencies required by the module. |
| httpd.conf | The main Apache configuration file that controls how Apache behaves. |
| otel.ini | A configuration file read by mod_otel_win that specifies the OTel Collector endpoint and service name. |
Support Matrix
Apache / mod_otel_win
Supported Apache HTTP Server Versions:
- Apache HTTP Server 2.4.x (verified on 2.6.66)
Supported Installation Types:
-
XAMPP-based Apache installation (e.g., C:\xampp\apache)
-
Standalone Apache HTTP Server installation (e.g., C:\Apache24)
Supported Operating Systems:
-
Windows 11 (64-bit)
-
Windows Server 2019 Datacenter (64-bit)
Supported Export Protocols:
- OTLP/HTTP (port 4318)
Windows 32-bit (x86) is not supported. Only 64-bit Windows installations are supported.
Pre-requisites for Instrumentation
In addition to the supported environment listed above, the following prerequisites must be satisfied before beginning the instrumentation procedure.
Operating System
-
64-bit Windows (Windows 11, Windows Server 2019)
-
Administrator account access — you must be able to run commands as Administrator
Apache HTTP Server
-
Apache HTTP Server 2.4.x must already be installed and able to start
-
The Apache configuration file httpd.conf must be editable (not locked by a system policy)
-
The modules\ directory inside your Apache installation must be writable
Files Required — Obtain from VuNet Team
-
mod_otel_win.so — the compiled Apache module
-
libprotobuf.dll, libcurl.dll, zlib1.dll, abseil_dll.dll — runtime dependency DLLs
Network
- Port 4318 must be open outbound from the Apache server to the OpenTelemetry Collector IP/hostname
What Must Be True Before You Begin
-
Apache starts successfully without errors when launched manually.
-
Running httpd.exe -t from a command prompt returns Syntax OK.
-
You have received the module file and DLL files from the VuNet team.
-
You know the IP address or hostname of your OpenTelemetry Collector.
Finding Your Apache Installation
Before proceeding, you need to know where Apache is installed on this machine. Run the commands in this section from a Command Prompt. Open one by pressing Windows + R, typing cmd, and pressing Enter.
Is Apache Running Right Now?
Run the following command to see if Apache is already running as a process:
tasklist /FI "IMAGENAME eq httpd.exe"
If Apache is running you will see output similar to:
Image Name       PID     Session Name  Session#  Mem Usage
httpd.exe        3456    Services         0      12,345 K
If you see "No tasks are running", Apache is not currently running. That is fine — you can still follow this guide.
Find the Apache Executable Path
Run the command below to find where httpd.exe lives on disk:
where httpd.exe
Example output:
C:\xampp\apache\bin\httpd.exe
If that command returns nothing, try these alternative commands:
dir /s /b C:\xampp\apache\bin\httpd.exe 2>nul
dir /s /b C:\Apache24\bin\httpd.exe 2>nul
dir /s /b C:\Apache2\bin\httpd.exe 2>nul
dir /s /b "C:\Program Files\Apache*\bin\httpd.exe" 2>nul
Once you have found httpd.exe, the folder one level above bin\ is your Apache Home. For example, if httpd.exe is at C:\xampp\apache\bin\httpd.exe, then your Apache Home is C:\xampp\apache.
Identify Your Key Directories
Based on the Apache Home you identified above, your key directories will be:
| Directory Name | XAMPP Example | Standalone Example |
|---|---|---|
| Apache Home | C:\xampp\apache | C:\Apache24 |
| Modules Directory | C:\xampp\apache\modules | C:\Apache24\modules |
| Bin Directory | C:\xampp\apache\bin | C:\Apache24\bin |
| Config Directory | C:\xampp\apache\conf | C:\Apache24\conf |
| Config File | C:\xampp\apache\conf\httpd.conf | C:\Apache24\conf\httpd.conf |
Write down your Apache Home path now. You will substitute it for <apache_home> in every command throughout this document.
Implementation
Follow the steps below in order. All commands should be run from a Command Prompt opened as Administrator. To open an Administrator Command Prompt: click the Start menu, type cmd, right-click "Command Prompt", and choose "Run as administrator".
Pre-Implementation Safety Step (Backup Existing Files)
Before making any changes to your Apache installation, it is strongly recommended to take a backup of the existing configuration and binaries. This ensures you can safely revert to the previous working state if needed.
Create a Backup Folder
Create a backup directory inside your Apache Home:
mkdir "<apache_home>\backup_pre_otel"
Backup Configuration File
copy "<apache_home>\conf\httpd.conf" "<apache_home>\backup_pre_otel\httpd.conf.bak"
Backup Existing Module (if present)
copy "<apache_home>\modules\mod_otel_win.so" "<apache_home>\backup_pre_otel\" 2>nul
Backup Existing DLLs (if they already exist)
copy "<apache_home>\bin\libprotobuf.dll" "<apache_home>\backup_pre_otel\" 2>nul
copy "<apache_home>\bin\libcurl.dll"     "<apache_home>\backup_pre_otel\" 2>nul
copy "<apache_home>\bin\zlib1.dll"       "<apache_home>\backup_pre_otel\" 2>nul
copy "<apache_home>\bin\abseil_dll.dll"  "<apache_home>\backup_pre_otel\" 2>nul
The 2>nul ensures the command does not throw errors if files do not already exist.
Verify Backup
dir "<apache_home>\backup_pre_otel"
Ensure all critical files are present before proceeding.
Step 1 – Deploy the Module File
- Copy the compiled module file mod_otel_win.so that you received from the VuNet team into the Apache modules directory.
Replace <apache_home> with your actual Apache Home path before running:
copy "<path_to_mod_otel_win.so>" "<apache_home>\modules\mod_otel_win.so"
- Example for a XAMPP installation — assuming the file was saved to your Desktop:
copy "%USERPROFILE%\Desktop\mod_otel_win.so" "C:\xampp\apache\modules\mod_otel_win.so"
- Verify the file was copied successfully:
dir C:\xampp\apache\modules\mod_otel_win.so
- You should see the file listed with a non-zero file size. If you see "File Not Found", the copy failed — check that you used the correct path.
Step 2 – Copy Runtime DLL Dependencies
The module requires four additional DLL files to work. These DLLs must be placed in Apache's bin directory so that Apache can find them when it loads the module.
- Copy all four files (provided by the VuNet team) into your Apache bin directory:
copy "<path_to_dlls>\libprotobuf.dll" "<apache_home>\bin\"
copy "<path_to_dlls>\libcurl.dll"     "<apache_home>\bin\"
copy "<path_to_dlls>\zlib1.dll"        "<apache_home>\bin\"
copy "<path_to_dlls>\abseil_dll.dll"   "<apache_home>\bin\"
Example for a XAMPP installation — assuming the DLLs are in a folder on your Desktop called "dlls":
copy "%USERPROFILE%\Desktop\dlls\libprotobuf.dll" "C:\xampp\apache\bin\"
copy "%USERPROFILE%\Desktop\dlls\libcurl.dll"     "C:\xampp\apache\bin\"
copy "%USERPROFILE%\Desktop\dlls\zlib1.dll"        "C:\xampp\apache\bin\"
copy "%USERPROFILE%\Desktop\dlls\abseil_dll.dll"   "C:\xampp\apache\bin\"
- Confirm all four DLLs are present:
dir "<apache_home>\bin\" | findstr /i "libprotobuf libcurl zlib1 abseil"
All four DLLs must be present before starting Apache. If any one of them is missing, Apache will fail to start and you will see an error about a missing DLL.
Step 3 – Edit the Apache Configuration File
Apache's main configuration file, httpd.conf, controls which modules Apache loads and how it behaves. You need to add three lines to it.
Open httpd.conf in Notepad
Open the file using Notepad. Replace <apache_home> with your actual path:
notepad "<apache_home>\conf\httpd.conf"
For a XAMPP installation:
notepad "C:\xampp\apache\conf\httpd.conf"
Load the Module
Search for other lines beginning with LoadModule. After the last LoadModule line, add:
LoadModule otel_win_module modules/mod_otel_win.so
Save the file (Ctrl+S) and close Notepad.
Step 4 – Create the OpenTelemetry Configuration File
The module reads a file called otel.ini from Apache's conf directory. This file tells the module where to send trace data and what to name this service.
Create the file using Notepad:
notepad "<apache_home>\conf\otel.ini"
Notepad will tell you the file does not exist and ask if you want to create it. Click Yes.
Paste the following content into the file. Replace the endpoint value with the actual IP address or hostname of your OpenTelemetry Collector, and replace the service_name value with a meaningful name for this Apache instance:
[otel]
endpoint=http://<otel_collector_ip>:4318
service_name=<your_service_name>
Example:
[otel]
endpoint=http://10.1.92.19:4318
service_name=windows-apache-httpd
| Parameter | Description |
|---|---|
| endpoint | Full URL of the OpenTelemetry Collector's OTLP HTTP endpoint. Port 4318 is the default OTLP/HTTP port. |
| service_name | A human-readable label for this Apache instance. Used to identify this service in your tracing dashboard. |
Save the file (Ctrl+S) and close Notepad.
Step 5 – Start and Validate Apache
Validate the Configuration
Before starting Apache, test that your configuration file has no syntax errors. Run the following from an Administrator Command Prompt:
"<apache_home>\bin\httpd.exe" -t
For a XAMPP installation:
"C:\xampp\apache\bin\httpd.exe" -t
Expected output:
Syntax OK
If you see any error other than "Syntax OK", do not proceed. Read the error message carefully — it will tell you exactly which line in httpd.conf has a problem. The most common causes are a typo in the LoadModule line or the module file not being present in the modules directory.
Start Apache
Once the configuration validates, start Apache:
"<apache_home>\bin\httpd.exe"
Apache will start in the foreground. You will see log output in the console window. Leave this window open while testing. If Apache exits immediately, check the error output for missing DLL messages.
Testing the Setup
Open a second Command Prompt (it does not need to be Administrator) and run the following tests. Apache must be running in the first window.
Basic HTTP Request Test
Send a simple HTTP request to Apache and confirm it responds:
curl.exe -v http://localhost:8080/
Expected result: You should see HTTP/1.1 200 OK in the output (or a 403/404 depending on your document root configuration — any HTTP response confirms Apache is running and receiving requests).
If curl.exe is not found, it is available by default on Windows 10 1803 and above. You can also download it from https://curl.se/windows/ and place curl.exe in any folder in your PATH.
Confirm Spans Arriving at the Collector
If your OpenTelemetry Collector is configured to log received data, you should see spans being received after each test request above. Each span will include attributes similar to:
| Attribute | Expected Value |
|---|---|
| service.name | The value you set in otel.ini |
| http.method | GET |
| http.target | / |
| http.status_code | 200 |
Configuration Reference
otel.ini Parameters
| Parameter | Required | Description | Example Value |
|---|---|---|---|
| endpoint | Yes | Full URL of the OTel Collector OTLP/HTTP endpoint. | http://10.1.92.19:4318 |
| service_name | Yes | Human-readable name for this Apache instance shown in traces. | windows-apache-httpd |
httpd.conf Additions Summary
| # Load the OpenTelemetry instrumentation module |
|---|
| LoadModule otel_win_module modules/mod_otel_win.so |
| # Log level - set to 'warn' in production after verification |
| LogLevel debug |
Required Files Checklist
| File | Location | Purpose |
|---|---|---|
| mod_otel_win.so | <apache_home>\modules\ | The Apache instrumentation module |
| libprotobuf.dll | <apache_home>\bin\ | Protocol Buffers serialization library |
| libcurl.dll | <apache_home>\bin\ | HTTP client library for exporting spans |
| zlib1.dll | <apache_home>\bin\ | Compression library |
| abseil_dll.dll | <apache_home>\bin\ | Abseil C++ utility library |
| otel.ini | <apache_home>\conf\ | OTel module configuration (endpoint, service name) |
| httpd.conf | <apache_home>\conf\ | Apache main configuration file |
Notes and Recommendations
-
Once you have verified spans are reaching the collector, change LogLevel debug to LogLevel warn in httpd.conf to reduce log verbosity in production.
-
Ensure your Apache version is compatible with the compiled module. If you upgrade Apache, the module may need to be recompiled.
-
Verify all four DLL files are present in the bin directory after any system patching or reinstallation of Apache.
-
If Apache fails to start after following this guide, check the Apache error log at <apache_home>\logs\error.log for detailed error messages.
Viewing the Apache Error Log
If something is not working correctly, the Apache error log is the first place to look:
type "<apache_home>\logs\error.log"
To follow the log in real time as new entries are written, use PowerShell:
Get-Content -Wait "<apache_home>\logs\error.log"
Rollback Procedure
If Apache fails to start after instrumentation or if you need to revert the changes, follow the steps below to restore the previous working state.
Step 1 – Stop Apache
If Apache is running, stop it:
taskkill /IM httpd.exe /F
Step 2 – Restore Configuration File
Restore the original httpd.conf from backup:
copy /Y "<apache_home>\backup_pre_otel\httpd.conf.bak" "<apache_home>\conf\httpd.conf"
Step 3 – Remove OpenTelemetry Module
Delete the deployed module file:
del "<apache_home>\modules\mod_otel_win.so"
Step 4 – Remove Runtime DLLs
Remove the DLLs that were added:
del "<apache_home>\bin\libprotobuf.dll"
del "<apache_home>\bin\libcurl.dll"
del "<apache_home>\bin\zlib1.dll"
del "<apache_home>\bin\abseil_dll.dll"
Step 5 – Remove OTel Configuration File
del "<apache_home>\conf\otel.ini"
Step 6 – Validate Apache Configuration
"<apache_home>\bin\httpd.exe" -t
Expected output:
Syntax OK
Step 7 – Restart Apache
"<apache_home>\bin\httpd.exe"
Rollback Verification
- Apache should start without errors
- No references to mod_otel_win should appear in logs
- Application should behave as it did before instrumentation
Notes on Rollback
- Rollback is safe and non-destructive if backups were taken correctly
- If Apache still fails after rollback:
- Check
<apache_home>\\logs\\error.log - Ensure no partial edits remain in
httpd.conf
- Check
- If needed, restore the entire backup folder manually
Linux Apache HTTP Server Instrumentation
Apache HTTP Server is one of the most widely deployed web servers in the world. It handles incoming HTTP/HTTPS requests and serves web content or proxies requests to backend application services.
Zero-code instrumentation means no changes are needed to your application source code. The module hooks into Apache's request processing pipeline automatically once it is deployed and configured.
Definitions and Acronyms
| Term | Definition |
|---|---|
| Apache HTTP Server | Open-source web server software that receives and responds to HTTP/HTTPS requests. |
| Module (.so file) | A dynamically loadable plugin that extends Apache's built-in functionality. |
| OTel / OpenTelemetry | An open-source observability framework for collecting traces, metrics, and logs. |
| Collector | A service that receives, processes, and forwards telemetry data (e.g., to a monitoring platform). |
| Trace | A record of a single request as it travels through a system, composed of one or more spans. |
| Span | A named unit of work within a trace, e.g., a single HTTP request handled by Apache. |
| OTLP | OpenTelemetry Protocol — the standard wire format used to transmit telemetry data. |
| mod_otel | The OpenTelemetry instrumentation module for Apache HTTP Server |
| httpd.conf | The main Apache configuration file that controls how Apache behaves. |
| log4cxx | Apache logging library required by the OTel SDK for internal logging. |
| W3C TraceContext | Standard for propagating trace context across service boundaries via HTTP headers |
Support Matrix
Apache / mod_otel:
Supported Apache HTTP Server Versions:
-
Apache HTTP Server 2.4.x (verified on 2.4.37)
-
JBoss Core Services (JBCS) Apache HTTP Server 2.4.62
Architecture:
- x86_64 (64-bit) only
Supported Operating Systems:
- RHEL 8.x / CentOS 8.x (verified on RHEL 8.10)
Supported Export Protocols:
- OTLP/gRPC (port 4317) OTLP/HTTP (port 4318)
32-bit (x86) installations are not supported. Only 64-bit Linux systems are supported.
Pre-requisites for Instrumentation
In addition to the supported environment listed above, the following prerequisites must be satisfied before beginning the instrumentation procedure.
Operating System
-
64-bit Linux (RHEL 8.x, CentOS 8.x, or compatible)
-
`sudo` or root access required
-
`curl` and `tar` utilities available
-
Required System Libraries
-
Some OpenTelemetry exporter libraries require additional compatibility libraries on RHEL 8.
Using Package Manager (if allowed):
sudo dnf install -y libnsl libnsl2
Apache HTTP Server
-
Apache HTTP Server 2.4.x or JBoss Core Services (JBCS) Apache HTTP Server 2.4.62 must already be installed and able to start
-
The Apache configuration directory `/etc/httpd/conf.modules.d/` must be writable
-
The JBCS, the config directory /opt/rh/jbcs-httpd24/root/etc/httpd/conf.modules.d/
-
`apachectl` or `httpd` command must be available
Network
-
- Port 4317 must be open outbound from the Apache server to the OpenTelemetry Collector IP/hostname (gRPC protocol)
-
- Port 4318 must be open if using OTLP/HTTP protocol
SELinux (RHEL Only)
If SELinux is in enforcing mode, Apache (httpd_t) is blocked from making
outbound network connections by default. Run the following before starting:
sudo setsebool -P httpd_can_network_connect 1
Verify
getsebool httpd_can_network_connect
Expected output:
httpd_can_network_connect --> on
What Must Be True Before You Begin
-
Apache starts successfully without errors when launched manually.
-
Running `apachectl configtest` returns `Syntax OK`
-
You know the IP address or hostname of your OpenTelemetry Collector.
Finding Your Apache Installation
Before proceeding, you need to know where Apache is installed on this machine. Run the commands in this section from a terminal
Is Apache Running Right Now?
Run the following command to see if Apache is already running as a process:
systemctl status httpd
If Apache is running you will see output similar to:
httpd.service - The Apache HTTP Server
   Loaded: loaded (/usr/lib/systemd/system/httpd.service; enabled)
   Active: active (running) since ...
If you see "No tasks are running", Apache is not currently running. That is fine — you can still follow this guide.
Find the Apache Executable Path
Run the command below to find where the Apache httpd binary is located:
which httpd
Example output:
/usr/sbin/httpd
If that command returns nothing, try these alternative commands:
sudo systemctl start httpd
Identify Your Key Directories
Based on the Apache Home you identified above, your key directories will be:
| Directory Name | Default Path | Purpose |
|---|---|---|
| Apache Home | /etc/httpd | Configuration files |
| Modules Directory | /usr/lib64/httpd/modules/ | Apache modules (.so files) |
| Configuration Directory | /etc/httpd/conf.modules.d/ | Module configuration files |
| Error Log | /var/log/httpd/error_log | Apache error logs |
| Document Root | /var/www/html/ | Default web content |
| Directory Name | JBCS Default Path | Purpose |
|---|---|---|
| Apache Home | /opt/rh/jbcs-httpd24/root/etc/httpd | Configuration files |
| Modules Directory | /opt/rh/jbcs-httpd24/root/usr/lib64/httpd/modules/ | Apache modules (.so files) |
| Configuration Directory | /opt/rh/jbcs-httpd24/root/etc/httpd/conf.modules.d/ | Module configuration files |
| Error Log | /opt/rh/jbcs-httpd24/root/var/log/httpd/error_log | Apache error logs |
| Document Root | /opt/rh/jbcs-httpd24/root/var/www/html/ | Default web content |
Write down your Apache paths now. You will reference them throughout this document.
Implementation
Follow the steps below in order. All commands should be run from a terminal with `sudo` privileges.
Step 1 Install Files (Provided by VuNet Team)
The following files must be obtained from the VuNet team and pre-uploaded to the target server:
Files to Obtain from VuNet Team
| File Name | Size (approx) | Purpose |
|---|---|---|
| opentelemetry-webserver-sdk-x64-linux.tgz | ~15 MB | OTel Webserver SDK with mod_otel module |
| liblog4cxx.so | ~5 MB | Pre-built log4cxx library (no compilation required) |
Copy Files to Target Server
Copy both files to the target server's `/tmp` directory using USB drive or network share:
cp "\<path\_to\_files\>/opentelemetry-webserver-sdk-x64-linux.tgz" /tmp/
cp "\<path\_to\_files\>/liblog4cxx.so" /tmp/
Replace <path\_to\_files> with your actual USB mount path or network share path
Verify Files
ls -lh /tmp/opentelemetry-webserver-sdk-x64-linux.tgz
ls -lh /tmp/liblog4cxx.so
Expected output:
-rw-r--r-- 1 root root 15M Mar 1 10:00 opentelemetry-webserver-sdk-x64-linux.tgz
-rwxr-xr-x 1 root root 4.6M Apr 6 09:00 liblog4cxx.so
.
Step 2 – Extract and Install the Module
Extract the Archive
cd /tmp
sudo tar -xzf opentelemetry-webserver-sdk-x64-linux.tgz -C /opt/
Verify Extracted Contents
ls -la /opt/opentelemetry-webserver-sdk/
Expected output:
drwxr-xr-x 6 root root 4096 Mar 1 10:00 .
drwxr-xr-x 3 root root 4096 Mar 1 10:00 ..
-rw-r--r-- 1 root root  123 Mar 1 10:00 VERSION.txt
drwxr-xr-x 2 root root 4096 Mar 1 10:00 WebServerModule/
drwxr-xr-x 2 root root 4096 Mar 1 10:00 conf/
-rwxr-xr-x 1 root root 1024 Mar 1 10:00 install.sh
drwxr-xr-x 3 root root 4096 Mar 1 10:00 logs/
drwxr-xr-x 3 root root 4096 Mar 1 10:00 sdk_lib/
Locate the Apache Module
ls -la /opt/opentelemetry-webserver-sdk/WebServerModule/Apache/
Expected output:
-rw-r--r-- 1 root root 1234567 Mar 1 10:00 libmod_apache_otel.so     <-- Main module for Apache 2.4.x
-rw-r--r-- 1 root root 1234567 Mar 1 10:00 libmod_apache_otel22.so   <-- For Apache 2.2 (ignore)
Copy Module to Apache Modules Directory:
sudo cp /opt/opentelemetry-webserver-sdk/WebServerModule/Apache/libmod_apache_otel.so \
  /usr/lib64/httpd/modules/
For JBCS
sudo cp /opt/opentelemetry-webserver-sdk/WebServerModule/Apache/libmod_apache_otel.so \
/opt/rh/jbcs-httpd24/root/usr/lib64/httpd/modules/
Verify the copy:
ls -la /usr/lib64/httpd/modules/libmod_apache_otel.so
Copy SDK Libraries
sudo cp /opt/opentelemetry-webserver-sdk/sdk_lib/lib/*.so* /usr/lib64/
 sudo ldconfig
Verify Libraries
ldconfig -p | grep opentelemetry
Expected output should include:
libopentelemetry_common.so (libc6,x86-64)
libopentelemetry_resources.so (libc6,x86-64)
libopentelemetry_trace.so (libc6,x86-64)
libopentelemetry_otlp_recordable.so (libc6,x86-64)
libopentelemetry_exporter_ostream_span.so (libc6,x86-64)
libopentelemetry_exporter_otlp_grpc.so (libc6,x86-64)
libopentelemetry_webserver_sdk.so (libc6,x86-64)
Step 3 – Install log4cxx Dependency
The OTel SDK requires log4cxx for internal logging. Use the pre-built library provided by VuNet Team:
Copy the pre-built library to system directory
cp /tmp/liblog4cxx.so /usr/lib64/
sudo ldconfig
Verify Installation:
ldconfig -p | grep log4cxx
Expected output:
liblog4cxx.so (libc6,x86-64) => /lib64/liblog4cxx.so
This pre-built library works on RHEL 8.x / CentOS 8.x systems. No compilation required.
Step 4 - Create OTel Configuration File
The ApacheModuleOtelExporterEndpoint must use the correct OTLP port. Use 4317 for gRPC or 4318 for HTTP. Do NOT include the http:// prefix. |
Create the configuration file:
bash
sudo tee /etc/httpd/conf.modules.d/10-otel.conf << 'EOF'
# =============================================================================
# OpenTelemetry Instrumentation for Apache HTTPD
# =============================================================================
# This file enables zero-code distributed tracing for Apache HTTPD.
# Spans are exported to the OTel Collector via gRPC.
# =============================================================================

# Load OpenTelemetry dependent libraries
LoadFile /usr/lib64/libopentelemetry_common.so
LoadFile /usr/lib64/libopentelemetry_resources.so
LoadFile /usr/lib64/libopentelemetry_trace.so
LoadFile /usr/lib64/libopentelemetry_otlp_recordable.so
LoadFile /usr/lib64/libopentelemetry_exporter_ostream_span.so
LoadFile /usr/lib64/libopentelemetry_exporter_otlp_grpc.so
LoadFile /usr/lib64/libopentelemetry_webserver_sdk.so

# Load the Apache OTel Module
LoadModule otel_apache_module /usr/lib64/httpd/modules/libmod_apache_otel.so

# === Module Control ===
ApacheModuleEnabled ON

# === Exporter Configuration ===
# CRITICAL: Use gRPC endpoint WITHOUT http:// prefix # Port 4317 is the gRPC OTLP receiver on the OTel Collector ApacheModuleOtelSpanExporter otlp ApacheModuleOtelExporterEndpoint <OTEL_COLLECTOR_IP>:4317
ApacheModuleOtelSpanExporter otlp
ApacheModuleOtelExporterEndpoint <OTEL_COLLECTOR_IP>:4317

# === Sampling Configuration ===
ApacheModuleOtelSampler AlwaysOn

# === Service Identity (REQUIRED) ===
ApacheModuleServiceName <YOUR_SERVICE_NAME>
ApacheModuleServiceNamespace production
ApacheModuleServiceInstanceId <INSTANCE_ID>

# === Backend Resolution ===
# Enable this to resolve backend service names for proxy targets
ApacheModuleResolveBackends ON

# === Logging ===
# Enable trace-level logging to Apache error log for debugging
ApacheModuleTraceAsError ON
EOF
Replace the following placeholders:
<OTEL_COLLECTOR_IP> → Your OTel Collector IP address (e.g., 10.1.92.19)
<YOUR_SERVICE_NAME → Service name for Grafana (e.g., apache-httpd)
<INSTANCE_ID> → Unique instance identifier (e.g., apache-instance-1)
The application attribute is required by the VuNet collector pipeline.
Since the Apache module does not support custom resource attributes
directly, set it via systemd environment override:
sudo systemctl edit httpd
Add the following inside the editor:
[Service] Environment="OTEL_RESOURCE_ATTRIBUTES=application=<YOUR_APP_NAME>,env=<YOUR_ENV>"
Then apply:
sudo systemctl daemon-reload
    sudo systemctl restart httpd
Replace:
<YOUR_APP_NAME> → Your application name (e.g., ecommerce-app)
<YOUR_ENV> → Your environment (e.g., production)
Step 5 - Create log4cxx Configuration
Create Log Directory
sudo mkdir -p /opt/opentelemetry-webserver-sdk/logs
sudo chmod 777 /opt/opentelemetry-webserver-sdk/logs
Create log4cxx Configuration File
sudo tee /etc/httpd/conf/appdynamics_sdk_log4cxx.xml << 'EOF'
<?xml version="1.0" encoding="UTF-8"?>
<log4j:configuration xmlns:log4j="http://jakarta.apache.org/log4j/">
  <appender name="file" class="org.apache.log4j.RollingFileAppender">
    <param name="file" value="/opt/opentelemetry-webserver-sdk/logs/sdk.log"/>
    <param name="MaxFileSize" value="10MB"/>
    <param name="MaxBackupIndex" value="3"/>
    <layout class="org.apache.log4j.PatternLayout">
      <param name="ConversionPattern" value="%d{ISO8601} %-5p [%c] %m%n"/>
    </layout>
  </appender>
  <root>
    <priority value="info"/>
    <appender-ref ref="file"/>
  </root>
</log4j:configuration>
EOF
SELinux Context Configuration (RHEL Only)
On systems with SELinux enabled, Apache may be blocked from reading the log4cxx configuration file even if standard file permissions are correct.
Set the correct SELinux context:
sudo chcon -t etc_t /etc/httpd/conf/appdynamics_sdk_log4cxx.xml
Verify:
ls -Z /etc/httpd/conf/appdynamics_sdk_log4cxx.xml
Expected output:
system_u:object_r:etc_t:s0 /etc/httpd/conf/appdynamics_sdk_log4cxx.xml
Set SELinux context on the OTel logs directory:
sudo chcon -R -t httpd_log_t /opt/opentelemetry-webserver-sdk/logs/
Verify:
ls -Z /opt/opentelemetry-webserver-sdk/logs/
Configure SDK log path via systemd:
Add:
[Service]
Environment="OTEL_SDK_LOG_CONFIG_PATH=/etc/httpd/conf"
Ensure Apache can read the log4cxx configuration file:
sudo chmod 644 /etc/httpd/conf/appdynamics_sdk_log4cxx.xml
Set correct SELinux type for Apache access:
sudo chcon -t httpd_config_t /etc/httpd/conf/appdynamics_sdk_log4cxx.xml
Apply changes:
sudo systemctl daemon-reload
sudo systemctl restart httpd
Step 6 – Persistence Across Reboots
Add Library Path for ldconfig
echo "/opt/opentelemetry-webserver-sdk/sdk_lib/lib" | sudo tee /etc/ld.so.conf.d/otel-webserver.conf
sudo ldconfig
Expected output
ldconfig -p | grep opentelemetry_webserver
Step 7 – Start and Validate Apache
Validate the Configuration
apachectl configtest
Expected output
AH00558: httpd: Could not reliably determine the server's fully qualified domain name...
Syntax OK
If you see any error other than "Syntax OK", do not proceed. Read the error message carefully — it will tell you exactly which line in httpd.conf has a problem. The most common causes are a typo in the LoadModule line or the module file not being present in the modules directory.
Restart Apache
Once the configuration validates, start Apache:
sudo systemctl restart httpd
Verify Module is Loaded:
httpd -M | grep otel
Expected output
otel_apache_module (shared)
Check Startup Logs
sudo tail -30 /var/log/httpd/error_log | grep -i otel
Expected output should include:
initializing SDK succeeded
otel_hook_header_parser_begin: <namespace>:<service_name>:<instance_id>
Testing the Setup
Open a second terminal and run the following tests. Apache must be running in the first terminal.
Basic HTTP Request Test
Send a simple HTTP request to Apache and confirm it responds:
curl -v http://localhost:80/
Expected result: You should see `HTTP/1.1 200 OK` in the output (or a 403/404 depending on your document root configuration — any HTTP response confirms Apache is running and receiving requests).
Verify Traceparent Generation
# Send a test request
curl -X POST http://localhost/api/test \
  -H "Content-Type: application/json" \
  -d '{"test":"data"}'
Check Apache logs for traceparent
sudo tail -10 /var/log/httpd/error_log | grep traceparent
`Expected output:
otel_payload_decorator: correlation information : "traceparent" : "00-<trace_id>-<span_id>-01"
Confirm Spans Arriving at the Collector
If your OpenTelemetry Collector is configured to log received data, you should see spans being received after each test request above. Each span will include attributes similar to:
| Attribute | Expected Value |
|---|---|
| service.name | The value configured in 10-otel.conf |
| http.method | GET |
| http.target | / |
| http.status_code | 200 |
Rollback / Uninstallation Procedure
If OpenTelemetry instrumentation needs to be removed, follow the steps below to restore the Apache server to its original state before instrumentation was applied. These steps remove the module, libraries, and configuration files that were added during the installation process.
Step 1 – Stop Apache
Stop the Apache HTTP Server before removing any components.
sudo systemctl stop httpd
Step 2 – Remove the OTel Module
Remove the Apache OpenTelemetry module that was copied during installation.
sudo rm -f /usr/lib64/httpd/modules/libmod_apache_otel.so
Verify removal:
ls /usr/lib64/httpd/modules/ | grep otel
Expected output:
(no output)
Step 3 – Remove OTel Configuration File
Remove the Apache module configuration created during Step 4 of this guide.
sudo rm -f /etc/httpd/conf.modules.d/10-otel.conf
Step 4 – Remove SDK Libraries
Remove the OpenTelemetry SDK libraries copied to the system library directory.
sudo rm -f /usr/lib64/libopentelemetry_*
sudo rm -f /usr/lib64/libmod_apache_otel*
Refresh the linker cache:
sudo ldconfig
Step 5 – Remove log4cxx Library
Remove the log4cxx library that was manually copied during installation.
sudo rm -f /usr/lib64/liblog4cxx.so
sudo ldconfig
Step 6 – Remove Compatibility Libraries (If Manually Installed)
If the libnsl libraries were manually copied during installation, remove them.
sudo rm -f /usr/lib64/libnsl.so.1
sudo rm -f /usr/lib64/libnsl.so.2
sudo ldconfig
If these libraries were already part of the OS installation, do not remove them.
Step 7 – Remove OTel SDK Directory
Remove the extracted OpenTelemetry SDK directory.
sudo rm -rf /opt/opentelemetry-webserver-sdk
Step 8 – Remove log4cxx Configuration
Remove the configuration directory created for log4cxx.
sudo rm -rf /etc/httpd/conf/appdynamics_sdk_log4cxx.xml
Step 9 – Remove ldconfig Configuration
Remove the library path configuration created for persistence.
sudo rm -f /etc/ld.so.conf.d/otel-webserver.conf
sudo ldconfig
Step 10 – Start Apache
Start Apache again
sudo systemctl start httpd
Step 11 – Verify Apache is Restored
Validate the Apache configuration.
apachectl configtest
Expected output:
Syntax OK
Verify that the OTel module is no longer loaded:
httpd -M | grep otel
Expected output:
(no output)
Final State After Rollback
After completing the rollback:
- Apache runs normally without OpenTelemetry instrumentation
- All OTel libraries and configuration files are removed
- The system is restored to its original state prior to instrumentation
Zero Code Instrumentation Apache Karaf on Linux
Apache Karaf is an OSGi-based runtime used to deploy modular Java services. All services run within a single JVM.
Zero-code instrumentation uses a Java Agent attached at JVM startup to automatically capture:
- HTTP requests
- Internal service calls
- Messaging and async execution
- Database interactions (if present)
No modification to service bundles is required.
Definitions and Acronyms
| Term | Definition |
|---|---|
| Apache Karaf | OSGi-based runtime container for Java services |
| Java Agent | JVM-level instrumentation library loaded at startup |
| OTel / OpenTelemetry | An open-source observability framework for collecting traces, metrics, and logs. |
| Collector | A service that receives, processes, and forwards telemetry data (e.g., to a monitoring platform). |
| Trace | A record of a single request as it travels through a system, composed of one or more spans. |
| Span | A named unit of work within a trace, e.g., a single HTTP request handled by Apache. |
| setenv | Karaf environment configuration script |
| OTLP | OpenTelemetry Protocol — the standard wire format used to transmit telemetry data. |
Support Matrix
Supported Karaf Versions - Apache Karaf 4.x
Supported Java Versions - OpenJDK 17
Supported Operating Systems -RHEL 8.x / 9.x
Supported Export Protocols
- OTLP/HTTP (Port 4318)
- OTLP/gRPC (Port 4317)
Pre-requisites for Instrumentation
In addition to the supported environment listed above, the following prerequisites must be satisfied before beginning the instrumentation procedure.
Operating System
-
64-bit Linux system (RHEL 8.x)
-
sudo or root access — you must be able to execute commands with elevated privileges
-
Basic shell utilities available: cp, mkdir, grep, ps, cat
Java Runtime:
- A supported 64-bit JDK (OpenJDK 11, 17, or 21) must be installed and the java command must be on the PATH
- Verify with: java -version
Files Required — Obtain from VuNet Team
- opentelemetry-javaagent.jar — the OpenTelemetry Java Agent JAR file
Network
- Port 4318 must be open outbound from the Apache server to the OpenTelemetry Collector IP/hostname
What Must Be True Before You Begin
-
Karaf starts successfully without errors when launched manually
-
The java command resolves correctly and reports a supported 64-bit version
-
You have received the opentelemetry-javaagent.jar file from the VuNet team and know its location on disk
-
You know the IP address or hostname of your OpenTelemetry Collector and the port it listens on.
Finding Your Apache Installation
Before proceeding, identify where Karaf is installed. Run the following commands from a terminal.
Is Apache Running Right Now?
Run the following command to check if a Karaf process is currently running:
ps aux | grep karaf | grep -v grep
If Apache is running you will see output similar to:
vunet 12345 5.2 12.3 4567890 123456 ? Sl 08:00 3:21 java -Djava.endorsed.dirs=... -jar /opt/apache-karaf-4.4.3/lib/boot/org.apache.karaf.main-4.4.3.jar
If no output is returned, Karaf is not currently running. That is fine — you can still follow this guide.
Find the Karaf Installation Directory
If Karaf is running, you can extract the installation path from the process listing:
ps aux | grep karaf | grep -v grep | grep -oP '(?<=-Dkaraf.home=)[^ ]+'
Alternatively, check common installation locations:
ls /opt/ | grep karaf
ls /home/ | grep karaf
 ls /usr/local/ | grep karaf
Once you have identified the directory, confirm its structure:
ls <karaf_home>/bin/
ls <karaf_home>/etc/
ls <karaf_home>/deploy/
Identify Your Key Directories
Based on the Apache Home you identified above, your key directories will be:
| Directory Name | Example Path |
|---|---|
| Karaf Home | /opt/apache-karaf-4.4.3 |
| Bin Directory | /opt/apache-karaf-4.4.3/bin |
| Etc Directory | /opt/apache-karaf-4.4.3/etc |
| Deploy Directory | /opt/apache-karaf-4.4.3/deploy |
| Log Directory | |
| setenv File | /opt/apache-karaf-4.4.3/bin/setenv |
Write down your Karaf Home path now. You will substitute it for <karaf_home> in every command throughout this document.
Implementation
Follow the steps below in order. All commands should be run from a terminal with sudo or as the user that owns the Karaf installation.
Pre-Implementation Safety Step (Backup Existing Files)
Before making any changes, take a backup of the existing configuration. This ensures you can safely revert to the previous working state if needed.
Create a Backup Folder
Create a backup directory inside your Apache Home:
mkdir "<apache_home>\backup_pre_otel"
Backup the setenv File (if it already exists)
cp <karaf_home>/bin/setenv <karaf_home>/backup_pre_otel/setenv.bak 2>/dev/null || echo
Backup the Karaf Startup Configuration
cp <karaf_home>/etc/config.properties <karaf_home>/backup_pre_otel/config.properties.bak cp <karaf_home>/etc/system.properties <karaf_home>/backup_pre_otel/system.properties.bak
Verify Backup
ls -lh <karaf_home>/backup_pre_otel/
Ensure all files that existed are present in the backup before proceeding.
Step 1 – Place the OpenTelemetry Java Agent
- Create a dedicated directory to hold the agent JAR and copy the file provided by the VuNet team into it.
Create the Agent Directory
mkdir -p <karaf_home>/otel
- Copy the Agent JAR
cp /path/to/opentelemetry-javaagent.jar <karaf_home>/otel/opentelemetry-javaagent.jar
Replace /path/to/opentelemetry-javaagent.jar with the actual path where you saved the JAR received from the VuNet team.
- Set Correct Permissions
chmod 644 <karaf_home>/otel/opentelemetry-javaagent.jar
- Verify the File Is Present and Has a Non-Zero Size
ls -lh <karaf_home>/otel/opentelemetry-javaagent.jar
You should see the file listed with a size of several megabytes (typically 30–60 MB). If the file is 0 bytes or not found, the copy failed — verify the source path and retry.
Step 2 – Configure the setenv Script
Karaf reads the bin/setenv file at startup and applies any environment variable exports it finds. This is where you attach the Java Agent and supply all OpenTelemetry configuration properties.
- Check Whether setenv Already Exists
ls <karaf_home>/bin/setenv
If the file exists, you will extend it. If it does not exist, you will create it.
- Open or Create the setenv File
Use any text editor. Example using vi:
vi <karaf_home>/bin/setenv
- If the file is new, start with a shebang line. Then add the following block. If the file already exists with content, append the block below after any existing lines.
Add the Following Configuration Block
Replace the placeholder values before saving:
- Replace
<karaf_homewith your actual Karaf Home path - Replace
<otel_collector_ip>with the IP address or hostname of your OpenTelemetry Collector - Replace
<port>with 4318 for OTLP/HTTP or 4317 for OTLP/gRPC - Replace
<your_service_name>with a meaningful name for this Karaf instance - Replace
<your_environment>with the environment label (e.g., production, staging, uat)
\#\!/bin/sh
\#\#--- OpenTelemetry Java Agent Instrumentation —
\#\#Attach the OpenTelemetry Java Agent
export EXTRA\_JAVA\_OPTS="$EXTRA\_JAVA\_OPTS \-javaagent:\<karaf\_home\>/otel/opentelemetry-javaagent.jar"
\#\#OTLP export endpoints
export EXTRA\_JAVA\_OPTS="$EXTRA\_JAVA\_OPTS \-Dotel.exporter.otlp.traces.endpoint=http://\<otel\_collector\_ip\>:\<port\>/v1/traces" export EXTRA\_JAVA\_OPTS="$EXTRA\_JAVA\_OPTS \-Dotel.exporter.otlp.metrics.endpoint=http://\<otel\_collector\_ip\>:\<port\>/v1/metrics" export EXTRA\_JAVA\_OPTS="$EXTRA\_JAVA\_OPTS \-Dotel.exporter.otlp.logs.endpoint=http://\<otel\_collector\_ip\>:\<port\>/v1/logs"
\#\#Export protocol (http/protobuf for OTLP/HTTP; grpc for OTLP/gRPC)
export EXTRA\_JAVA\_OPTS="$EXTRA\_JAVA\_OPTS \-Dotel.exporter.otlp.traces.protocol=http/protobuf" export EXTRA\_JAVA\_OPTS="$EXTRA\_JAVA\_OPTS \-Dotel.exporter.otlp.metrics.protocol=http/protobuf" export EXTRA\_JAVA\_OPTS="$EXTRA\_JAVA\_OPTS \-Dotel.exporter.otlp.logs.protocol=http/protobuf"
\#\#Resource attributes — identify this service in your tracing dashboard
export EXTRA\_JAVA\_OPTS="$EXTRA\_JAVA\_OPTS \-Dotel.resource.attributes=[service.name](http://service.name)\=\<your\_service\_name\>,environment=\<your\_environment\>"
\#\#Enable exporters
export EXTRA\_JAVA\_OPTS="$EXTRA\_JAVA\_OPTS \-Dotel.traces.exporter=otlp" export EXTRA\_JAVA\_OPTS="$EXTRA\_JAVA\_OPTS \-Dotel.metrics.exporter=otlp" export EXTRA\_JAVA\_OPTS="$EXTRA\_JAVA\_OPTS \-Dotel.logs.exporter=otlp"
\#\#Auto-instrumentation — enable specific frameworks
export EXTRA\_JAVA\_OPTS="$EXTRA\_JAVA\_OPTS \-Dotel.instrumentation.camel.enabled=true" export EXTRA\_JAVA\_OPTS="$EXTRA\_JAVA\_OPTS \-Dotel.instrumentation.netty.enabled=true" export EXTRA\_JAVA\_OPTS="$EXTRA\_JAVA\_OPTS \-Dotel.instrumentation.http-server.enabled=true" export EXTRA\_JAVA\_OPTS="$EXTRA\_JAVA\_OPTS \-Dotel.instrumentation.jdbc.enabled=true" export EXTRA\_JAVA\_OPTS="$EXTRA\_JAVA\_OPTS \-Dotel.instrumentation.executor.enabled=true"
\#\#Sampling — 100% of traces captured
export EXTRA\_JAVA\_OPTS="$EXTRA\_JAVA\_OPTS \-Dotel.traces.sampler=parentbased\_traceidratio" export EXTRA\_JAVA\_OPTS="$EXTRA\_JAVA\_OPTS \-Dotel.traces.sampler.param=1.0"
\#\#Metrics export interval (milliseconds)
export EXTRA\_JAVA\_OPTS="$EXTRA\_JAVA\_OPTS \-Dotel.metric.export.interval=10000"
\#\#--- End OpenTelemetry Configuration \---
Save the file and close the editor.
- Make the setenv File Executable
chmod \+x \<karaf\_home\>/bin/setenv
Step 3 – Validate the Configuration
Before restarting Karaf, verify the setenv file is correctly formed.Check the File Exists and Is Executable
ls -lh <karaf_home>/bin/setenv
Expected output should show execute permission (x) for the owning user.
Review the File Contents
cat <karaf_home>/bin/setenv
Confirm the following are present:
- The -javaagent line points to the correct absolute path of the JAR
- The OTLP endpoint URLs contain the correct collector IP and port
- The service.name and environment resource attributes are set to meaningful values
- All export lines begin with export
EXTRA_JAVA_OPTS="$EXTRA_JAVA_OPTS
Verify the Agent JAR Is Readable by the Karaf User
If Karaf runs as a specific system user (e.g., karaf or vunet), ensure that user can read the JAR:
ls -lh <karaf_home>/otel/opentelemetry-javaagent.jar
The file should be readable by the user that starts the Karaf process. If needed, adjust ownership:
chown <karaf_user>:<karaf_group> <karaf_home>/otel/opentelemetry-javaagent.jar
Step 4 – Restart Karaf
Stop Karaf
<karaf_home>/bin/stop
Wait for the process to fully exit. Confirm it has stopped:
sleep 10 ps aux | grep karaf | grep -v grep
If the process is still running after 15 seconds, force-terminate it:
kill -9 $(ps aux | grep karaf | grep -v grep | awk '{print $2}')
Start Karaf
<karaf_home>/bin/start
Allow Karaf 20–30 seconds to fully initialise before proceeding to testing. Verify the Agent Was Loaded.Check the running Karaf process to confirm the -javaagent flag is present in the JVM arguments:
ps aux | grep karaf | grep -v grep | grep opentelemetry-javaagent
If the grep returns a line containing opentelemetry-javaagent, the agent was successfully loaded. If no output is returned, the agent was not loaded — verify the setenv file is executable and the EXTRA_JAVA_OPTS lines are correctly formatted.
Check the Karaf Log for Agent Activity
tail -n 100 <karaf_home>/data/log/karaf.log | grep -i otel
On a successful startup, you should see log lines from the OpenTelemetry agent indicating it has initialised, discovered instrumentation targets, and connected to the configured OTLP endpoint.
Testing the Setup
Send a Request to Karaf Services
Once Karaf is running with the agent loaded, trigger activity by sending requests to any HTTP endpoint exposed by the running services. The specific endpoint will depend on the services deployed in your Karaf instance.
Example using curl for an HTTP service on port 8181 (Karaf default HTTP port):
curl.exe -vhttp://localhost:8181/
Any HTTP response (200, 403, 404, etc.) confirms the service is reachable and the request was processed. The agent will have captured this as a span.
Confirm Spans Arriving at the Collector
If your OpenTelemetry Collector is configured to log received data, you should see spans being received after each test request above. Each span will include attributes similar to:
| Attribute | Expected Value |
|---|---|
| service.name | The value you set in setenv |
| http.method | GET (or POST, etc.) |
| http.target | / |
| http.status_code | 200(or applicable status) |
| otel.library.name | io.opentelementry.jetty-* or similar |
Check the Karaf Log for Export Errors
tail -f <karaf_home>/data/log/karaf.log | grep -i -E "otel|opentelemetry|exporter"
If you see errors such as connection refused or failed to export, verify that the OTLP endpoint in setenv is reachable from the Karaf host and that the port is open.
Configuration Reference
Setenv EXTRA_JAVA_OPTS Parameters
| Parameter | Required | Description | Example Value |
|---|---|---|---|
| -javaagent | Yes | Absolute path to the OpenTelementry Java Agent JAR | <karaf_home>/otel/opentelemetry-javaagent.jar |
| otel.exporter.otlp.traces.endpoint | Yes | OTLP endpoint URL for traces | http://10.1.92.19:4318/v1/traces |
| otel.exporter.otlp.metrics.endpoint | Yes | OTLP endpoint URL for metrics | http://10.1.92.19:4318/v1/metrics |
| otel.exporter.otlp.logs.endpoint | Yes | OTLP endpoint URL for logs | http://10.1.92.19:4318/v1/logs |
| otel.exporter.otlp.traces.protocol | Yes | Wire protocol for trace export | http/protobuf |
| otel.exporter.otlp.metrics.protocol | Yes | Wire protocol for metrics export | http/protobuf |
| otel.exporter.otlp.logs.protocol | Yes | Wire protocol for log export | http/protobuf |
| otel.resource.attributes | Yes | Key-value pairs to tag all telemetry from this instance | service.name=karaf-prod,environment=production |
| otel.traces.exporter | Yes | Exporter type for traces | otlp |
| otel.metrics.exporter | Yes | Exporter type for metrics | otlp |
| otel.logs.exporter | Yes | Exporter type for logs | otlp |
| otel.traces.sampler | No | Sampling strategy | parentbased_traceidratio |
| otel.traces.sampler.param | No | Sampling ratio (1.0 = 100%) | 1.0 |
| otel.metric.export.interval | No | Metrics export interval in milliseconds | 10000 |
| otel.instrumentation.camel.enabled | No | Enable Apache Camel route instrumentation | true |
| otel.instrumentation.netty.enabled | No | Enable Netty networking instrumentation | true |
| otel.instrumentation.http-server.enabled | No | Enable HTTP server instrumentation | true |
| otel.instrumentation.jdbc.enabled | No | Enable JDBC database query instrumentation | true |
| otel.instrumentation.executor.enabled | No | Enable Java Executor thread pool instrumentation | true |
Required Files Checklist
| File | Location | Purpose |
|---|---|---|
| opentelemetry-javaagent.jar | <karaf_home>/otel/ | The OpenTelemetry Java Agent — attaches to the JVM at startup to instrument the runtime automatically |
| setenv | <karaf_home>/bin/ | Karaf startup environment script — sets EXTRA_JAVA_OPTS to load the agent and supply all OTel configuration |
Notes and Recommendations
-
Once you have verified spans are reaching the Collector, reduce the sampling ratio in production if trace volume is high. Change otel.traces.sampler.param from 1.0 to a lower value such as 0.1 (10%) to manage overhead.
-
Ensure your Java version is compatible with the agent JAR provided by the VuNet team. If you upgrade the JDK, test the agent on the new version before deploying to production.
-
If Karaf fails to start after following this guide, check the log at
<karaf_home>/data/log/karaf.logfor JVM startup errors, which will indicate whether the agent JAR was found and loaded. -
The
EXTRA_JAVA_OPTSvariable is cumulative — each export line appends to the previous value. Do not overwrite it with a plain exportEXTRA_JAVA_OPTS="..."line or earlier entries will be lost. -
For production deployments, consider externalising the OTel configuration into a dedicated properties file and referencing it with
-Dotel.javaagent.configuration-file=<path>/otel-config.propertiesto keep setenv clean.
Viewing the Apache Error Log
If something is not working correctly, the Apache error log is the first place to look:
tail -n 200 <karaf_home>/data/log/karaf.log
To filter for OpenTelemetry-specific entries only:
tail -f <karaf_home>/data/log/karaf.log | grep -i otel
Rollback Procedure
If Karaf fails to start after instrumentation, or if you need to revert the changes, follow the steps below to restore the previous working state.
Step 1 – Stop Karaf
If Karaf is running, stop it:
<karaf_home>/bin/stop sleep 10
If it does not stop cleanly:
kill -9 $(ps aux | grep karaf | grep -v grep | awk '{print $2}')
Step 2 – Restore the setenv File
If setenv existed before instrumentation, restore it from backup:
cp -f <karaf_home>/backup_pre_otel/setenv.bak <karaf_home>/bin/setenv
chmod +x <karaf_home>/bin/setenv
If setenv did not exist before instrumentation (you created it fresh), remove it entirely:
rm <karaf_home>/bin/setenv
Step 3 – Restore Karaf Configuration Files
cp -f <karaf_home>/backup_pre_otel/config.properties.bak <karaf_home>/etc/config.properties
cp -f <karaf_home>/backup_pre_otel/system.properties.bak karaf_home>/etc/system.properties
Step 4 – Remove the Agent JAR
rm -rf <karaf_home>/otel
Step 5 – Verify Karaf Starts Without the Agent
<karaf_home>/bin/start sleep 20
Confirm Karaf started and the agent is no longer present in the JVM arguments:
ps aux | grep karaf | grep -v grep | grep opentelemetry-javaagent
This command should return no output. If it returns output, the agent is still being loaded — verify the setenv file was correctly restored or removed.
Step 6 – Confirm Clean Startup in Logs
tail -n 100 <karaf_home>/data/log/karaf.log | grep -i otel
There should be no OpenTelemetry-related log entries after a clean rollback.
Rollback Verification
- Karaf should start without errors
- No -javaagent reference should appear in the running process JVM arguments
- No OpenTelemetry entries should appear in karaf.log
- Services should behave as they did before instrumentation
Notes on Rollback
- Rollback is safe and non-destructive if backups were taken correctly before instrumentation
- If Karaf still fails to start after rollback, inspect
<karaf_home>/data/log/karaf.log for errors unrelated to OTel - If needed, the entire backup directory can be used to manually restore any files that were modified
- The otel/ directory created in Step 1 is self-contained — removing it entirely is sufficient to remove all agent files.
FAQs
What are the main steps to enable APM?
Enable the Traces O11ySource and configure the required data sources in vuSmartMaps, then instrument the target application and restart it to begin trace collection.
What is the Traces O11ySource?
The Traces O11ySource collects distributed trace telemetry from applications and provides the data required for APM dashboards and analysis.
What management modes are supported for Traces data sources?
Traces data sources support OmniAgent Managed, Manually Managed, and Remote Collection modes.
What is OmniAgent Managed mode?
In OmniAgent Managed mode, tracing is handled automatically by OmniAgent. Trace collection starts after OmniAgent is discovered on the host; until then, the source remains in a Pending state.
What is Manually Managed mode?
In Manually Managed mode, you download the required client instrumentation package and deploy and configure the instrumentation manually on the application host.
What is Remote Collection mode?
Remote Collection collects trace data without installing OmniAgent on the host, where supported. Data collection starts automatically after the configuration is applied.
What is tail sampling in APM?
Tail sampling evaluates a complete trace after the request finishes and retains or discards it based on the configured sampling policies.
What conditions can be used to configure sampling policies?
Sampling policies can be configured using conditions such as error status, request latency, trace attributes, percentage-based sampling, and service scope.
How are multiple sampling policies evaluated?
Each completed trace is evaluated against every configured policy. A trace is retained if it matches any policy and discarded only when it does not match any configured policy.
What is Decision Wait in tail sampling?
Decision Wait specifies how long the trace collector waits before evaluating a completed trace against the configured sampling policies.
How can JVM metrics be collected using the OpenTelemetry Java agent?
Change OTEL_METRICS_EXPORTER or -Dotel.metrics.exporter from none to otlp. The existing OpenTelemetry Java agent used for tracing can then collect and export JVM and application runtime metrics.
How is TLS configured for trace collection?
When TLS is enabled on the vuSmartMaps traces receiver, configure the OTLP protocol as http/protobuf, provide the server certificate, and use the HTTPS traces ingestion endpoint on port 4318.
