OmniAgent Dashboards
Introduction
The OmniAgent Dashboards provide a centralized view. These dashboards help users track probe installation and update statuses, review probe activity logs, and manage API keys used by the OmniAgent. All OmniAgent–specific dashboards are grouped under a dedicated OmniAgent folder for easier access and organization.
Accessing OmniAgent Dashboards
To access the OmniAgent dashboards:
- Navigate to Home → Dashboards.
- In the Dashboards page, search for OmniAgent or browse the list.
- Click the OmniAgent folder.
- Inside the folder, the following dashboards are available:
Users can use the search bar, tag filters, and sort options to quickly locate dashboards. Each dashboard can be opened by clicking its name.
Dashboards
Under the Dashboards section, OmniAgent provides three dedicated dashboards that help users monitor and audit probe-related activities. These dashboards offer visibility into API key usage, probe installation and update status, and detailed probe activity logs, enabling effective monitoring and troubleshooting of the OmniAgent environment.
Probe Activity Overview Dashboard
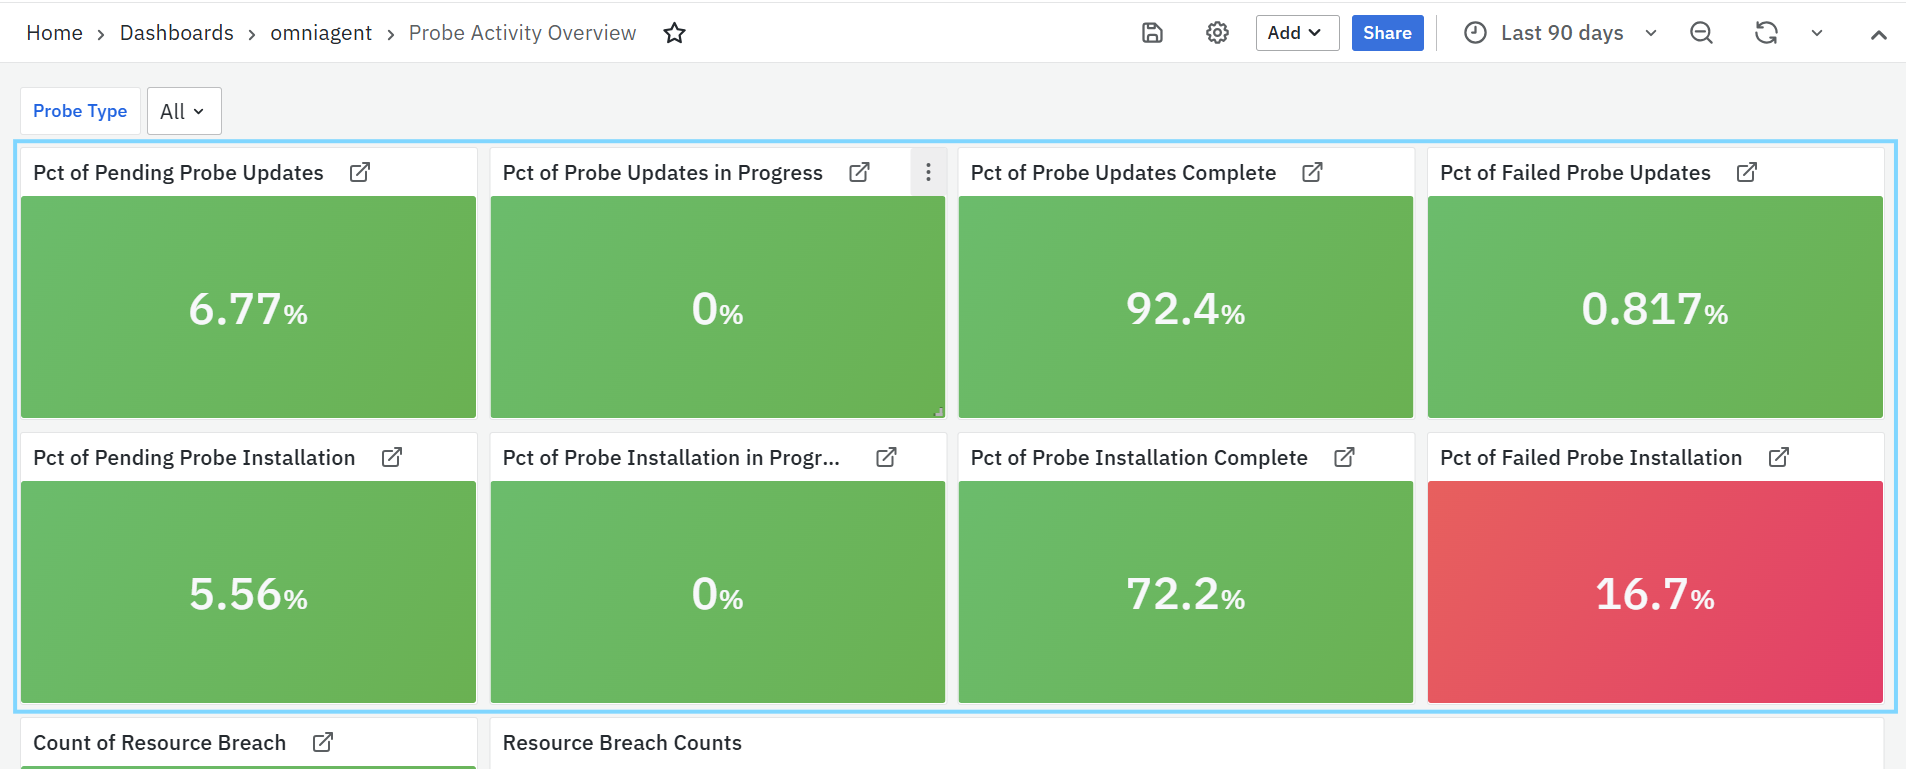
The Probe Activity Overview dashboard provides a consolidated view of the current status of OmniAgent probes. It helps users monitor probe installation progress, update status, and failures across the environment at a glance. This dashboard is mainly used to quickly assess probe health and identify areas that require attention. The Probe Type filter allows users to view probe activity metrics for a specific probe or for all probes together.
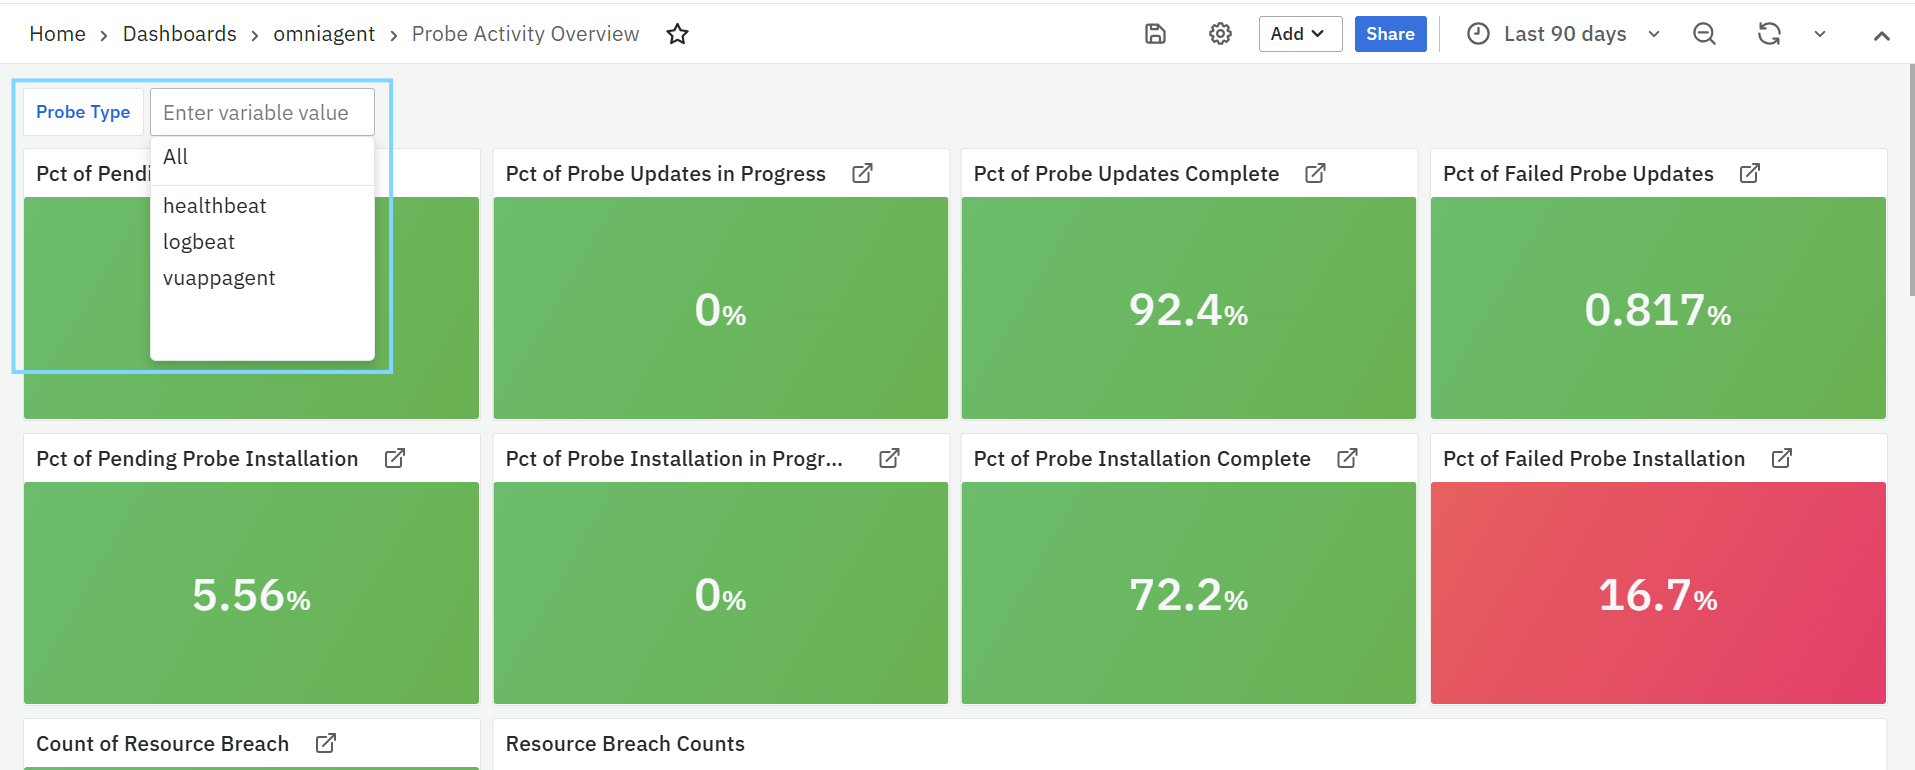
Probe Update Status Panels
- Pct of Pending Probe Updates: Displays the percentage of probes for which updates are available but have not yet started.
- Pct of Probe Updates in Progress: Shows the percentage of probes where updates are currently being applied.
- Pct of Probe Updates Complete: Indicates the percentage of probes that have successfully completed the update process.
- Pct of Failed Probe Updates: Represents the percentage of probes where the update process has failed.
Clicking on any of the above panels opens a detailed view showing the full Probe Update status).
Probe Installation Status Panels
- Pct of Pending Probe Installation: Shows the percentage of probes that are pending installation.
- Pct of Probe Installation in Progress: Displays the percentage of probes that are currently being installed.
- Pct of Probe Installation Complete: Indicates the percentage of probes that have been successfully installed.
- Pct of Failed Probe Installation: Represents the percentage of probes where installation has failed.
Clicking on any of the above panels opens a detailed view showing the Probe Installation status.
Resource Breach Panel
- Count of Resource Breach: Displays the total number of resource breach events detected across probes.
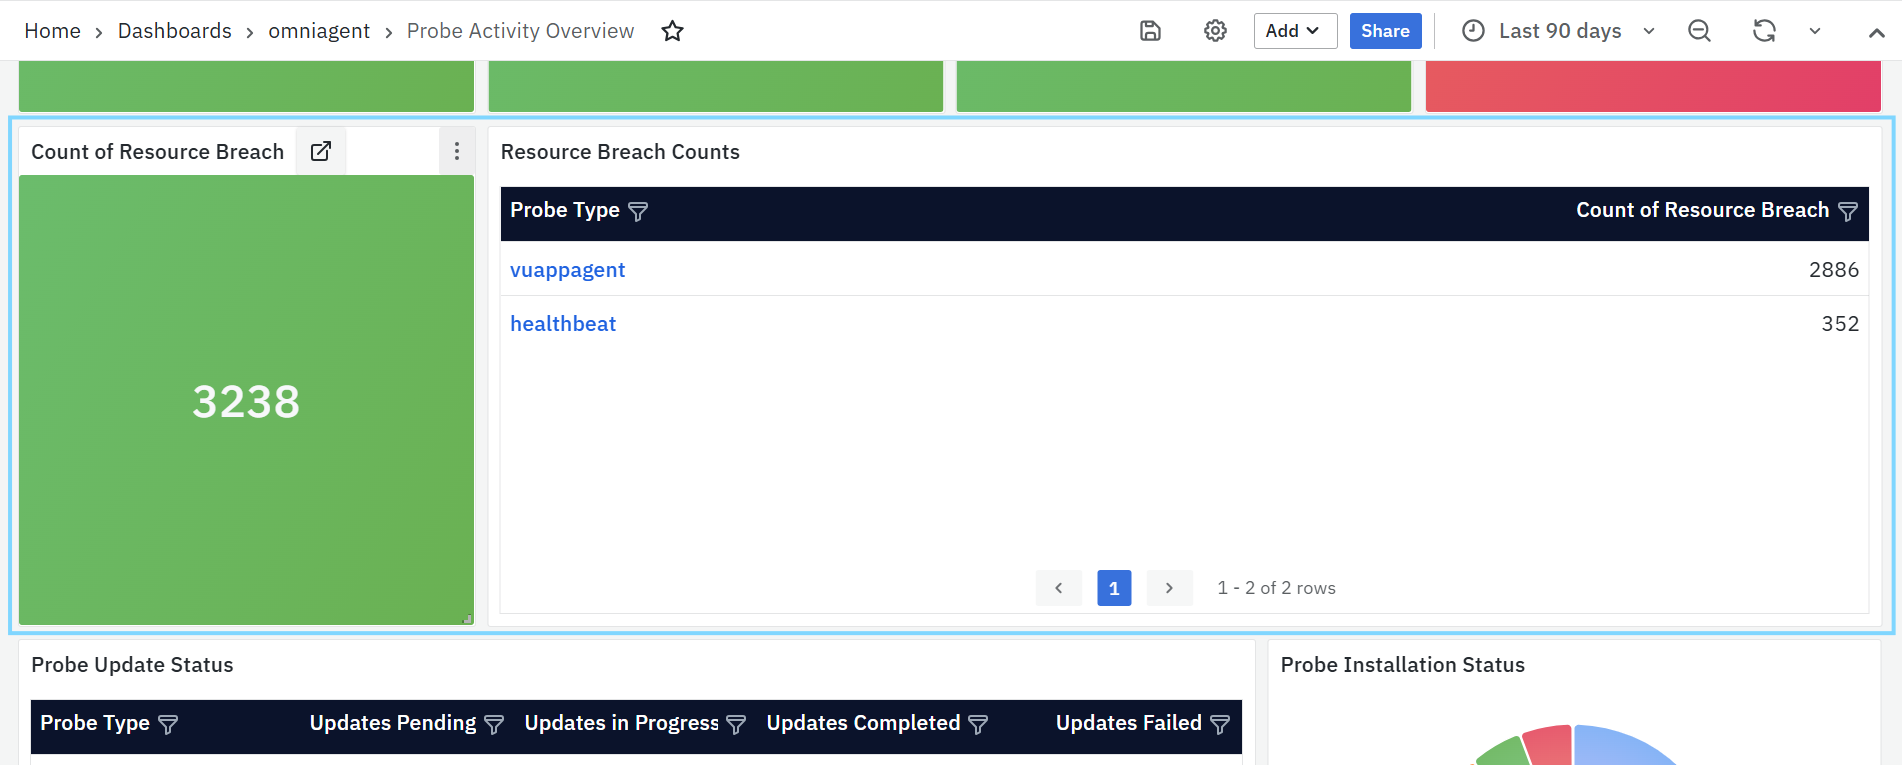
Clicking on this panel opens a detailed view showing the Resource Breach Counts.
Resource Breach Counts
This panel displays a table showing resource breach information grouped by probe type.
- Probe Type: Indicates the type of probe.
- Count of Resource Breach: Shows the number of resource breach events detected for each probe type.
Clicking on a Probe Type navigates the user to the Probe Audit Log dashboard, where detailed logs related to the selected probe are displayed.
Probe Update Status
This panel displays a table summarizing the update status of probes by probe type.
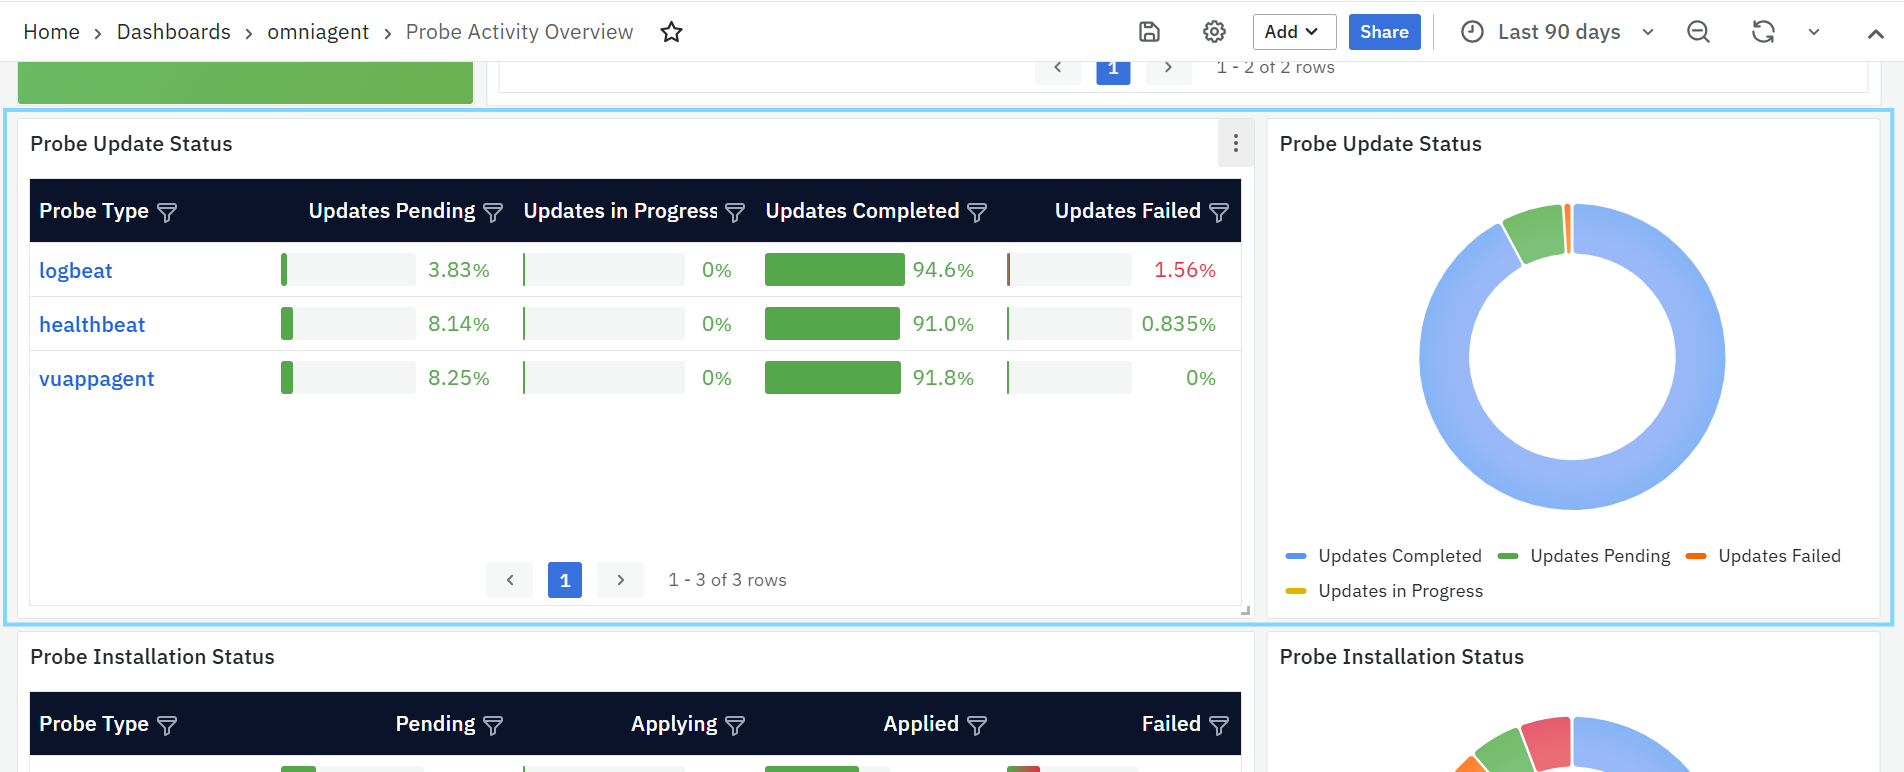
- Probe Type: Indicates the type of probe.
- Updates Pending: Number of probes with updates yet to be applied.
- Updates in Progress: Number of probes currently undergoing updates.
- Updates Completed: Number of probes where updates have completed successfully.
- Update Failed: Number of probes where updates have failed.
Clicking on a Probe Type navigates the user to the Probe Audit Log dashboard for detailed update-related activity.
Probe Update Status (Pie Chart)
This pie chart provides a visual representation of the overall distribution of probe update states, such as pending, in progress, completed, and failed. It helps users quickly understand the update status across all probes.
Probe Installation Status
This panel displays a table summarizing the installation status of probes by probe type.
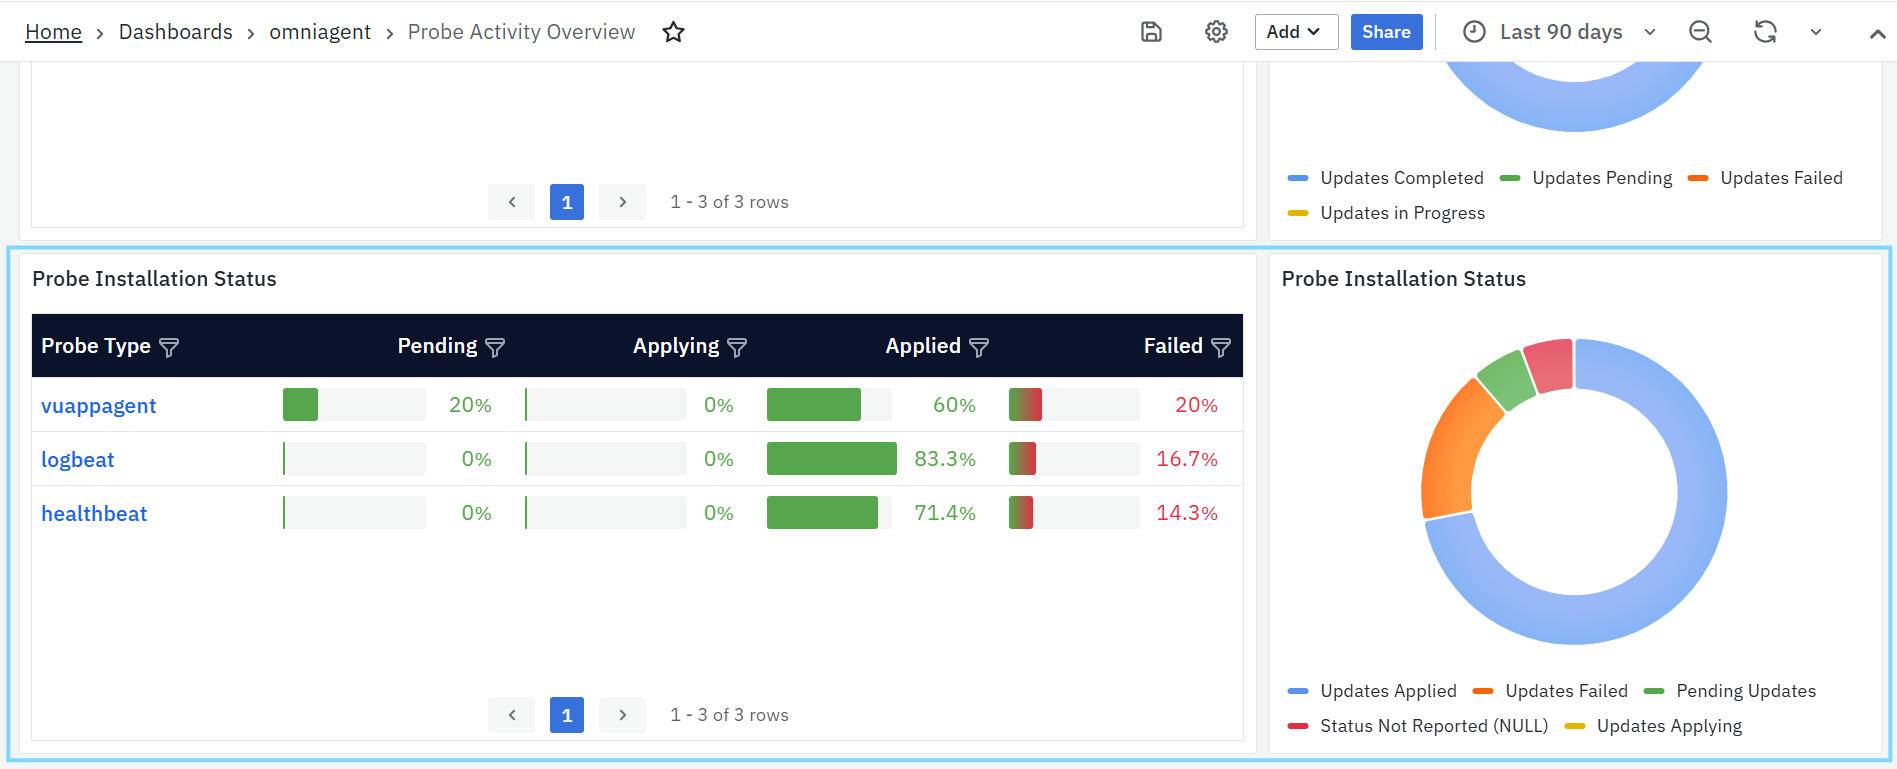
- Probe Type: Indicates the type of probe.
- Pending: Number of probes awaiting installation.
- Applying: Number of probes currently being installed.
- Applied: Number of probes that have been installed successfully.
- Failed: Number of probes where installation has failed.
Clicking on a Probe Type navigates the user to the Probe Audit Log dashboard for detailed installation-related activity.
Probe Installation Status (Pie Chart)
This pie chart provides a visual representation of the distribution of probe installation states, including pending, in progress, completed, and failed. It enables quick assessment of probe installation progress.
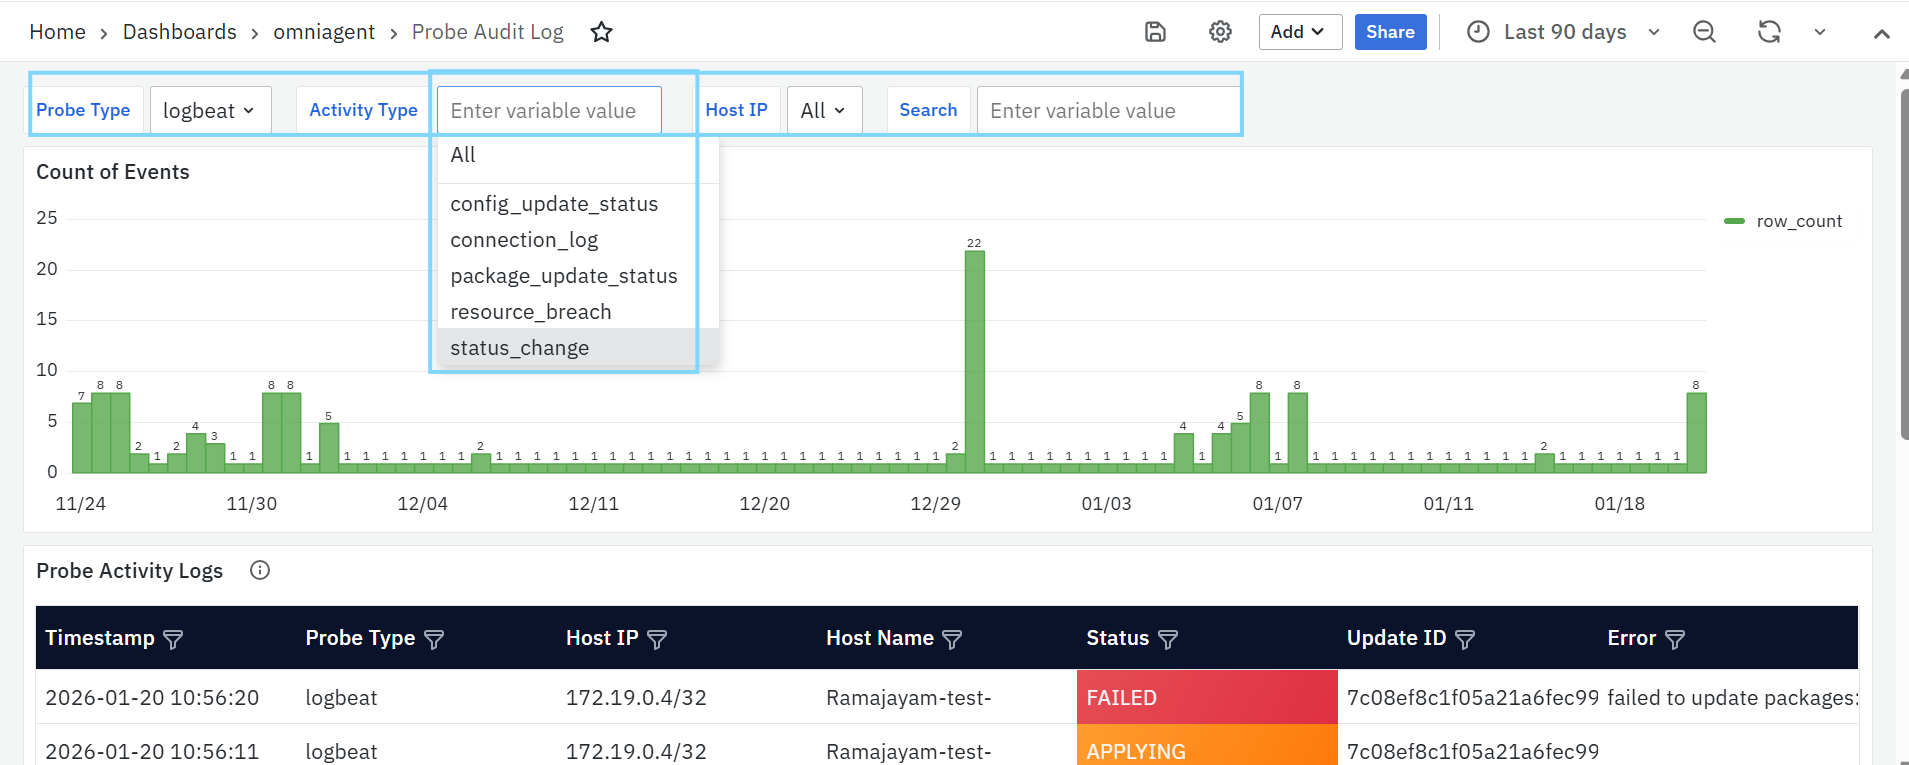
Probe Audit Log Dashboard
The Probe Audit Log dashboard provides a detailed view of probe-related activities captured over time. It is used to audit probe behavior, track update and configuration changes, monitor connection events, and investigate failures or resource-related issues. Use the following filters are available to narrow down audit log data:

-
Probe Type: Allows users to filter logs based on the probe type.
-
Activity Type: Filters audit logs based on the type of activity recorded. Available activity types include:
- Config_update_status: Logs related to configuration updates.
- Connection_log: Logs related to probe connectivity events.
- Package_update_status: Logs related to probe package updates.
- Resource_breach: Logs related to resource threshold breaches.
- Status_change: Logs related to probe status transitions.
-
Host IP: Allows users to filter audit logs for one or more specific host IP addresses. Multiple IPs can be selected to view combined activity.
-
Search: Enables free-text search to find specific values across the audit logs, such as host names, update IDs, or error messages.
Count of Events
This panel displays a time-based bar chart showing the number of probe-related events captured over the selected time range. It helps users identify activity trends, spikes, or anomalies in probe behavior.
Probe Activity Logs
This panel displays a detailed table of probe activity records.
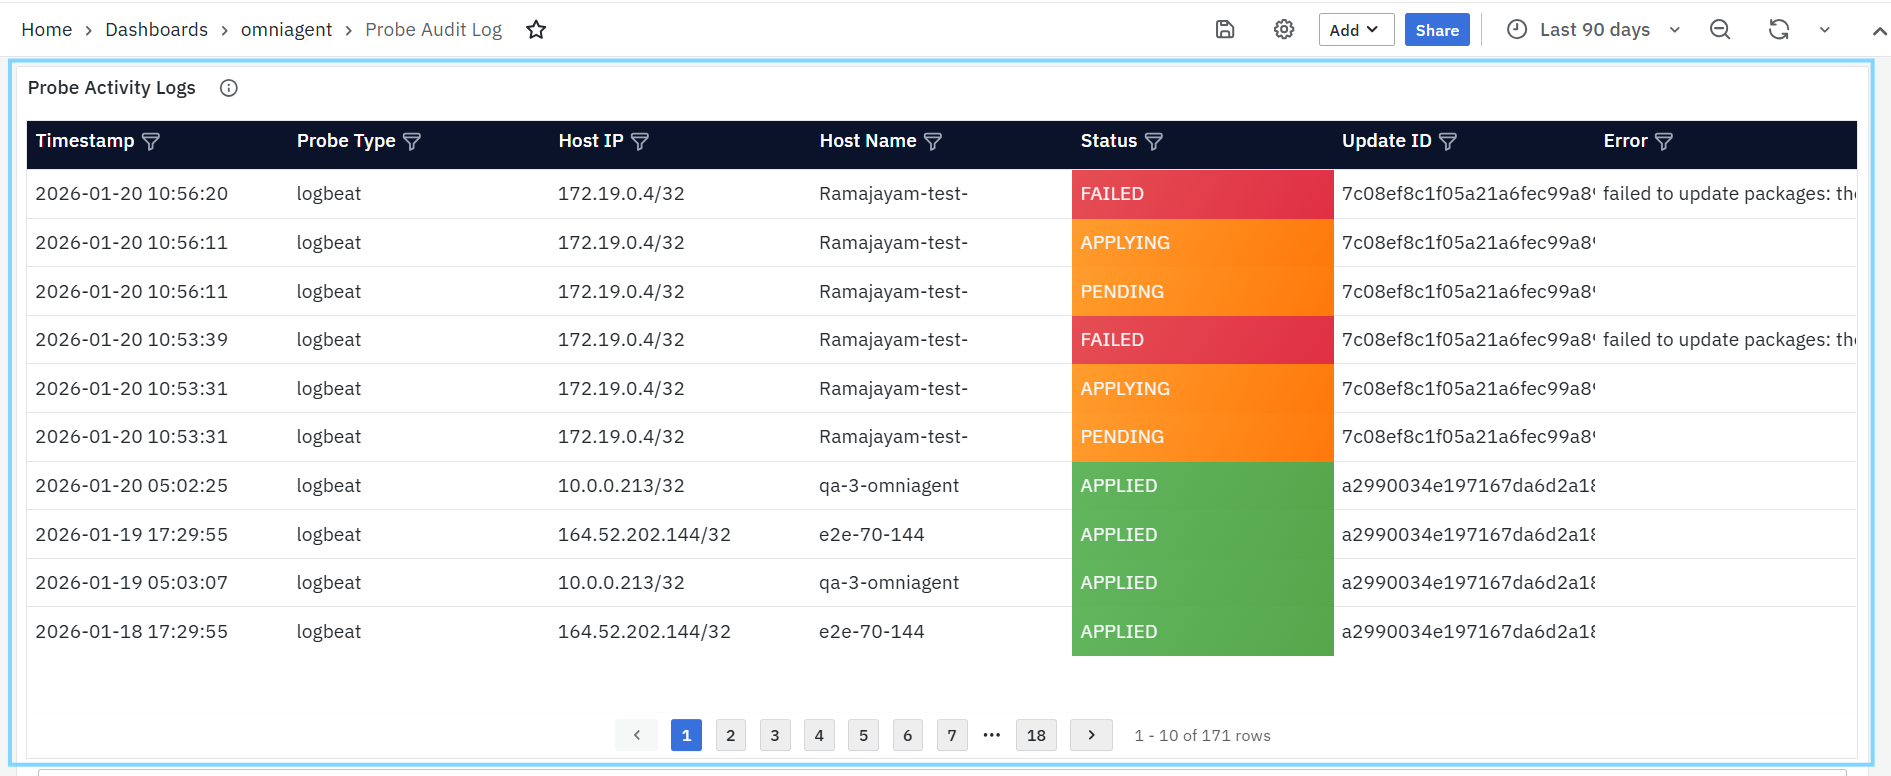
Columns include:
- Timestamp – Date and time when the event occurred.
- Probe Type – Type of probe generating the event.
- Host IP – IP address of the host where the probe is running.
- Host Name – Host name associated with the probe.
- Status – Current status of the activity (for example, Pending, Applying, Applied, Failed).
- Update ID – Identifier associated with the update operation.
- Error – Error details, if the activity resulted in a failure.
This table is primarily used for troubleshooting and audit purposes.
OmniAgent API Keys
The OmniAgent API Keys dashboard provides visibility into the API keys used by OmniAgent for secure authentication and communication with the platform. This dashboard helps users track active API keys and verify their status.
API Keys
This panel displays a tabular view of all API keys associated with OmniAgent.
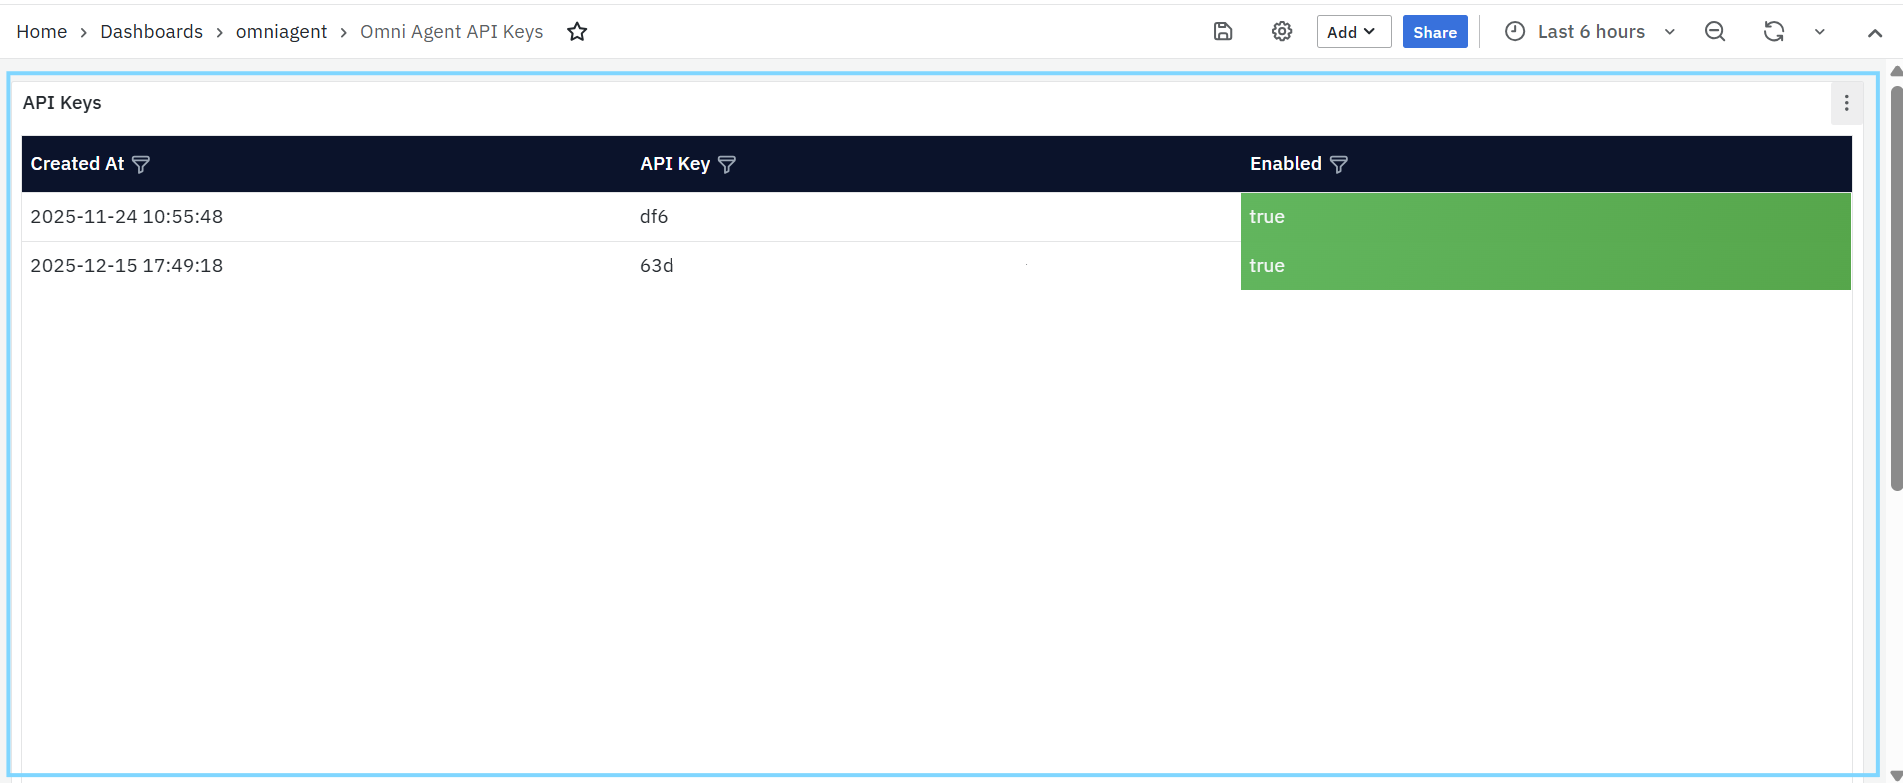
- Created At: Shows the date and time when the API key was generated.
- API Key: Displays the unique identifier of the API key used by OmniAgent for authentication.
- Enabled Indicates whether the API key is currently active.
- true – The API key is enabled and can be used for communication.
This panel allows users to quickly verify the availability and status of API keys used by OmniAgent.
