Host Landscape Management
Summary Tab
Purpose of the Summary Tab
The Summary tab provides a quick overview of the discovered inventory in the Host Landscape. It helps users understand the current state of hosts, entities, environments, host groups, infrastructure types, discovery sources, and monitoring status at a glance. This tab is useful for validating whether discovery and onboarding are progressing as expected after installing and registering the OmniAgent.
Summary Tab Overview
The Summary tab contains the following sections:
- Total Inventory
- Infrastructure Types
- Discovery Sources (Hosts)
- Entity Monitoring Status
- Environments Summary
These sections provide a high-level view of the discovered infrastructure and the current monitoring state of the entities.
Operationally, users typically use the Summary tab as a quick health and inventory overview page to validate whether discovery and onboarding are functioning as expected, identify monitoring gaps, review infrastructure distribution, and understand the overall state of the Host Landscape before moving to detailed host or entity-level investigation.
Total Inventory
The Total Inventory section provides a consolidated view of all discovered resources managed by Auto Discovery & Instrumentation (ADI). The inventory includes discovered hosts, application services, runtime components, infrastructure entities, associated technologies, monitoring status, and discovery information. This centralized inventory enables administrators to track discovered assets, understand their monitoring state, and manage the complete lifecycle of monitored infrastructure from a single interface.

This section includes:
- Hosts – Total number of discovered hosts
- Entities – Total number of discovered entities
- Environments – Total number of environments associated with the inventory
- Host Groups – Total number of host groups associated with the inventory
Infrastructure Types
The Infrastructure Types section shows the type of infrastructure represented by the discovered hosts.
This helps users identify the type of systems currently present in the inventory, such as:
- Virtual Machines
- Physical Servers
- Other supported infrastructure types
Discovery Sources (Hosts)
The Discovery Sources (Hosts) section shows how the hosts were discovered or added to the platform.

For example, hosts may be discovered through:
- OmniAgent
Entity Monitoring Status
The Entity Monitoring Status section provides a consolidated summary of the current monitoring state of all discovered entities in the Host Landscape. It helps administrators quickly understand the onboarding progress, monitoring health, and any issues affecting discovered components.
This section includes the following monitoring states:
| Status | Description |
|---|---|
| Monitoring | The entity is successfully onboarded, monitoring is active, and telemetry is being collected. |
| In Progress | The monitoring onboarding process is currently in progress. |
| Blocked By Policy | Monitoring has not been initiated because the entity is excluded or restricted by the configured monitoring policy. |
| Pending | The entity has been discovered but monitoring has not yet started or is awaiting further processing. |
| Issues | The entity has encountered one or more monitoring or onboarding issues that require user attention. |
| Stale | The entity is no longer reporting telemetry within the expected time and is considered inactive or out of date. |
| Restart Required | The monitored component requires a restart before monitoring or instrumentation changes can take effect. |
The time required for onboarding depends on the environment, discovery volume, and monitoring configuration. If an entity remains in In Progress, Pending, Issues, Stale, or Restart Required for an extended period, verify the OmniAgent and probe health, review the monitoring configuration, and take the appropriate corrective action from the Host Landscape.
Environments Summary
The Environments Summary section shows how the discovered hosts and entities are distributed across environments.
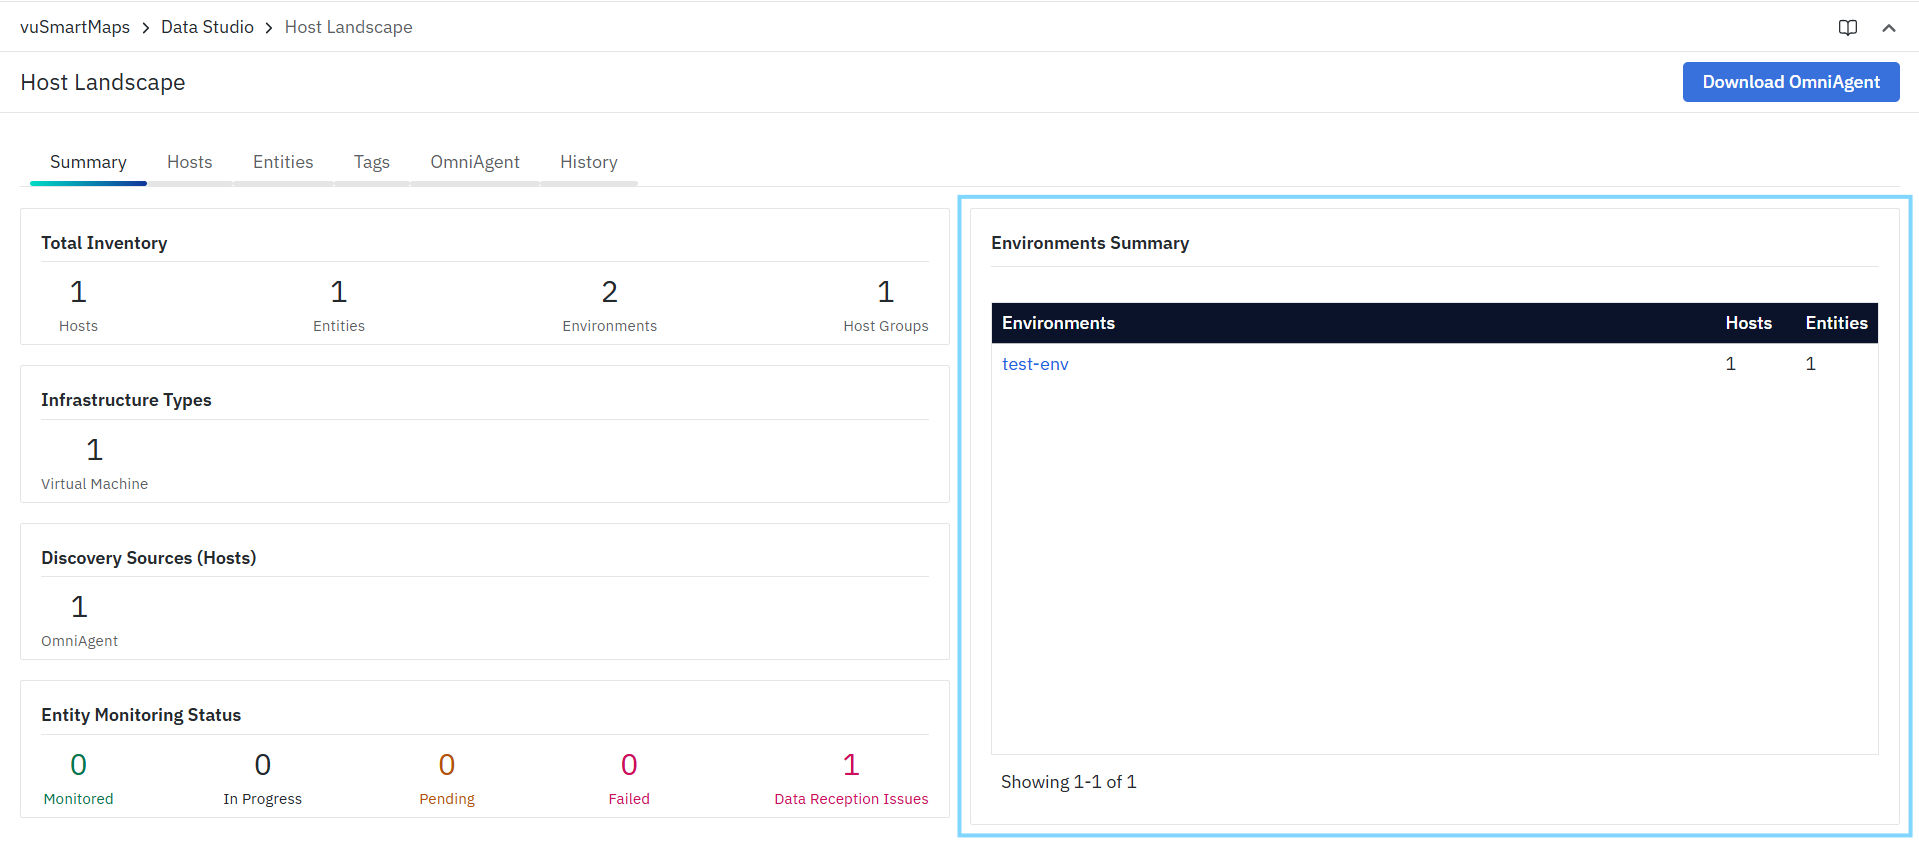
This section typically displays:
- Environment Name
- Hosts – Number of hosts in the environment
- Entities – Number of entities in the environment
Hosts Tab
Purpose of the Hosts Tab
The Hosts tab provides a detailed list of discovered hosts in the Host Landscape. It helps users review host-level inventory details, verify environment and host group associations, monitor onboarding status, and perform host-specific management actions.

This tab is useful for:
- Reviewing discovered infrastructure nodes
- Searching and filtering hosts
- Checking host-level and entity-level monitoring status
- Validating environment and host group mapping
- Managing host configuration and associations
- Exporting the current host view for reporting or review
Hosts Tab Overview
The Hosts tab displays discovered hosts in a tabular format and provides tools to search, filter, refresh, export, and manage host records.

Search Hosts
The Search field allows you to quickly locate hosts in the table.
You can search using:
- Host IP
- Host name / hostname
The search supports partial matches and updates the table dynamically as you enter a value. Search behavior may vary slightly depending on the data source and deployment configuration. Use search when you want to quickly locate a specific host without manually scanning the full list.
Filter Hosts
The filter bar allows you to narrow the list of displayed hosts based on specific inventory and monitoring criteria. The following filters are available:
- Environments: Use this filter to view only hosts belonging to a specific environment, such as Development, Test, Staging, Production
- Host Group: Use this filter when you want to review hosts that belong to a specific logical grouping or operational category.
- Host Monitoring Status Filters hosts based on the current host-level monitoring state. This helps identify whether the host itself is currently onboarded, active, or requires attention.
- Entity Monitoring Status: Filters hosts based on the monitoring state of the entities discovered under each host.
- Infra Type: Use this filter to focus on a specific infrastructure category.
- Sources: Use this filter to isolate hosts discovered through a specific inventory source.
Refresh
The Refresh action reloads the Hosts tab and fetches the latest available host inventory and status information.

Use Refresh when:
- A host was recently onboarded
- Environment or host group mappings were updated
- Monitoring status has changed
- You want to validate the latest discovery state
Export
The Export action downloads the currently visible host list based on the active filters and search criteria.
Depending on the deployment configuration and platform support, the export is typically generated in a spreadsheet-compatible format such as CSV or Excel.
Use Export when you want to:
- Share the current host inventory view
- Review hosts offline
- Generate a report for operational review
- Preserve filtered results for troubleshooting or audit discussions
Hosts Table
The Hosts table lists each discovered host as a separate row. Each row provides infrastructure-level details and current monitoring information for that host.

- Host IP: Displays the IP address of the discovered host.
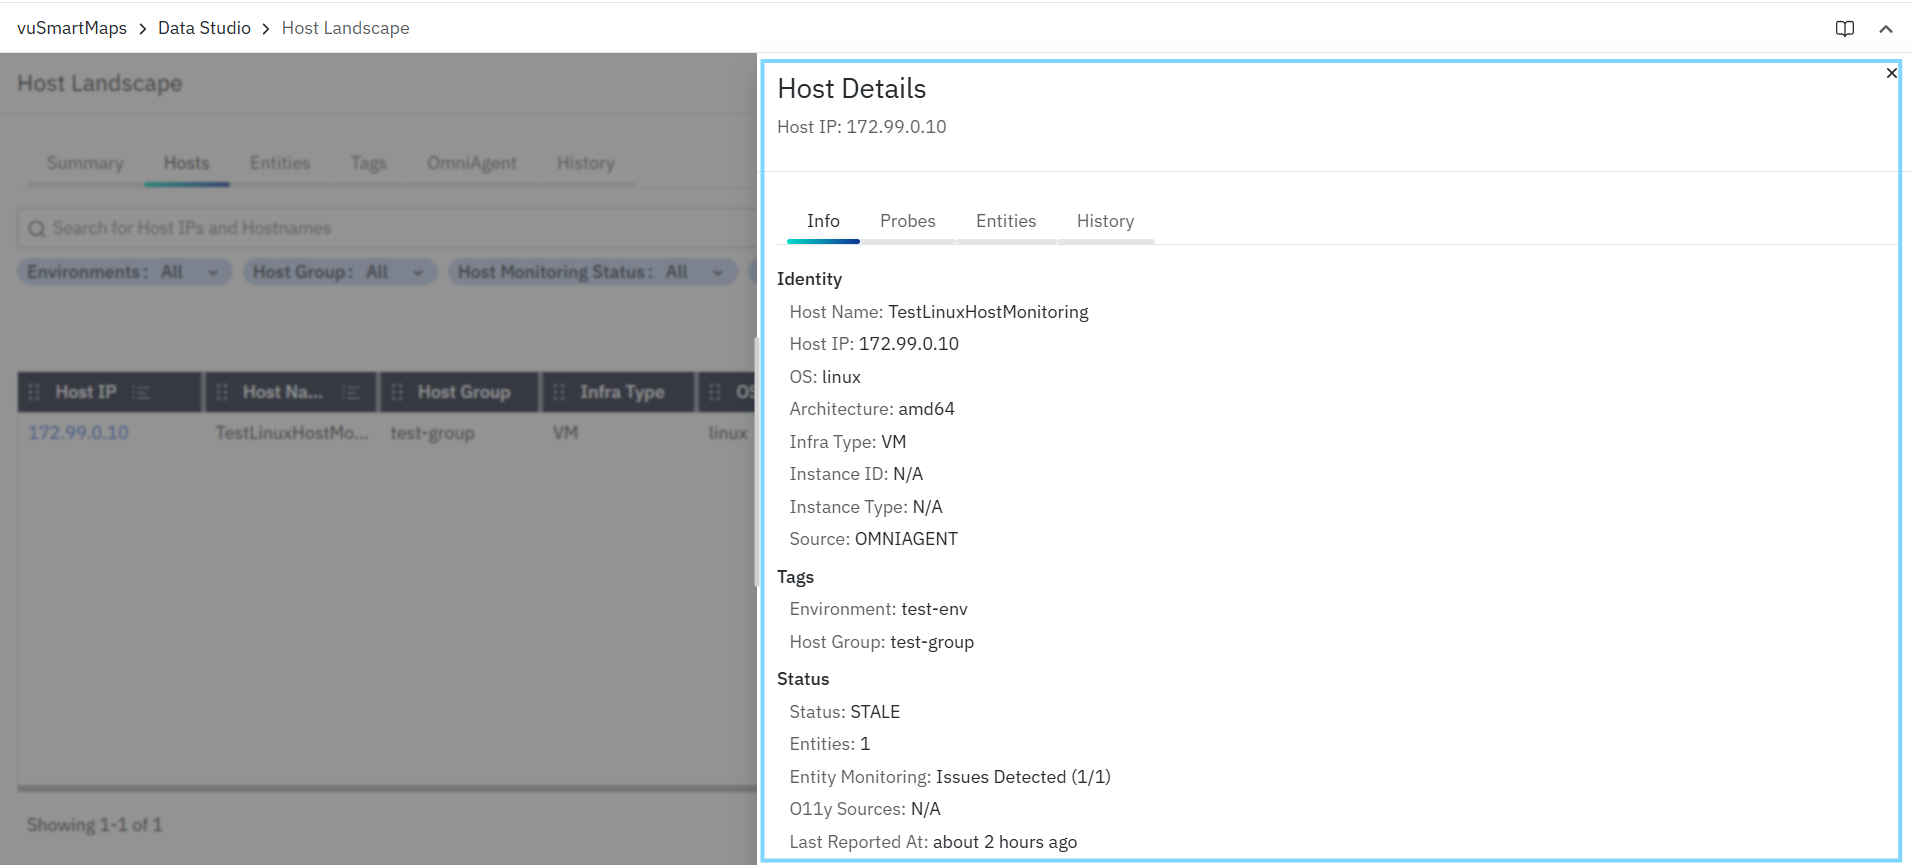
- Host IP is clickable. Clicking the Host IP opens the Host Details panel for the selected host.
-
The Host Details panel provides a consolidated view of host-level information and operational details for the selected host. It is useful for quickly reviewing host identity, monitoring components, discovered entities, and activity history from a single place. The Host Details panel contains the following tabs:
- Info – Displays key host identification, tags, and current status information.
- Probes – Displays the probes associated with the host, including their health, status, and reporting details.
- Entities – Displays the entities discovered under the selected host.
- History – Displays the activity and event history related to the host and its monitored components.
- Info – Displays key host identification, tags, and current status information.
-
Host Name: Displays the discovered host name or hostname.
-
Host Group: Displays the host group currently associated with the host.
-
Infra Type: Displays the infrastructure type of the host. Examples include:
- VM for virtual machine
- Other supported host infrastructure categories
-
OS: Displays the operating system identified for the host. Examples may include:
- Linux
- Windows
-
Host Monitoring Status: Displays the current monitoring or reporting state of the host. Examples may include:
- In Progress – Host onboarding or monitoring setup is still in progress
- Not Reporting – The Host Landscape is not receiving the expected telemetry or reporting information from the host.
noteThe threshold for a Not Reporting state is 5 minutes.
-
Entity Monitoring Status: Displays the monitoring state of entities discovered under the host. Examples may include:
- Monitored (x/y) – Indicates the number of entities currently monitored out of the total discovered entities
- Issues Detected (x/y) – Indicates that one or more entities under the host currently have onboarding or monitoring issues
-
Environment: Displays the environment currently associated with the host.
-
Sources: Displays the discovery source used to bring the host into the Host Landscape. For example:
- OmniAgent
-
O11ySources Enabled:Displays whether O11ySources-based monitoring or source-level observability configuration is enabled for the host.
-
Last Reported: Displays the most recent time the platform received data or a status update from the host. Examples may include:
- A few minutes ago
- About 1 hour ago
- Other relative time values based on the latest received update
-
Actions: The Actions column provides host-level management options for the selected host. The following actions are available:
Edit Host
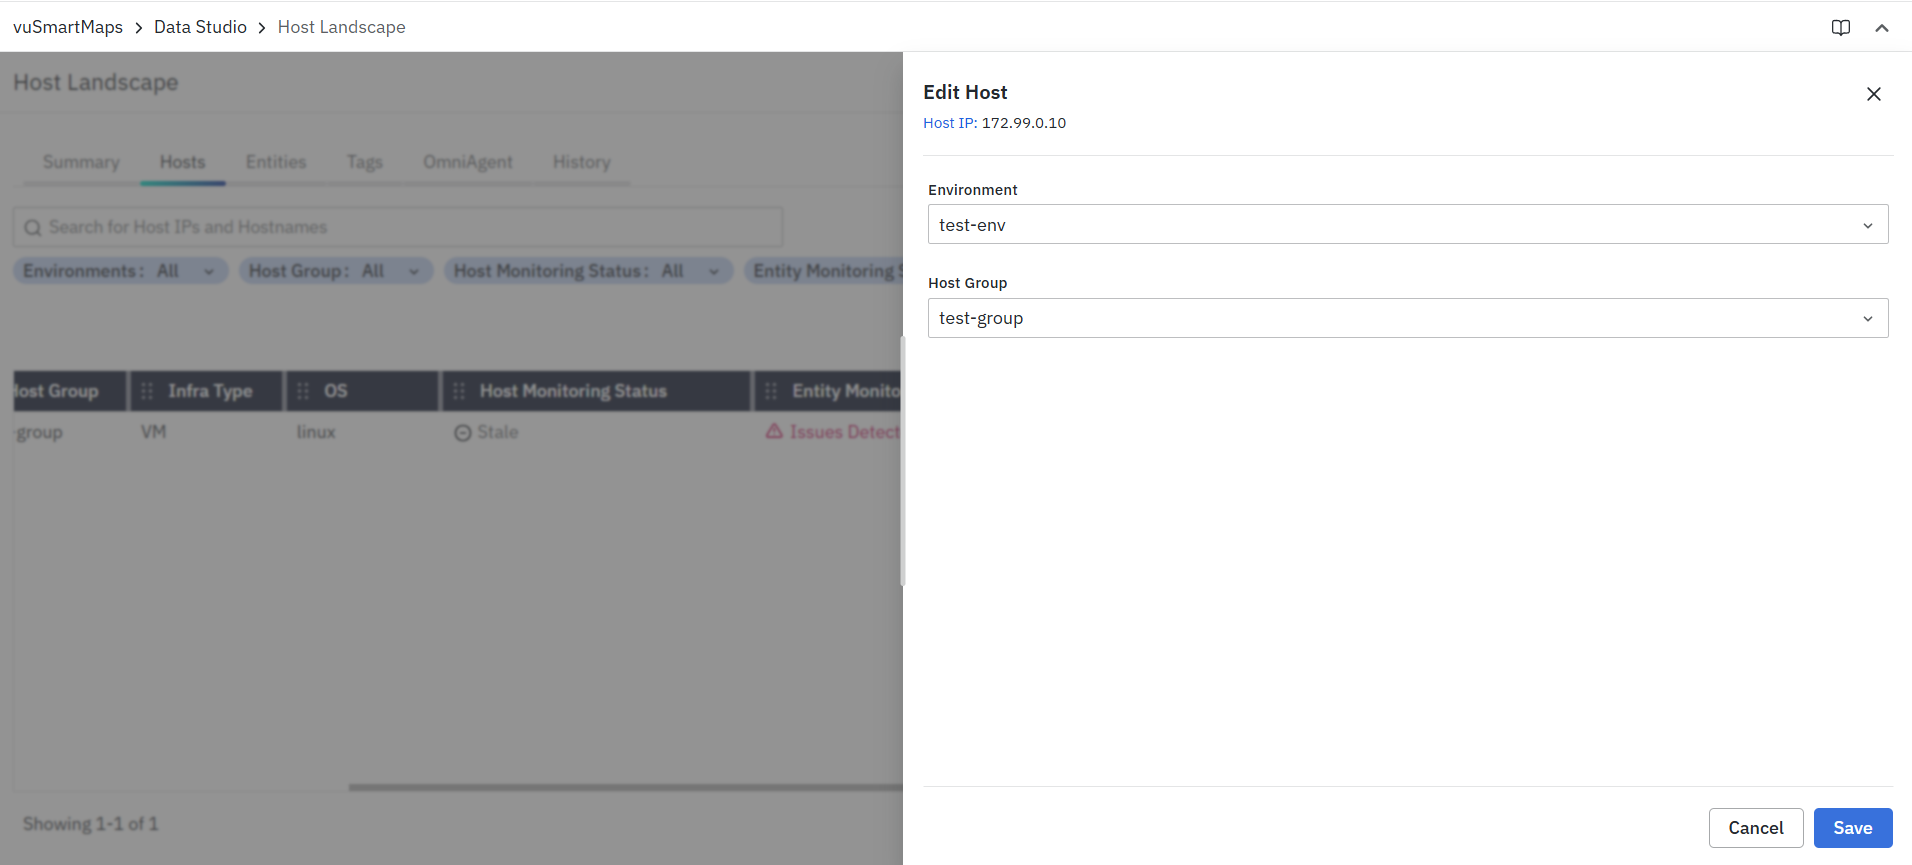
The Edit action opens the Edit Host panel for the selected host.
Edit Host Workflow
- In the Hosts tab, locate the required host.
- Click the Edit icon in the Actions column.
- In the Edit Host panel, review the current Host IP.
- Select the required Environment.
- Select the required Host Group.
- Click Save to apply the changes.
Updating environment or host group changes how the host is organized in the Host Landscape and can affect filtering, reporting, and policy-driven workflows.
Manage Config
The Manage Config action opens the Manage Config panel for the selected host.This allows you to define host-level monitoring behavior for the selected host.

This can be used to:
- Enable monitoring for specific technologies
- Disable monitoring for specific technologies
- Override inherited behavior for the host
- Temporarily stop monitoring collection for the host
- Restore default behavior when needed
The configuration is displayed as a technology or component list, where each item can be explicitly set to Enabled or Disabled.
Delete Host
Decommissioning should be performed for hosts or entities that are permanently removed from the monitored environment. Removing a host deletes it from the active Host Landscape inventory while preserving historical monitoring and discovery records where applicable for operational analysis and auditing.
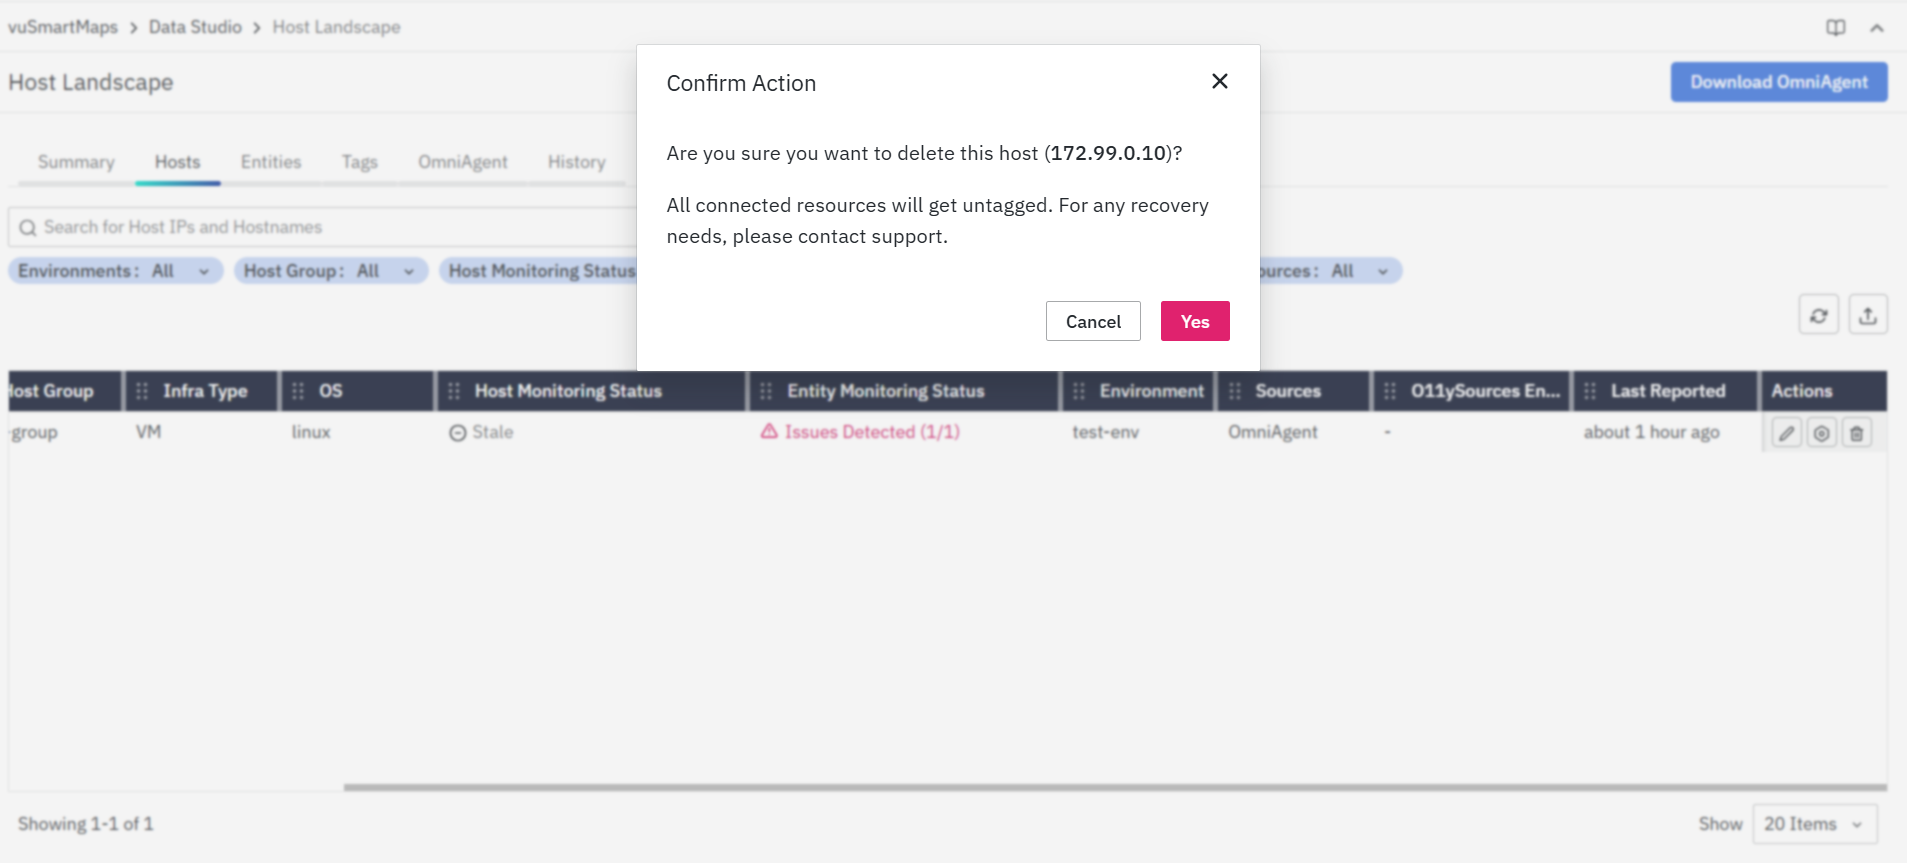
Use Delete when:
- A host has been decommissioned
- A host was onboarded incorrectly
- A stale or invalid host record should be removed
- You want to clean up unused inventory entries
Before deleting a host:
- Verify that the host is no longer required
- Confirm that the record is not still actively reporting
- Ensure the host is not needed for ongoing monitoring or troubleshooting
Deleting a host removes it from the current Host Landscape inventory view. Use this action carefully.
Entities Tab
Purpose of the Entities Tab
The Entities tab provides a detailed list of discovered entities in the Host Landscape. It helps users review entity-level inventory details, verify host and environment associations, monitor onboarding status, and perform entity-specific management actions.
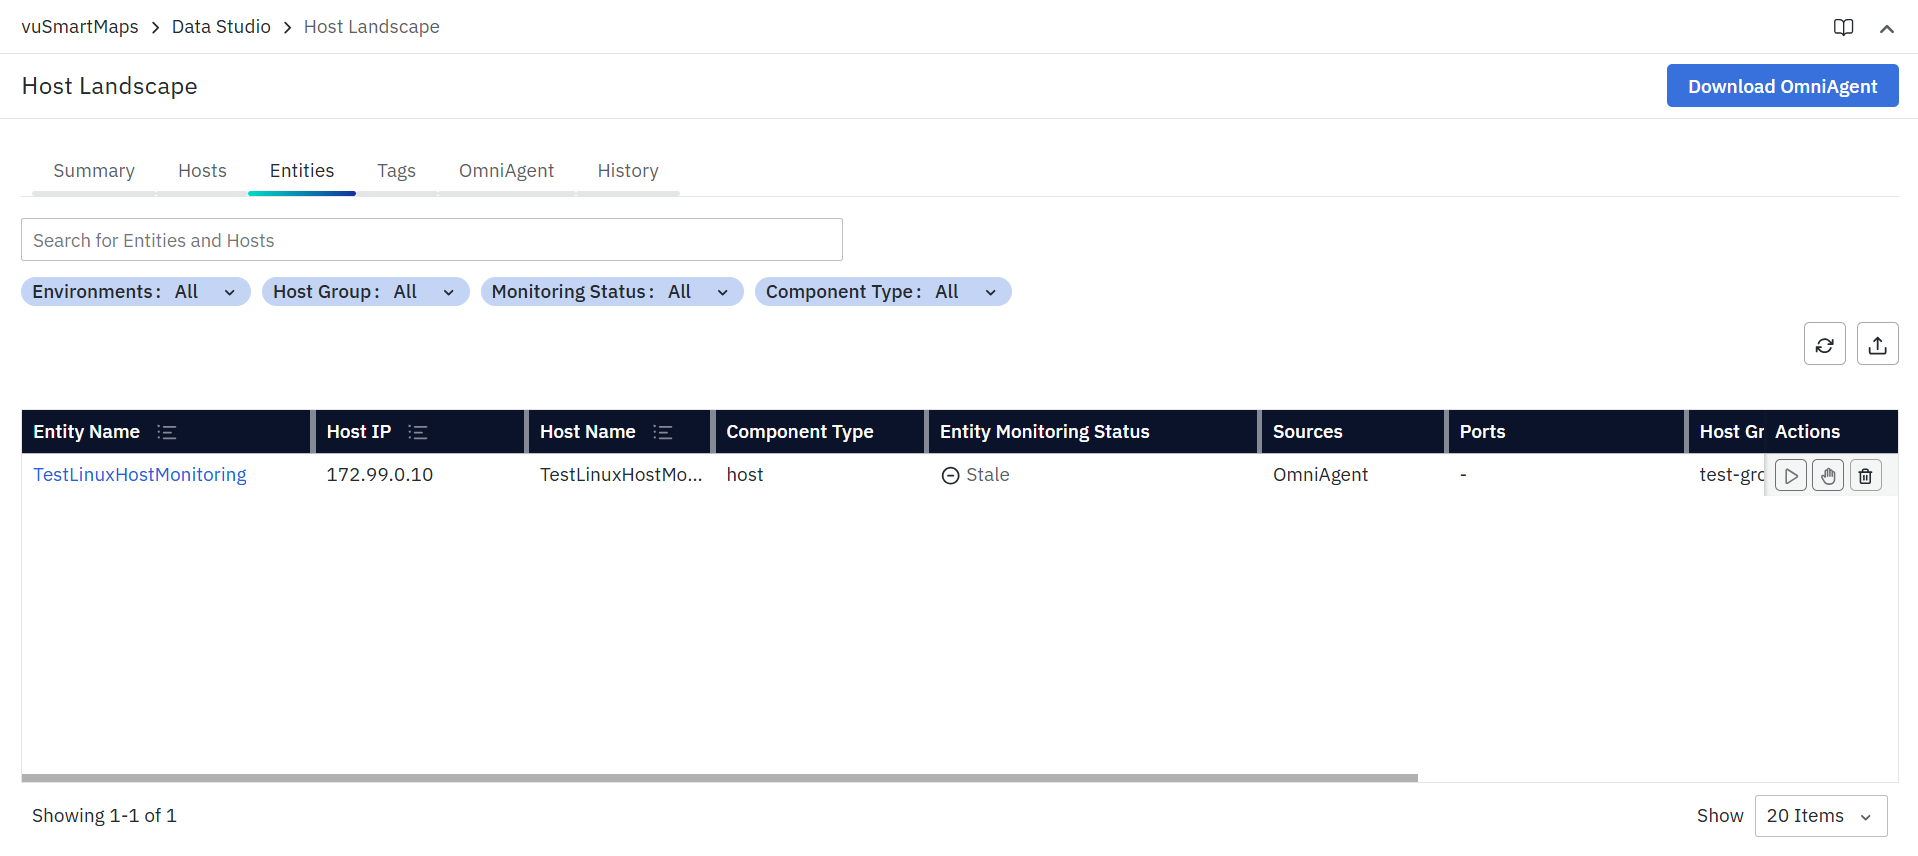
This tab is useful for:
- Reviewing discovered entities
- Searching and filtering entities
- Checking entity-level monitoring status
- Validating host, environment, and host group mapping
- Managing monitoring actions for individual entities
- Exporting the current entity view for reporting or review
Entities Tab Overview
The Entities tab displays discovered entities in a tabular format and provides tools to search, filter, refresh, export, and manage entity records.
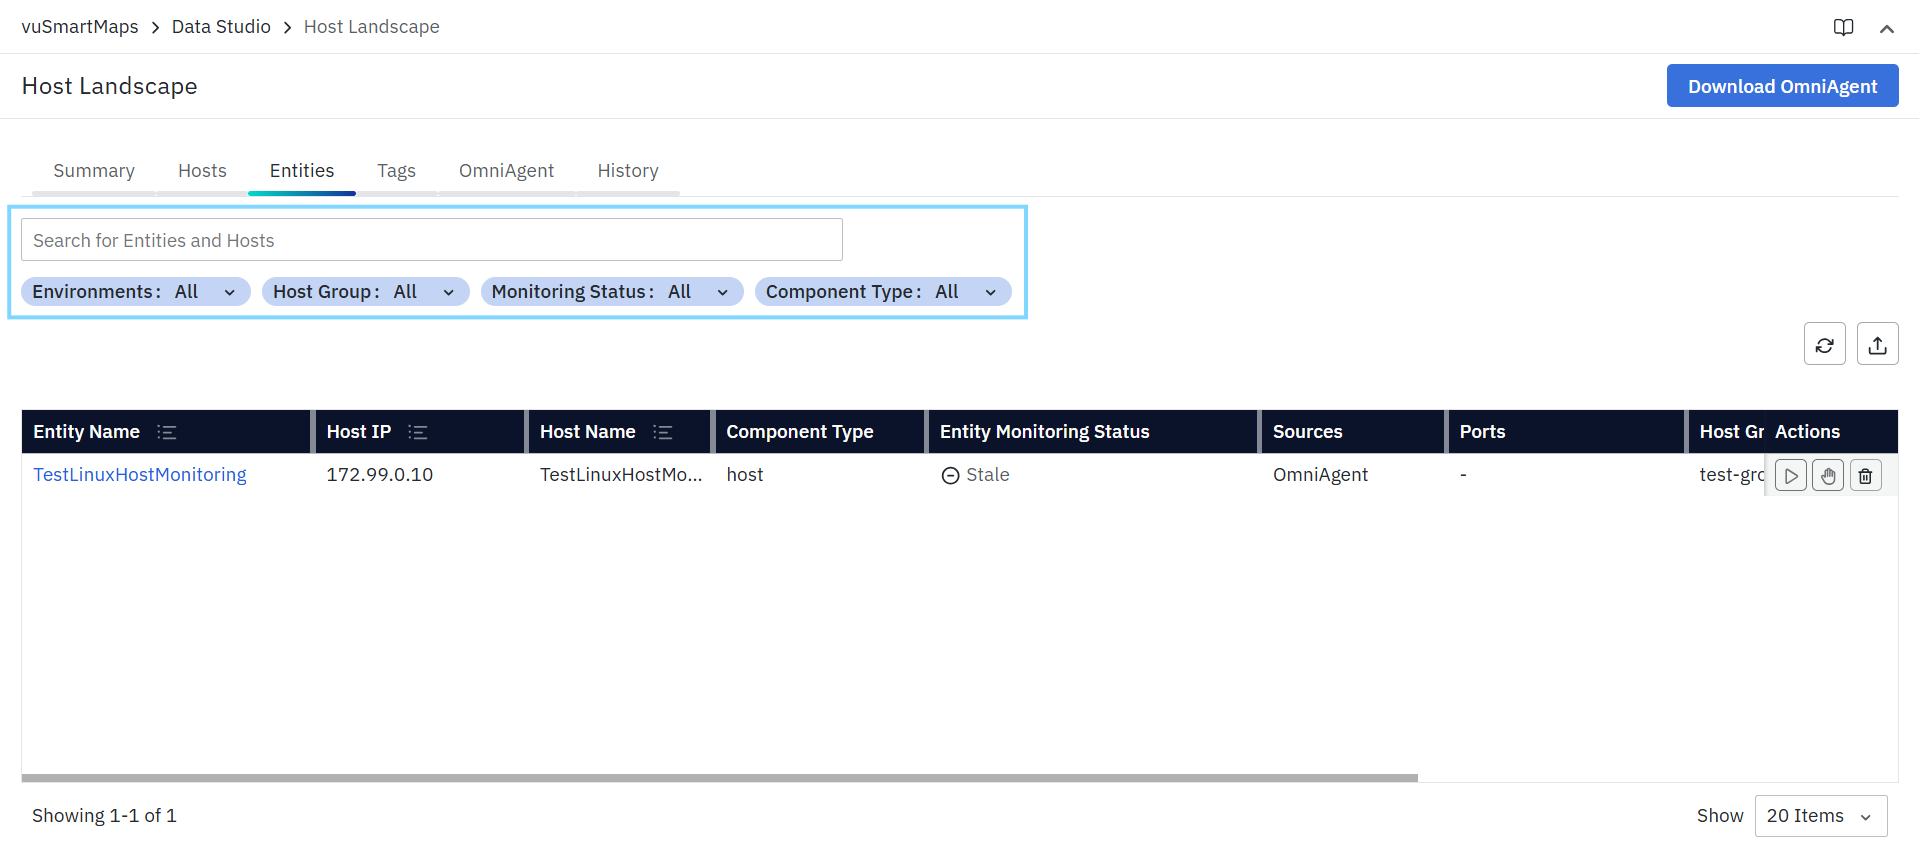
Search Entities
The Search field allows you to quickly locate entities in the table.
You can search using:
- Entity name
- Host IP
- Host name/hostname
The search supports partial matches and dynamically updates the table as you enter a value. Search is typically performed using a single search input at a time and is intended for quickly locating matching entities across the supported fields. Use search when you want to quickly locate a specific entity without manually scanning the full list.
Filter Entities
The filter bar allows you to narrow the list of displayed entities based on specific inventory and monitoring criteria. The following filters are available:
- Environments: Use this filter to view only entities belonging to a specific environment, such as Development, Test, Staging, or Production.
- Host Group: Use this filter when you want to review entities associated with hosts that belong to a specific logical grouping or operational category.
- Monitoring Status: Filters entities based on the current entity-level monitoring state. This helps identify whether the entity is currently monitored, stale, or requires attention.
- Component Type: Use this filter to focus on a specific discovered component category.
Refresh
The Refresh action reloads the Entities tab and fetches the latest available entity inventory and status information.
Depending on the deployment configuration and UI behavior, the table may not automatically refresh in real time. Use the Refresh action to manually retrieve the latest available discovery, onboarding, and monitoring status information.

Use Refresh when:
- An entity was recently discovered
- Monitoring status has changed
- A monitoring action was recently performed
- You want to validate the latest discovery or onboarding state
Export
The Export action downloads the currently visible entity list based on the active filters and search criteria.
Use Export when you want to:
- Share the current entity inventory view
- Review entities offline
- Generate a report for operational review
- Preserve filtered results for troubleshooting or audit discussions
Entities Table
The Entities table lists each discovered entity as a separate row. Each row provides component-level details and current monitoring information for that entity.
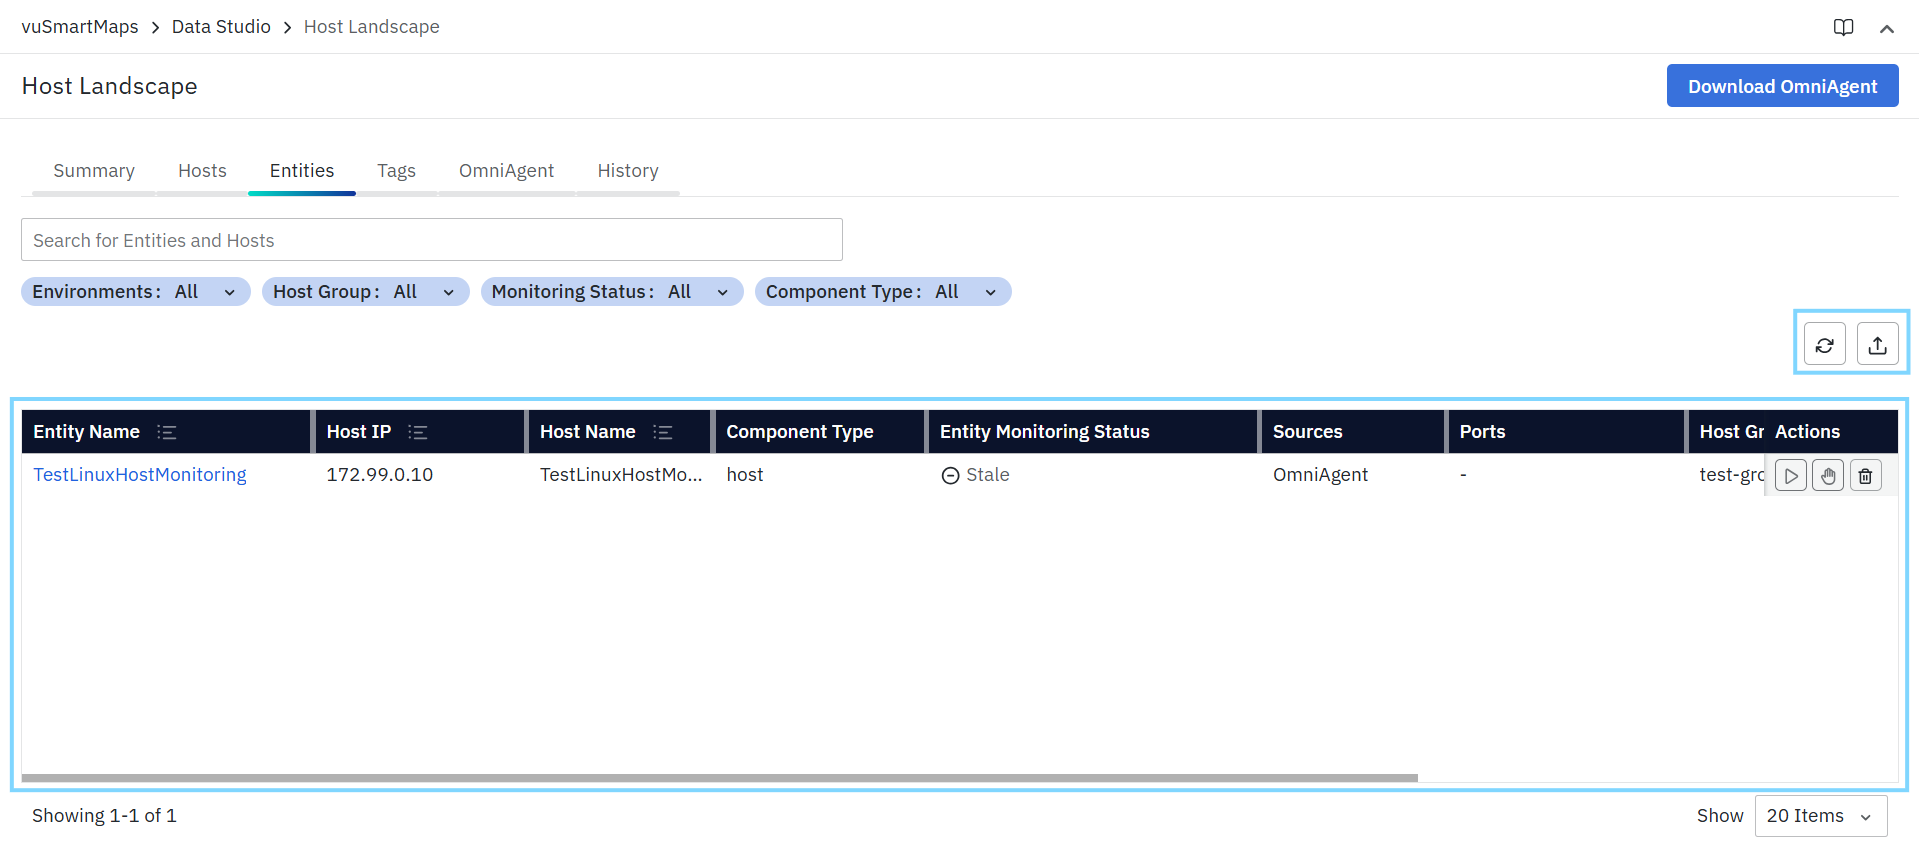
- Entity Name: Displays the name of the discovered entity.
- Entity Name is clickable. Clicking the Entity Name opens the Entity Details panel for the selected entity.
- The Entity Details panel provides a consolidated view of entity-level information and operational details for the selected entity. It is useful for quickly reviewing entity identity and activity history from a single place.

- The Entity Details panel contains the following tabs:
- Info – Displays key entity identification details for the selected entity.
- History – Displays the activity and event history related to the selected entity.
- Info – Displays key entity identification details for the selected entity.
- Host IP: Displays the IP address of the host on which the entity was discovered.
- Host Name: Displays the name of the host associated with the discovered entity.
- Component Type: Displays the type of discovered component represented by the entity. Examples may include:
- host for host-level discovered entities
- Other supported component categories
- Entity Monitoring Status: Displays the current monitoring or reporting state of the entity. Examples may include:
- In Progress – Entity onboarding or monitoring setup is still in progress
- Stale – The entity is present in inventory, but expected reporting or freshness conditions are not currently being met
- Other monitoring states based on the current lifecycle of the entity
- Sources: Displays the discovery source used to bring the entity into the Host Landscape. For example:
- OmniAgent
- Ports: Displays the port information associated with the discovered entity, if available. Examples may include:
- A specific port number
- A list of ports
- - when port information is not available or not applicable
- Host Group: Displays the host group currently associated with the host under which the entity was discovered.
- Environment: Displays the environment currently associated with the entity.
- Last Reported: Displays the most recent time the platform received data or a status update related to the entity. Examples may include:
- A few minutes ago
- About 2 hours ago
- Other relative time values based on the latest received update
- Actions: The Actions column provides entity-level management options for the selected entity. The following actions are available:
- Start Monitoring
- Stop Monitoring
- Delete
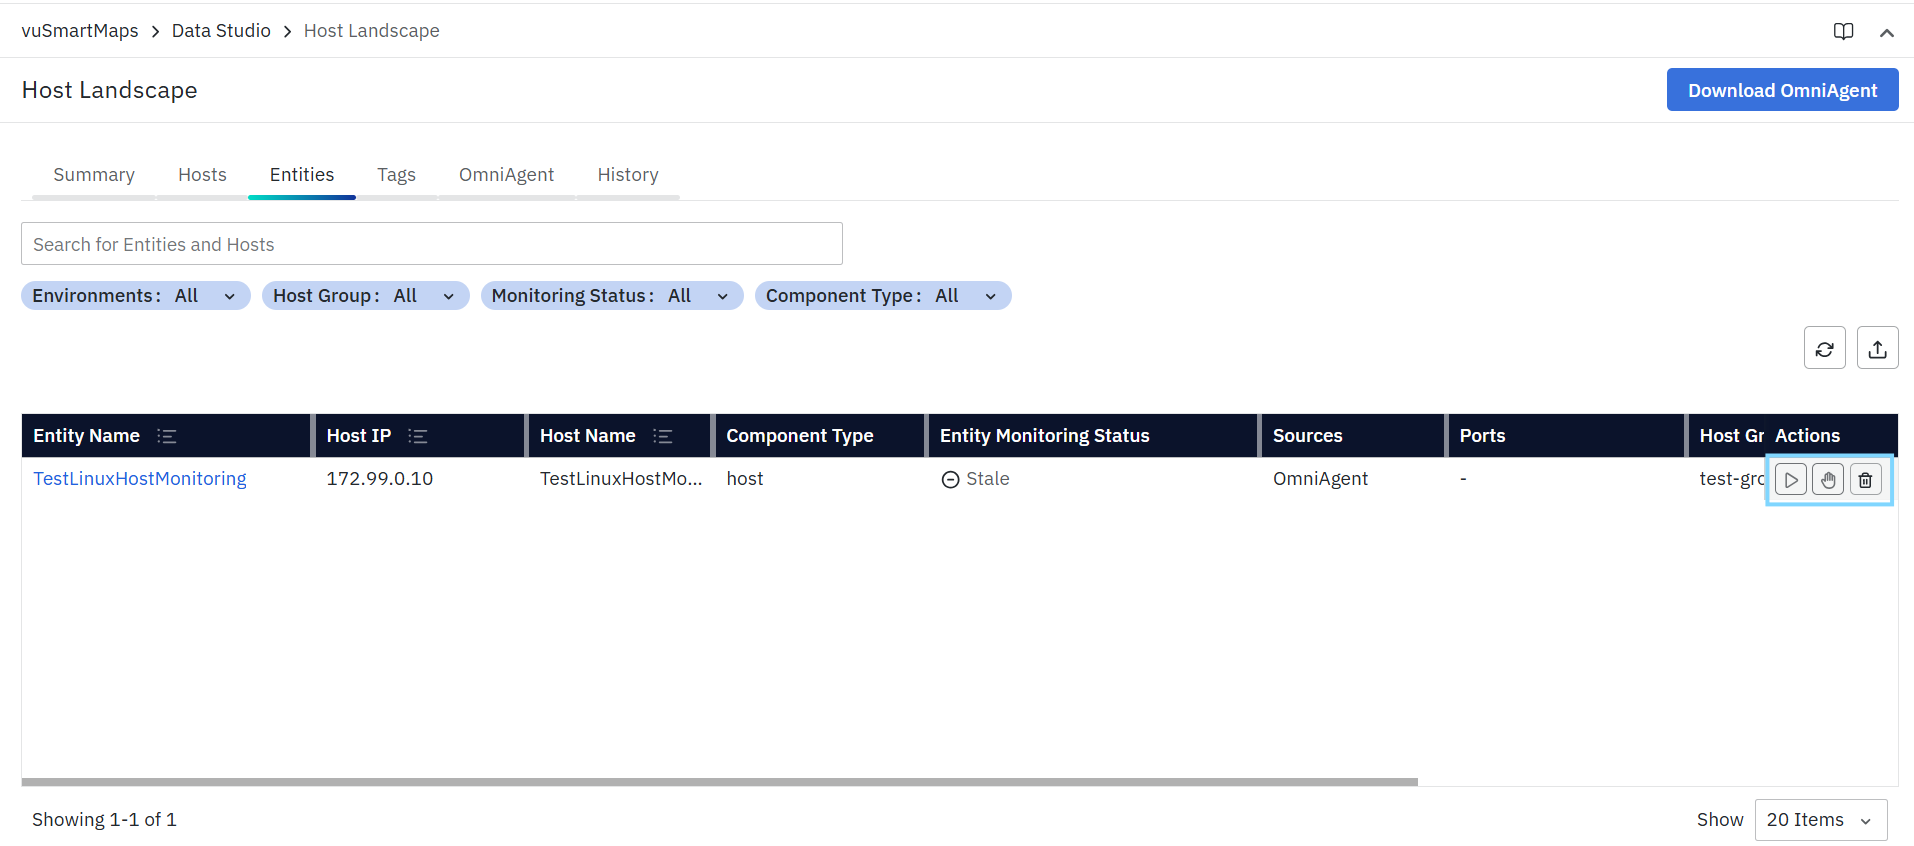
Start Monitoring
The Start Monitoring action initiates monitoring for the selected entity.
Use Start Monitoring when:
- An entity has been discovered but is not yet being actively monitored
- You want to begin observability for the selected component
- The entity requires onboarding into monitoring after discovery
After starting monitoring, the entity status may transition through intermediate onboarding states before it becomes fully monitored.
Stop Monitoring
The Stop Monitoring action stops monitoring for the selected entity.
Use Stop Monitoring when:
- Monitoring is no longer required for the entity
- You want to temporarily stop observability for the selected component
- The entity needs to be removed from active monitoring before reconfiguration
Stopping monitoring changes the current monitoring state of the entity and may affect how it appears in related inventory and monitoring views.
Delete Entity
The Delete action removes the selected entity from the Host Landscape inventory.
Use Delete when:
- An entity is no longer relevant
- A stale or invalid entity record should be removed
- A discovered entity was added incorrectly
- You want to clean up unused inventory entries
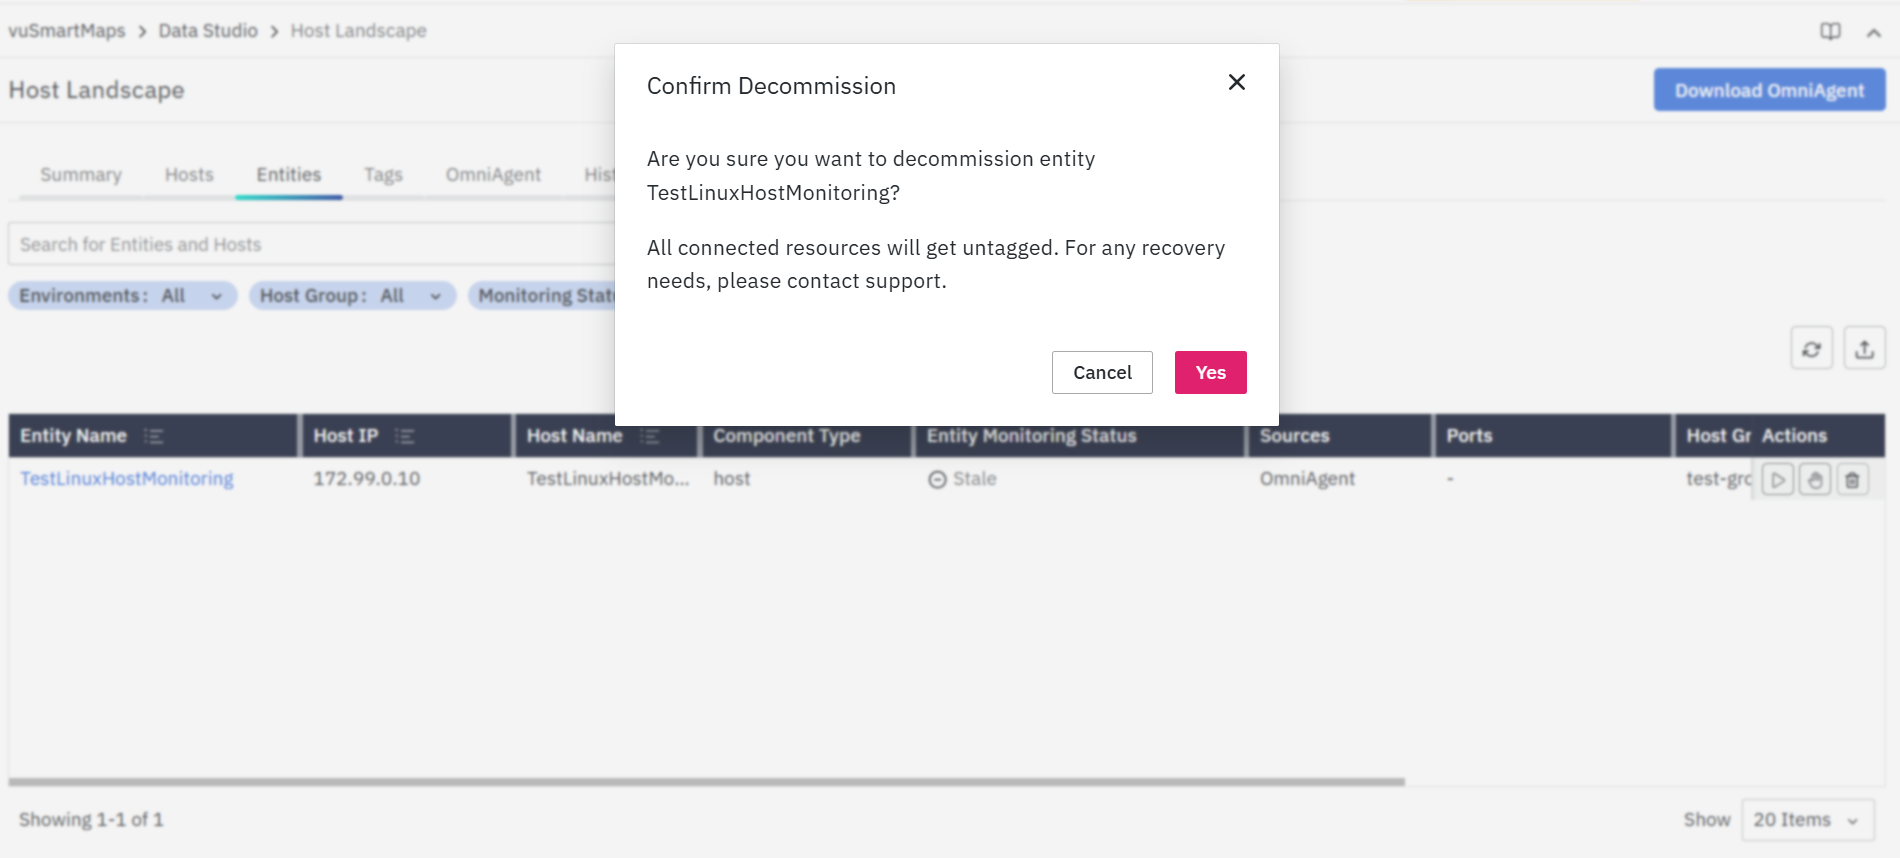
Before deleting an entity:
- Verify that the entity is no longer required
- Confirm that the record is not still actively reporting
- Ensure the entity is not needed for ongoing monitoring or troubleshooting
Deleting an entity removes it from the current Host Landscape inventory view. Use this action carefully.
Tags Tab
Purpose of the Tags Tab
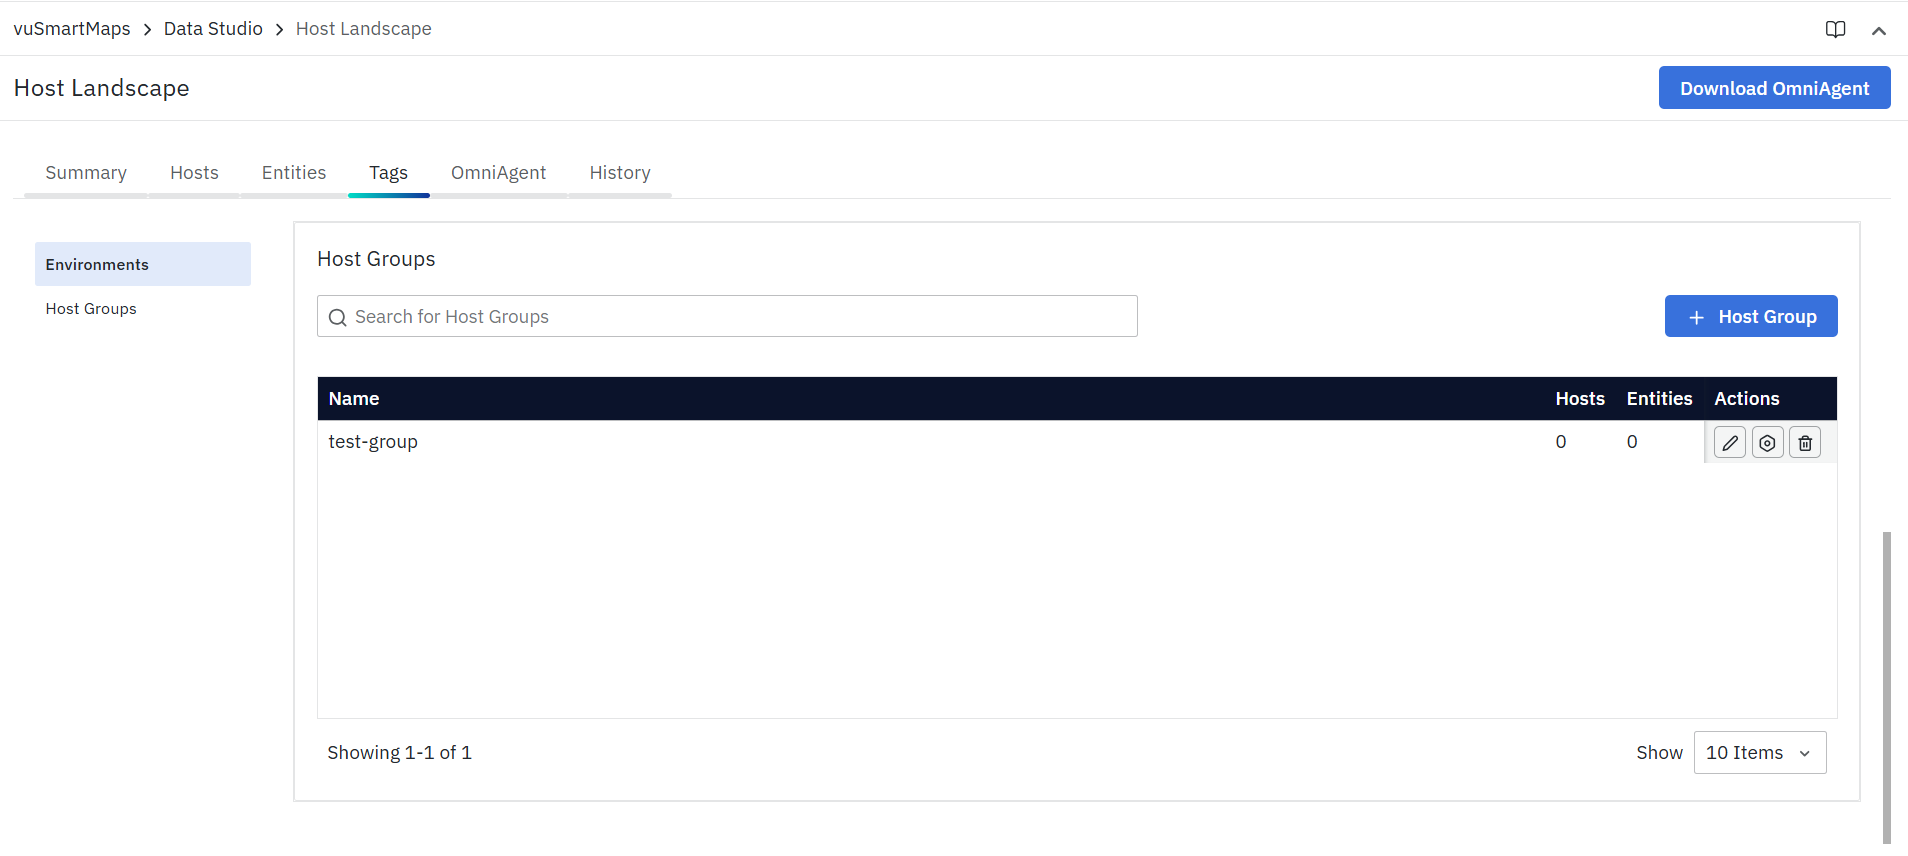
The Tags tab provides a centralized view to manage logical grouping labels used in the Host Landscape. It helps users create and manage Environments and Host Groups, which are used to organize discovered hosts and entities for easier filtering, inventory management, and policy-based monitoring control.
This tab is useful for:
- Managing environment tags used across discovered hosts and entities
- Managing host group tags used for logical host classification
- Creating new environments and host groups
- Searching existing environments and host groups
- Reviewing host and entity associations for each tag
- Managing tag-level monitoring policies
- Editing or deleting existing tags
Tags Tab Overview
The Tags tab contains two management panels:
Each panel provides:
- A search field
- An Add button
- A table listing the configured tags
- Host and entity counts
- Tag-level actions such as Edit, Manage Config, and Delete
Environments Panel
An Environment logically groups hosts that belong to the same deployment boundary, such as Production, UAT, Development, or Testing. Environments help organize discovered infrastructure and determine which discovery, onboarding, and monitoring policies are applied to the associated hosts.
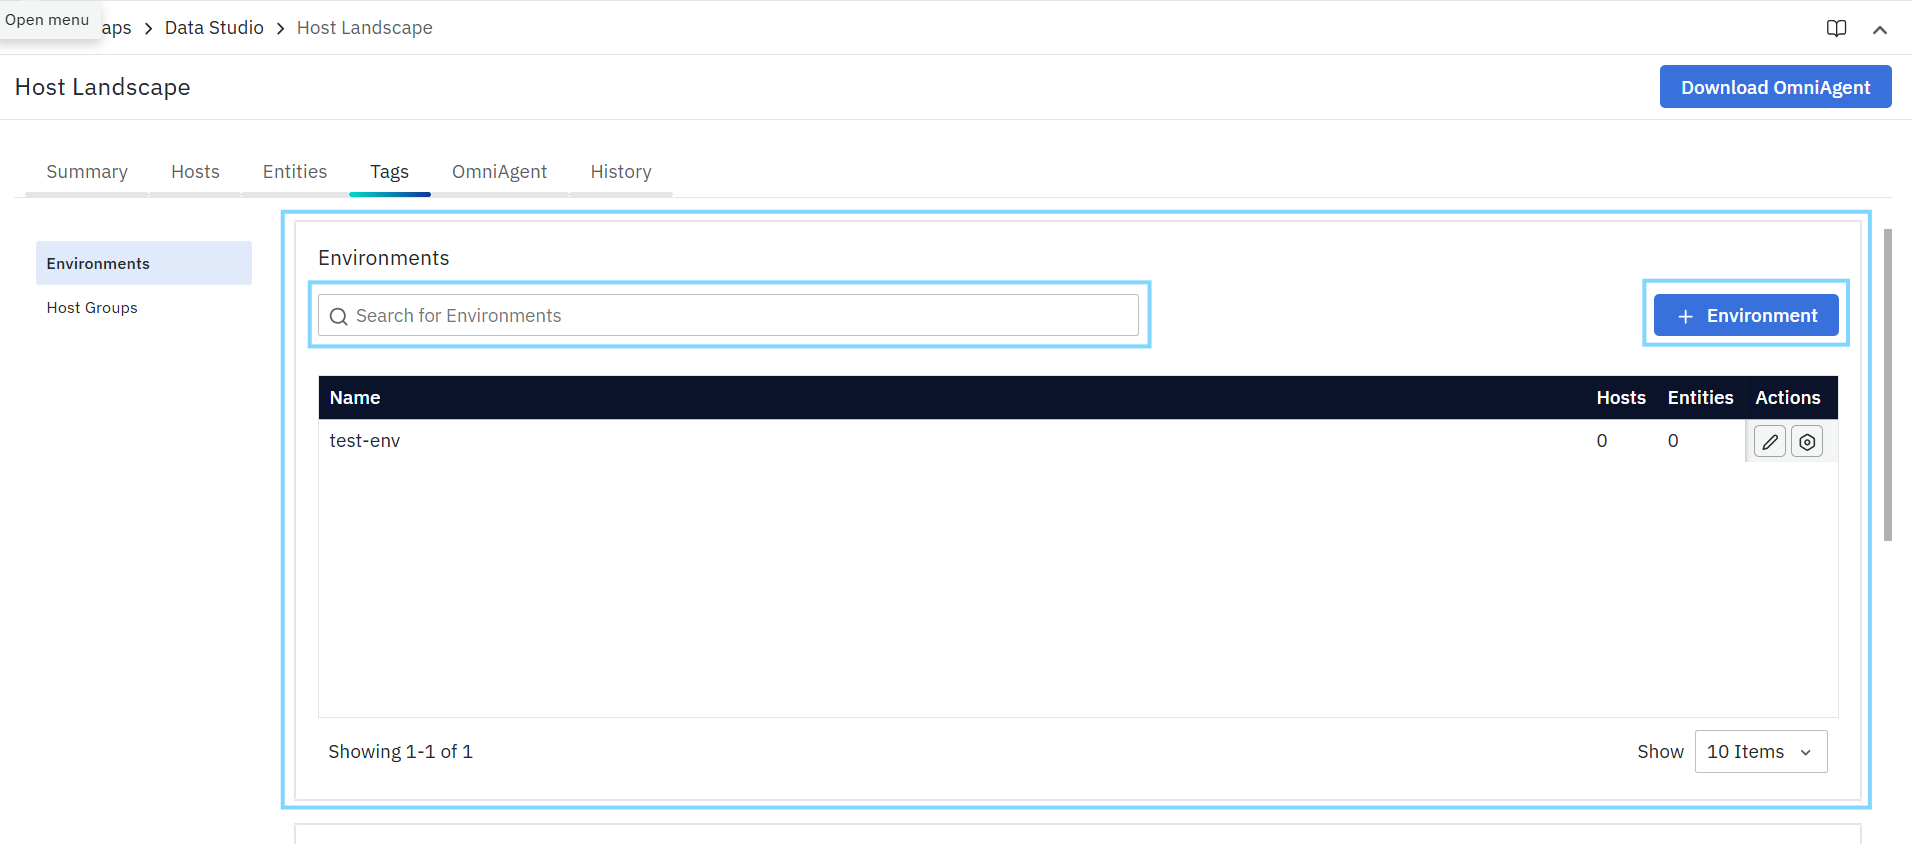
Search Environments
- The Search for Environments field allows you to quickly locate environment records in the table.
- You can search using:
- Environment name
- As you enter a value, the table updates to show matching environments.
Add Environment
- In the Tags tab, select Environments from the left panel.
- Click + Environment.
- In the Add Environment panel, enter the required environment name in the Environment field.
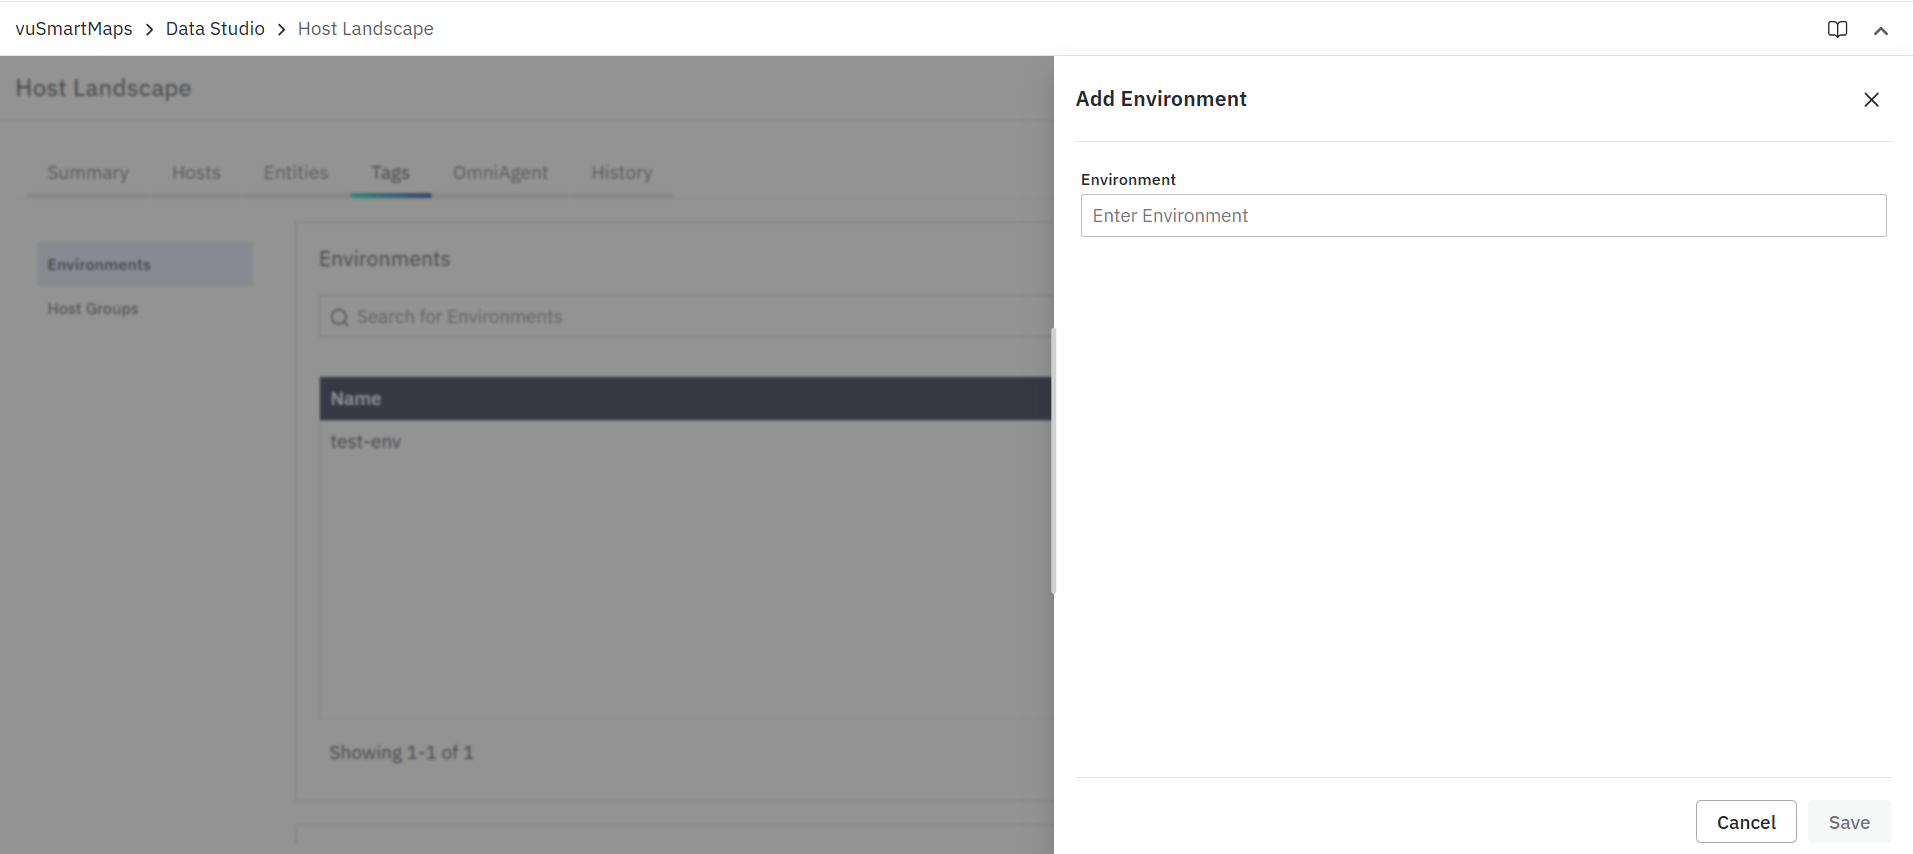
- Click Save to create the environment.
The new environment becomes available for association with hosts and entities in the Host Landscape.
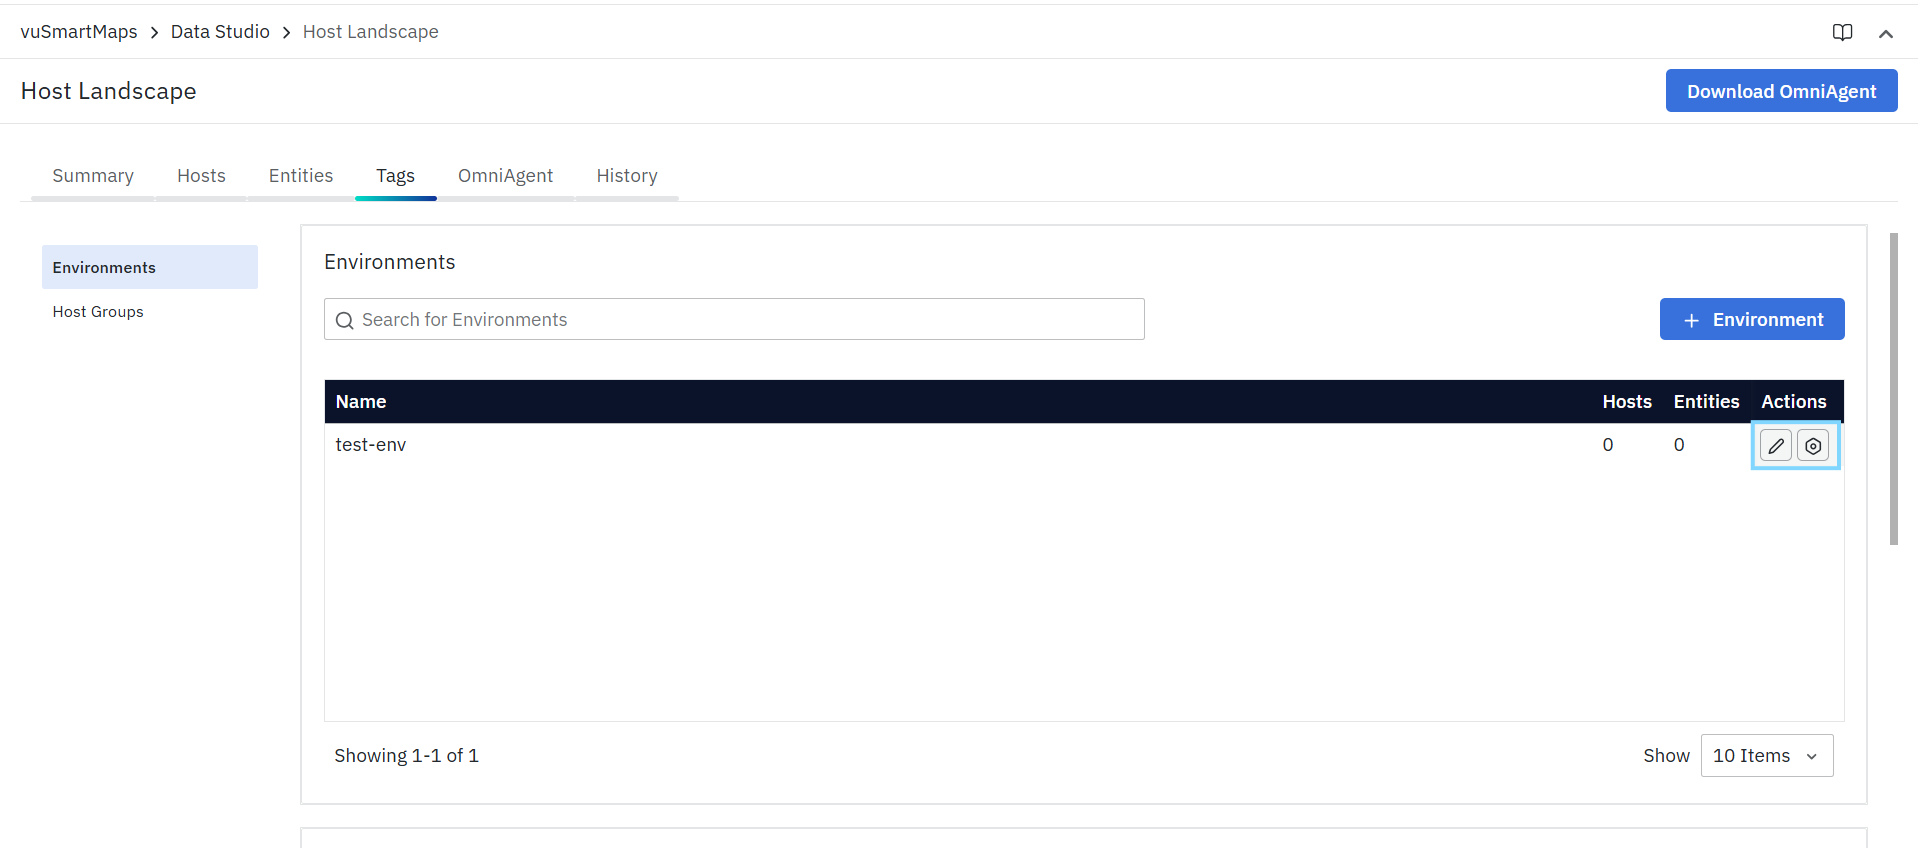
Environments Table
The Environments table lists each configured environment as a separate row. Each row provides tag-level details and current usage information for that environment.
- Name: Displays the name of the configured environment.
- Hosts: Displays the number of hosts currently associated with the selected environment.
- Entities: Displays the number of entities currently associated with the selected environment.
- Actions: The Actions column provides environment-level management options for the selected environment. The following actions are available:
- Edit
- Manage Config
Edit Environment
The Edit action opens the edit panel for the selected environment.
Use Edit when:
- The environment name needs to be updated
- The environment label needs to be standardized
- A previously created environment requires correction
Manage Config
The Manage Config action opens the Manage Config panel for the selected environment.
This can be used to:
- Enable monitoring for specific technologies
- Disable monitoring for specific technologies
- Apply policy behavior at the environment level
- Override or refine monitoring defaults for resources associated with the environment
- Restore the default monitoring policy when needed

The configuration is displayed as a technology or component list, where each item can be explicitly set to:
- Enabled
- Disabled
The panel also provides:
- Search – Search for a specific technology or component in the policy list
- Reset to default – Restores the default monitoring policy for the selected environment
Host Groups Panel
Host Groups organize related hosts within an Environment based on application, business function, or operational ownership. Host Groups simplify inventory management and enable policy-based discovery, onboarding, monitoring, and reporting for similar infrastructure.
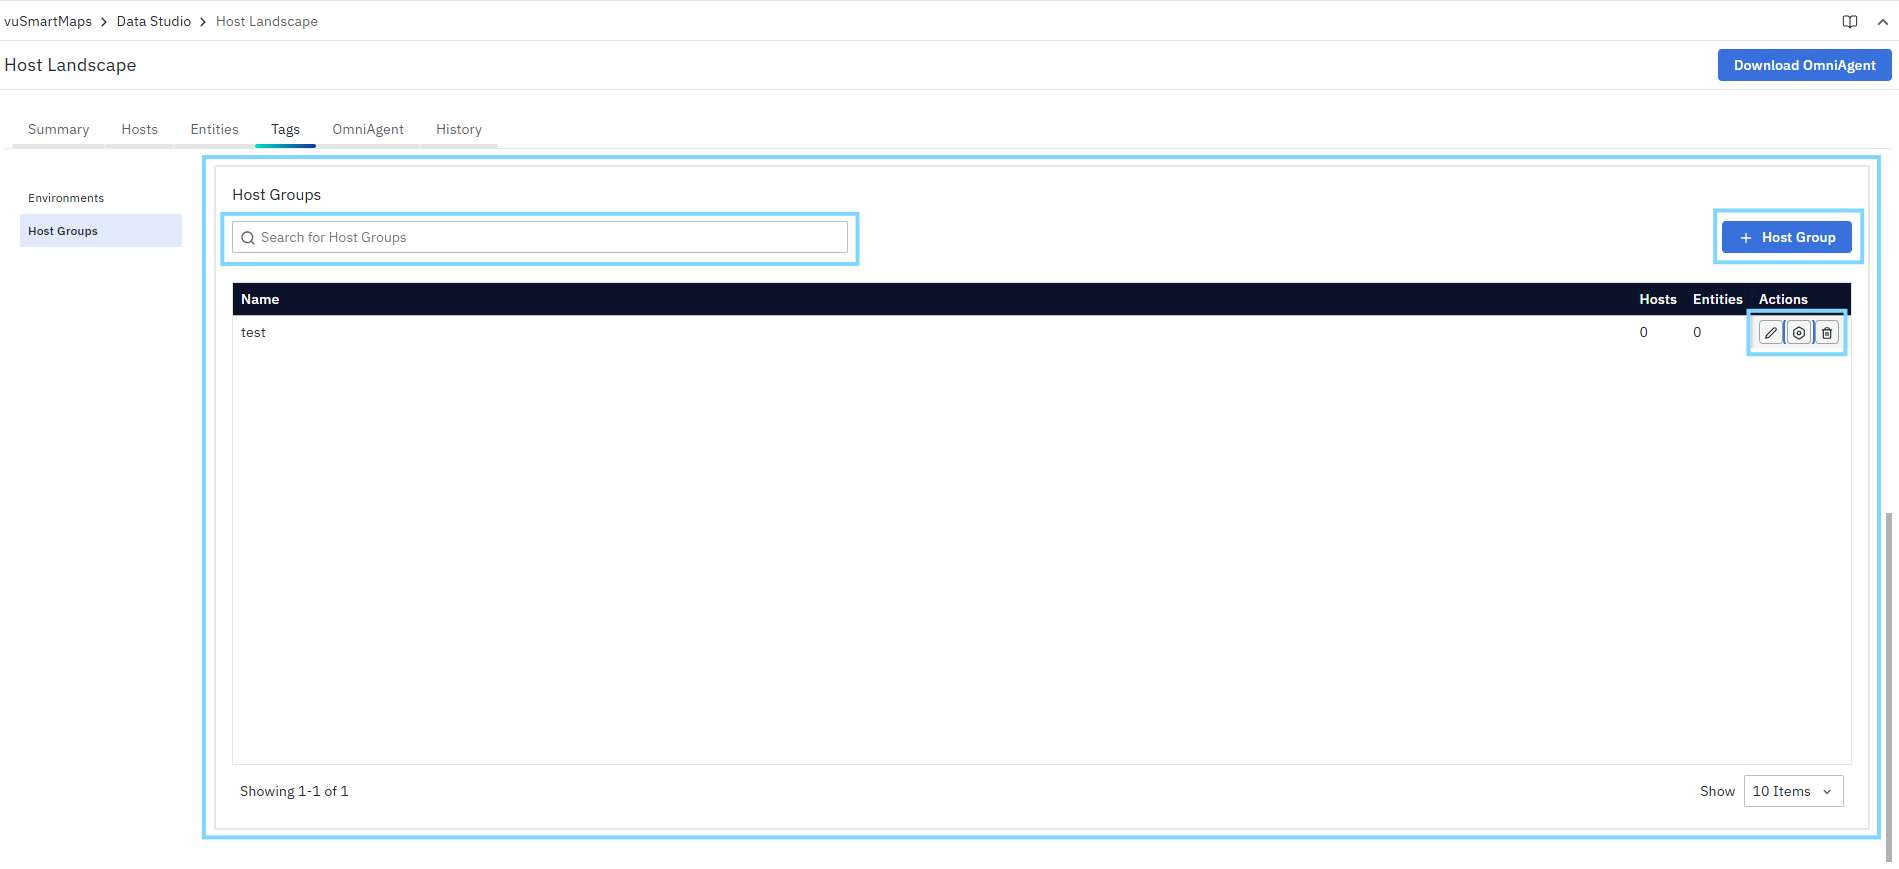
Search Host Groups
- The Search for Host Groups field allows you to quickly locate host group records in the table.You can search using:
- Host group name
- As you enter a value, the table updates to show matching host groups.
- Use search when you want to quickly locate a specific host group without manually scanning the full list.
Add Host Group
- In the Tags tab, select Host Groups from the left panel.
- Click + Host Group.
- In the Add Host Group panel, enter the required host group name in the Host Group field.

- Click Save to create the host group.
The new host group becomes available for association with hosts in the Host Landscape.
Host Groups Table
The Host Groups table lists each configured host group as a separate row. Each row provides tag-level details and current usage information for that host group.
- Name: Displays the name of the configured host group.
- Hosts: Displays the number of hosts currently associated with the selected host group.
- Entities: Displays the number of entities currently associated with the selected host group through their associated hosts.
- Actions: The Actions column provides host group-level management options for the selected host group. The following actions are available:
Edit Host Group
The Edit action opens the edit panel for the selected host group.
Use Edit when:
- The host group name needs to be updated
- The grouping label needs to be standardized
- A previously created host group requires correction
Manage Config
The Manage Config action opens the Manage Config panel for the selected host group. This allows you to define host group-level monitoring behavior for the selected host group.
This can be used to:
- Enable monitoring for specific technologies
- Disable monitoring for specific technologies
- Apply policy behavior at the host group level
- Override inherited monitoring behavior for resources in the selected host group
- Restore the default monitoring policy when needed
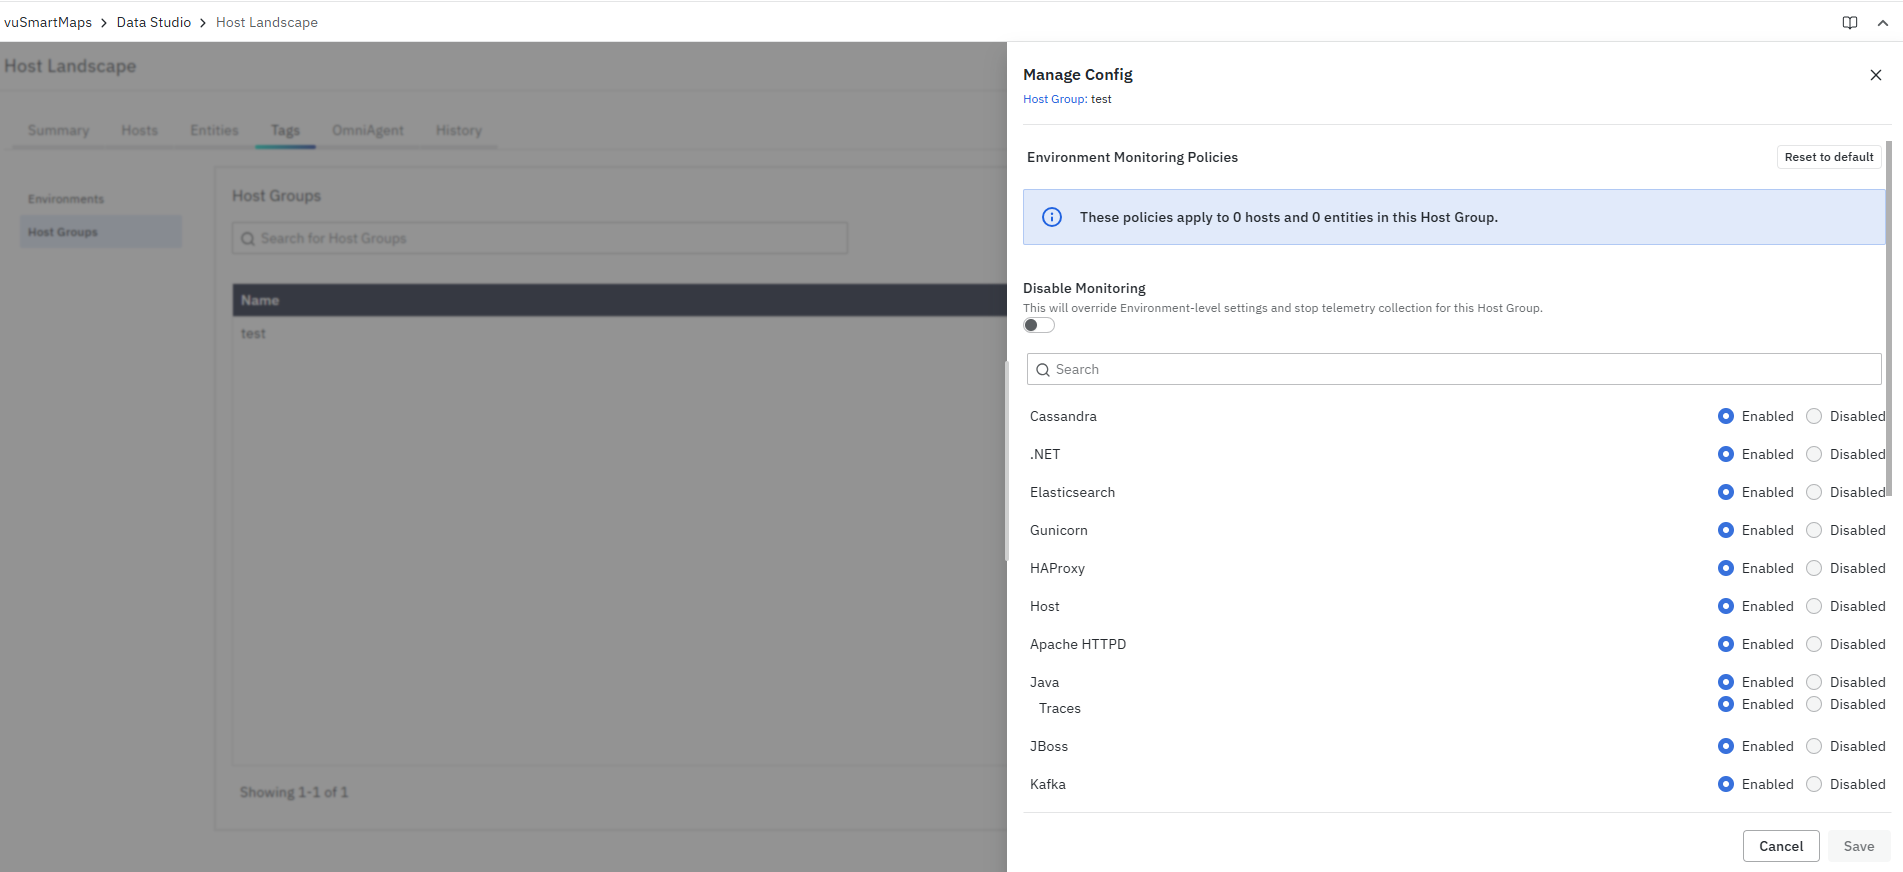
The configuration is displayed as a technology or component list, where each item can be explicitly set to:
- Enabled
- Disabled
The panel also provides:
- Search – Search for a specific technology or component in the policy list
- Reset to default – Restores the default monitoring policy for the selected host group
Delete Host Group
The Delete action removes the selected host group from the Tags inventory.
Use Delete when:
- A host group is no longer required
- A host group was created incorrectly
- You want to clean up unused grouping labels
- The host group is no longer part of the current organization model
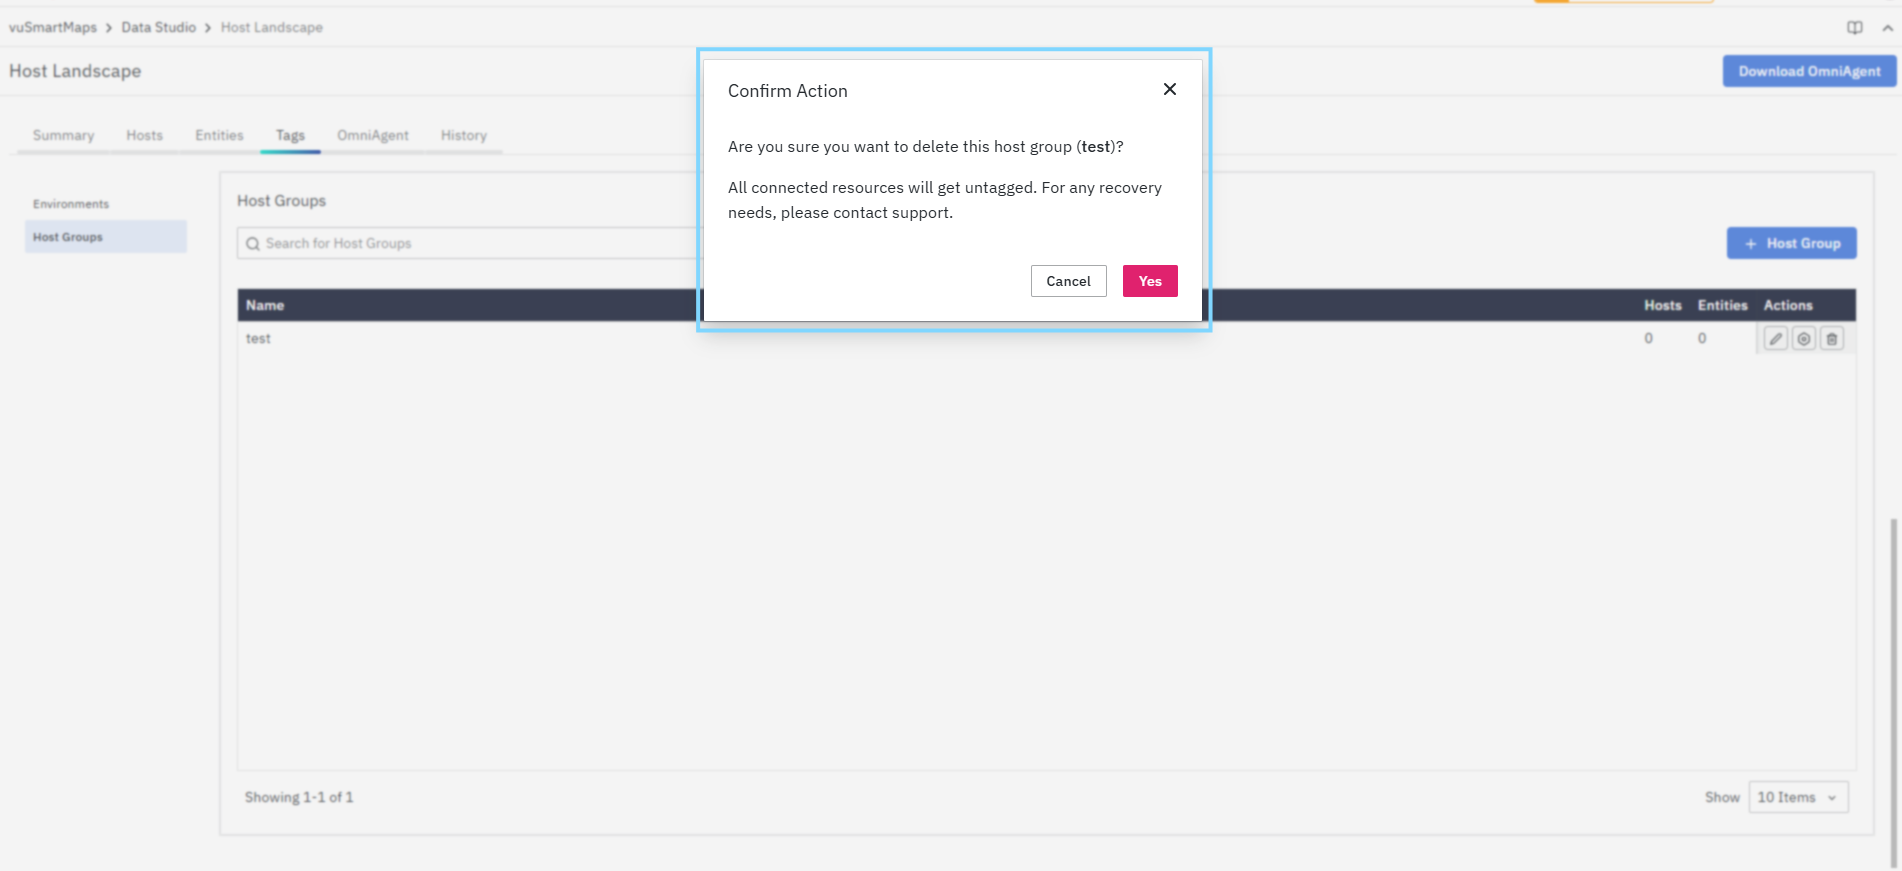
Before deleting a host group:
- Verify that the host group is no longer required
- Review whether hosts or entities are currently associated with it
- Confirm that removing the host group will not affect ongoing operational workflows
OmniAgent Tab
Purpose of the OmniAgent Tab
The OmniAgent tab provides a centralized operational view of all hosts onboarded using Auto-Discovery & Instrumentation (ADI). It helps users validate whether data collection is functioning correctly at two levels:
- OmniAgent Level (OmniAgent service)
- Probe Level (individual monitoring components running via the OmniAgent)
This tab is primarily used to:
- Verify successful onboarding of hosts
- Monitor real-time reporting status
- Identify gaps in observability (missing or failing probes)
- Troubleshoot data collection issues
OmniAgent Tab Structure
The OmniAgent tab is divided into two logical views:
- OmniAgent (Hosts View) → High-level health of each host
- Probe (Probe View) → Detailed visibility into individual probes
OmniAgent View (Hosts View)
The OmniAgent view displays all hosts where OmniAgent is installed. Each row represents a host and provides a consolidated health summary based on:
- OmniAgent service status
- Probe reporting status

This view acts as a first-level validation layer to quickly identify whether a host is:
- Fully operational – OmniAgent is running correctly, associated probes are healthy, and the host is actively reporting data to the platform.
- Partially monitored – OmniAgent is reachable, but one or more probes are unhealthy, misconfigured, or not reporting as expected.
- Not reporting – The Host Landscape is not receiving the expected telemetry or reporting information from the host. The threshold for a Not Reporting state is 5 minutes.
Search Functionality
- The search bar allows users to filter hosts using:
- Host Name
- Host IP
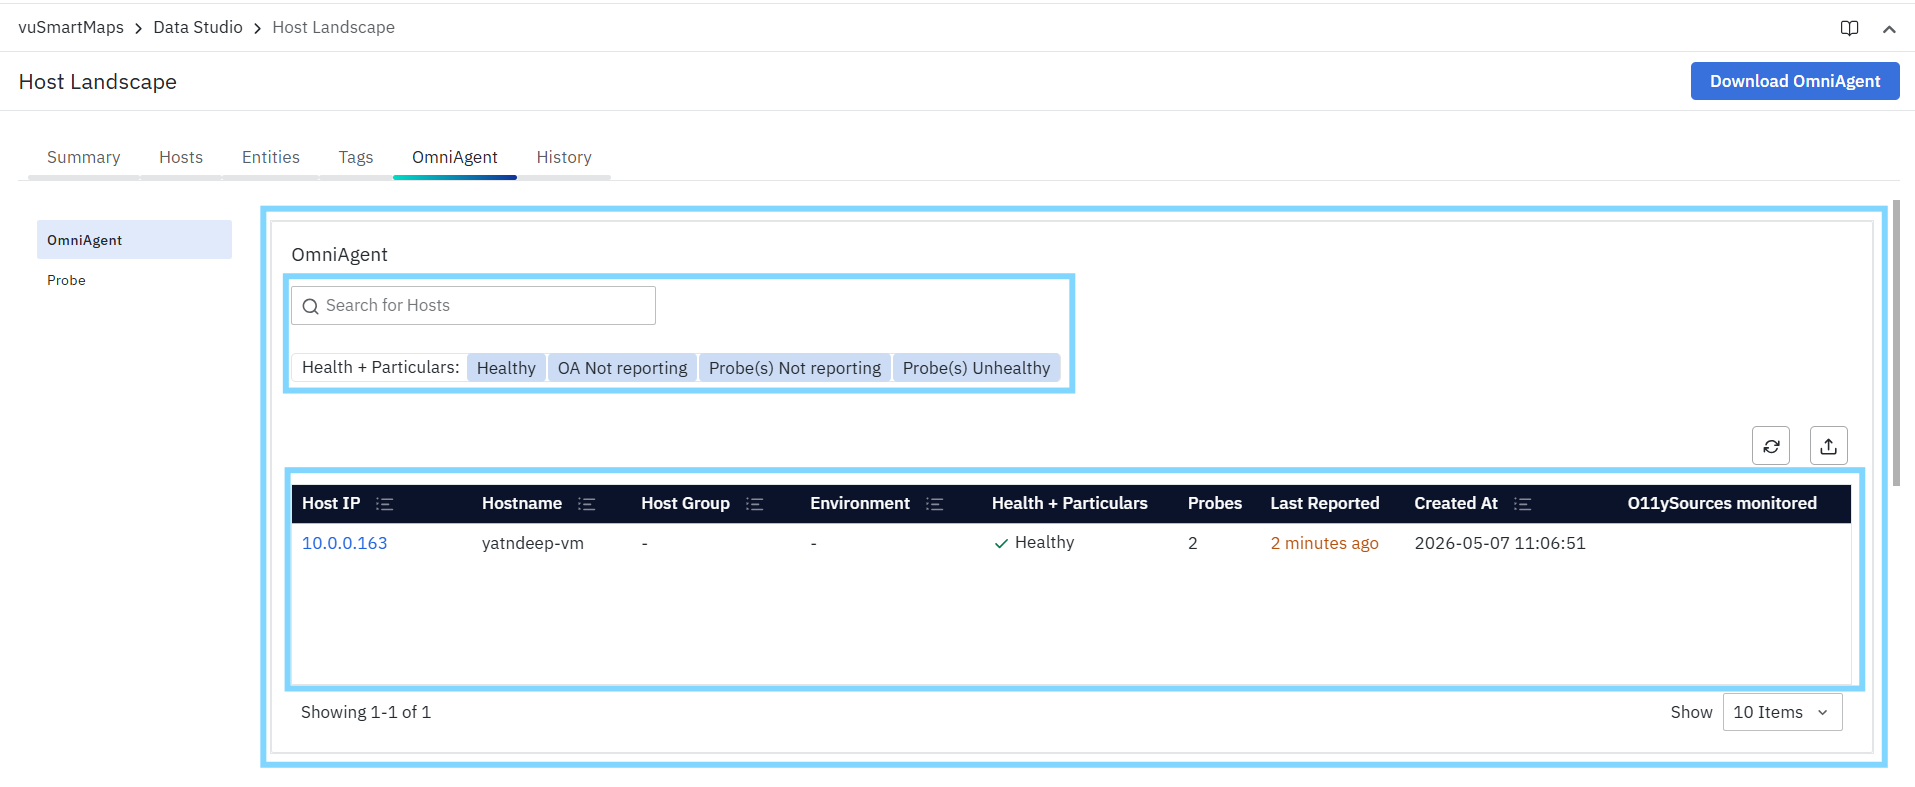
This is useful in large environments to quickly locate specific hosts.
Health + Particulars Filter
This is a key filter in the OmniAgent view, representing combined health states.
- Healthy: Shows only the hosts where OmniAgent is running properly and reporting data without issues.
- OA Not Reporting – Displays hosts for which the platform is not receiving the expected reporting information from OmniAgent.
- Probe(s) Not Reporting: Highlights hosts where one or more probes installed under the OmniAgent have stopped reporting.
- Probe(s) Unhealthy: Shows hosts where probes are still running but are facing errors or performance issues.
OmniAgent Table Columns
- Hostname: The name of the server (clickable for more details).
- Host IP: The IP address of the server.
- Health + Particulars: Shows the current health status of the OmniAgent service (e.g., Healthy, OA Not Reporting).
- Probes: Number of probes installed on that host.
- Last Reported: Time since the host last sent data (e.g., less than a minute ago, 2 days ago).
- Created At: Timestamp when the OmniAgent service was first registered.
- O11ySources Monitored: Lists the O11ySources linked to this host.
Hosts Actions
- Refresh: Reload the data to view the latest status of all hosts and probes.
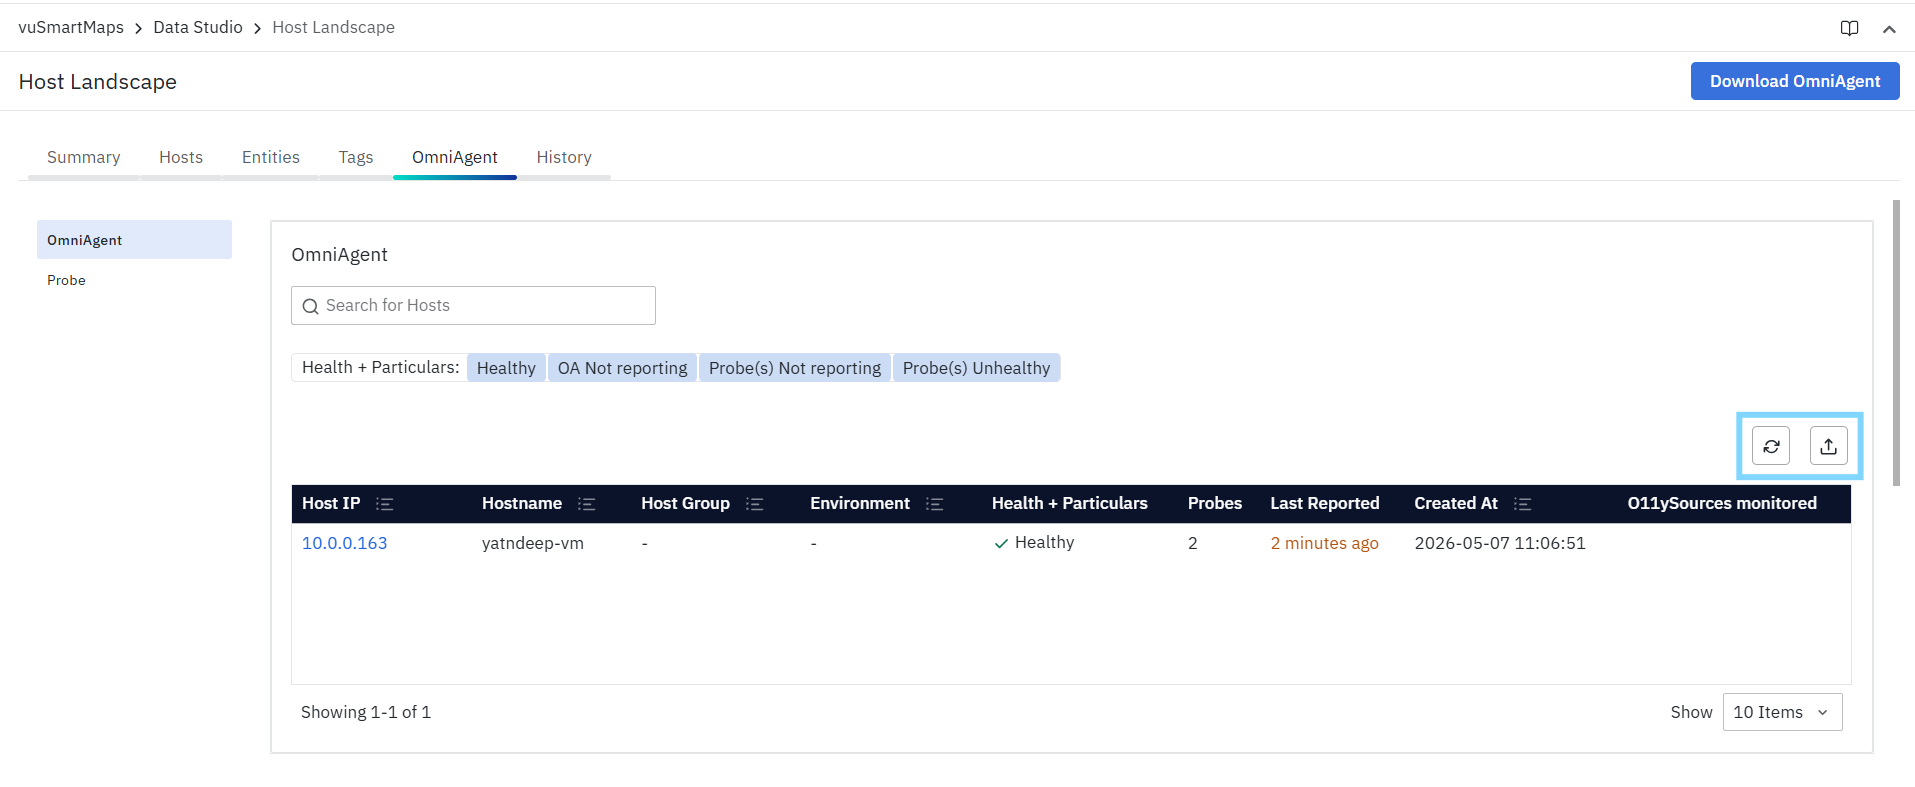
- Export: Download the list of hosts and their probe details in a report format (CSV/Excel).
Sorting
Sorting is supported on:
- Host Name
- Host IP
- Created At
Sorting works in combination with filters and search.
Probe View
The Probe view provides granular visibility into individual probes running on hosts. Each entry represents a probe instance responsible for collecting specific telemetry.

This view is mainly used for:
- Troubleshooting probe-level issues
- Validating monitoring configurations
- Managing probe lifecycle
Search Functionality
- Search probes by name
- Useful when multiple probes are deployed across hosts

Health Filters
- Health Filters
- Narrow down the list of probes by health condition:
- Healthy – Only show probes that are running correctly.
- Unhealthy – Show probes with errors or issues.
- Not Reporting – Show probes that have stopped sending data.
- Narrow down the list of probes by health condition:
- Probe Filter
- A drop-down menu to control which types of probes are displayed.
- Options include:
- All – Show every probe installed.
- Specific probe types (based on enabled monitoring policies)
Probe Table Columns
- Probe: Name of the probe (clickable for more details).
- Probe Version: Version of the installed probe (e.g., 1.2).
- Health: Current health status (Healthy, Unhealthy, Not Reporting).
- Status: Running state of the probe (Running, Stopped).
- Hostname: The server/host where the probe is installed.
- Host IP: IP address of the server.
- Last Reported: Timestamp showing when the probe last sent data.
- Created At: The date and time the probe was first registered.
- O11ySources Monitored: Displays the O11ySources associated with this probe.
- Actions: On the right-hand side of each row, actions are available for managing the probe:
- Start/Stop Probe: Manually control the probe’s activity.
- Restart Probe: Restart a probe if it’s unresponsive or needs to reload its configuration.
- Upgrade Probe: Update the probe to the latest version if available.
Probes Actions
Bulk Actions in Probes
The Bulk Actions dropdown allows administrators to manage multiple probes at once, instead of performing actions individually. This is especially useful when the same task must be applied to multiple probes across different hosts.
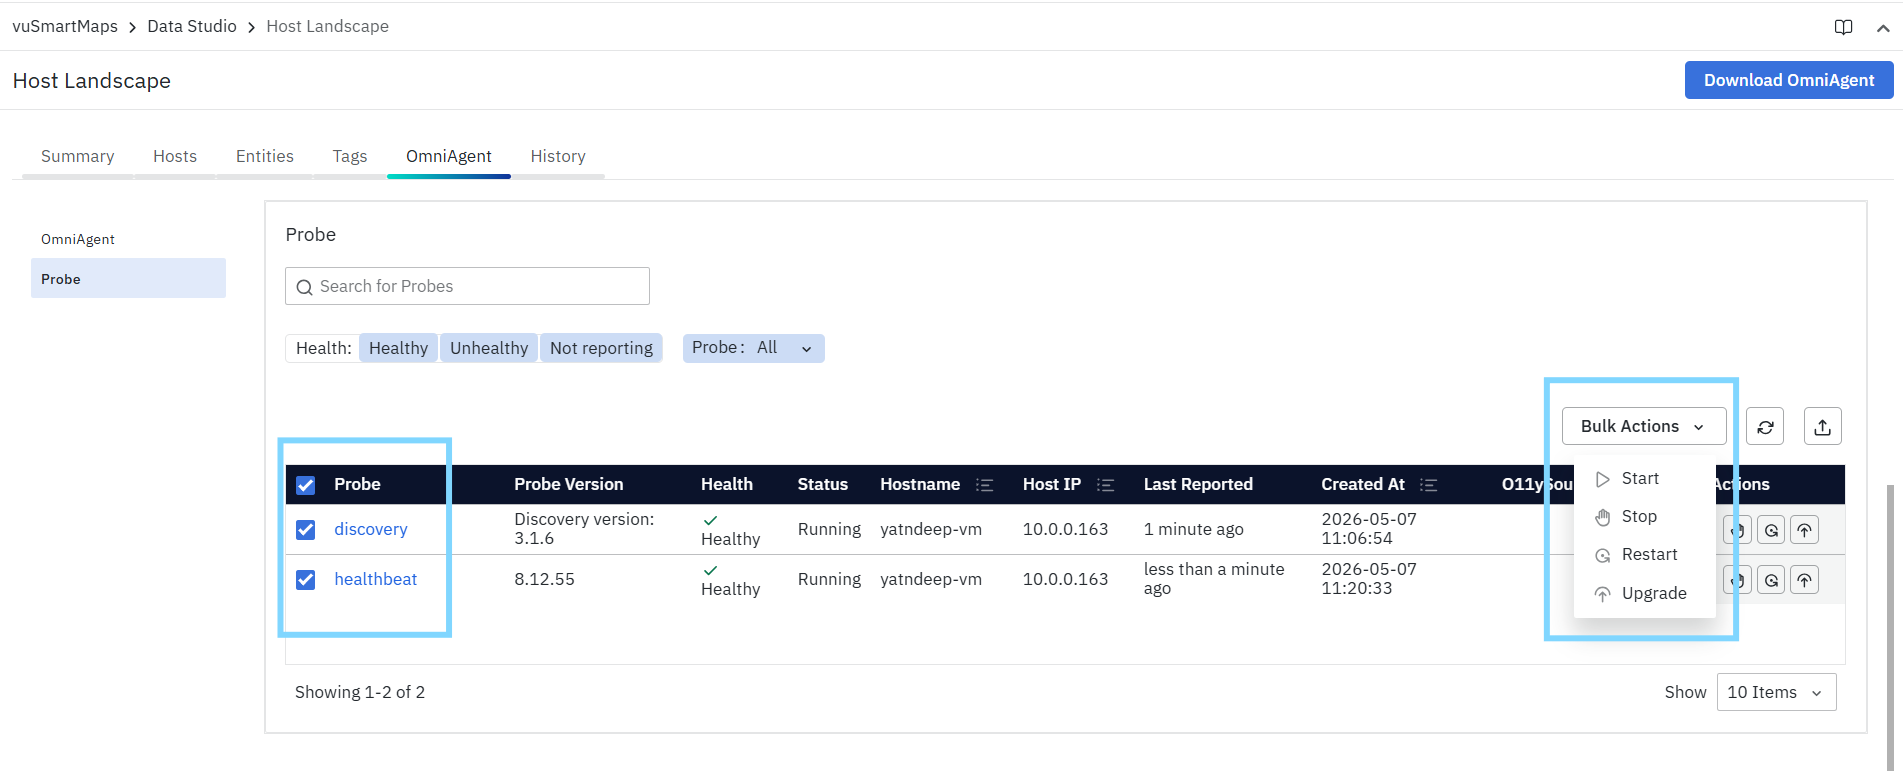
- Start Probes
- Start all selected probes that are currently stopped.
- Stop Probes
- Stops the selected probes from running.
- Useful for temporarily disabling monitoring.
- Restart Probes
- Restarts the selected probes.
- Typically used if a probe is unresponsive or if updated configurations need to be applied.
- Upgrade Probes
- Upgrades the selected probes to the latest available version.
- Ensures probes are running with the latest features and fixes.
Refresh
- Reload the data to view the latest status of all probes.

Export
- Download the list of probes in a report format (CSV/Excel).
Sorting in Probes View
- The Probes table also supports column-based sorting for easier analysis.
- Click the sort icon in a column header to sort probe entries. Click again to reverse the order.
- Users can sort probes using the following columns:
- Hostname – Sort probes based on the host on which they are installed.
- Host IP – Sort probes by the IP address of the host.
- Created At – Sort probes by the time they were registered or created.
- Sorting can be combined with health filters, probe-type filters, and search, making it easier to analyze probe distribution, onboarding timelines, and host-level grouping.
History Tab
Purpose of the History Tab
The History tab maintains the discovery and onboarding history of monitored hosts and entities. It records discovery events, onboarding operations, environment updates, host group modifications, monitoring actions, and user-initiated changes, providing a complete audit trail for inventory management and operational troubleshooting.
It helps users:
- Track lifecycle events of hosts and entities
- Understand when monitoring actions were performed
- Identify system-triggered and user-triggered activities
- Troubleshoot issues by analyzing event timelines
Overview
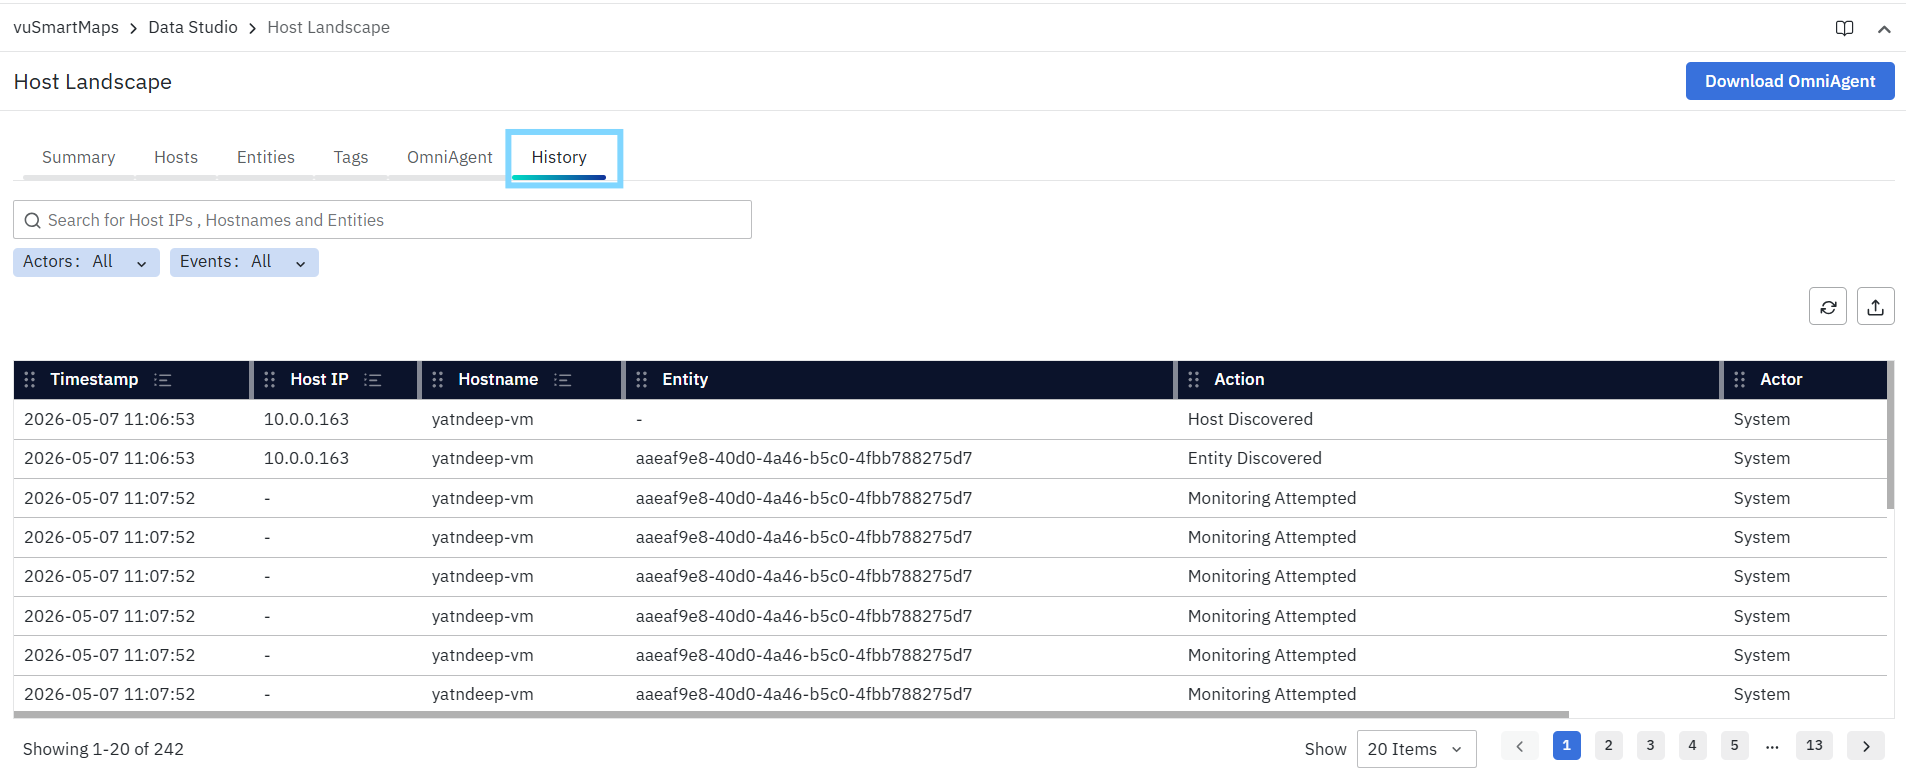
The History tab displays a chronological list of events captured across the Host Landscape. Each entry represents an action or state change, such as:
- Host discovery
- Entity discovery
- Monitoring attempts and status changes
- Entities becoming stale
This tab acts as a single source of truth for operational history, enabling better visibility into how the system evolves.
Search Functionality
The search bar allows users to search across multiple fields:
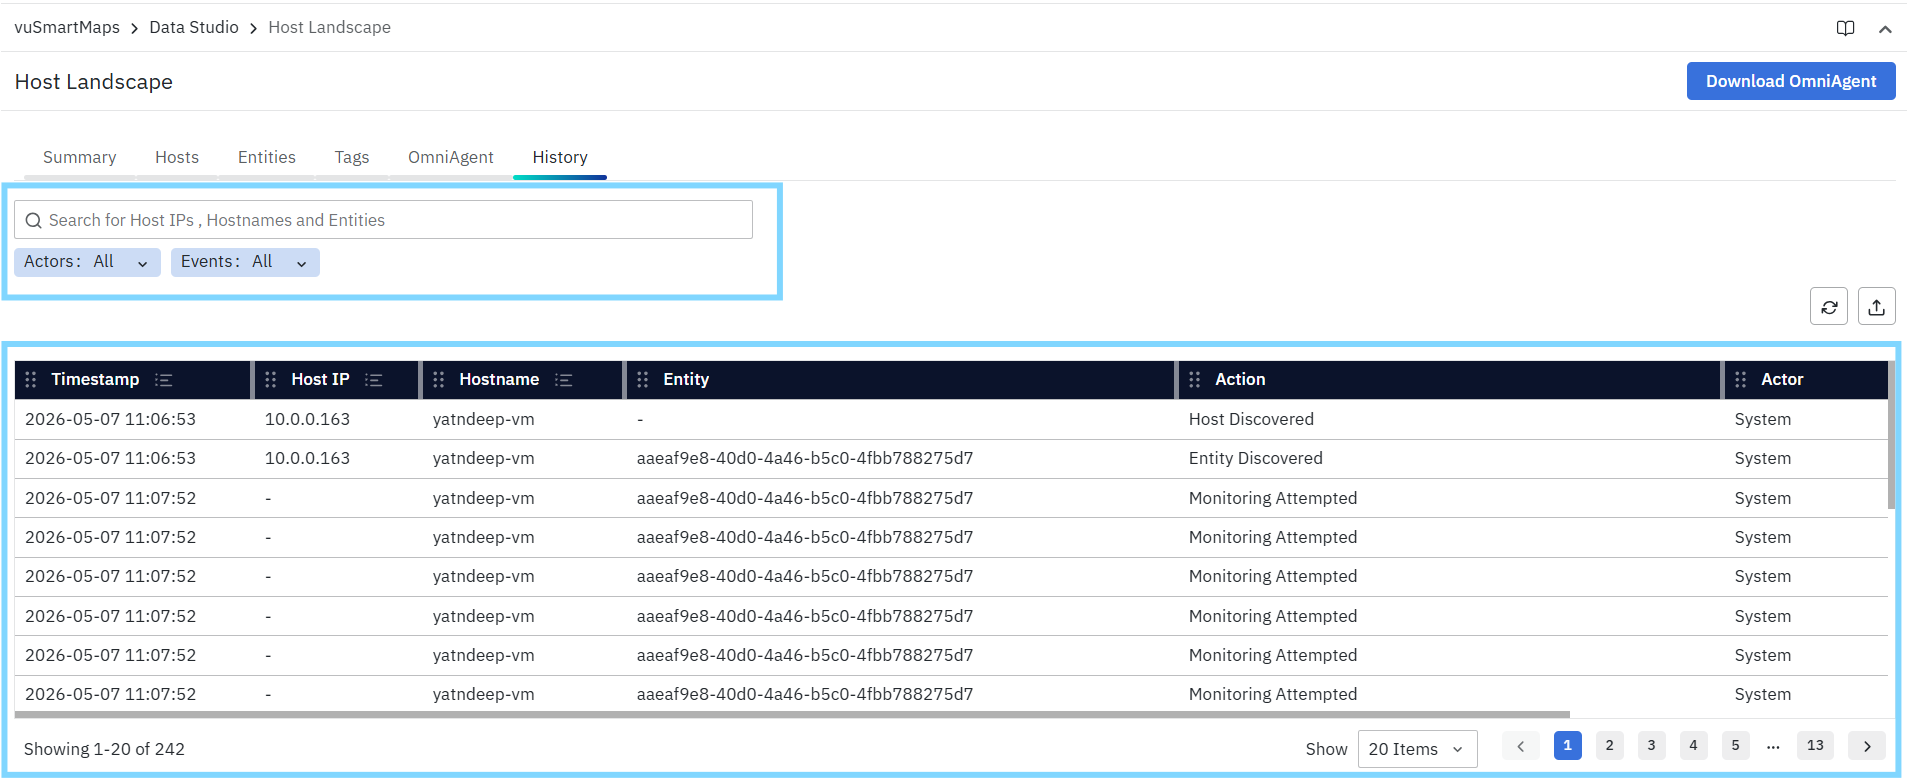
- Hosts (Host Name / Host IP)
- Entities
- Actions
- Event details
- Actors
This enables quick identification of specific events in large environments.
Filters
Actors Filter
- Filters events based on who triggered the action
Options typically include:
- All: Displays all events
- System: Events triggered automatically by the platform
- User: Events triggered manually by users (if applicable)
Events Filter
- Filters events based on the type of action
Examples of event types:
- Discovery events
- Monitoring events
- Status changes
History Table Columns
- Timestamp: Date and time when the event occurred, Helps in tracking the exact sequence of operations
- Host IP: IP address of the host associated with the event
- Hostname: Name of the host where the event occurred
- Entity: Identifier of the entity involved in the event, May represent:
- Host-level entity
- Discovered component
- Action: Describes the activity performed. Common actions include:
- Host Discovered: Indicates that a new host has been identified by ADI
- Entity Discovered: Indicates that a component/entity within a host has been discovered
- Monitoring Attempted: The system attempted to initiate monitoring on the entity
- Monitoring Started: Monitoring has successfully started
- Entity Gone Stale: The entity has stopped reporting data and is marked as stale
- Actor: Indicates who performed the action. Typical values:
- System: Automatically generated events
- User: Manual actions (if applicable)
Actions in History Tab
Refresh
- Reloads the latest event data
- Useful when tracking real-time changes
Export
- Downloads the history data for:
- Audit purposes
- External analysis
- Reporting
What Happens After the Steps
After the OmniAgent installation is completed and the service starts successfully, the host registers with the platform and becomes visible in the Host Landscape. The Discovery Probe scans the host, identifies supported entities such as JVMs, processes, and services, and updates the centralized inventory.
Based on the configured monitoring policies, supported entities are automatically evaluated for monitoring and instrumentation. The monitoring status of discovered hosts and entities is updated in the Host Landscape, allowing users to review onboarding progress, verify OmniAgent health, and manage discovered assets from a single interface.
Tips and Best Practices
- Install OmniAgent using the generated platform-specific installation command whenever possible.
- Verify that the correct Environment and Host Group are selected before downloading or installing OmniAgent.
- Ensure the ADI_ENABLED platform configuration is enabled to allow automatic discovery and monitoring.
- Regularly review the Host Landscape to identify newly discovered hosts and entities.
- Organize hosts using Environments and Host Groups for easier management and filtering.
- Monitor OmniAgent and Discovery Probe health to ensure continuous discovery and inventory updates.
- Periodically review entities that remain in Not Monitored or Onboarding Failed status and resolve any onboarding issues.
Troubleshooting
1. Issue: Newly installed host is not visible in Host Landscape.
- Possible Cause: OmniAgent is not running or the host has not registered successfully.
- Solution: Verify that OmniAgent is installed, running, and able to communicate with the platform.
2. Issue: No entities are discovered after host registration.
- Possible Cause: Discovery Probe is not running or supported components are not available on the host.
- Solution: Verify the Discovery Probe status and ensure the host contains supported runtimes or services.
3. Issue: Monitoring does not start automatically.
- Possible Cause: ADI is disabled or monitoring policies are not configured.
- Solution: Verify that ADI_ENABLED is enabled and the required monitoring policies are configured.
4. Issue: OmniAgent installation command fails.
- Possible Cause: Invalid platform selection, insufficient permissions, or network connectivity issues.
- Solution: Verify the selected platform, execute the command with the required privileges, and confirm network connectivity.
5. Issue: Host remains in Onboarding state.
- Possible Cause: Discovery or monitoring initialization has not completed.
- Solution: Allow the onboarding process to complete and verify the OmniAgent and Discovery Probe status.
6. Issue: Host shows Onboarding Failed.
- Possible Cause: Discovery or monitoring configuration failed.
- Solution: Review the onboarding logs, verify host connectivity, and retry the onboarding process after resolving the reported issues.
7. Issue: OmniAgent health is reported as unhealthy.
- Possible Cause: OmniAgent service is stopped or unable to communicate with the platform.
- Solution: Restart the OmniAgent service and verify network connectivity and platform accessibility.
8. Issue: Discovery information is not updated.
- Possible Cause: Discovery Probe is not reporting or scheduled discovery has not completed.
- Solution: Verify the Discovery Probe health and ensure the discovery process is running successfully.
FAQs
What is the role of OmniAgent in ADI?
OmniAgent manages Discovery Probes, communicates with the platform, and enables discovery of supported infrastructure and application components on registered hosts, along with monitoring and instrumentation workflows.
What are Discovery Probes?
Discovery Probes scan the registered host, identify runtime components such as JVMs, processes, and services, and send the discovered information to the platform.
What monitoring states are displayed in the Host Landscape?
The Host Landscape displays states including Monitoring, In Progress, Blocked By Policy, Pending, Issues, Stale, and Restart Required. The exact state depends on the entity's discovery, onboarding, monitoring, and reporting status.
Can I manually start monitoring for a discovered entity?
Yes. Users can initiate or stop monitoring for supported entities from the Host Landscape, depending on the configured monitoring workflow.
What can I do from the Hosts and Entities tabs?
The Hosts tab supports searching, filtering, refreshing, exporting, editing host associations, managing host configuration, and deleting hosts. The Entities tab supports searching, filtering, refreshing, exporting, starting or stopping monitoring, and deleting entities.
How do I organize hosts and entities?
Use Environments and Host Groups in the Tags tab. Environments group hosts by deployment boundary, while Host Groups organize related hosts for filtering, policy-based monitoring, and reporting.
How can I check whether OmniAgent or a probe is healthy?
Open the OmniAgent tab. The OmniAgent view shows host-level health, and the Probe view shows individual probe health, status, last-reported time, version, and associated O11ySources. You can also filter, refresh, export, start, stop, restart, or upgrade probes from the available actions.
What does the History tab show?
The History tab shows a chronological record of discovery, onboarding, monitoring, status changes, and other host or entity activities. You can search, filter, refresh, and export the history for troubleshooting, auditing, and reporting.
