Managing ContextStreams
Manage I/O Streams
View I/O Streams
Click on the I/O stream name to view the particular I/O stream details.
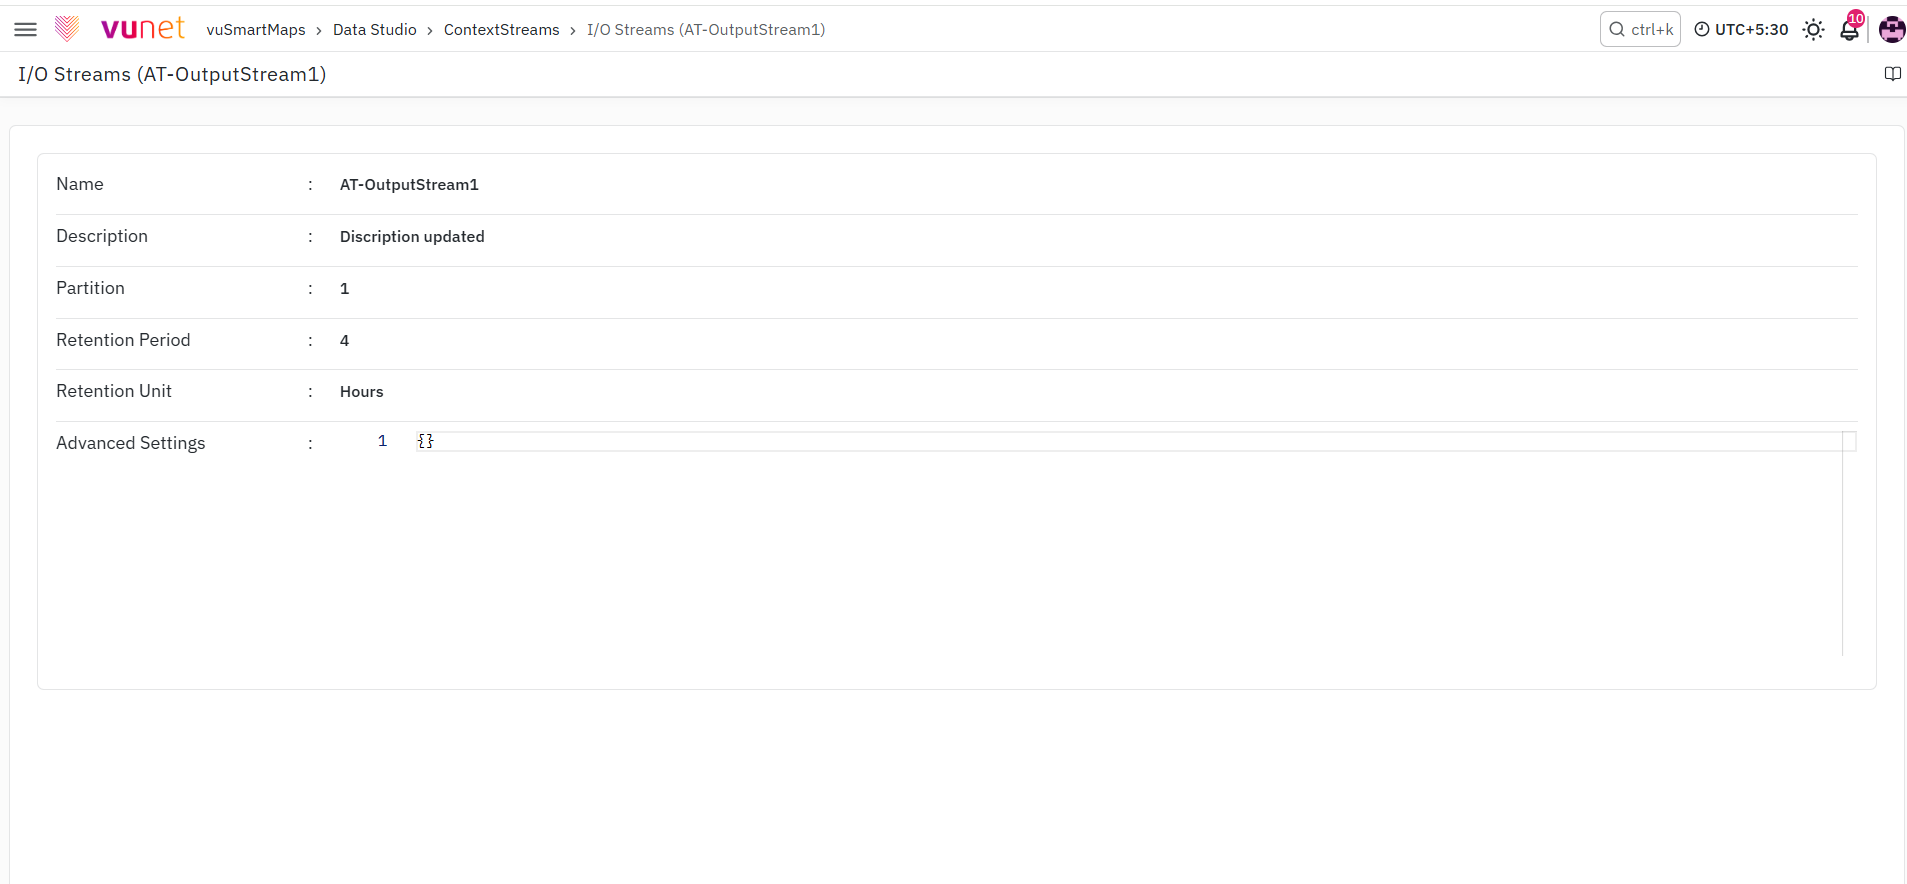
There are 3 tabs under the 'View' option (i.e., I/O Streams Info, Readers, Metrics).
I/O Streams Info
This tab provides comprehensive information about your I/O streams. By clicking on it, you can access details such as stream configurations, data sources, and any transformations applied.
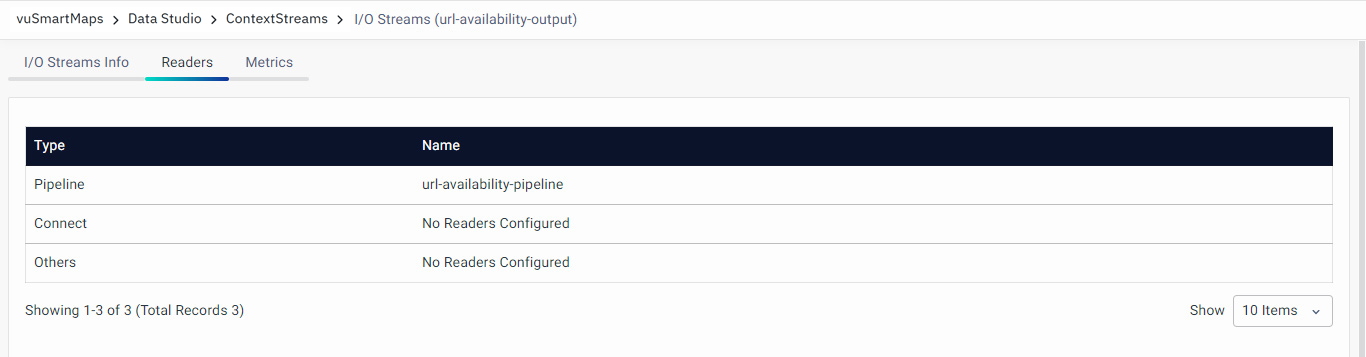
Readers
The 'Readers' tab lists configured readers associated with the respective I/O Stream. It offers insights into how data is consumed from this I/O stream. For a detailed visual guide, check the below snapshot.
Metrics
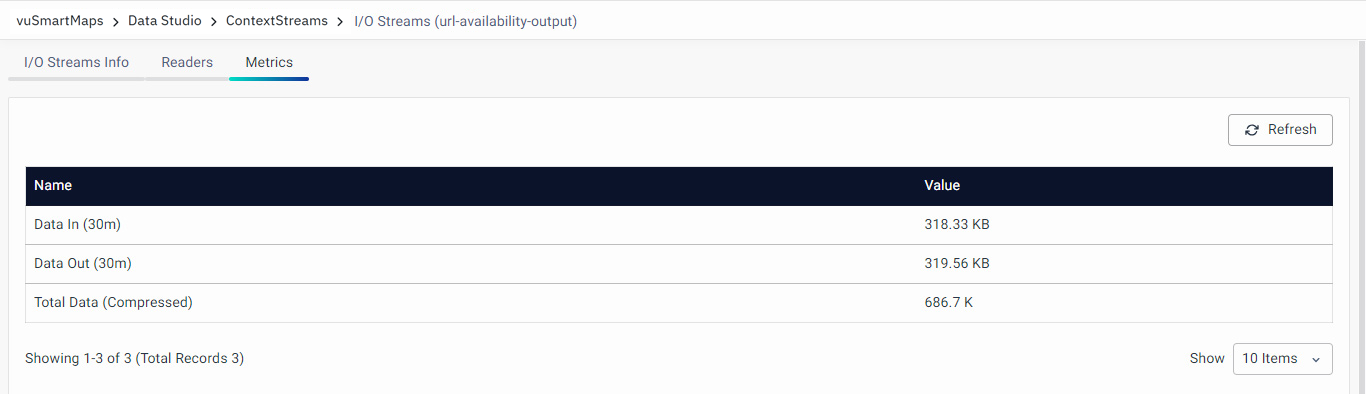
Metrics are vital for performance analysis and optimization. Navigate to the 'Metrics' tab to access real-time performance metrics, ensuring efficient operation of your I/O streams. The tab displays crucial performance indicators for a specified 30-minute period, including 'Data In' and 'Data Out' metrics, offering insights into data flow within your streams. Additionally, the 'Total Compressed Data' provides a snapshot of compression efficiency.
'Data In' reflects the volume of incoming data ingested into the I/O Stream in the last 30 minutes, indicating the data ingestion rate. 'Data Out' represents the amount of data processed by the stream in the same timeframe, signifying data processing efficiency. Monitoring fluctuations in both metrics aids in assessing overall data flow dynamics and system performance.
- If 'Data In' is 0, it indicates no data ingestion.
- If 'Data Out' is 0, no streamed data is being sent to the output.
- If 'Data In' and 'Data Out' differ, it could imply streaming issues.
The 'Total Compressed Data' represents the cumulative size of compressed data processed by the streams, offering insights into compression effectiveness.
During debugging, the 'Refresh' button fetches real-time metric updates, providing an updated view of current performance and aiding in promptly identifying any issues.
Edit I/O Streams
Click on the Edit button to modify any details associated with the added I/O stream.
After clicking the Edit button, you will be directed to the editing page where you can make desired changes to the I/O stream configuration. Update the fields as needed, such as the description, partition settings, retention period, and other relevant parameters.
For more detailed instructions on parameters to be provided in I/O Streams, you can refer here.
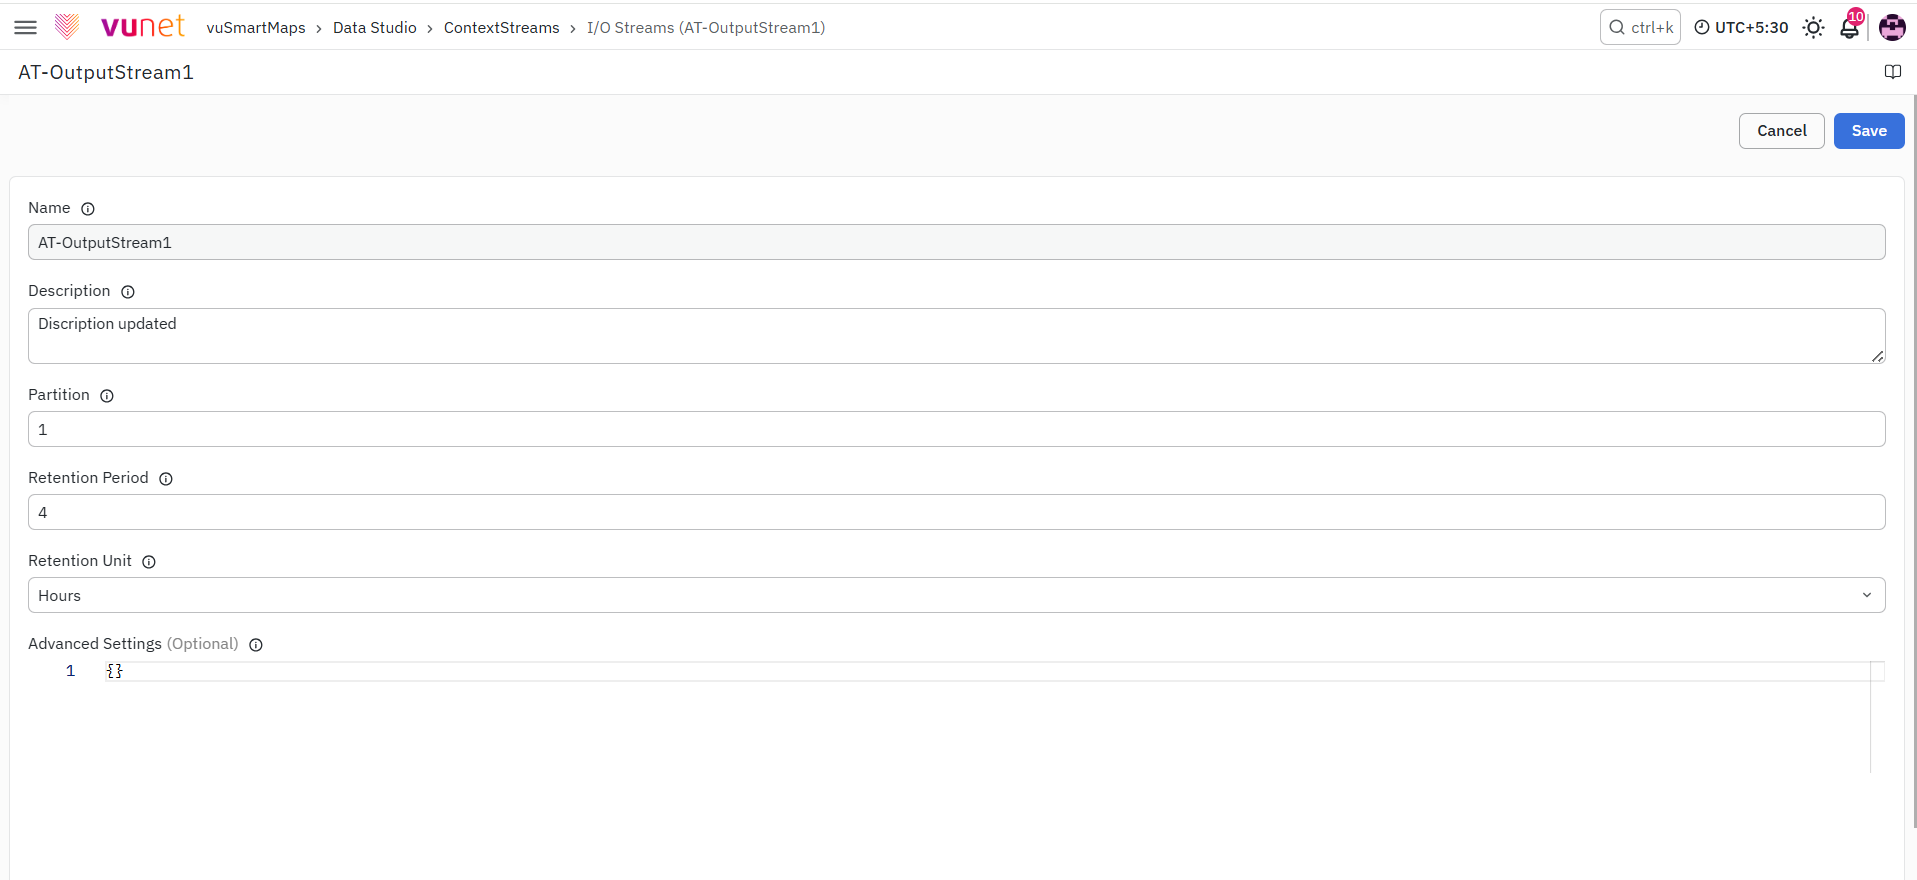
Once you've made the necessary adjustments, click the Save button to save the changes.
Delete I/O Streams
Select the I/O streams that you want to delete and click on the Delete button. Confirm by clicking on the Delete button. The selected I/O stream will be removed from the list.
Manage Data Pipelines
View Pipeline
Click on the pipeline name to view the particular pipeline details.
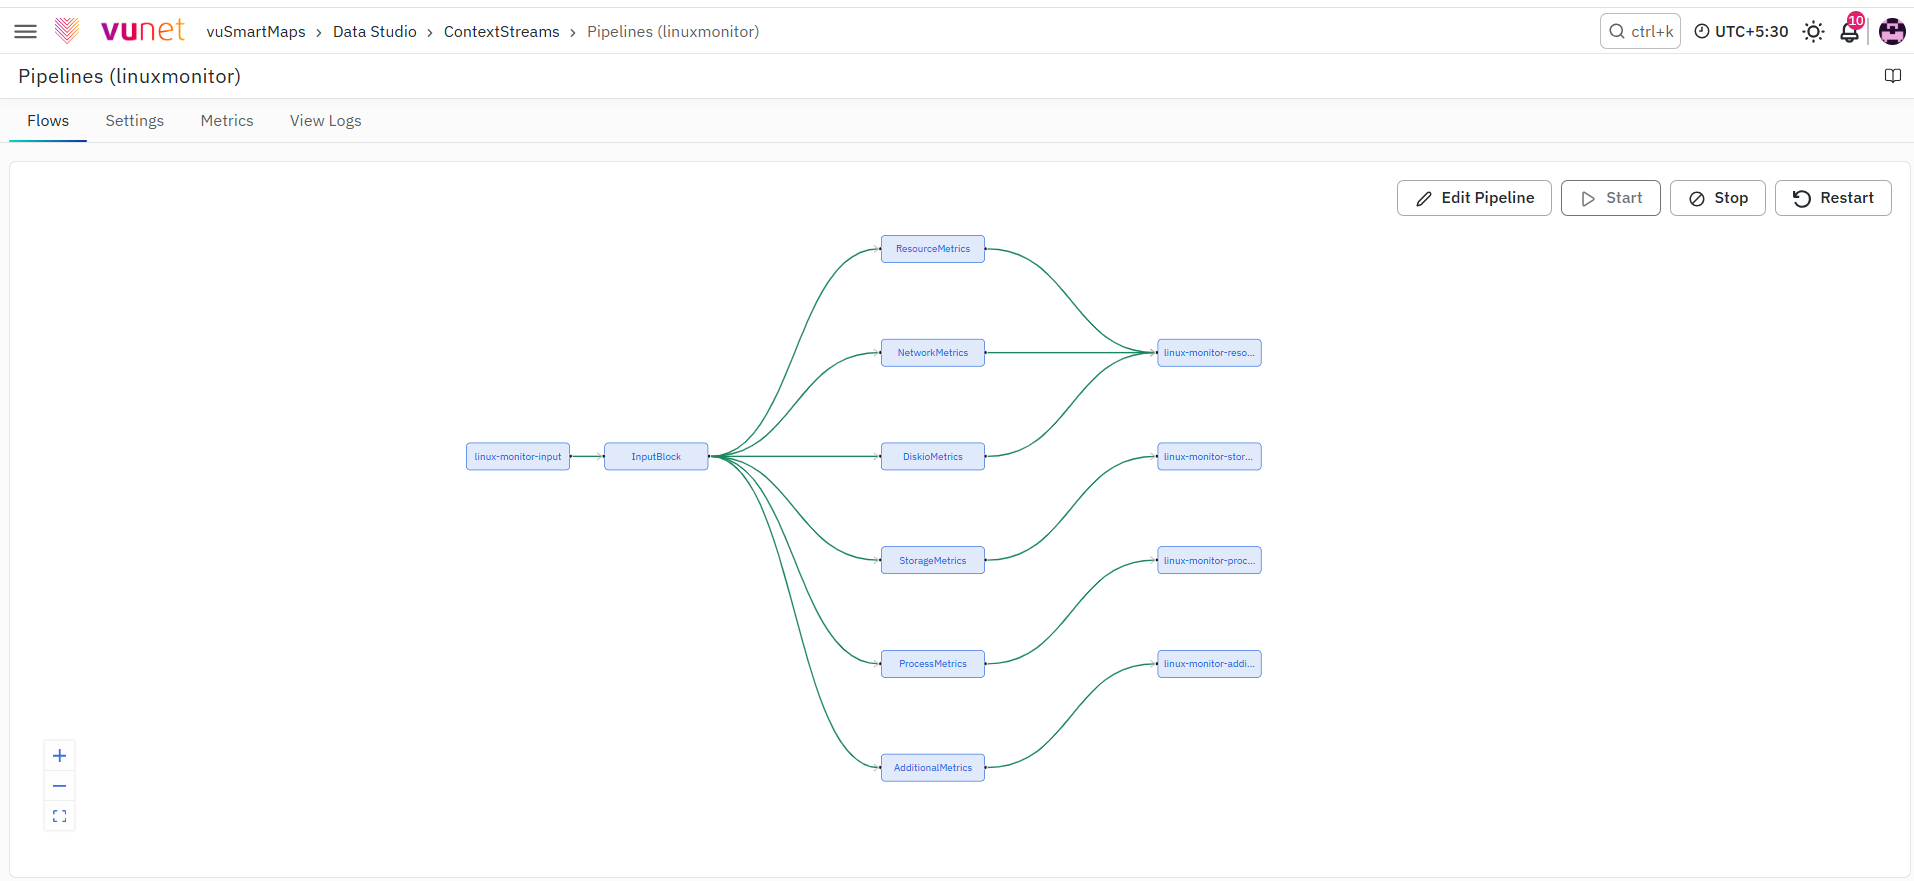
There are 4 tabs under the 'View' option. You can get the details by clicking on each of them. Following are the tabs:
Flows
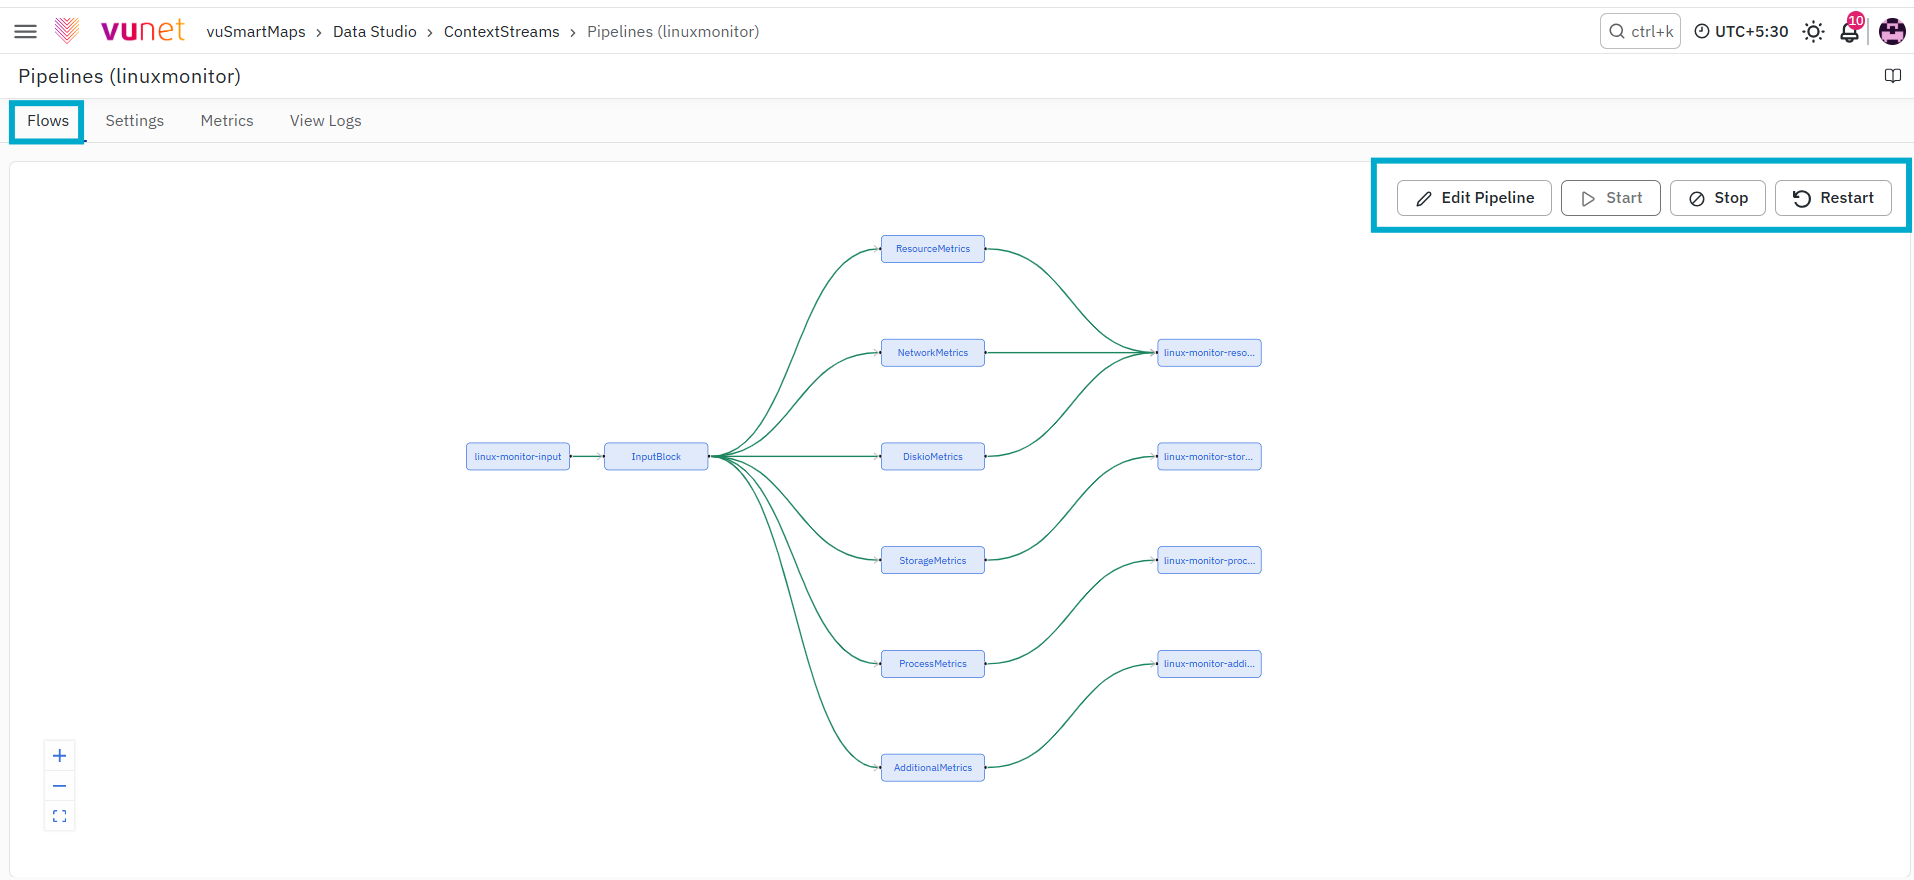
Under Flows, the pipeline flow chart is visible, providing a graphical representation of the data movement within the pipeline. If the pipeline is running, the flow chart includes subtle animations to indicate active data flow. If the pipeline is stopped, the connections are shown as solid lines, representing an idle state. This visualization helps users quickly understand the status of data movement within the pipeline.
You can perform the following actions within Flows:
- Edit Pipeline: Access the pipeline editor to modify configurations.
- Start: Start the pipeline and initiate data processing.
- Stop: Stop the pipeline to pause data ingestion and processing.
- Restart: Restart the pipeline to refresh data flow.
This feature enhances operational visibility, allowing users to monitor and manage pipelines efficiently.
Settings
You can view the Pipeline information from here.
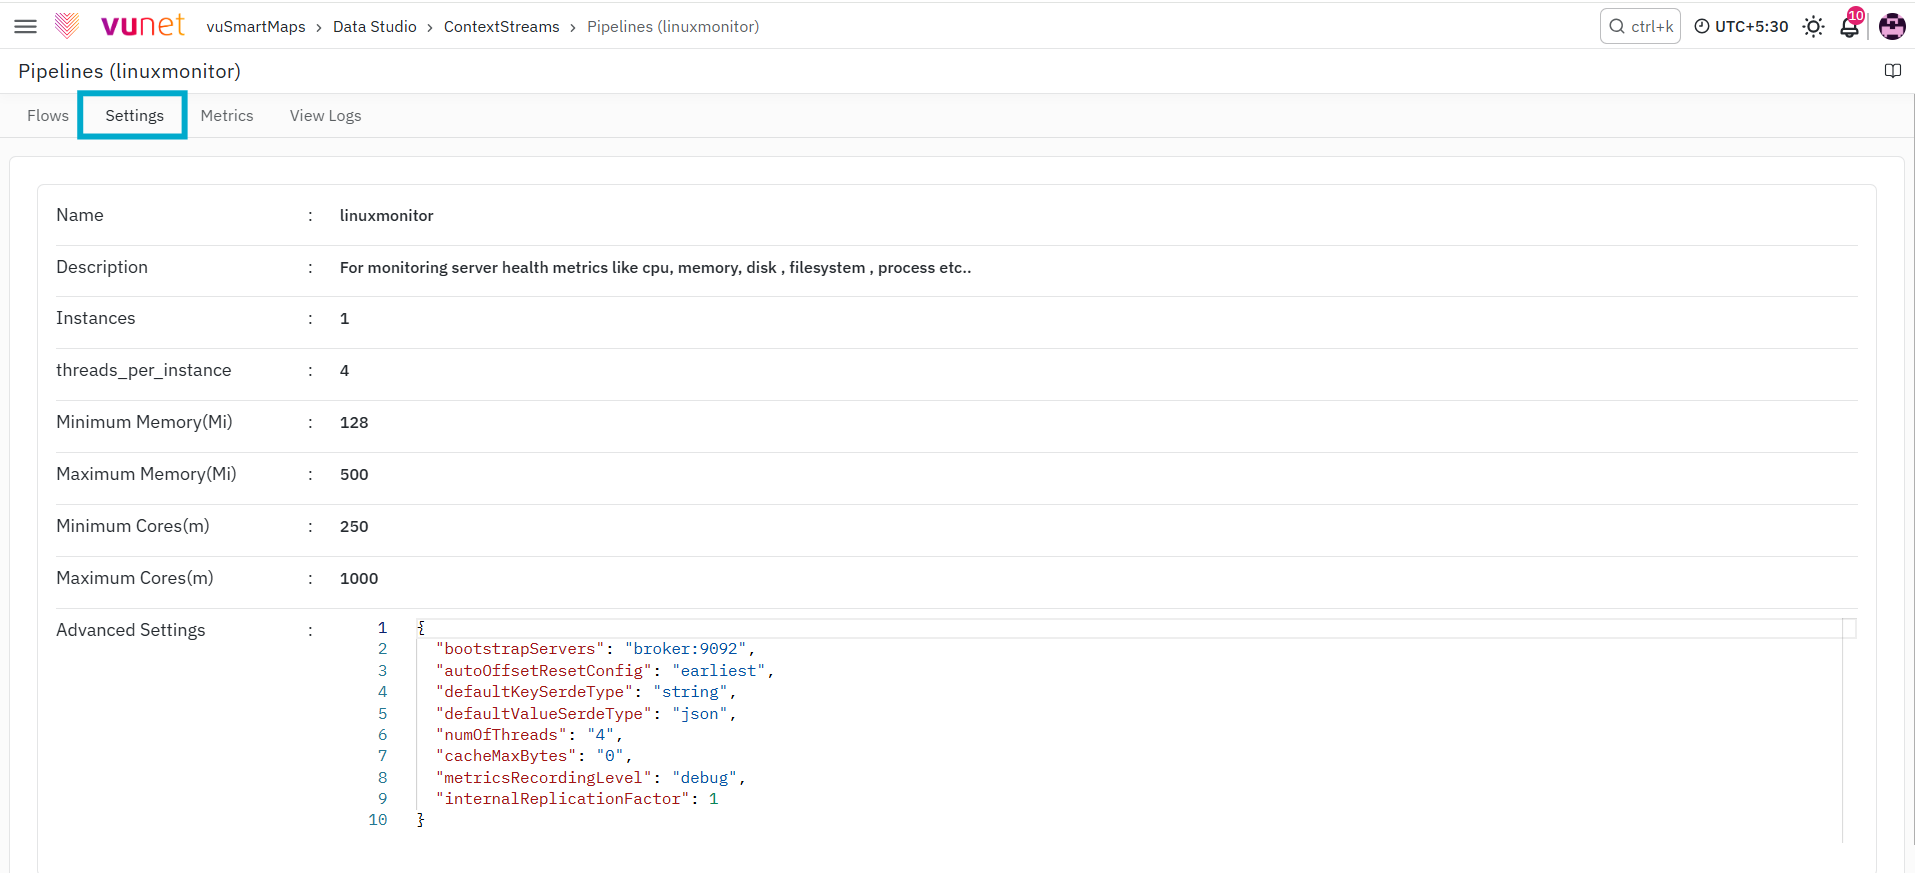
For more detailed instructions on parameters in Data Pipeline Settings, you can refer here.
Metrics
In the Metrics tab, you can find a list of essential metrics providing insights into the performance of the data pipeline, particularly focusing on the data flow.
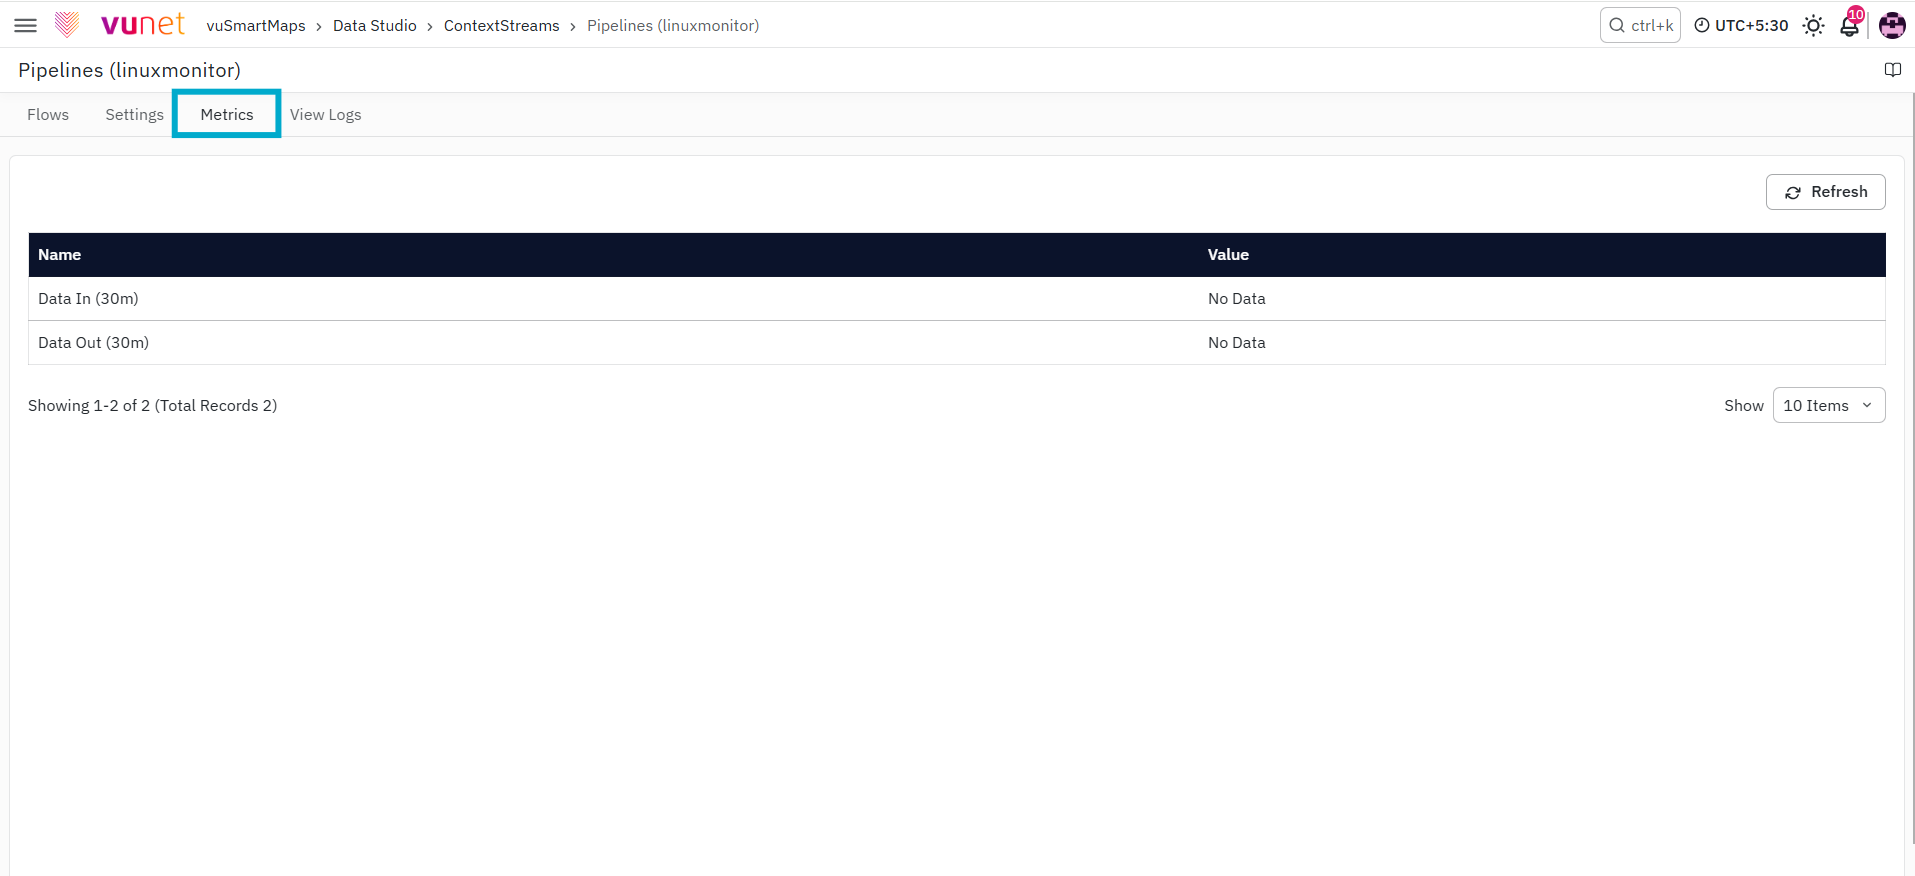
Metrics are vital for performance analysis and optimization. Navigate to the 'Metrics' tab to access real-time performance metrics, ensuring efficient operation of the data pipeline. The tab displays crucial performance indicators for a specified 30-minute period, including 'Data In' and 'Data Out' metrics, offering insights into data flow within the pipeline.
'Data In' reflects the volume of incoming data ingested into the data pipeline in the last 30 minutes, indicating the data ingestion rate. 'Data Out' represents the amount of data processed by the pipeline in the same timeframe, signifying data processing efficiency. Monitoring fluctuations in both metrics aids in assessing overall data flow dynamics and system performance.
- If 'Data In' is 0, it indicates no data ingestion.
- If 'Data Out' is 0, no streamed data is being sent to the output.
- If 'Data In' and 'Data Out' differ, it could imply streaming issues. Indeed, a thorough analysis is required to determine if the discrepancy between 'Data In' and 'Data Out' is a result of intentional transformations or if there's an underlying issue that needs attention.
During debugging, the 'Refresh' button fetches real-time metric updates, providing an updated view of current performance and aiding in promptly identifying any issues.

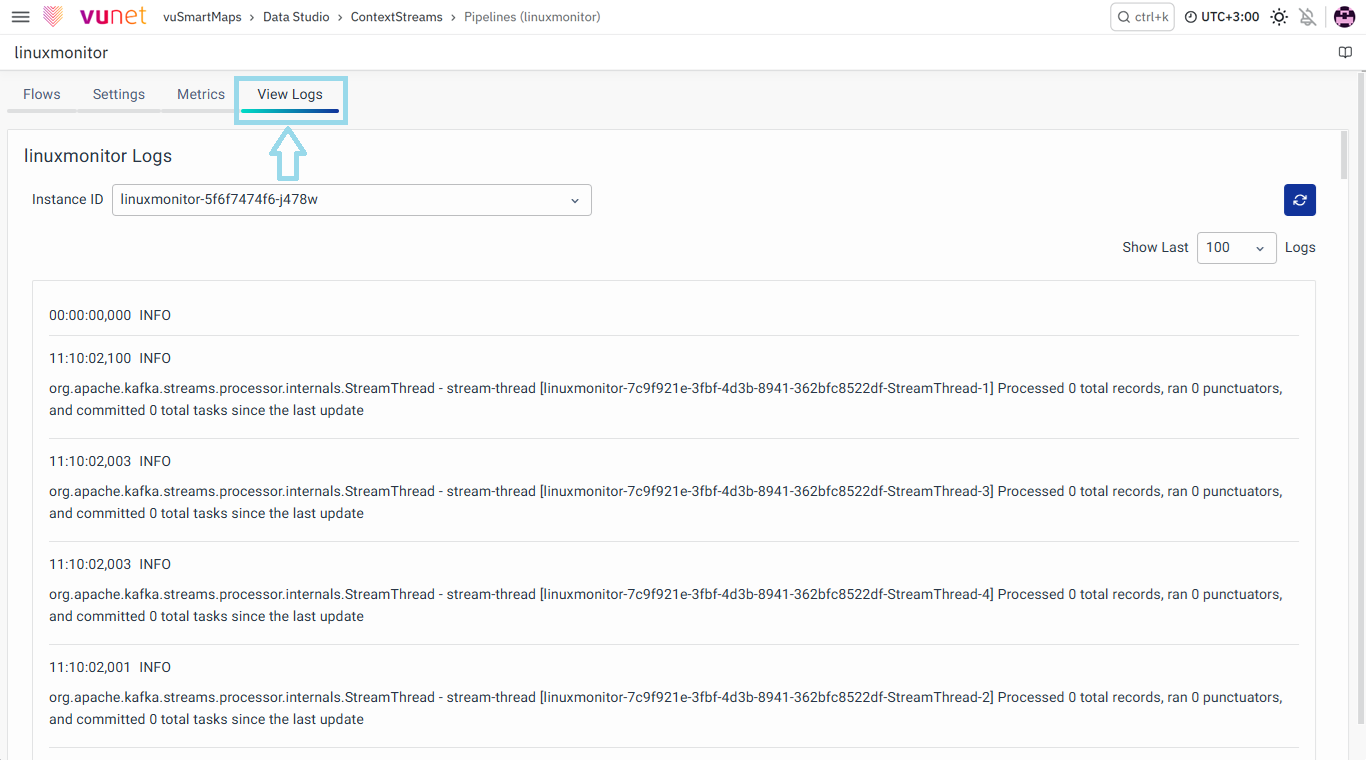
View Logs
This tab displays logs related to the pipeline's activities. To debug for deeper analysis, logs can be analyzed here. These logs provide a comprehensive view of the pipeline's execution, helping identify and address issues effectively.
Edit Pipeline
To Edit the pipeline, click on the Edit button located under the Actions column. When you click on it, you will be redirected to the following page.
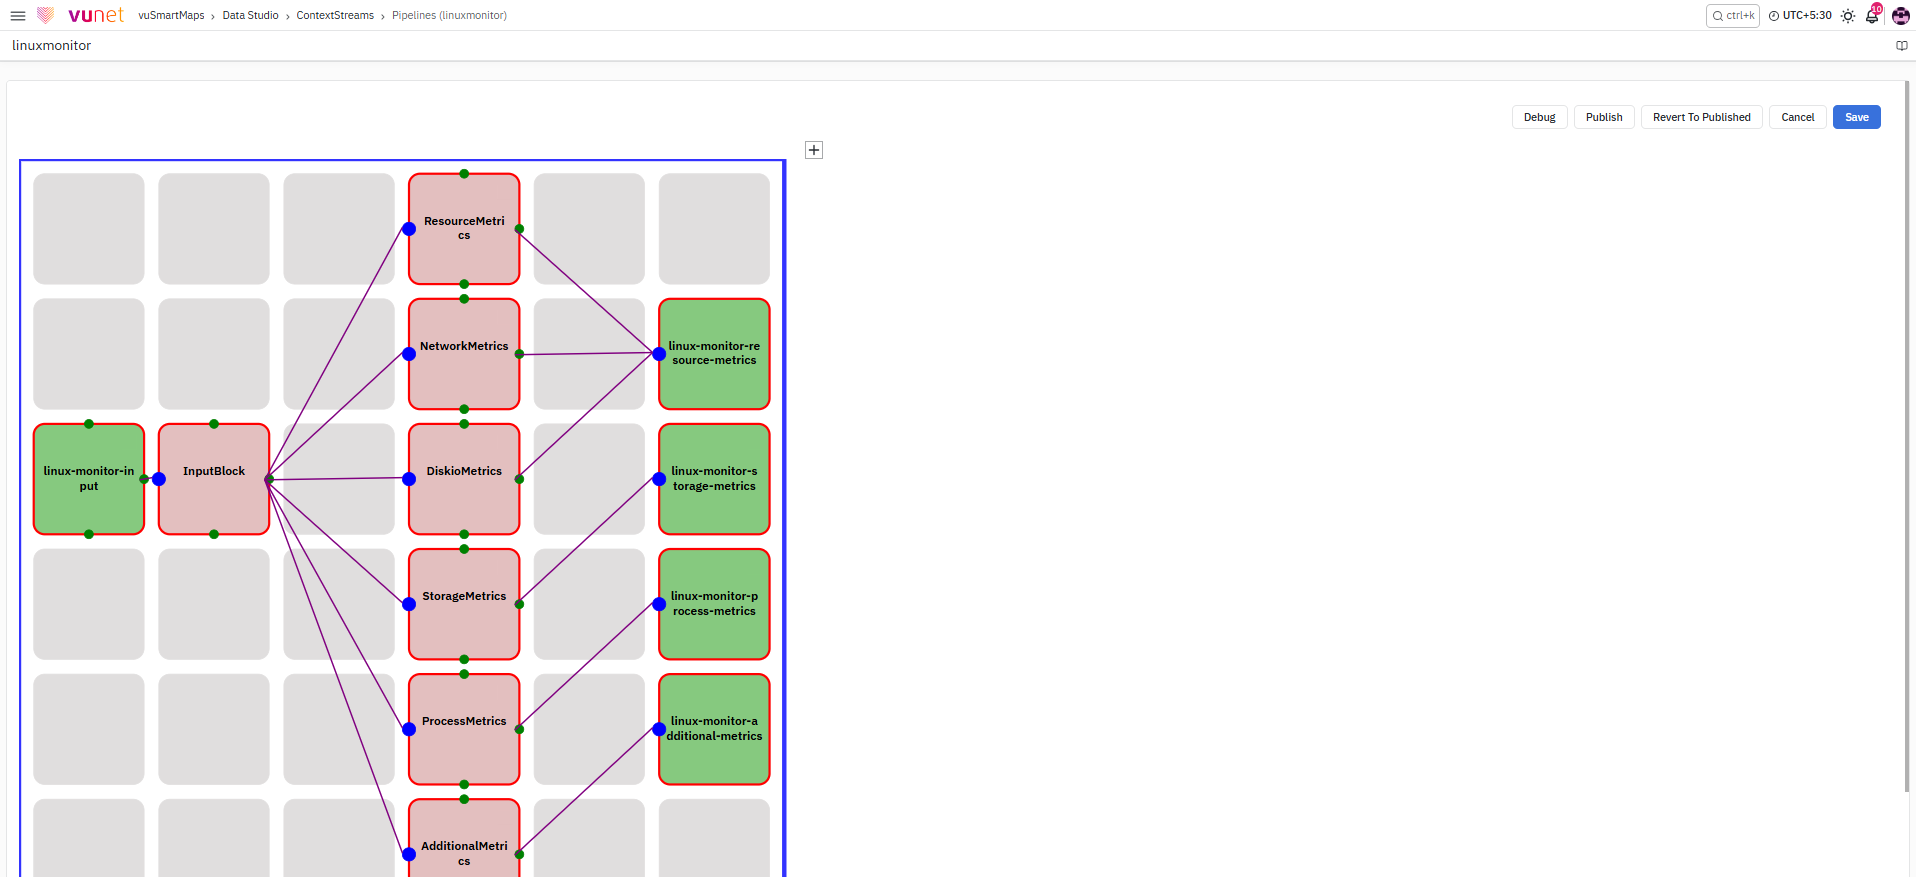
Working with the Pipeline Editor is explained in detail here.
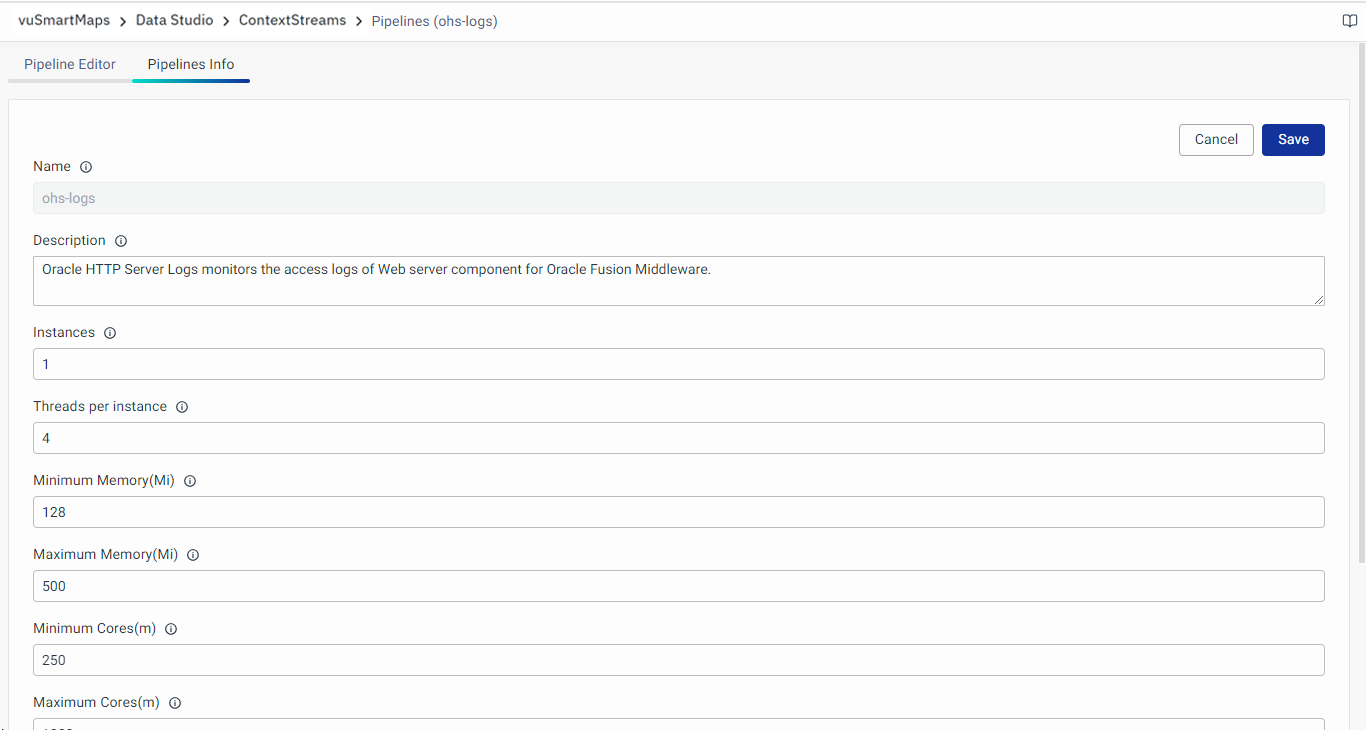
Pipelines Info
Another tab, while you are editing the pipeline, is the “Pipeline Info” under the edit section. You can configure the advanced pipeline settings from here. For more detailed instructions on parameters in Data Pipeline Settings, you can refer here.
Delete Pipeline
Select the pipeline you want to delete and click on the Delete button. You can delete the pipeline either using the Delete button at the top or under the Action column.
Click on the Delete button to confirm the delete action. The selected pipeline will be deleted and removed from the list.
Start/Stop Pipeline
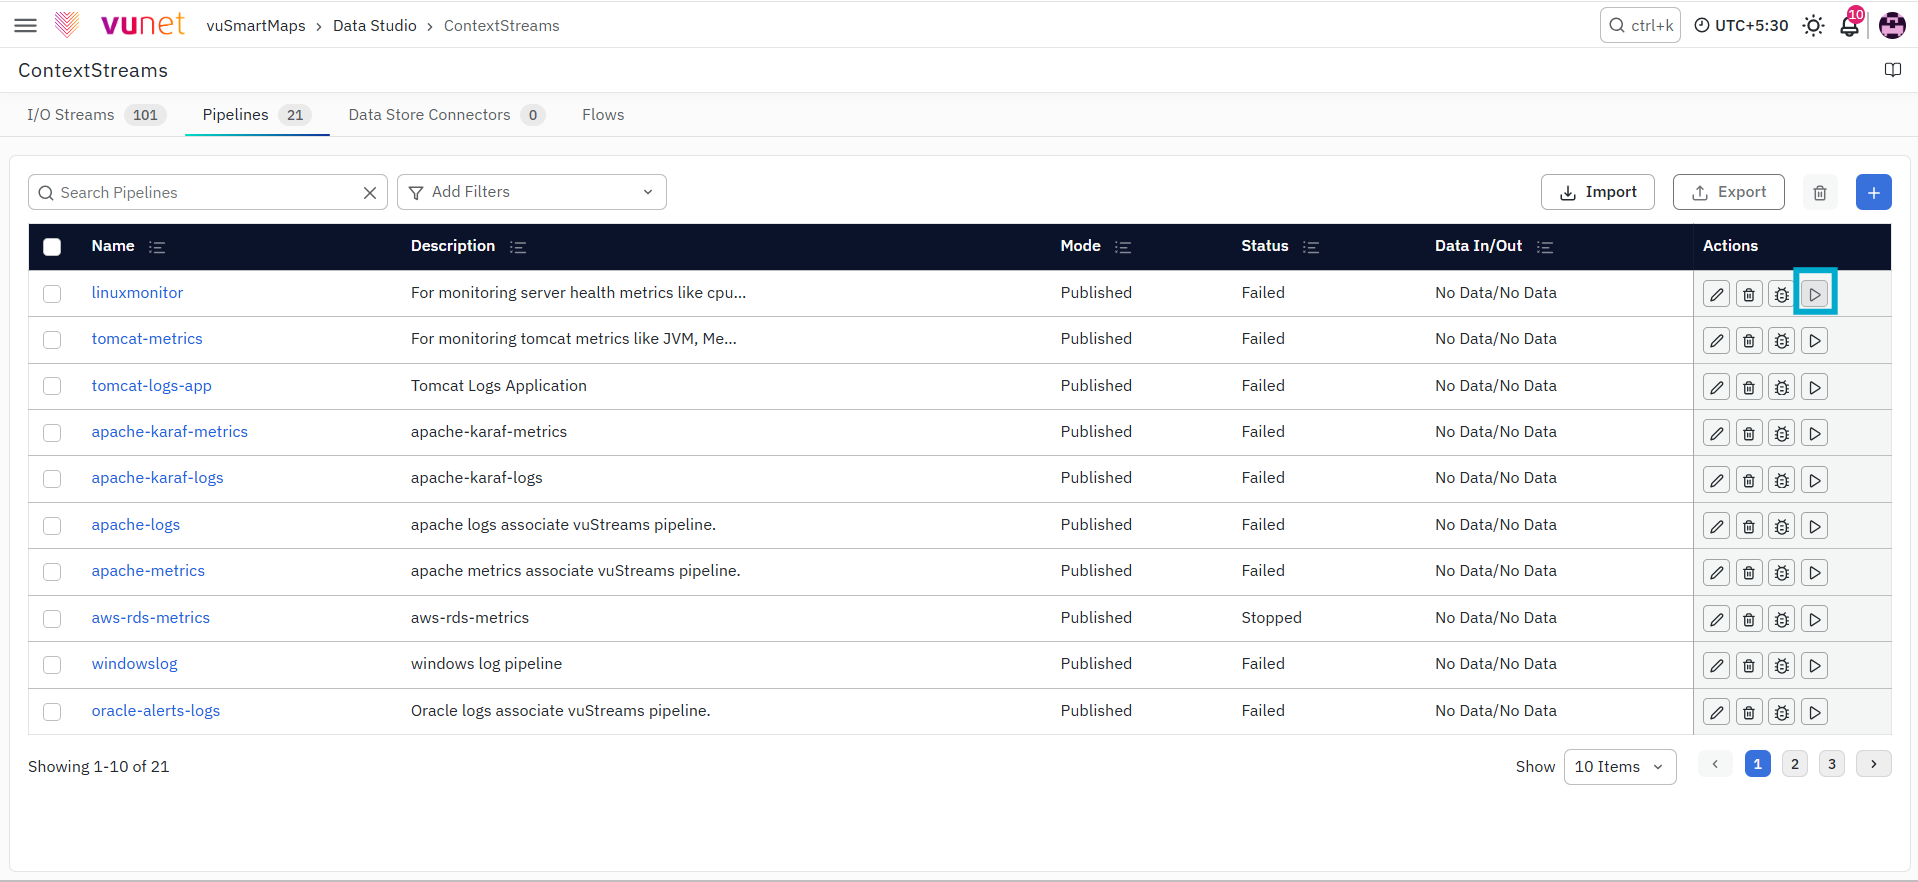
You can now easily start or stop a data pipeline in ContextStreams using the Start/Stop button available on the listing page.
- Start: Initiates the data pipeline, enabling data processing.
- Stop: Halts the data pipeline, pausing data ingestion and processing.
This feature allows you to quickly control pipeline execution without navigating to the pipeline details page, making operations more efficient.
Manage DataStore Connectors
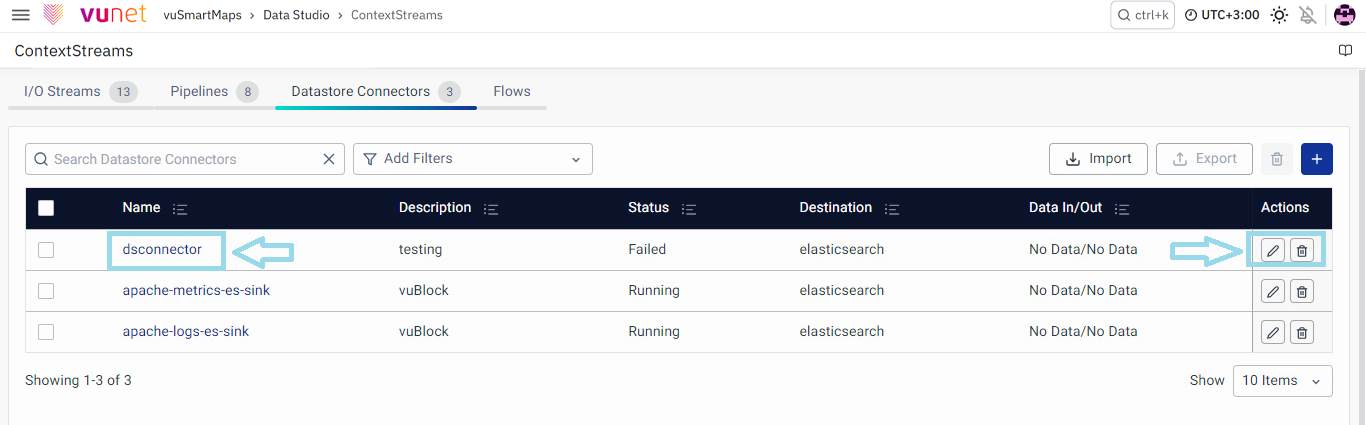
There are 3 actions for all the connectors listed: View, Edit, and Delete.
View DataStore Connector
By clicking on the Datastore connector name, it shows the connector details where you can also see the total Data (messages read and sent). There are two tabs under the view option:
DataStore Connectors Info
Here, the Datastore Connector details are visible, and you can also configure the advanced settings options from here.
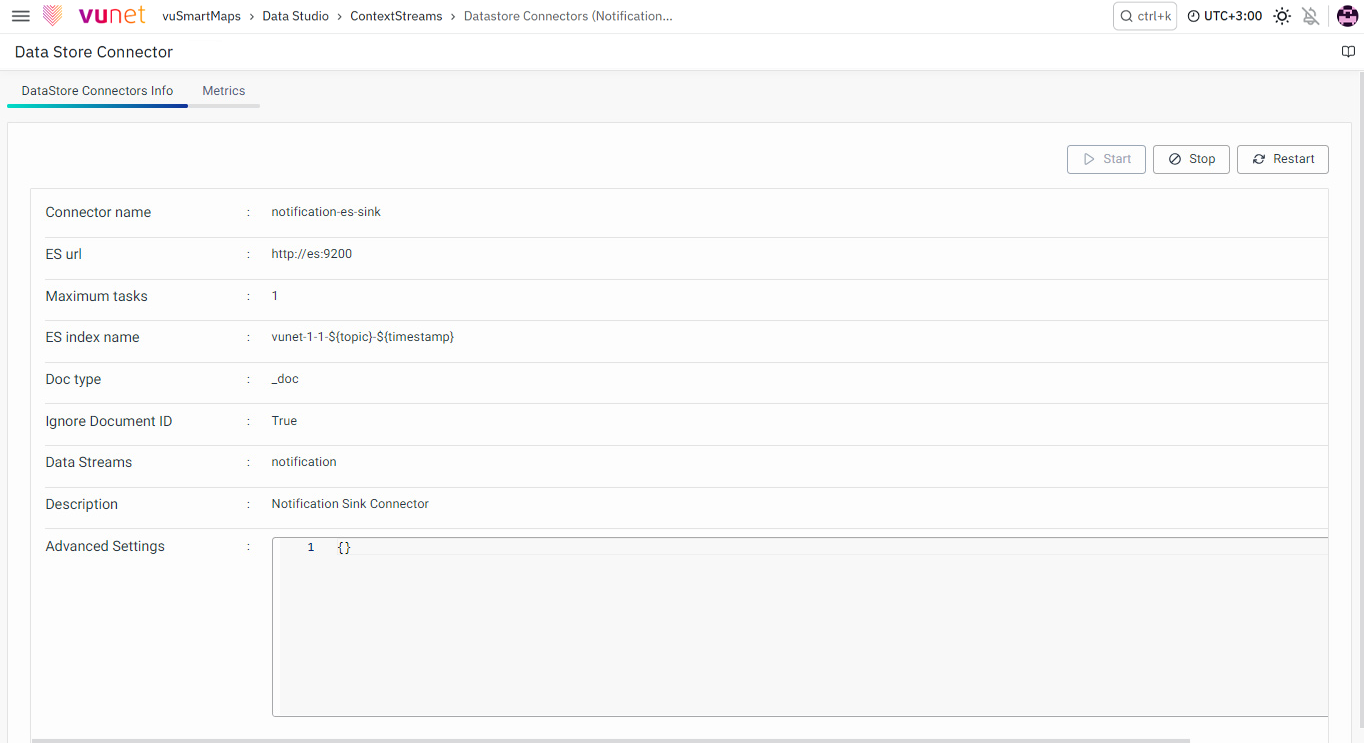
You can perform the following action:
- Start: Start the connector.
- Stop: Stop the connector.
- Restart: Restart the connector.
Metrics
Navigate to the 'Metrics' tab to access a comprehensive list of metrics for your DataStore Connectors.
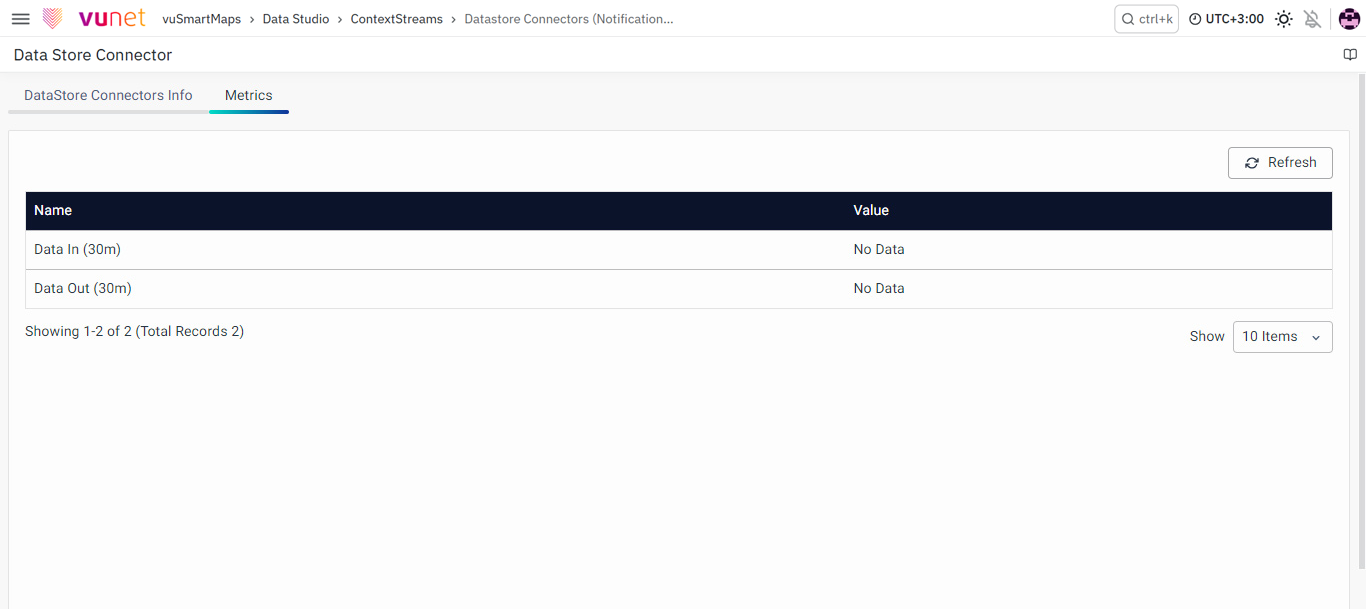
Metrics are vital for performance analysis and optimization. Navigate to the 'Metrics' tab to access real-time performance metrics, ensuring efficient operation of the DataStore Connector. The tab displays crucial performance indicators for a specified 30-minute period, including 'Data In' and 'Data Out' metrics, offering insights into data flow within the streams.
'Data In' reflects the volume of incoming data ingested into the connector in the last 30 minutes, indicating the data ingestion rate. 'Data Out' represents the amount of data processed by the connector in the same timeframe, signifying data processing efficiency. Monitoring fluctuations in both metrics aids in assessing overall data flow dynamics and system performance.
- If 'Data In' is 0, it indicates no data ingestion.
- If 'Data Out' is 0, no streamed data is being sent to the output.
- If 'Data In' and 'Data Out' differ, it could imply streaming issues.
During debugging, the 'Refresh' button fetches real-time metric updates, providing an updated view of current performance and aiding in promptly identifying any issues.
Edit DataStore Connector
The 'Edit Connector' option enables you to configure specific settings and parameters for your connector. Make the desired changes to the configurations and click Save to apply them.
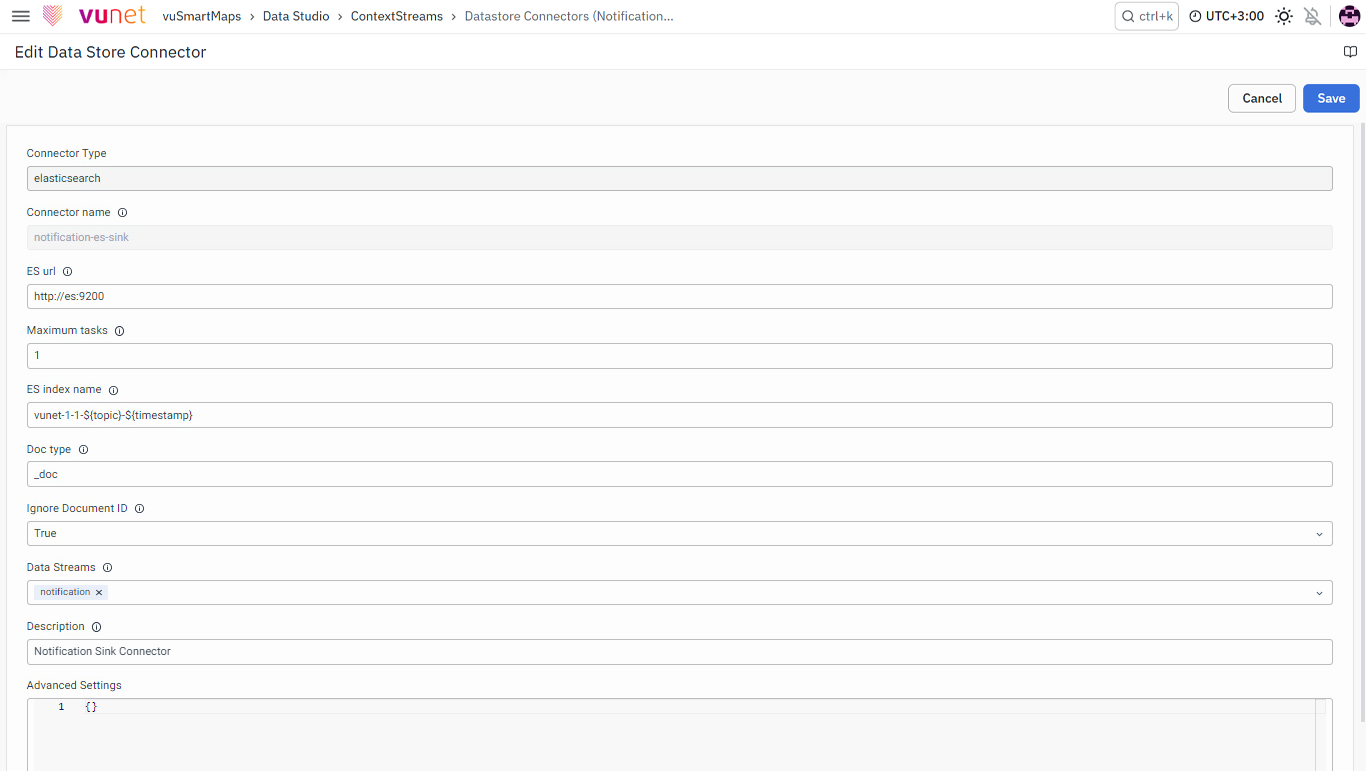
For detailed information on the fields and their configurations, please refer to the steps mentioned during the creation of the connector (ES Sink Connector, and JDBC Sink Connector).
Delete DataStore Connector
Select the Data Source Connector you want to delete and click on the Delete icon. Click on the Delete button to confirm the delete action. The selected Data Source Connector will be deleted and removed from the list.
Flows
Flows serve as a dynamic visual representation, elucidating the intricate data flow within the system. It vividly illustrates the path data follows, originating from the source data, traversing through collection agents, and concluding in permanent storage.
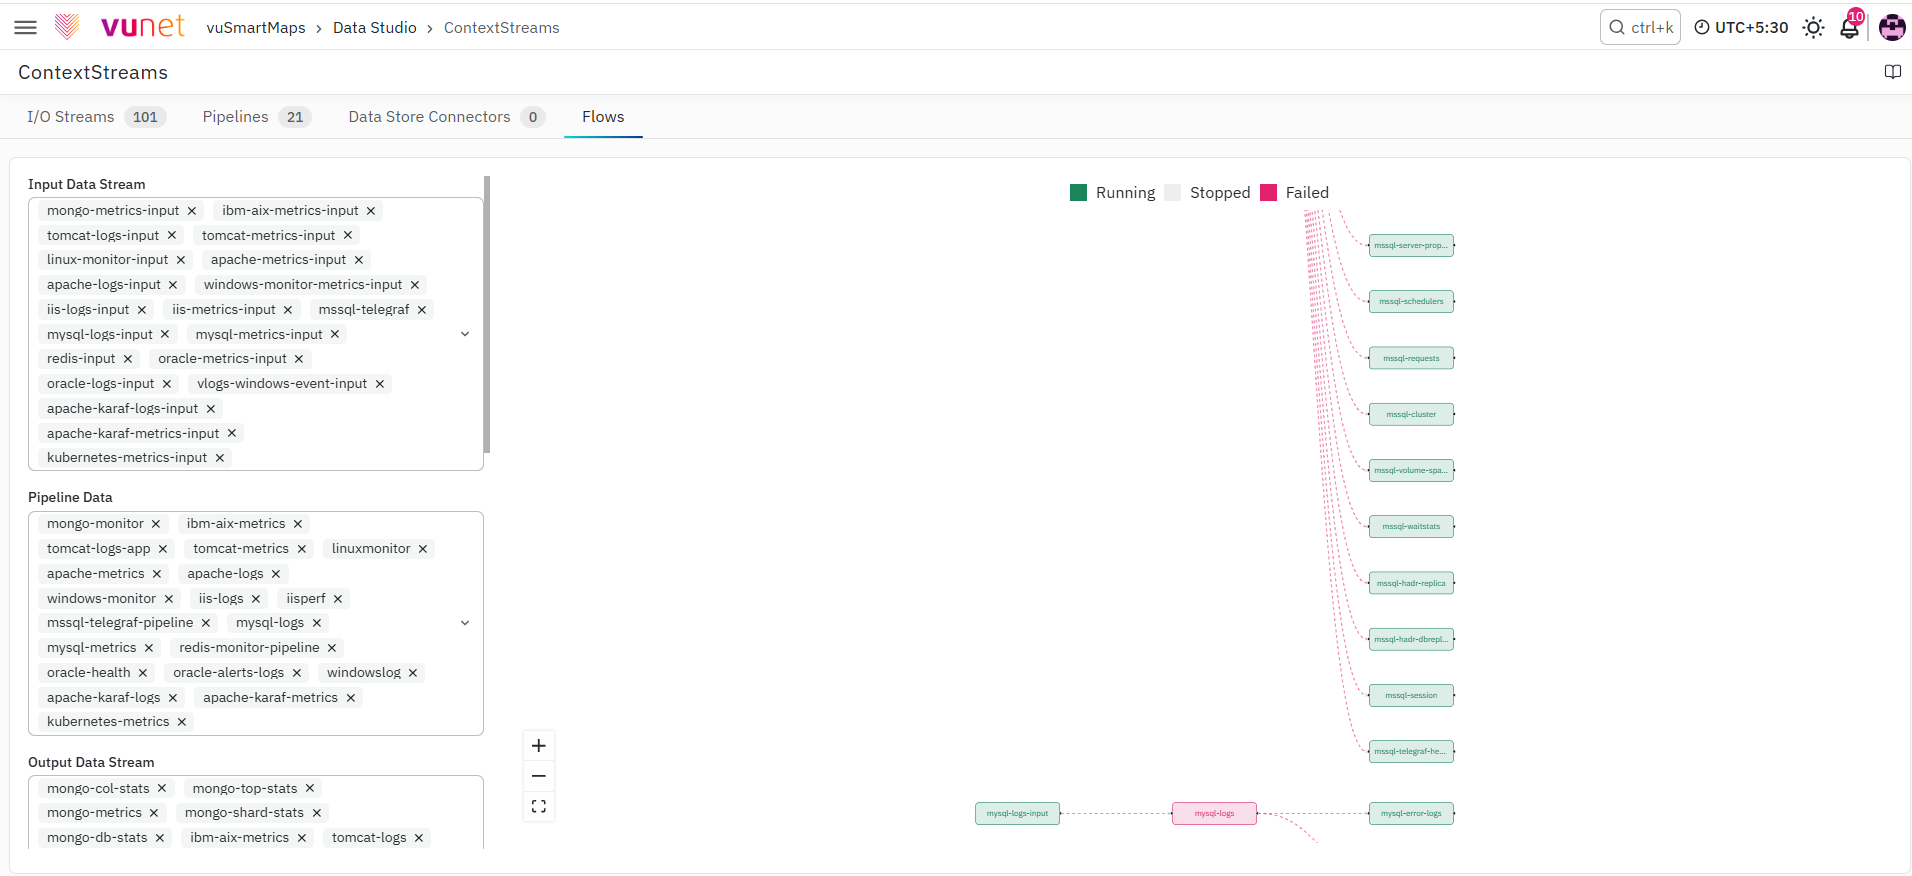
In this section, the left panel serves as a tool for selecting and configuring the elements you want to visualize on the right panel. Utilize the options for Input Data Stream, Pipeline Data, Output Data Stream, and DataStore Connector to tailor the displayed flows based on your preferences and requirements. This configuration allows you to optimize the visualization and focus on the specific aspects of your data flow journey.
Flow Dimension Controls
- Zoom In (+): Enlarge specific sections of the flow for detailed examination and fine-tuning.
- Zoom Out (-): Zoom out to get an overarching view of the entire data journey.
- Reset to Normal: Revert the flow dimensions to their standard settings for a comprehensive perspective.
Flows empower you to visualize, adapt, and optimize the data's journey from its origin to permanent storage, enhancing your understanding and control over the data processing pipeline.
What happens after the step
After a ContextStream is successfully configured and published:
- Incoming data begins flowing through the configured Input Streams.
- Data is processed through the configured pipeline blocks.
- Transformation plugins enrich, parse, manipulate, and contextualize incoming data.
- Filter expressions route data through the appropriate processing paths.
- Processed data is written to Output Streams.
- DataStore Connectors forward transformed data to storage destinations.
- The platform indexes and stores processed data.
- Dashboards, Storyboards, Alerts, Reports, and Analytics modules can consume the processed data.
- Pipeline metrics become available for operational monitoring.
- Administrators can continuously monitor pipeline health and performance through the ContextStreams management interface.
Tips and Best Practices
- Analyze the data processing requirements before designing a pipeline.
- Use meaningful names for I/O Streams, pipelines, and processing blocks.
- Keep transformation logic modular by grouping related plugins within blocks.
- Validate pipelines using debugging tools before publishing.
- Configure resource limits based on expected workload and throughput.
- Monitor pipeline metrics and logs regularly to identify performance issues.
- Use filter expressions to route data efficiently through processing blocks.
- Review DataStore Connector configurations to ensure processed data is stored successfully.
- Minimize unnecessary transformations to improve processing efficiency.
Troubleshooting
- Issue: Data is not appearing in the Input Stream.
- Possible Cause: Source configuration issue.
- Solution: Verify source connectivity and ensure incoming data is flowing correctly.
- Issue: Pipeline remains in Draft state.
- Possible Cause: The pipeline has not been published.
- Solution: Validate the pipeline configuration and publish it.
- Issue: No output is generated from the pipeline.
- Possible Cause: Block configuration issue.
- Solution: Verify the configured plugins, block settings, and filter expressions.
- Issue: DataStore Connector is not receiving data.
- Possible Cause: Connector misconfiguration.
- Solution: Validate the connector configuration and verify the destination is accessible.
- Issue: Processing delays are observed.
- Possible Cause: Insufficient pipeline resources.
- Solution: Review the configured thread count, pipeline instances, CPU, and memory allocation.
- Issue: Data transformation results are incorrect.
- Possible Cause: Plugin configuration error.
- Solution: Review the plugin configuration and validate the transformation logic.
- Issue: Filter expressions are not working.
- Possible Cause: Invalid expression syntax.
- Solution: Verify the filter expression syntax and confirm that the referenced fields are valid.
- Issue: Pipeline performance has degraded.
- Possible Cause: High data volume or insufficient resources.
- Solution: Increase the number of pipeline instances or worker threads based on throughput requirements.
- Issue: Debug output is empty.
- Possible Cause: No incoming events are available.
- Solution: Verify that source data is available and that the Input Stream is receiving events.
- Issue: Pipeline deployment fails.
- Possible Cause: Configured resource limits exceed the supported values.
- Solution: Review the configured memory and CPU limits and ensure they are within the supported range.
- Issue: Data is not reaching dashboards.
- Possible Cause: Downstream storage or indexing issue.
- Solution: Verify the DataStore Connector configuration and ensure the storage destination is healthy and indexing data correctly.
- Issue: Contextualized fields are missing.
- Possible Cause: Enrichment plugin is not configured correctly.
- Solution: Review the enrichment plugin configuration and verify the processing sequence within the pipeline.
FAQs
What information is available when viewing an I/O Stream?
The I/O Stream view includes I/O Streams Info, Readers, and Metrics tabs. These show stream configuration and transformations, configured readers, and performance data such as Data In, Data Out, and Total Compressed Data.
What time period do the management metrics cover?
The I/O Stream, Data Pipeline, and DataStore Connector Metrics tabs display performance indicators for a specified 30-minute period. The Refresh button fetches updated metric values during debugging.
What actions can I perform on a running pipeline?
You can start, stop, restart, or edit a pipeline. Starting enables data processing, stopping pauses data ingestion and processing, and restarting refreshes the data flow.
What is the difference between stopping and deleting a pipeline?
Stopping a pipeline pauses data ingestion and processing while keeping the pipeline available. Deleting a pipeline removes it from the list after the deletion is confirmed.
Which actions are available for a DataStore Connector?
You can view, edit, or delete a DataStore Connector. From its details, you can also start, stop, or restart the connector.
What does the Flows view show?
The Flows view visually represents the data path from the source through collection agents, pipelines, output streams, and DataStore Connectors to permanent storage. You can select flow dimensions such as Input Data Stream, Pipeline Data, Output Data Stream, and DataStore Connector.
What does Data In and Data Out indicate?
Data In represents the volume of data ingested during the displayed period, while Data Out represents the amount of data processed or sent onward. A difference between the two may indicate streaming issues, although pipeline transformations can also affect the values.
