Export Dashboard/Panels
Exporting Dashboards and Panels allows you to save them in either Image or PDF format for external use. This feature provides a convenient way to share your visual data with others for various purposes.
Export a Dashboard Image
To export a Dashboard as an Image, follow these steps:
-
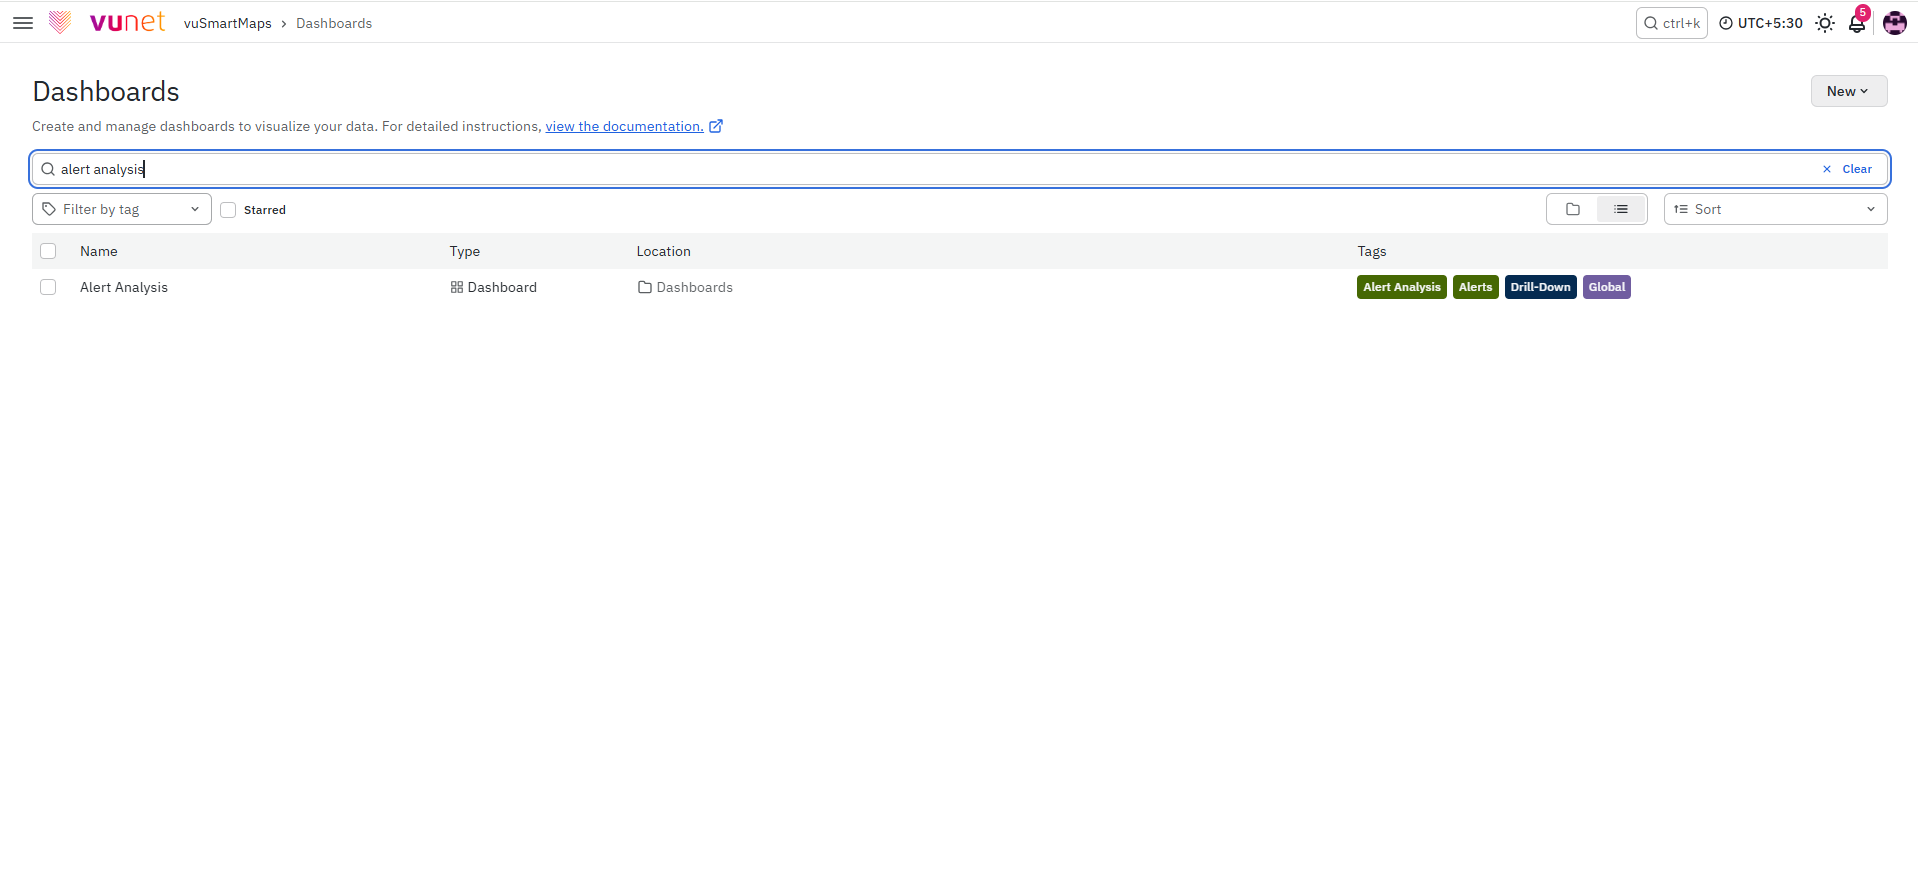
Navigate to the Left Navigation menu at the top left and click on Dashboards.
-
Open the Dashboard you want to export—for example, the UTM dashboard.
-
Click on the Share button.
-
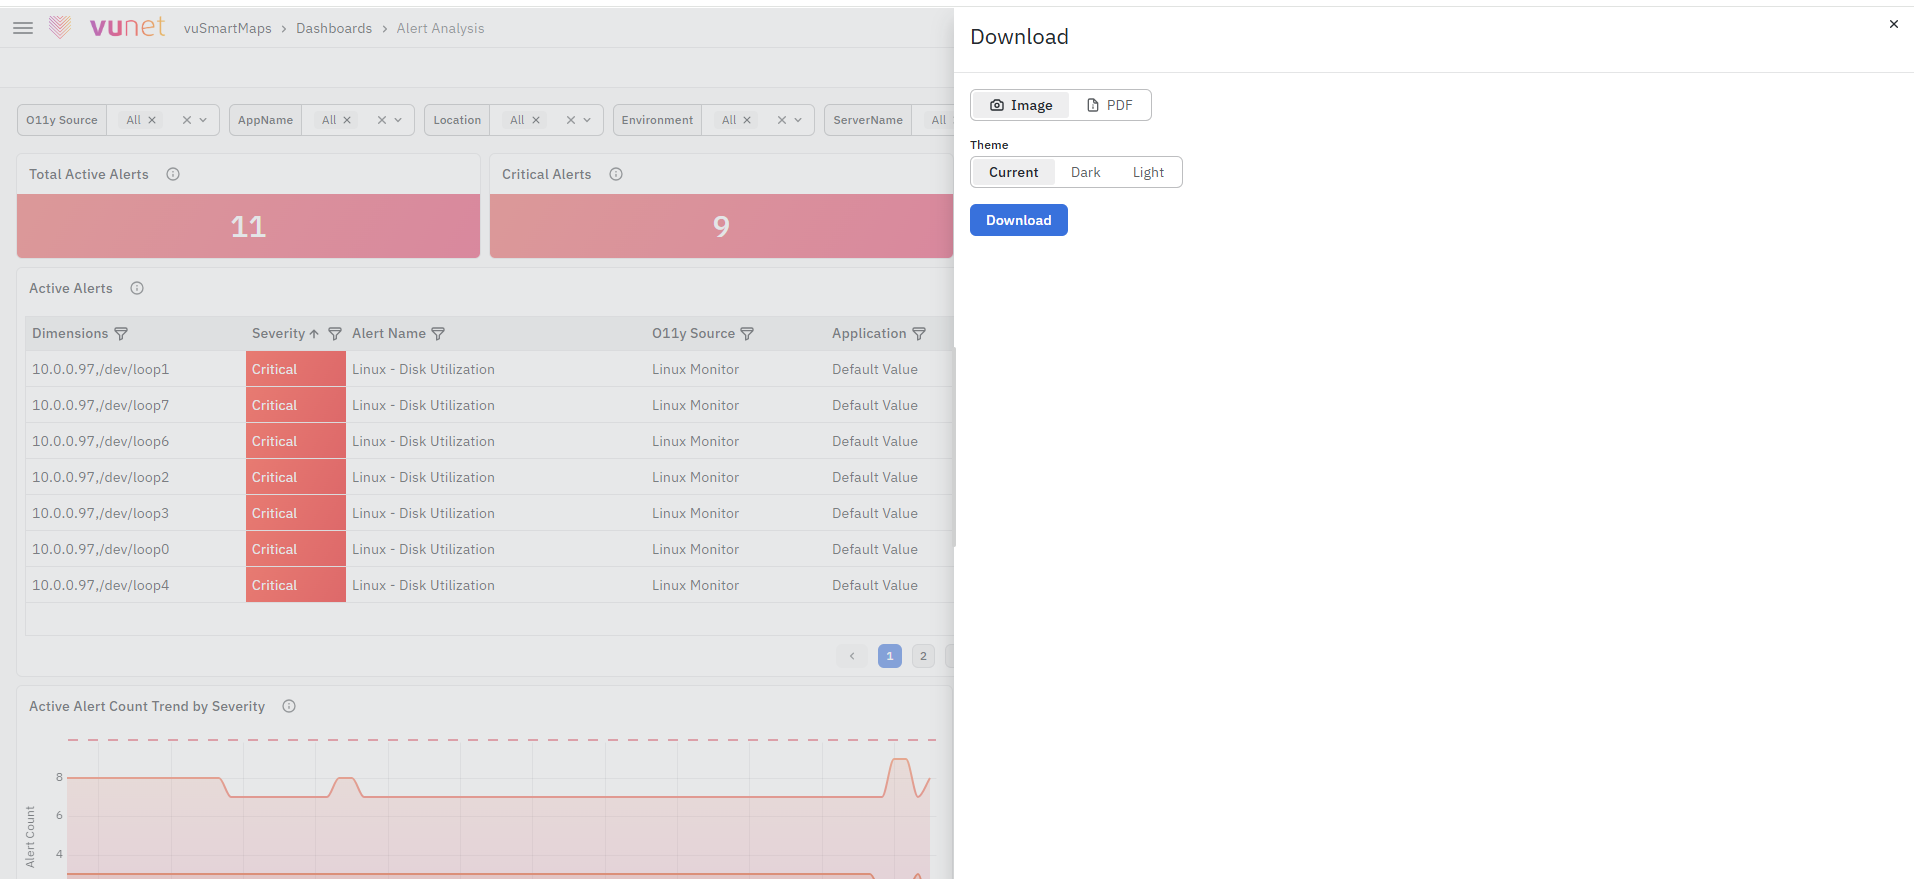
Go to the Download tab.
-
Select Image as the format and the required Theme.
-
Click on the Download button.
The exported Dashboard is downloaded as a PNG Image. The downloaded file will have the current timestamp.
Export a Panel Image
To export a Panel as an Image, follow these steps:
-
Navigate to the Left Navigation menu at the top left and click on Dashboards.
-
Open the Dashboard from which you want to Export the Panel.
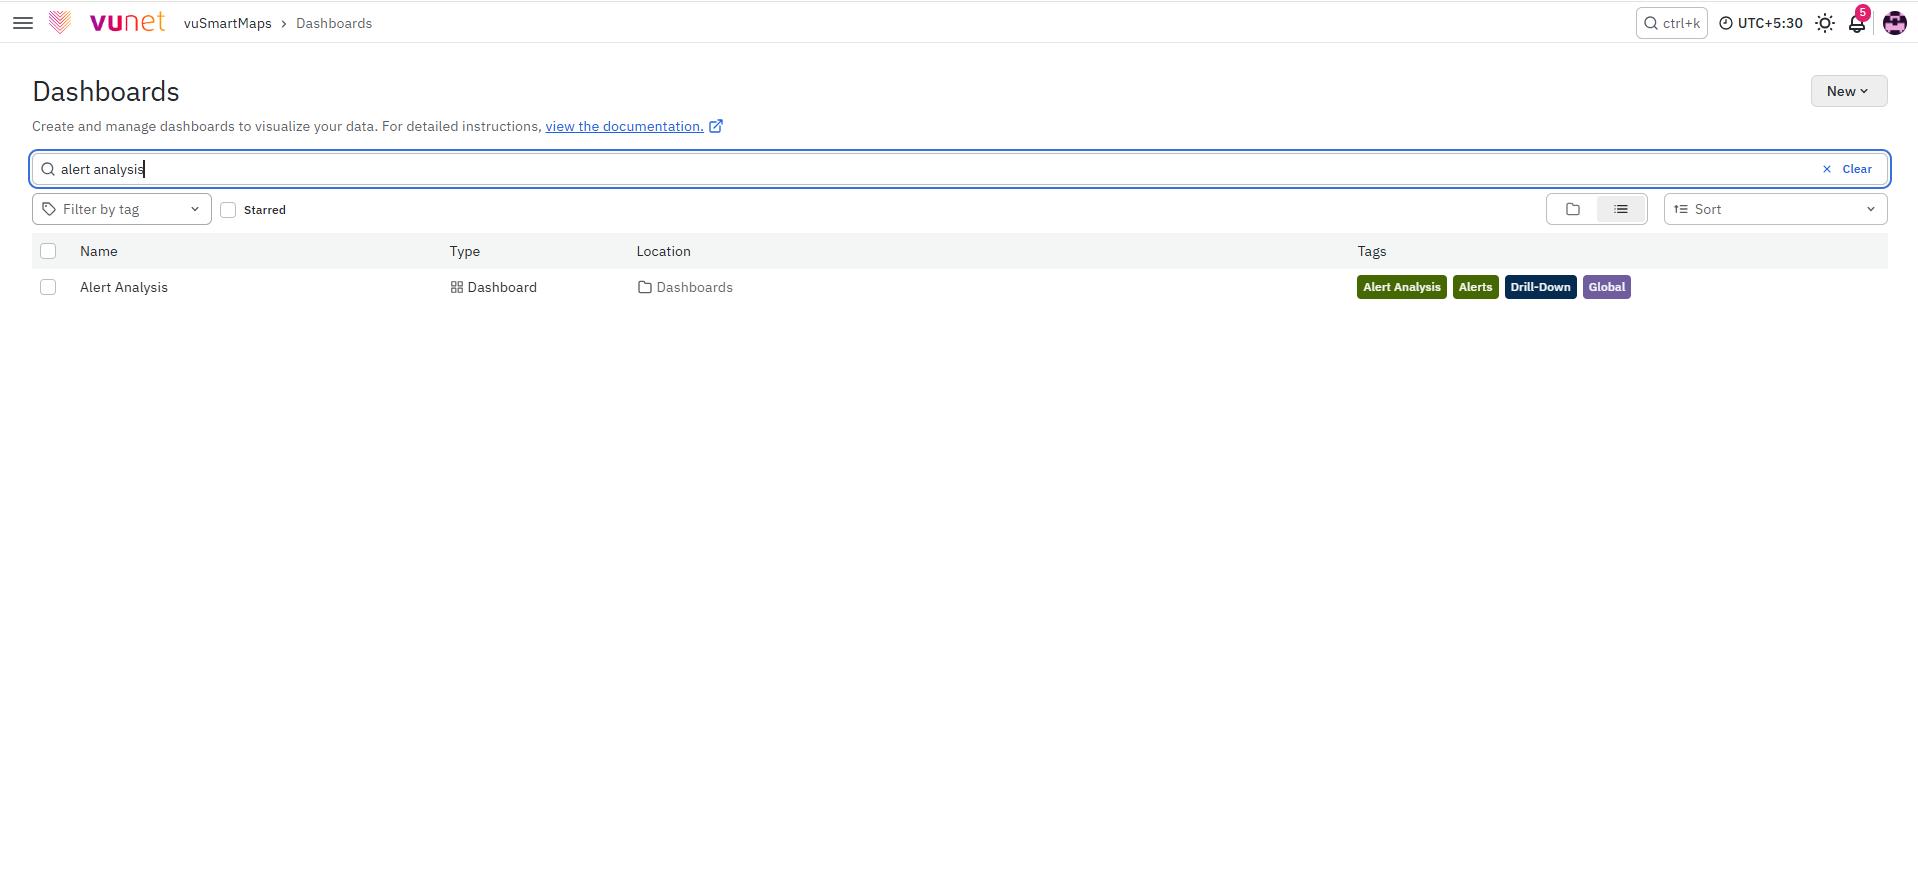
- Click on the Panel options to reveal the menu and then click on the Share option.
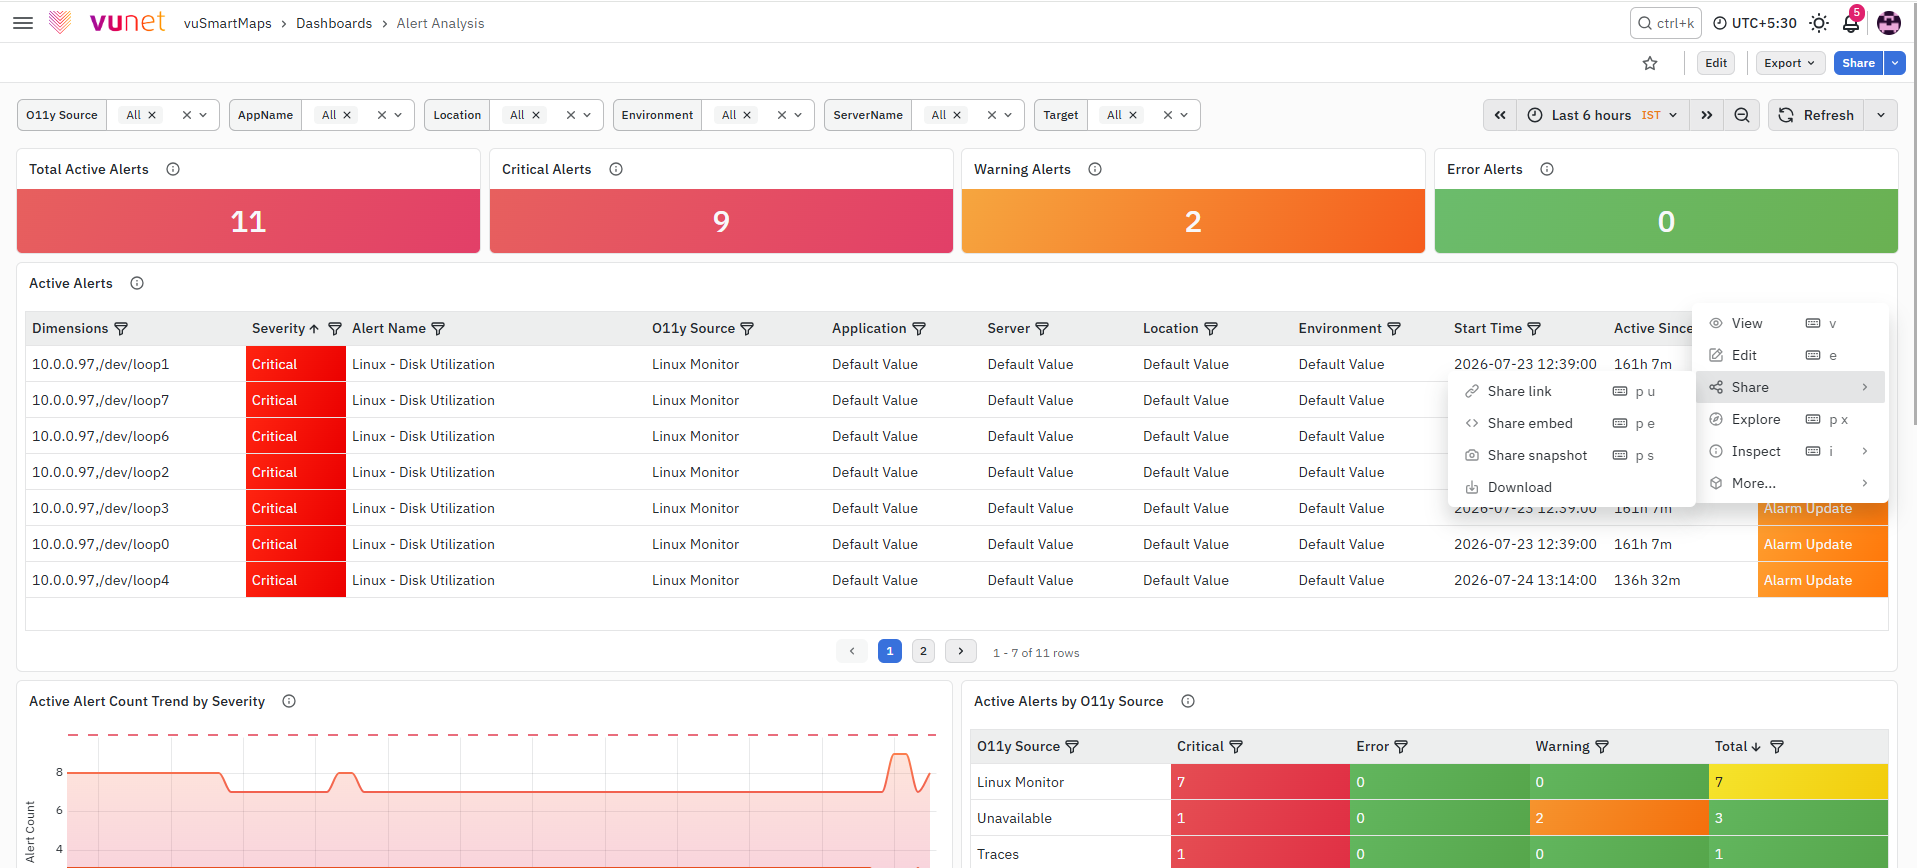
- Go to the Download Tab.
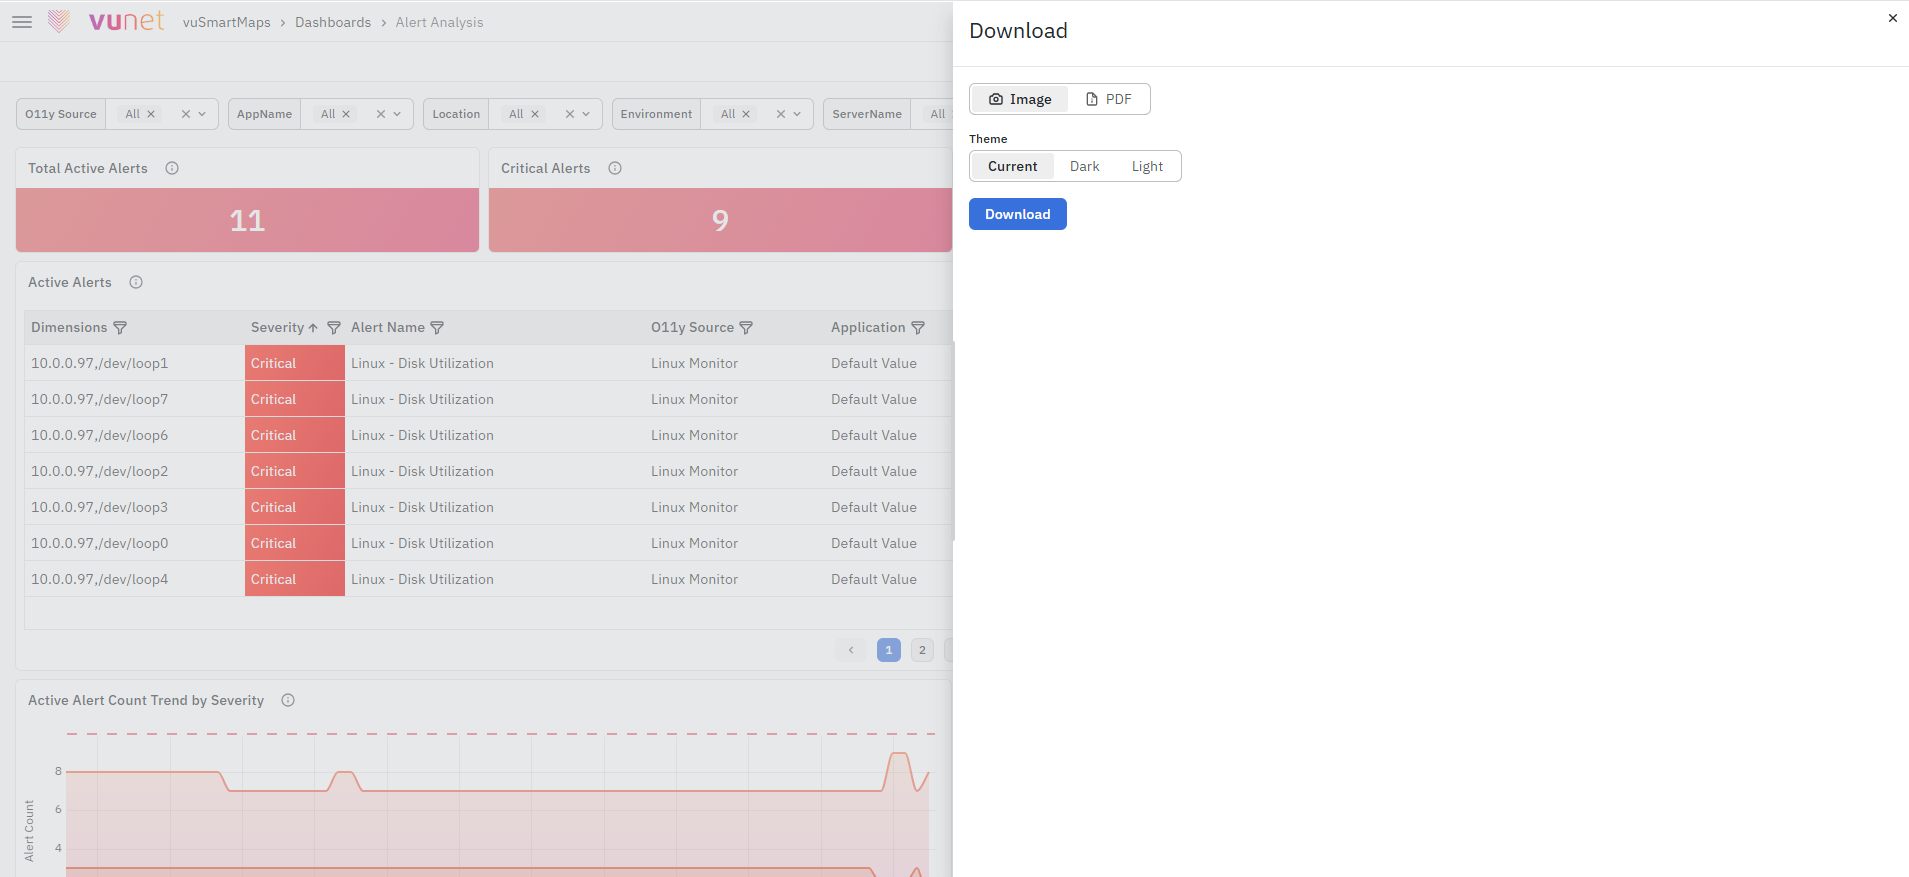
- Select Image as the format and the required Theme.
- Click on the Download button.
The exported panel downloads as a PNG Image.
Export a Dashboard PDF
To export a Dashboard as a PDF, follow these steps:
-
Navigate to the Left Navigation menu at the top left and click on Dashboards.
-
Open the Dashboard you want to export.
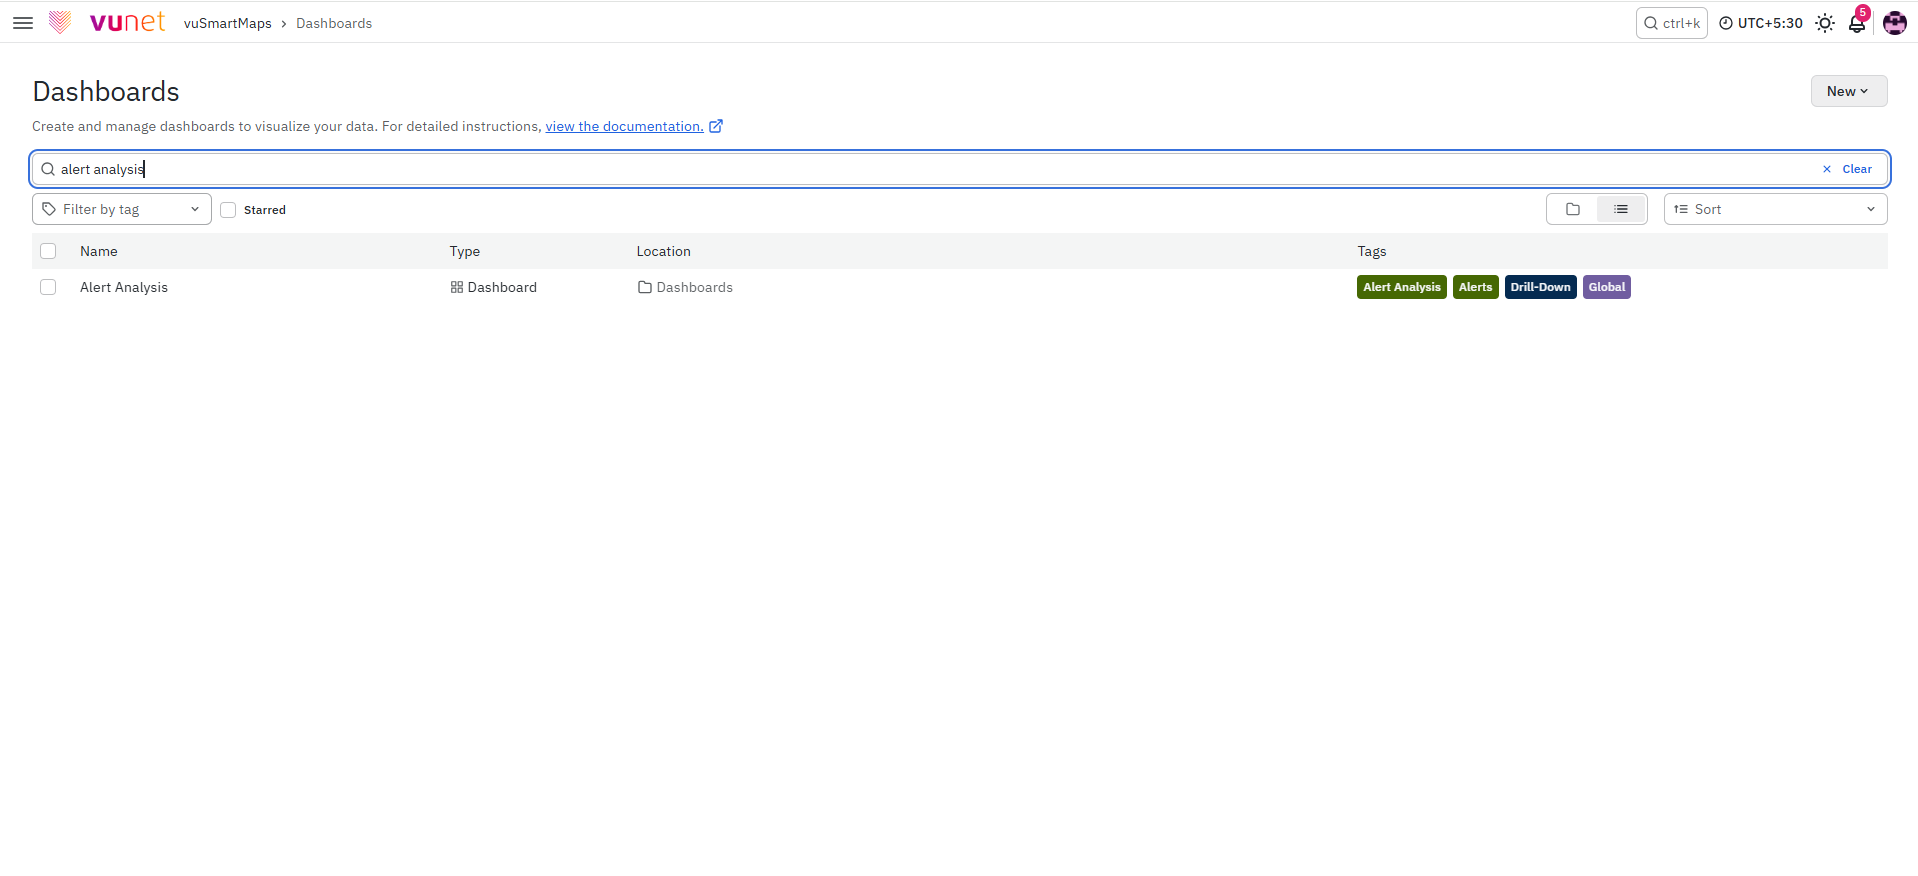
- Click on the Share button.
- Go to the Download tab.
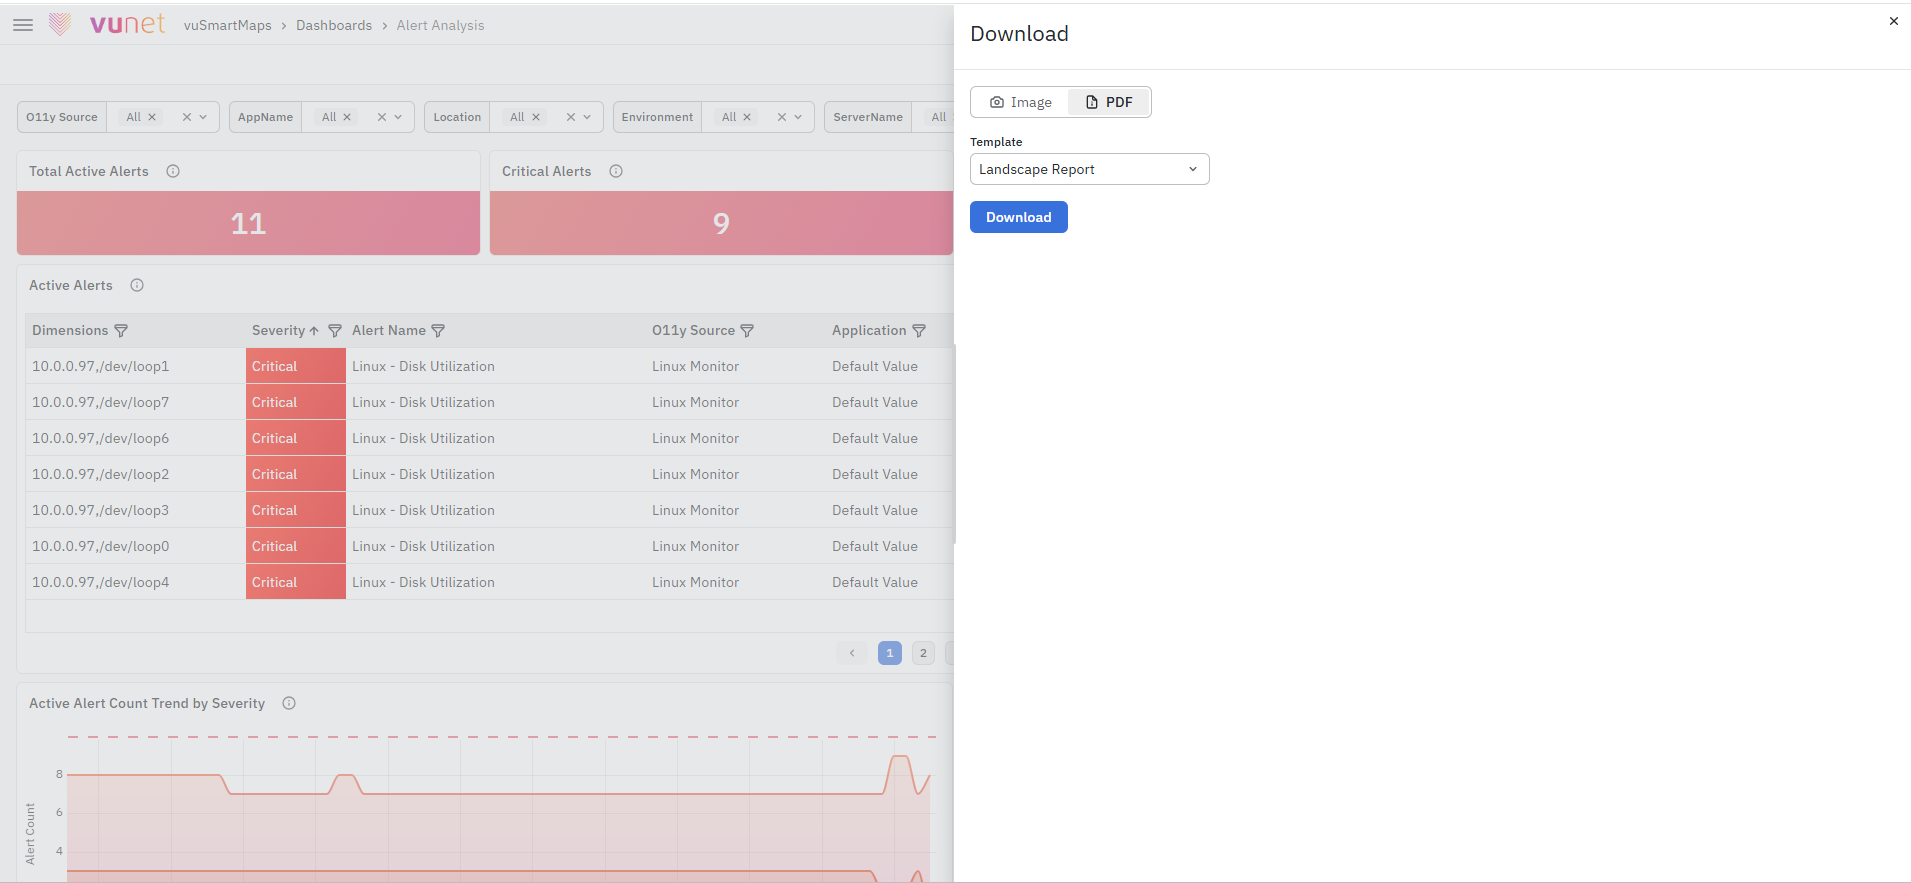
- Select PDF as the format and the required Template.
- Click on the Download button.
The exported Dashboard is downloaded as a PDF report. The downloaded file will have the current timestamp.
Export a Panel PDF
To export a Panel as a PDF, follow these steps:
-
Navigate to the Left Navigation menu at the top left and click on Dashboards.
-
Open the Dashboard from which you want to Export the Panel.
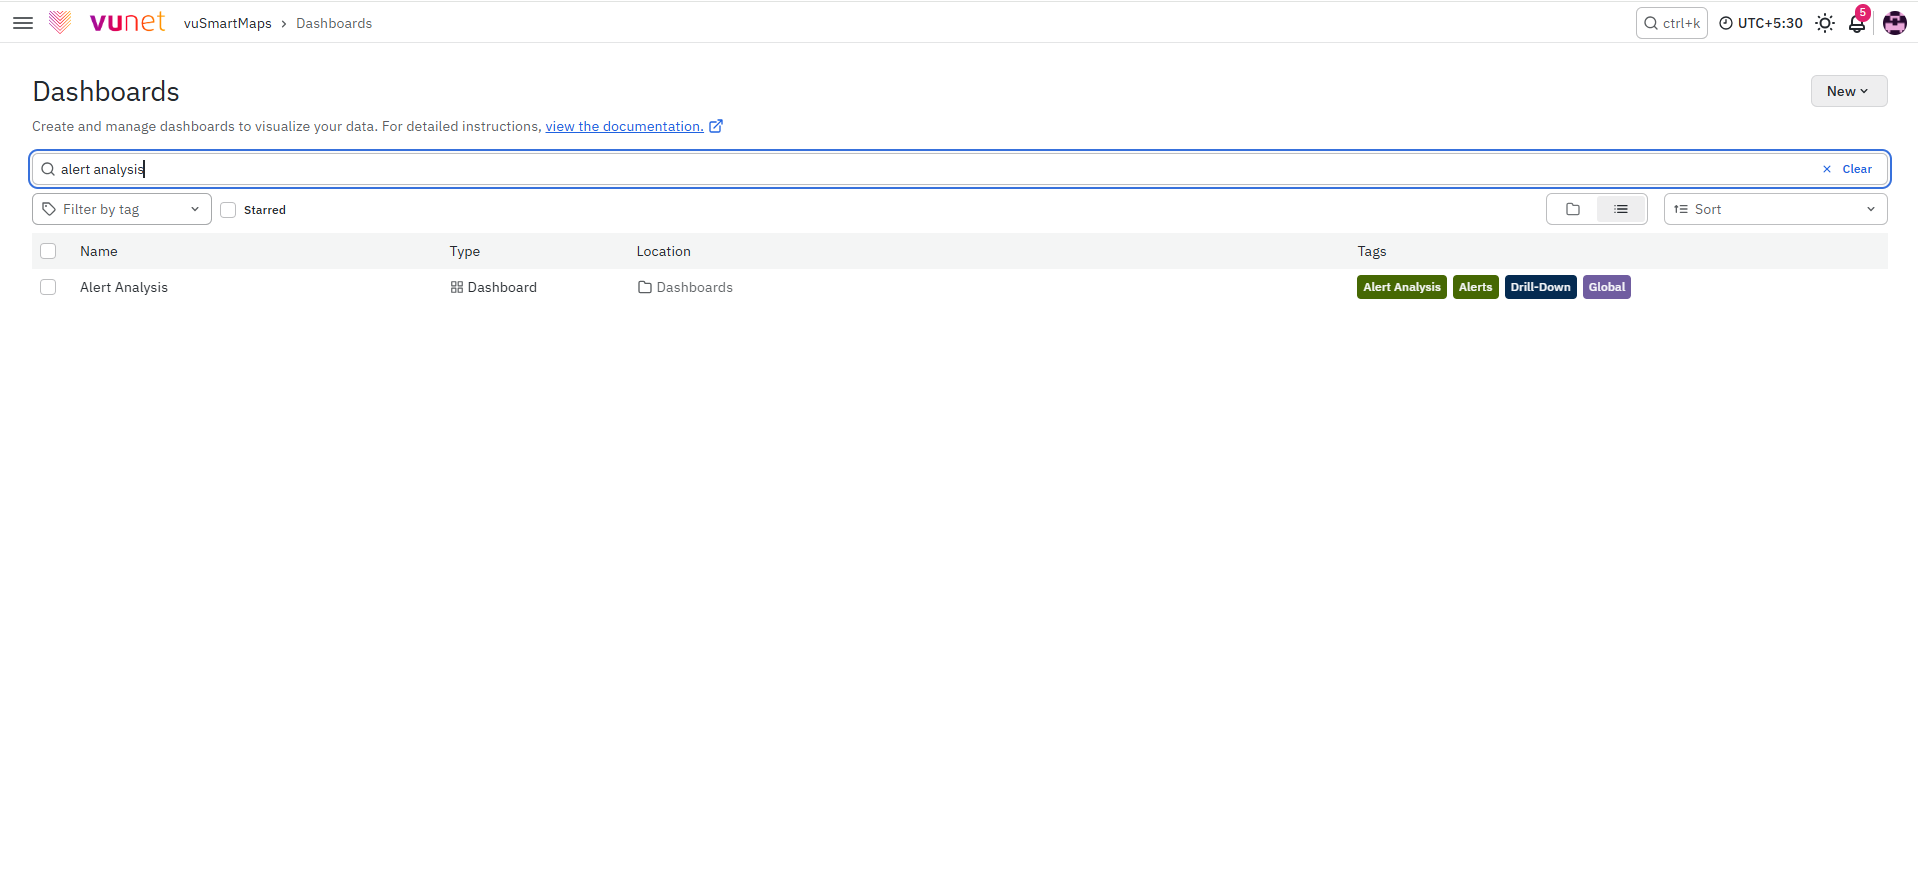
- Click on the Panel options to reveal the menu and then click on the Share option.
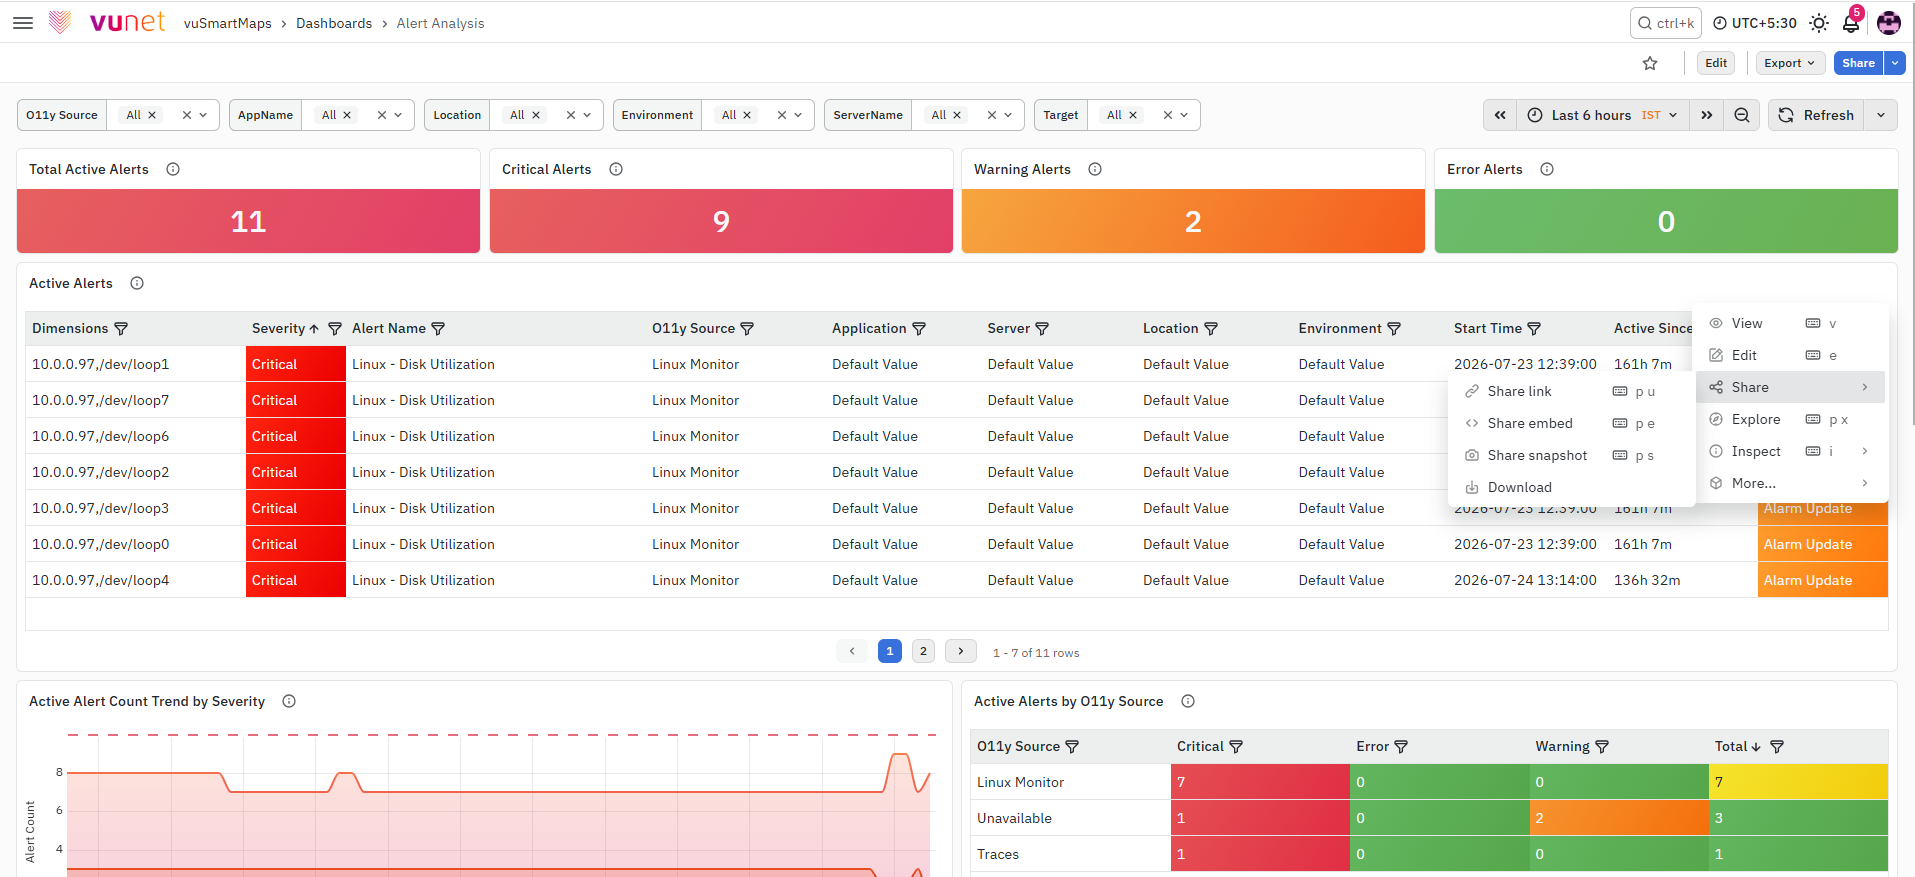
- Go to the Download Tab.
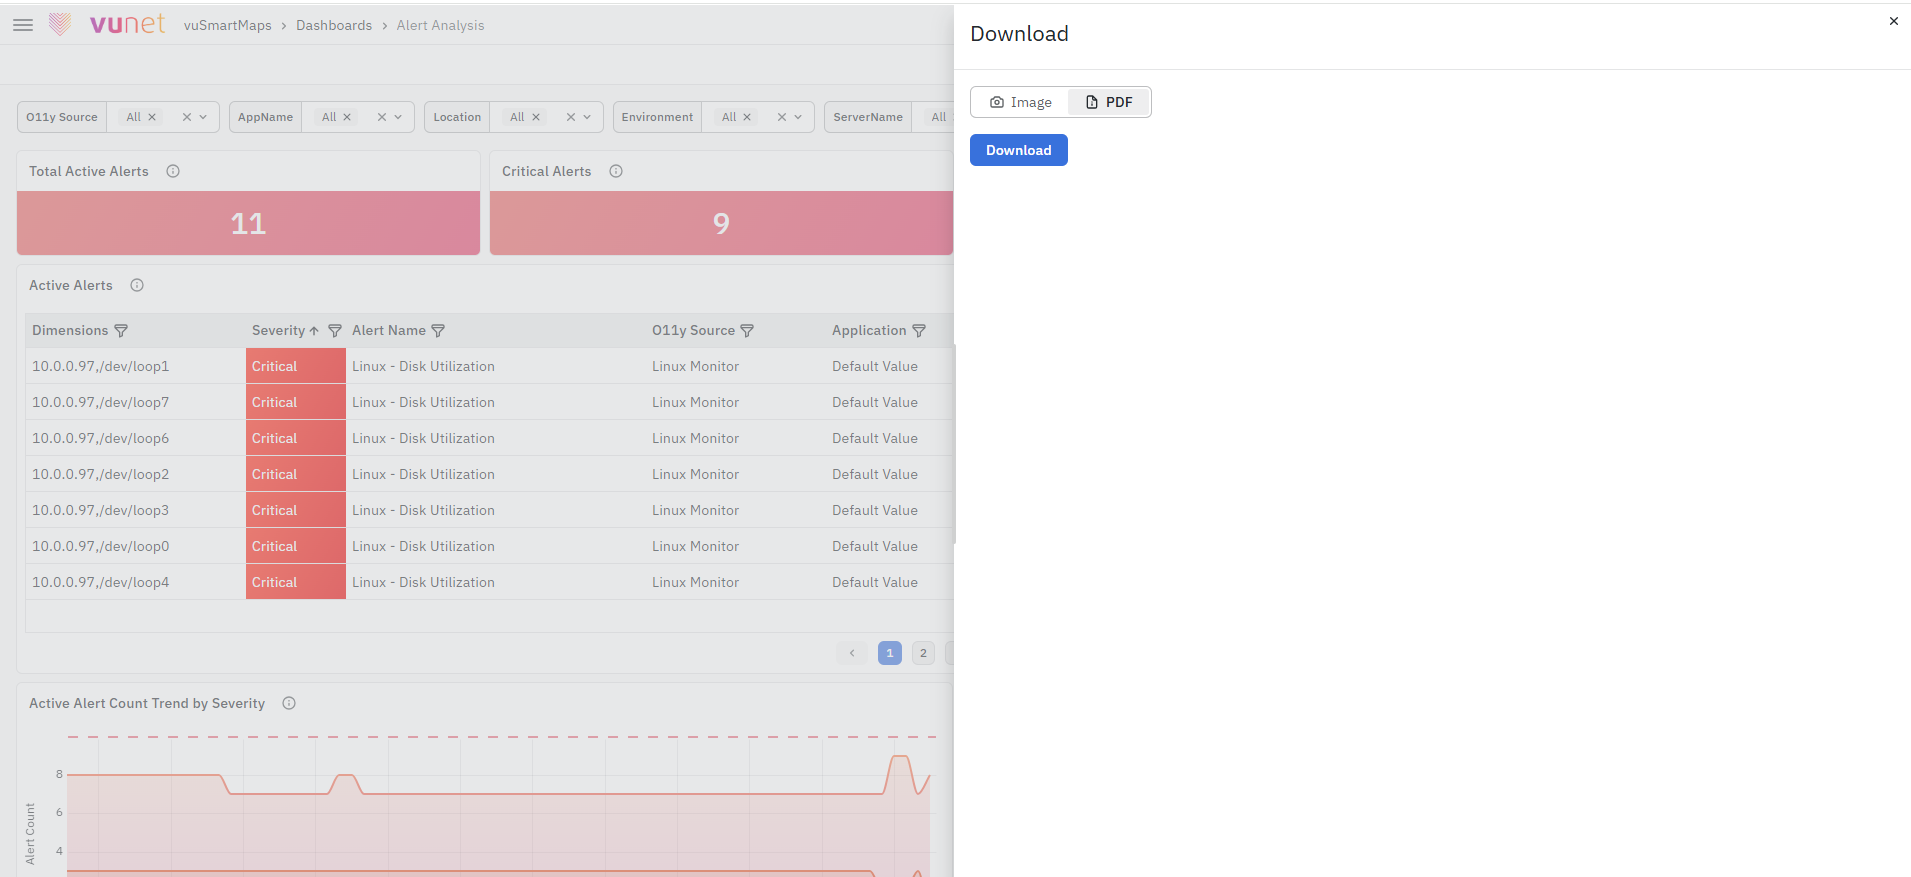
- Select PDF as the format.
- Click on the Download button.
The exported panel is downloaded as a PDF. The downloaded file will have the current timestamp.
What Happens After the Steps
Once the dashboard is configured and saved:
- The dashboard starts displaying data based on the configured queries and visualizations.
- Users can monitor metrics, logs, traces, and application performance from a centralized view.
- Dashboard filters and variables allow dynamic data exploration.
- Dashboards can be shared, exported, grouped, or organized into folders for easier management.
- Teams can continuously monitor system health using refresh and time range controls.
Tips / Best Practices
- Use meaningful dashboard names and descriptions for easier identification.
- Group related dashboards into folders for better organization.
- Use variables and filters to create dynamic dashboards.
- Configure appropriate refresh intervals based on monitoring needs.
- Use tags consistently for dashboard categorization.
- Limit excessive queries in a single dashboard to improve performance.
- Use dashboard permissions to restrict access where required.
- Add annotations to correlate events with metric behavior.
- Use dashboard versions to track and restore changes when needed.
Troubleshooting
-
Issue: Dashboard is not displaying data.
- Possible Cause:
- Incorrect query configuration.
- Invalid data source selection.
- No data available for the selected time range.
- Solution:
- Verify the configured query.
- Check the selected data source.
- Expand the dashboard time range.
- Refresh the dashboard manually.
- Possible Cause:
-
Issue: Variables or filters are not working.
- Possible Cause: Incorrect variable query or configuration.
- Solution:
- Verify variable configuration under Dashboard Settings.
- Check query syntax and data source.
- Ensure variable values are returned correctly.
-
Issue: Unable to share or export dashboard.
- Possible Cause:
- Missing permissions.
- Dashboard not saved properly.
- Solution:
- Verify dashboard permissions.
- Save the dashboard before sharing or exporting.
- Possible Cause:
FAQs
What is a Dashboard in vuSmartMaps?
A Dashboard is a collection of panels and visualizations used to monitor and analyze system, application, or business data.
Can I use multiple queries in a dashboard?
Yes. Multiple queries can be added to visualize different datasets or compare metrics.
Can I create dynamic filters in dashboards?
Yes. Dashboard variables and filters can be configured for dynamic data filtering.
Can dashboards be shared with other users?
Yes. Dashboards and panels can be shared using links, snapshots, exports, or downloads.
Can I restore previous dashboard versions?
Yes. The Versions section allows you to restore or compare previous dashboard versions.
Can I organize dashboards into folders?
Yes. Dashboards can be grouped into folders for better management and organization.
Can dashboards refresh automatically?
Yes. Auto-refresh intervals can be configured from the dashboard controls.
Can I export dashboards?
Yes. Dashboards can be exported as JSON files and downloaded as images or PDFs where supported.
Can dashboard permissions be restricted?
Yes. Permissions can be configured for specific users or teams.
Can I create dashboards using Data Models directly?
Yes. Dashboards can directly visualize Data Models without manually creating queries.
