Vu Dashboard List Visualization
Overview
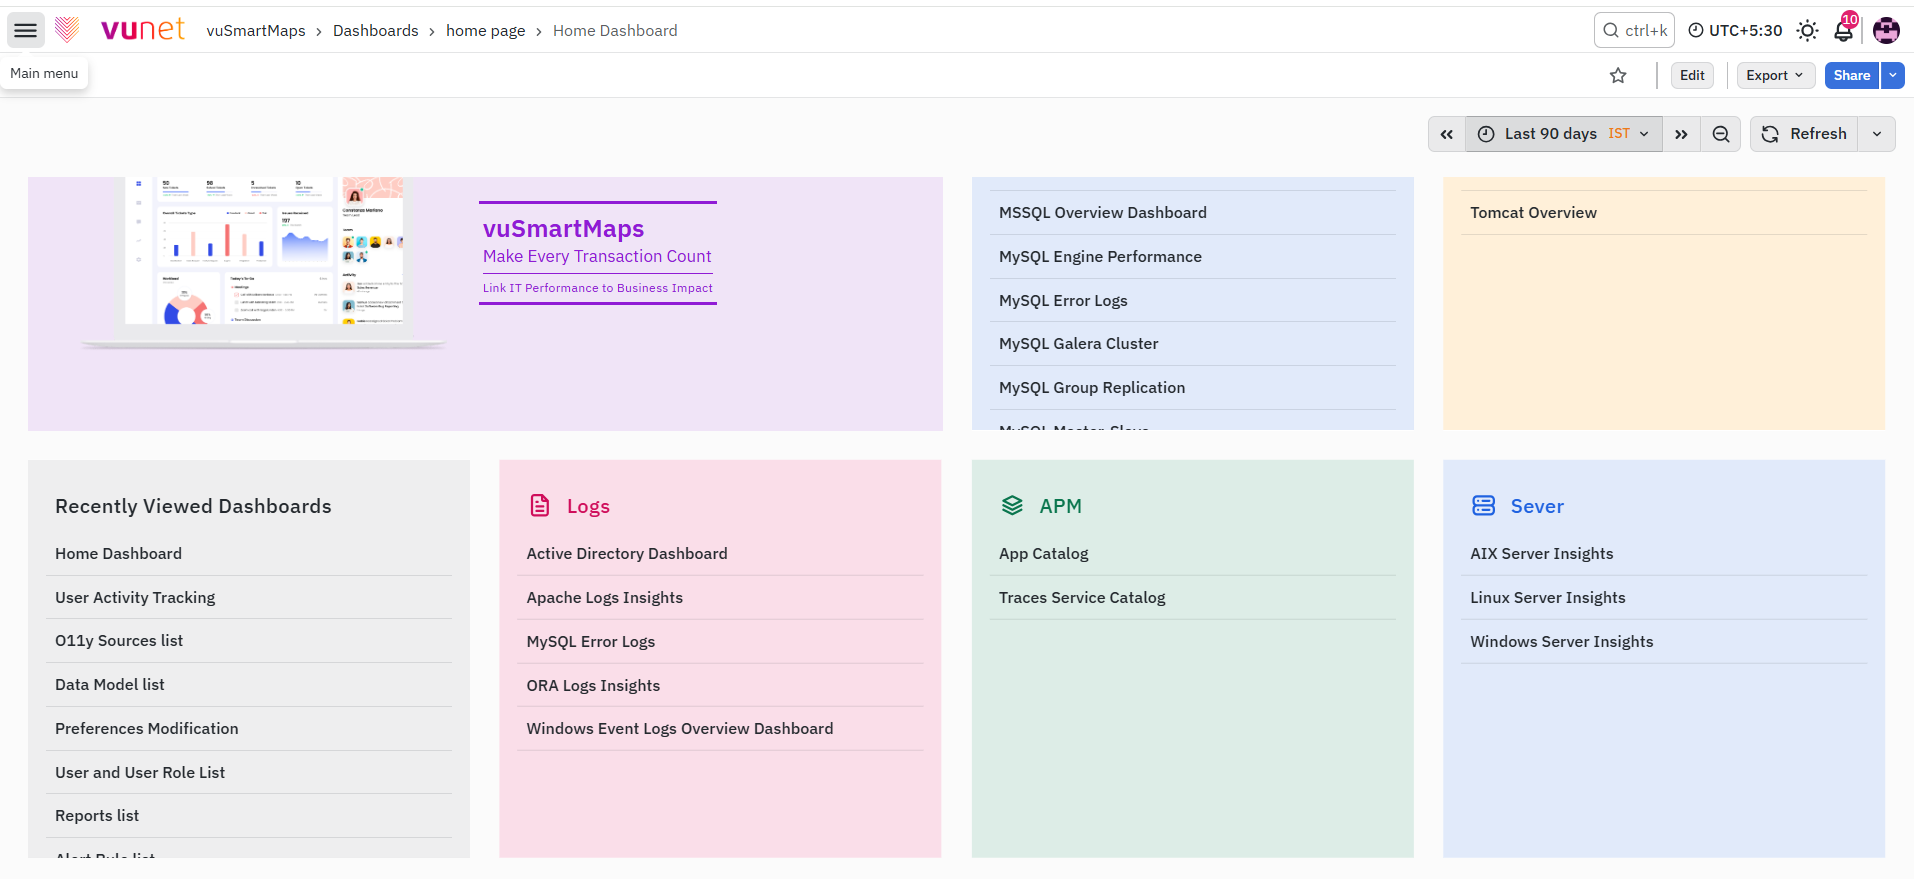
The Vu Dashboard List visualization feature provides a streamlined way to organize and access dashboards through dynamic and intuitive card-based groupings. This functionality enhances usability by enabling users to logically categorize dashboards, simplify navigation, and tailor the interface based on operational requirements and user preferences. A similar concept can be seen on a smartphone home screen, where apps are grouped into folders such as Finance, Work, Travel, or Utilities for faster access. In the same way, Vu Dashboard List helps users group related dashboards into cards, making it easier to find and open the right monitoring view quickly.
The feature supports category-based dashboard navigation, where dashboards are grouped into cards based on their functional categories. For example:
- Server: Dashboards related to Linux or Windows monitoring.
- Database: Dashboards for Oracle, MySQL, and database monitoring.
- Application Server: Dashboards related to specific applications or services.
The grouping is driven using dashboard tags configured within Dashboards. This tag-based approach ensures automatic and consistent categorization of dashboards, making it easier for users to quickly locate relevant monitoring views. For example:
- A Server tag can group infrastructure monitoring dashboards.
- A Landing Page tag can group overview or entry-point dashboards.
In addition to category-based grouping, users can also list dashboards based on starred dashboards, recently viewed dashboards, or search queries. The feature also supports panel customization, allowing users to configure headings, icons, themes, and panel appearance for better visual organization.

Why This Feature Is Useful
In banking and payment environments, monitoring teams often work with multiple dashboards for applications, databases, APIs, payment switches, infrastructure, and transaction monitoring.
The Vu Dashboard List visualization helps teams:
- Quickly access relevant dashboards during incidents.
- Organize dashboards by technology or business function.
- Reduce navigation time during troubleshooting.
- Create landing pages for operations teams.
- Improve usability for new users and NOC teams.
For example:
- A payment operations team can create separate cards for UPI, API Gateway, Database, and Application dashboards.
- An infrastructure team can group Linux, Windows, and Network dashboards separately for faster access.
Example Scenario
A banking operations team manages multiple dashboards for:
- UPI transaction monitoring
- Oracle database monitoring
- Linux server monitoring
- API latency tracking
Instead of manually searching dashboards, the team creates Dashboard Navigation Cards using tags such as:
- Server
- Database
- API
- Landing Page
When an issue occurs in UPI transactions, operators can immediately open the relevant dashboards from the categorized navigation cards and begin analysis without delay.
When to Use This Feature
Use the Vu Dashboard List visualization when:
- Multiple dashboards need structured organization.
- Users require quick dashboard navigation.
- Dashboards must be grouped by category or technology.
- A landing page for operations teams is needed.
- Teams want easier access to recently viewed dashboards.
- Frequently used dashboards need to be highlighted.
- Dashboard access should be simplified for new users.
Comprehensive Understanding
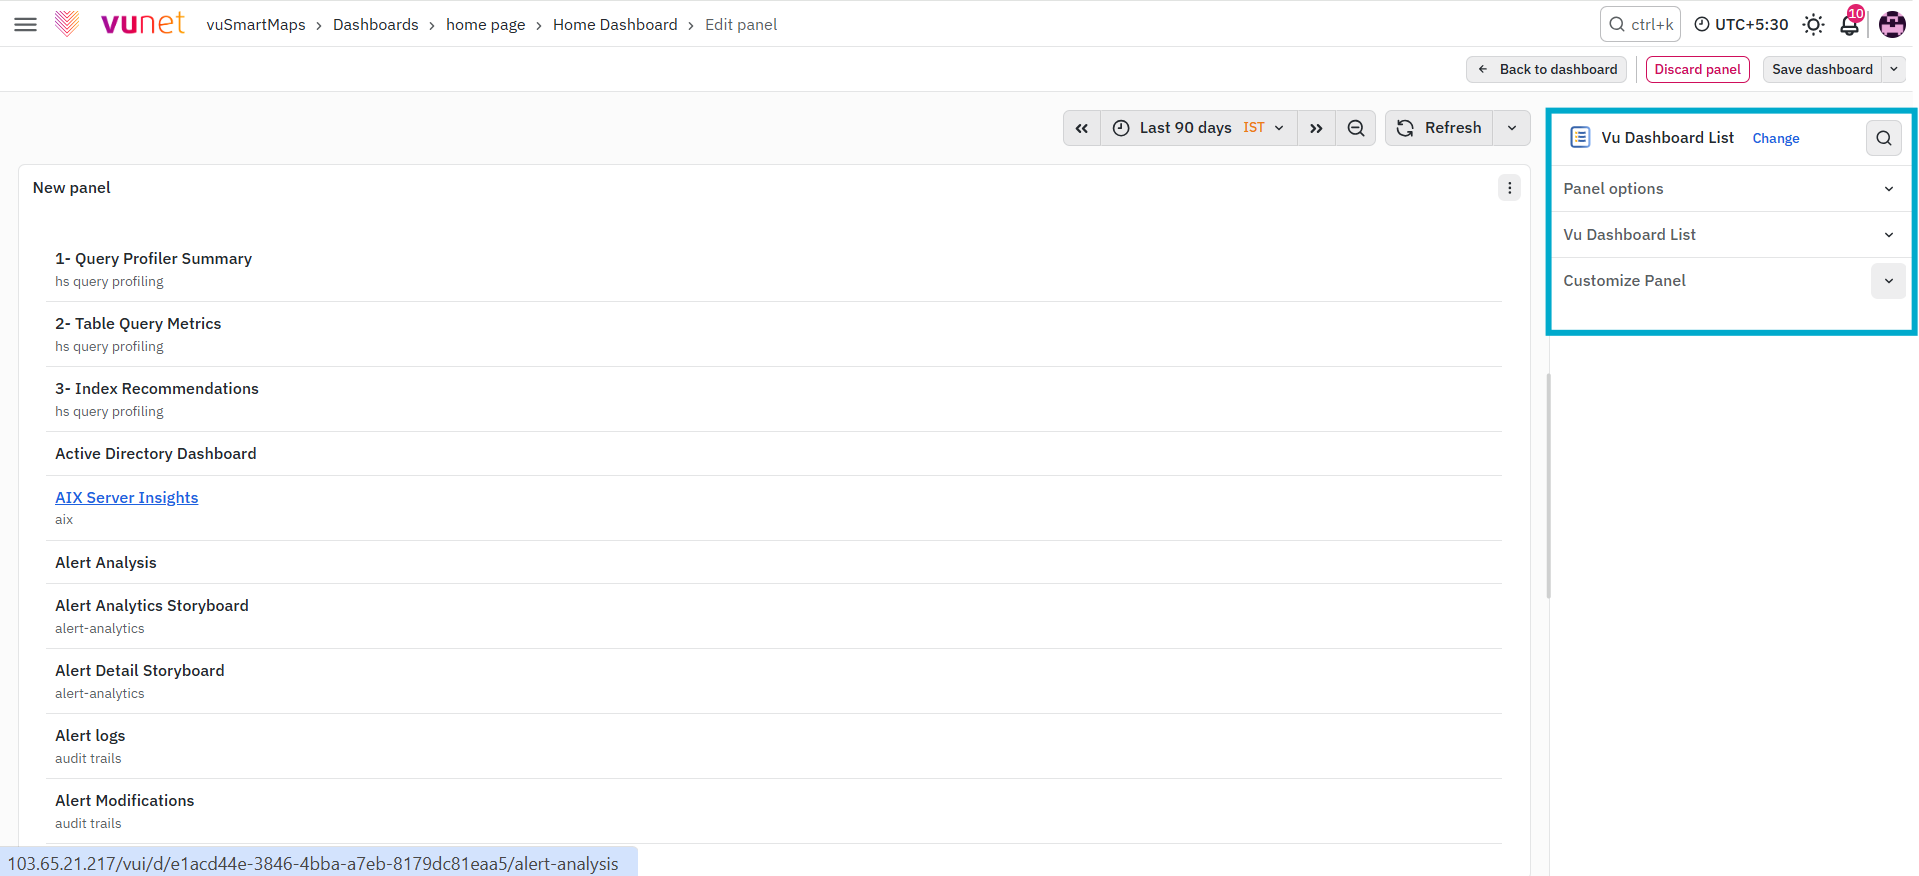
The Vu Dashboard List visualization is configured inside a dashboard panel. After selecting Vu Dashboard List as the visualization type, the configuration screen shows the following main sections:
Panel Option
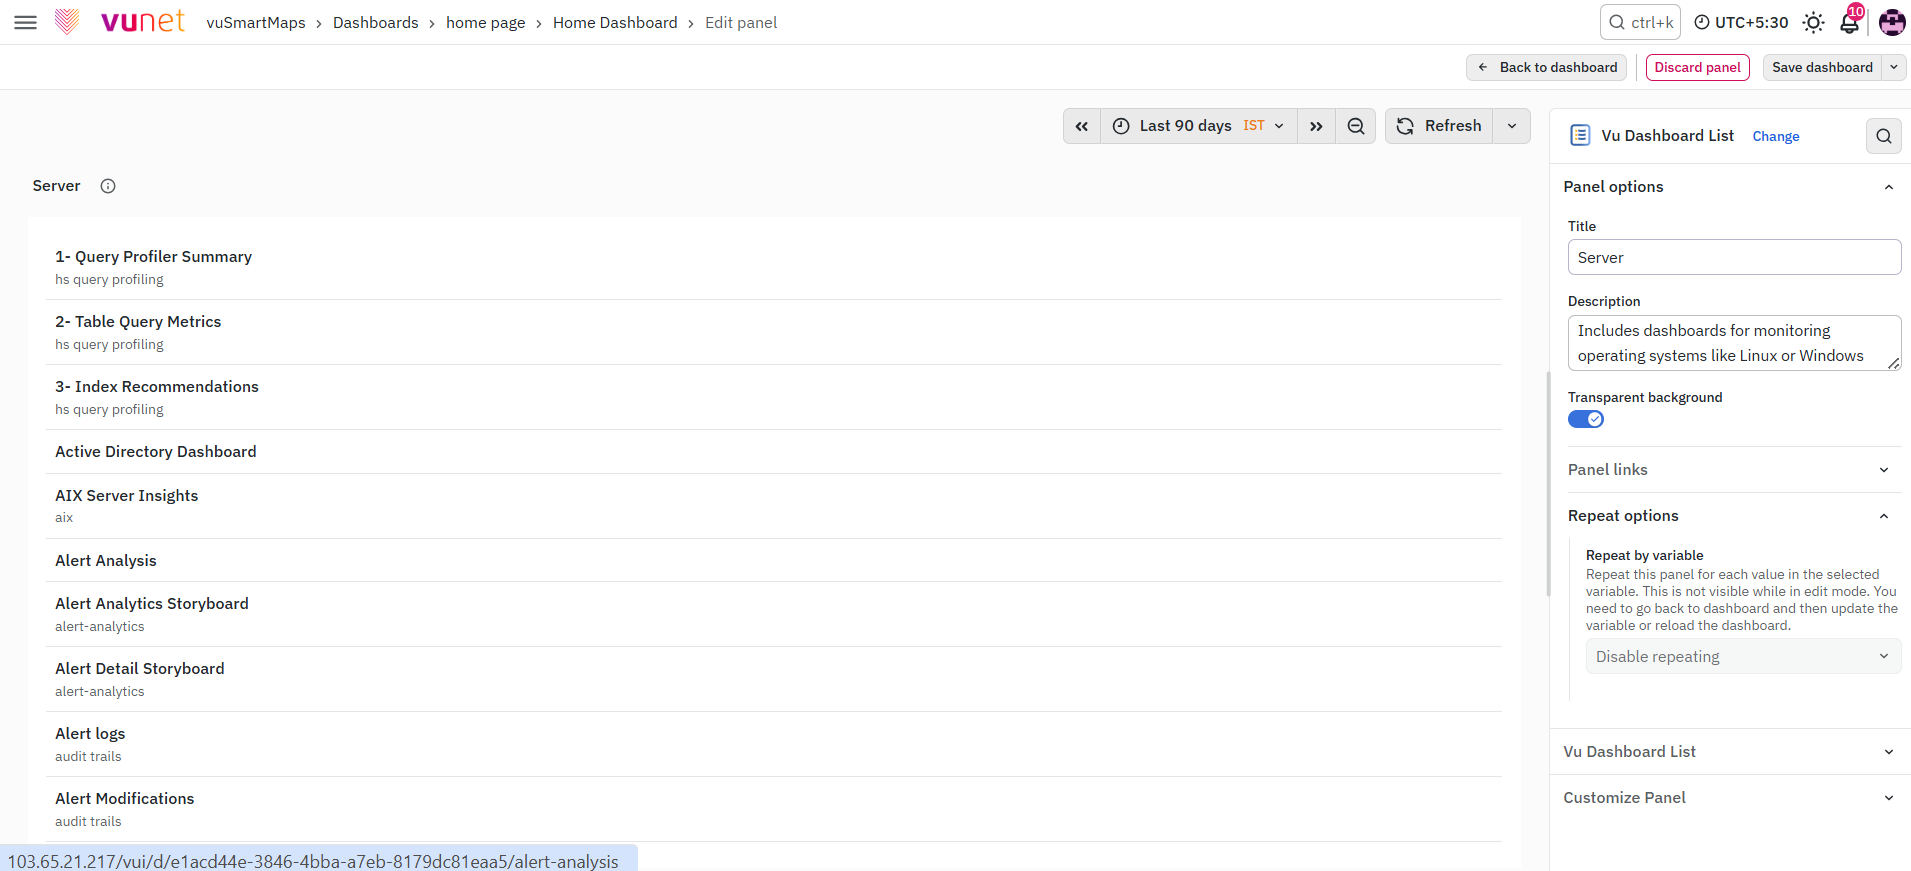
The Panel Options allow users to configure the appearance and functionality of individual panels. Below are the details for each option:
- Title: Define a clear and concise title for the panel, such as "Server". Text entered in this field appears at the top of your panel
- Description: Add a brief, meaningful explanation of the panel’s function.
- Transparent Background: Enable or disable background transparency to suit the dashboard’s visual design.
- Panel Links: Add links to the panel to create shortcuts to other dashboards, panels, and external websites. Access panel links by clicking the icon next to the panel title.
- Repeat Options: Set whether to repeat the panel for each value in the selected variable.
For the best UI experience, consider omitting panel titles to maintain a clean visual design and enable Transparent backgrounds to improve clarity and readability.
Vu Dashboard List
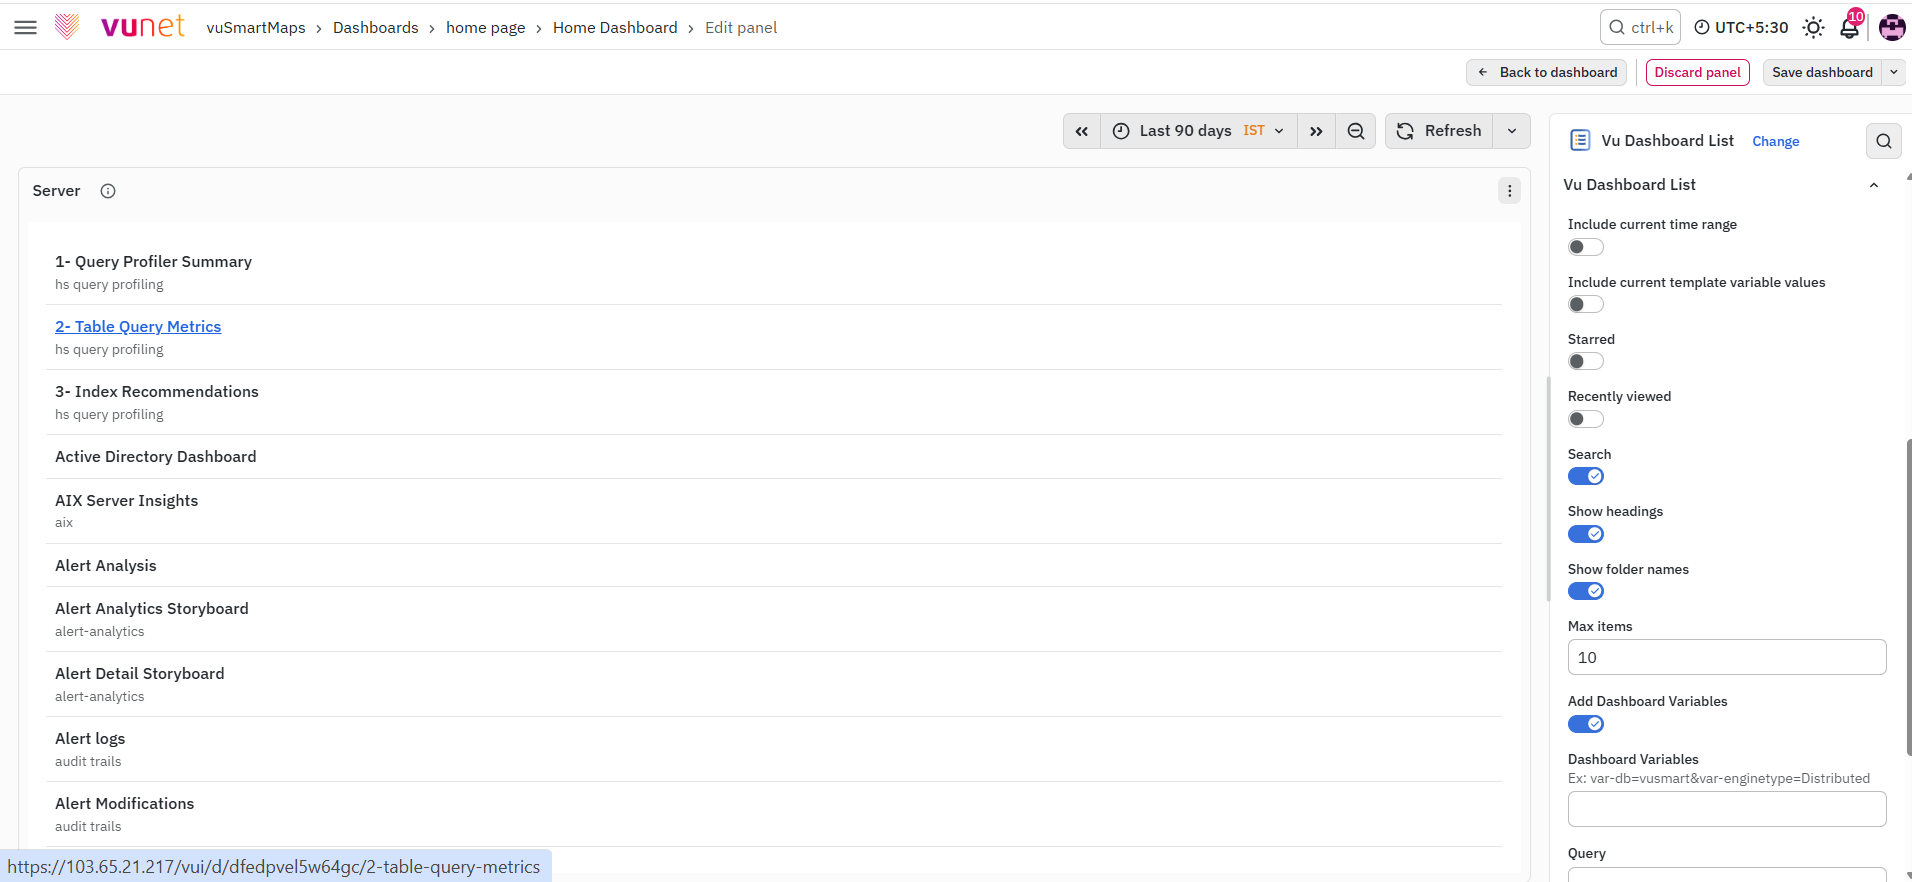
The Vu Dashboard List allows users to configure the display of dashboards with the following options:
- Include current time range: Select this option to pass the current dashboard’s time range to linked dashboards. When the link is clicked, the linked dashboard will open with the same time range applied.
- Include current template variable value: Choose this option to include template variables as query parameters in the link. When clicked, any matching templates in the linked dashboard are set to the values from the current dashboard.
- Starred: The toggle button will display starred dashboards alphabetically, making it easier to access frequently used dashboards.
- Recently Viewed: The toggle button will list recently viewed dashboards alphabetically, helping users quickly navigate to their most recent activity.
- Search: Enables dashboards to be displayed based on search queries or tags. This requires at least one value to be entered in the Query or Tags fields.
- Show heading: Use the toggle button to show or hide the panel heading.
- Show folder name: Toggle button to display the folder name for dashboards.
- Max Items: Input field to define the maximum number of dashboards the panel should display
- Add Dashboard Variables: A toggle button allows users to enable or disable appending the variables to the dashboards. By default, this option is enabled to ensure variable values are automatically propagated to linked dashboards.
- Dashboard Variables: A text box to manually enter dashboard variables in the format var-<varname>=value, such as var-Location=Bengaluru. Variable values are always synced using this syntax.
- Query: Use this field to search dashboards by name. The search is case-insensitive and supports partial matches. For instance, if dashboards are named "Server Analytics" and "Server Performance," entering "Server" will return both results. This feature simplifies finding specific dashboards quickly.
- Folder: Option to filter dashboards by their folder name.
- Tags: Add the dashboard tags, for instance, Server, and Landing Page, to automatically list dashboards under relevant category cards.
Customize Panel
This option enables you to personalize dashboard panels by adjusting headings, selecting icons, and applying custom themes for improved visual clarity and alignment
- Headings: Users can define headings for cards using a text input field.
- Heading Icon: A dropdown menu provides options for icons that visually represent each category.
- Theme: A color picker tool enables users to set unique colors for each card, aligning with branding or visual preferences.
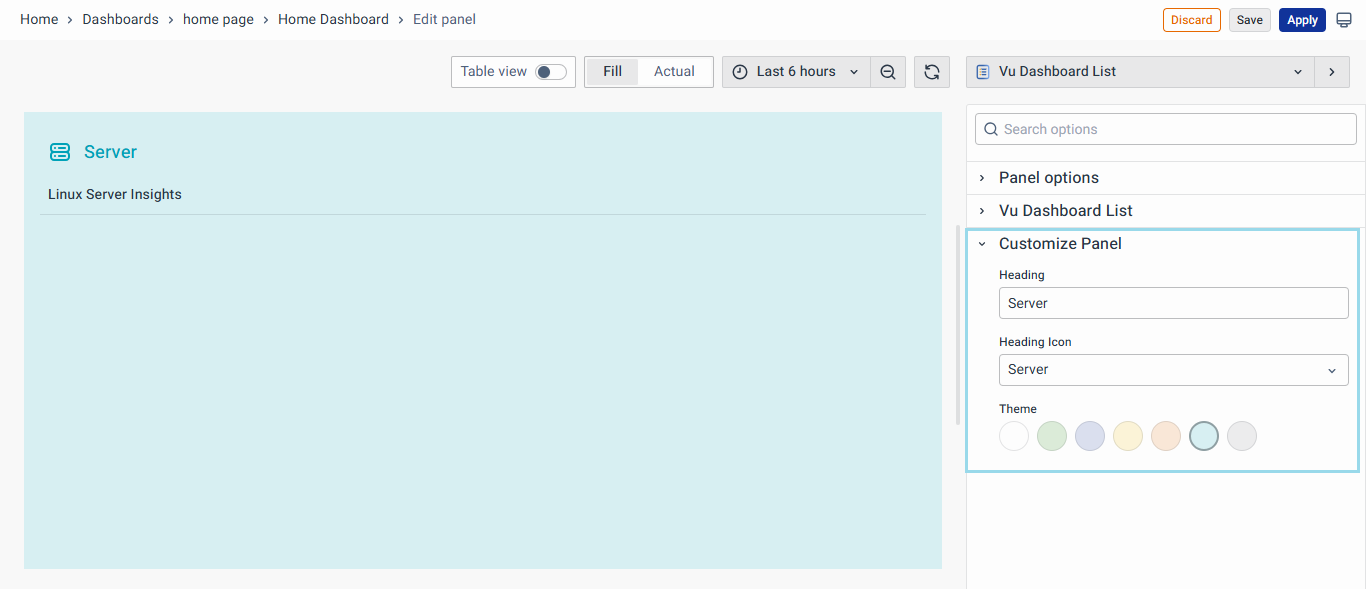
Once done, click the Save button at the top to save the panel, which will appear as a Dashboard Navigation Card.
Step-by-Step Instructions
Creating and Configuring a Vu Dashboard List Panel
- Open the dashboard where you want to add the Dashboard Navigation Card.
- Click Add at the top of the page.
- From the dropdown, select Visualization.
- From the visualization list, select Vu Dashboard List.
- The configuration options for the Vu Dashboard List panel will appear. These options include:
- Panel Option
- Vu Dashboard List
- Customize Panel
- Configure the Panel Option section by adding the required title, description, background setting, panel links, or repeat options.
- Configure the Vu Dashboard List section based on how you want dashboards to be displayed. You can use options such as tags, search query, starred dashboards, recently viewed dashboards, folder name, time range, and dashboard variables.
- Configure the Customize Panel section to define card headings, heading icons, and theme colors.
- Click Save at the top of the page.
After saving, the panel appears as a Dashboard Navigation Card. Users can open the listed dashboards directly from the card links.
What Happens After the Steps
After saving the panel:
- Dashboard Navigation Cards are created automatically.
- Dashboards matching the configured tags, search query, or filters are displayed.
- Users can click dashboard links directly from the cards.
- Dashboard grouping becomes easier to manage and navigate.
- Linked dashboards can inherit the current time range and template variables if configured.
Tips / Best Practices
- Use meaningful tags such as Server, Database, API, or Landing Page for easier grouping.
- Use transparent backgrounds for cleaner dashboard layouts.
- Keep dashboard headings short and meaningful.
- Configure Max Items carefully to avoid overcrowded panels.
- Use Recently Viewed dashboards for operational landing pages.
- Standardize dashboard tagging across teams for consistent navigation.
- Use icons and themes to visually differentiate dashboard categories.
Troubleshooting
-
Issue: Dashboards are not appearing in the panel.
- Possible Cause: Tags, Query, or Folder filters may not match existing dashboards.
- Solution: Verify the configured tags, search query, and folder names.
-
Issue: Linked dashboards are not inheriting variables.
- Possible Cause: Include current template variable value option is disabled.
- Solution: Enable the option and verify variable naming syntax.
-
Issue: Too many dashboards are displayed.
- Possible Cause: Max Items is not configured.
- Solution: Configure the Max Items field to limit displayed dashboards.
-
Issue: Dashboard categories are not organized properly.
- Possible Cause: Inconsistent dashboard tagging.
- Solution: Use standardized tags across dashboards.
FAQs
What is the Vu Dashboard List visualization used for?
The Vu Dashboard List visualization is used to organize and access dashboards through card-based dashboard navigation.
How are dashboards grouped in the Vu Dashboard List visualization?
Dashboards are grouped using configured dashboard tags and functional categories.
Can dashboards be grouped using tags?
Yes. Dashboard grouping is derived from tags configured in Dashboards.
What other dashboard listing methods are supported?
The feature also supports:
- Starred dashboards
- Recently viewed dashboards
- Search query-based listing
How can users open a dashboard from the panel?
Users can open dashboards by clicking the provided dashboard links.
Why are dashboard tags important?
Tags help create automatic and meaningful dashboard groupings, simplifying dashboard navigation and accessibility.
