HTML Widget Visualization
Overview
HTML Widget Visualization lets you create custom dashboard content using HTML code. It is used in dashboard panels when you want to add visual elements such as custom headings, colored blocks, separators, or reference links. A similar concept can be seen in a smartphone home screen, where users organize apps using folders, widgets, labels, and shortcuts to make information easier to access. In the same way, HTML Widget Visualization helps users organize dashboard content with headings, separators, formatted blocks, and links.
This feature helps users make dashboards easier to read and navigate. For example, a dashboard can use HTML widgets to separate payment monitoring sections, add labels for transaction journeys, or provide quick links to related dashboards.
Here are some key features of the HTML widget visualization:
- Easily spot errors and warnings, complete with line numbers for debugging.
- Quickly identify errors or warnings with displayed line numbers.
- Enhance user-friendliness with autocomplete functionality.
- Enjoy auto indentation and the ability to collapse/expand HTML tags.

Why This Feature Is Useful
In banking and payment monitoring dashboards, users often need to view many panels together. HTML widgets help organize the dashboard layout.
They are useful for:
- Adding clear section headings.
- Separating different monitoring areas.
- Adding links to related dashboards or help pages.
- Highlighting important areas with custom formatting.
- Improving dashboard readability for operations and support teams.
Example Scenario
A payment operations team monitors UPI transaction health using multiple dashboard panels. The dashboard contains panels for transaction count, failed transactions, latency, and service errors. To make the dashboard easier to understand, the team adds HTML widgets as section headers such as:
- UPI Transaction Overview
- Failure Analysis
- Latency and Performance
- Related Dashboards
They also add reference links to navigate to related dashboards.
When to Use This Feature
Use HTML Widget Visualization when you want to:
- Add a custom heading to a dashboard.
- Create horizontal or vertical separators.
- Add reference links to other dashboards.
- Add custom HTML blocks to improve dashboard layout.
- Group related dashboard panels visually.
- Make large operational dashboards easier to understand.
Comprehensive Understanding
You can configure an HTML Widget within a dashboard panel. The screen contains the following sections:
Visualization
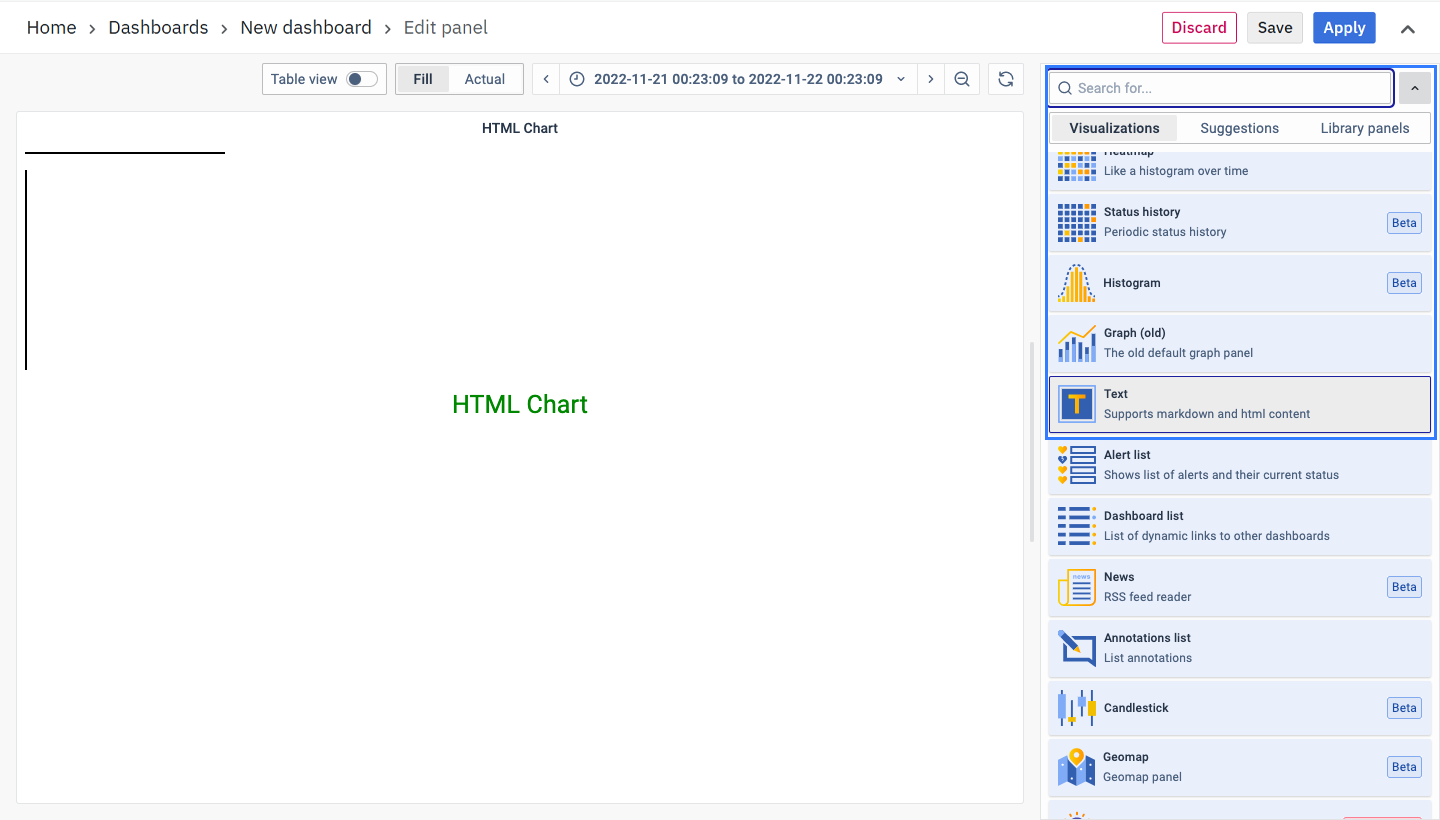
On the right side of the screen, select Text as the visualization type. Once selected, the panel changes from a chart-based view to a text-based panel.
Panel Options
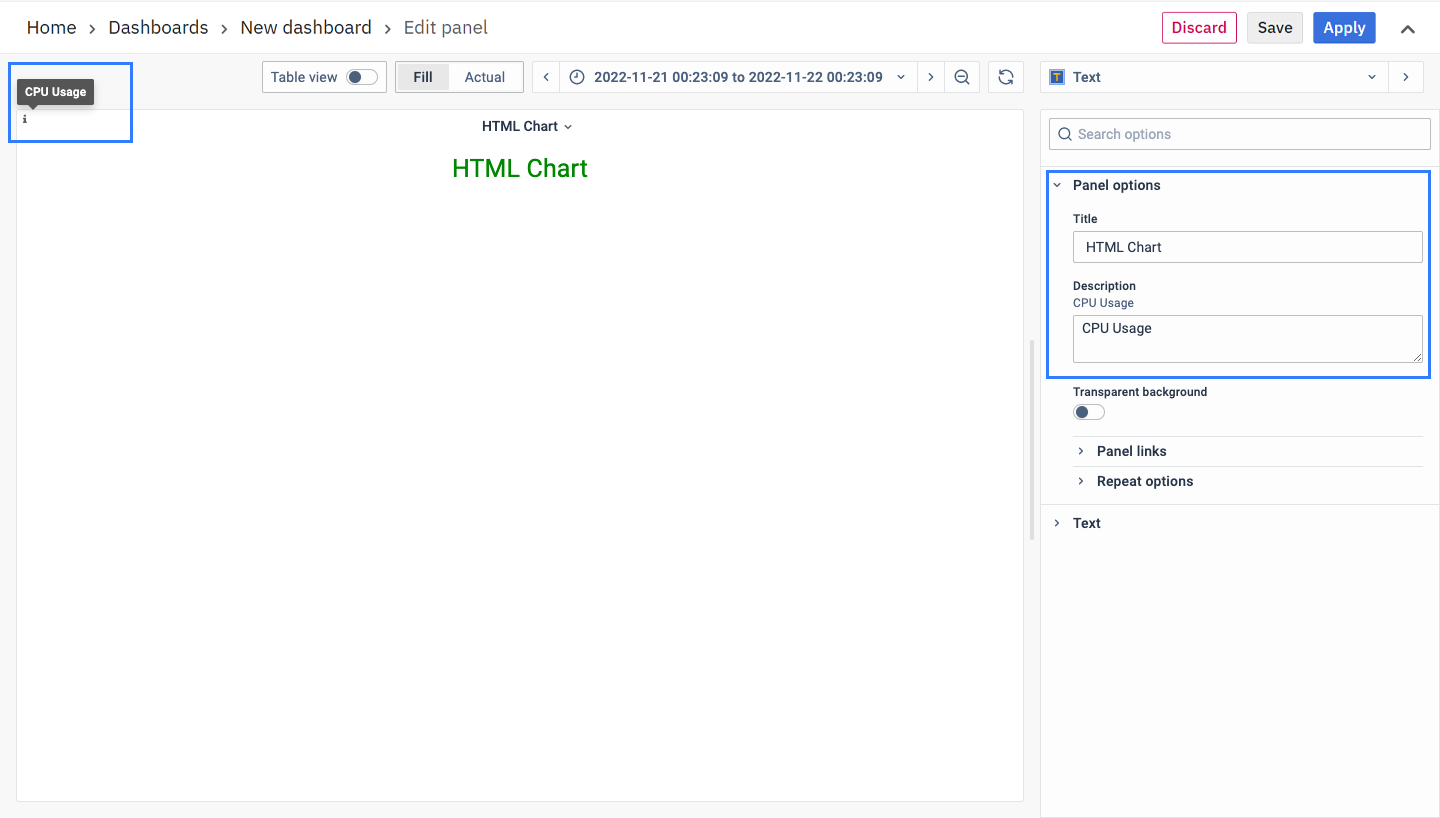
This section is used to define the basic details of the panel.
- Name - Helps identify the panel on the dashboard and should clearly indicate its purpose.
- Description - Provides additional context about what the panel represents. The description is available in the top-left corner of the panel and can be viewed by hovering over the information (i) icon.
- Panel Link - Allows you to attach a link to the entire panel, making it clickable.
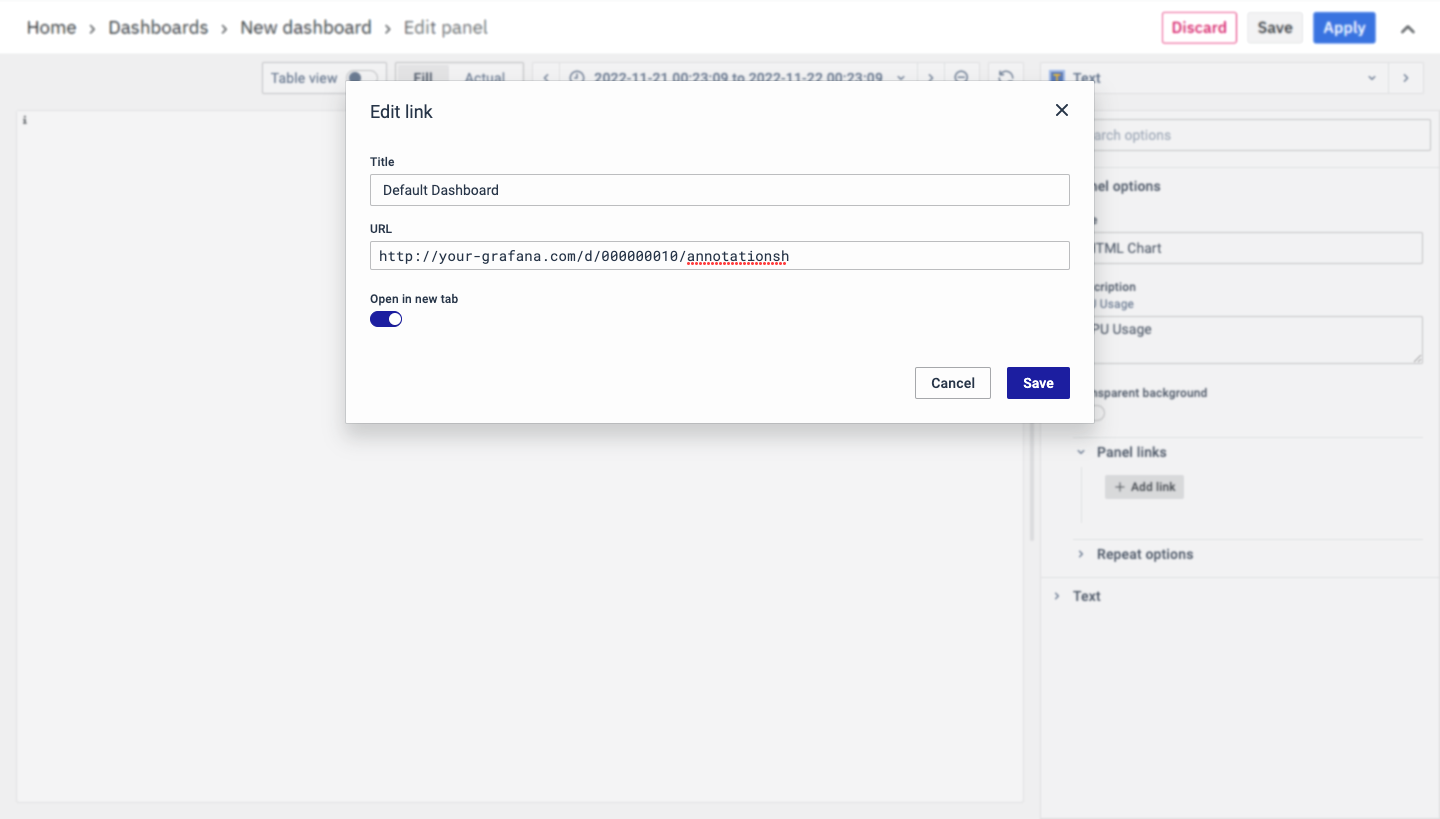
You can configure:
- Title
- URL
- Open in new tab
After configuring the Panel Link, click Save to apply the changes. When you click on a panel, it opens the link either in the same tab or a new tab.
Text
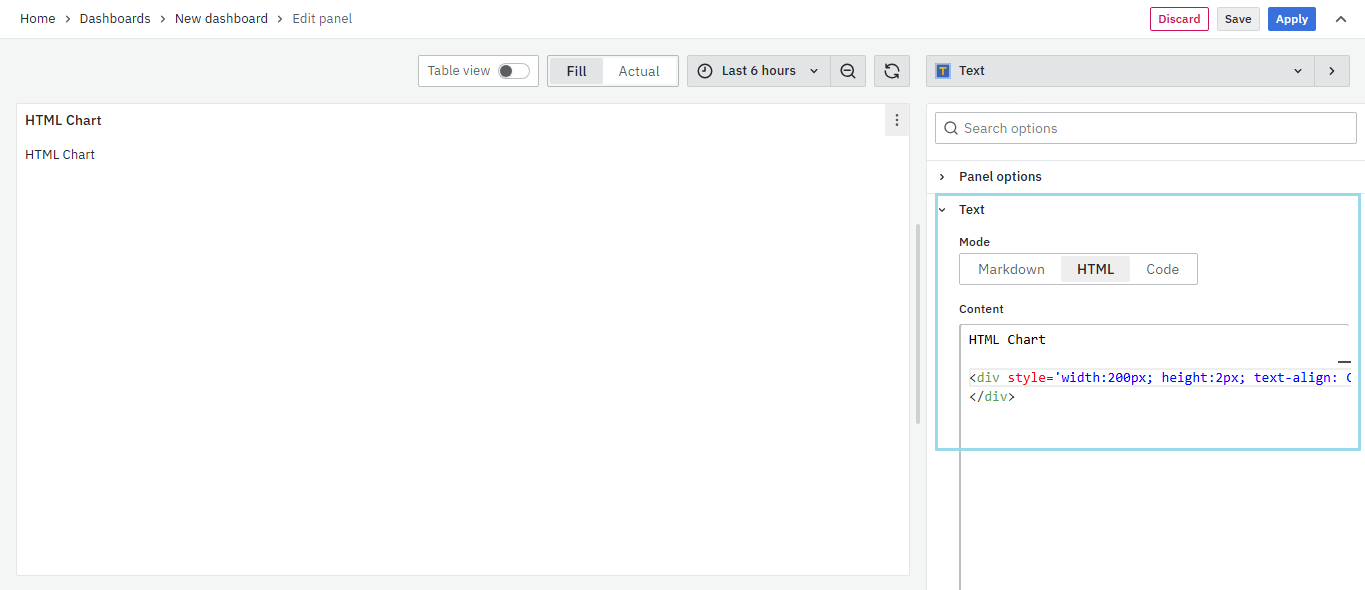
This is the main section where the content of the panel is defined. Unlike chart visualizations, this section allows you to manually create content using text or HTML code. It is primarily used to design layout elements such as headings, separators, and navigation links that improve the structure of the dashboard.
Mode
This setting controls how the content entered in the editor is interpreted. The available options are:
- Markdown – For simple formatted text.
- HTML – For creating HTML widgets.
- Code – For displaying raw code.
Content
You can write code here in the HTML editor, you can add any HTML code for which you want to create a widget. Assuming you have a basic grasp of HTML and CSS, you can use plain HTML and CSS to create various elements according to your needs, such as table headers, colorful blocks, text with links to other pages, and more.
Frequently Used Code Snippets
Here are code snippets for commonly used HTML widgets that you can customize as needed.
Horizontal and Vertical Separators
Below, we provide code for horizontal and vertical separators (lines) that can be used in dashboards to separate different blocks or visualizations.
Sample code for Horizontal Separator:
<div style='width:200px; height:2px; border:1px solid black'>

</div>
Sample code for Vertical Separator:
<div style='width:1px; height:200px; border:1px solid black'>

</div>
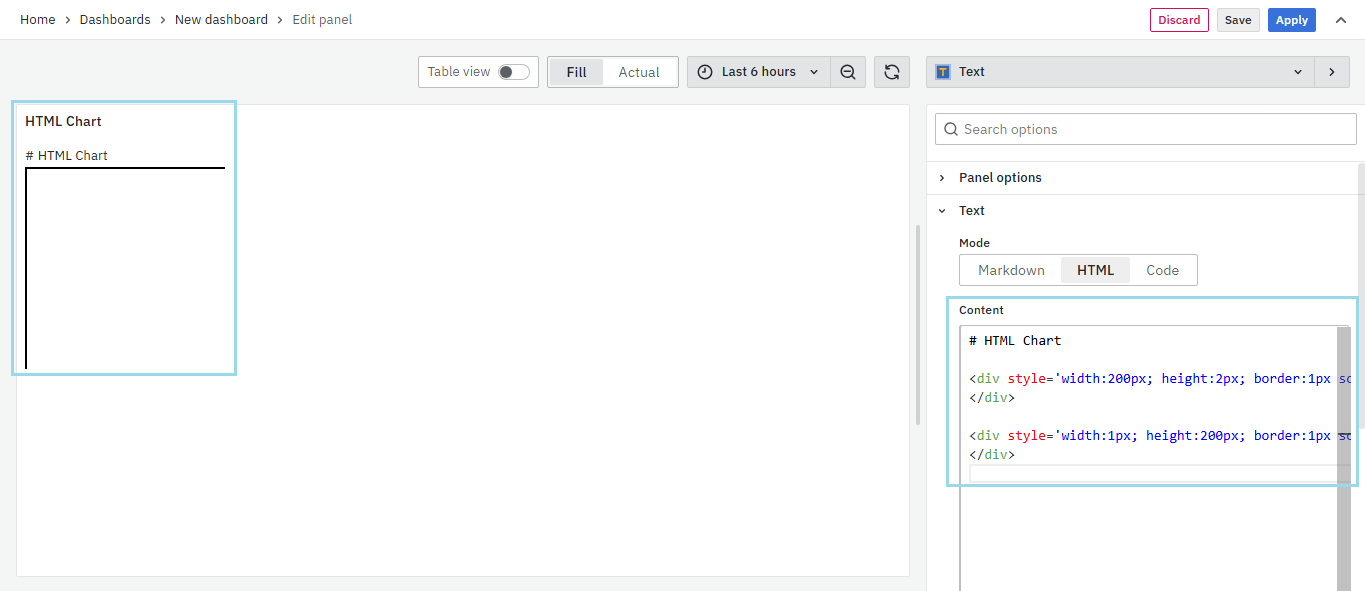
The code can be configured as:
- Width: Set the width of the horizontal line.
- Height: Mandatory field to be provided so that the line can appear.
- Border: Define the border size in pixels (e.g., 1px, 2px, etc.) according to your needs. Choose a border style from the following options:
- Dotted: Creates a dotted border.
- Dashed: Creates a dashed border.
- Solid: Creates a solid border.
- Double: Creates a double border.
- Groove: Specifies a 3D grooved border. The effect depends on the border-color value.
- Ridge: Specifies a 3D ridged border. The effect depends on the border-color value.
Custom Headings
You can use this to add named headings to your dashboard blocks as needed.
Sample Code
<div

style='text-align:center; font-size:25px; color:green; backgroundcolor:yellow'>

Total Orders

</div>
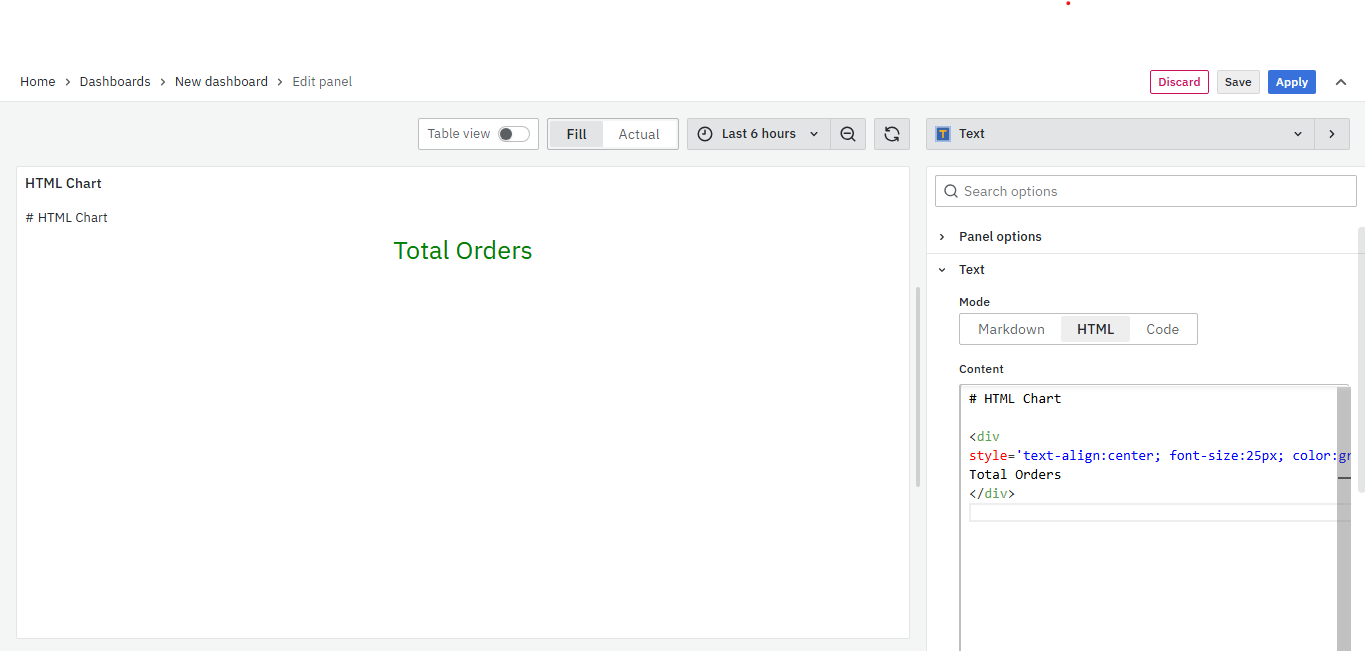
The code can be configured as:
- Text-align: Align text to the center.
- Font size: Set the text font size.
- Color: Choose the text color
- Background color: Define the background color of the div.
Reference Links
Another commonly used HTML widget is to provide a reference link to other pages.
Sample Code
<a href='/app/vienna#/dashboards/'> Dashboards </a>
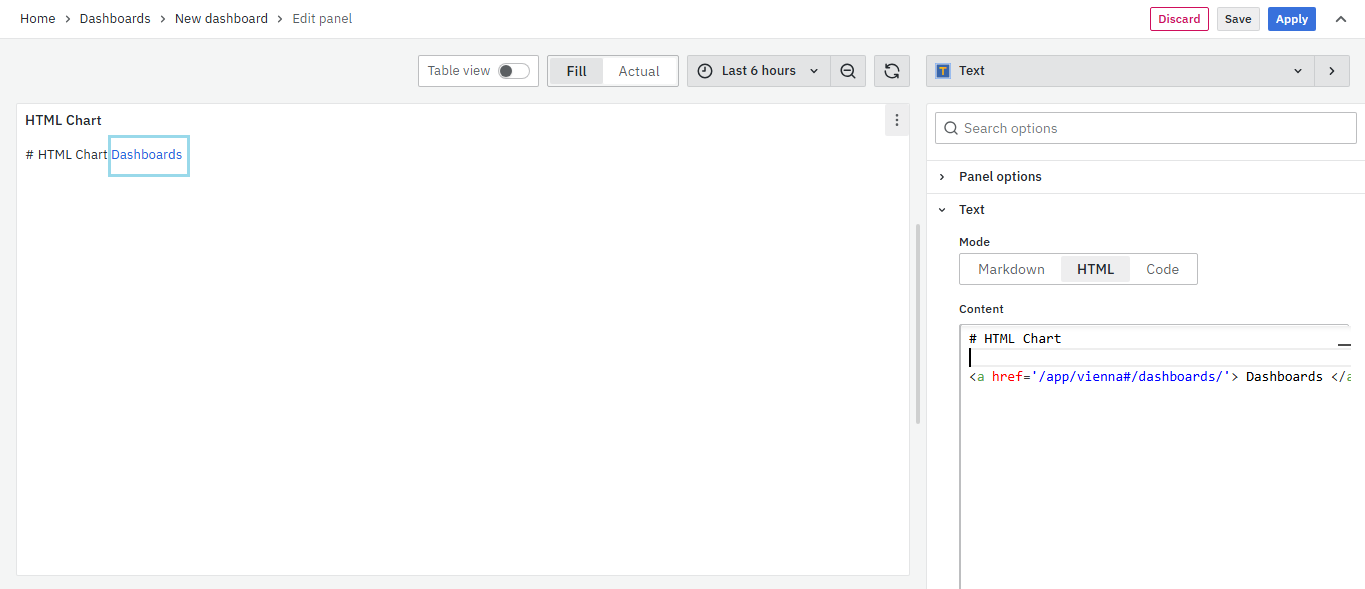
The code can be configured as:
- HREF: Any link can be provided here that you would like to navigate.
Step-by-Step Instructions
Follow these steps to create and configure an HTML Widget panel:
- Navigate to the Dashboard section and create a new panel.
- On the right side of the screen, select Visualization → Text.
- The panel switches to a text-based view
- The panel will render content based on text or HTML
- Configure Panel Options:
- Enter the panel name
- Add a description
- (Optional) Add a panel link and configure:
- Title
- URL
- Open in new tab
- Go to the Text section.
- Select Mode → HTML. This ensures the content is rendered as HTML
- In the Content editor:
- Enter the required HTML code
- You can create:
- Headings
- Separators
- Styled text
- Reference links
- Review the content:
- Check for errors or warnings in the editor
- Verify alignment and formatting
- Click Save to store the panel.
- The HTML widget is added to the dashboard
- You can edit the panel later if required
What Happens After the Steps
Once the panel is saved:
- The HTML widget appears on the dashboard.
- The HTML code is rendered as visual content.
- Headings, separators, or links appear based on the code.
- Panel links work when the panel is clicked.
- The panel can be edited anytime.
Tips / Best Practices
- Use clear and meaningful headings.
- Use separators to break large dashboards into sections.
- Keep HTML simple for better readability.
- Use links for quick navigation to detailed dashboards.
- Always check for errors before saving.
- Use descriptions to explain panel purpose.
Troubleshooting
-
Issue: HTML content not displaying correctly.
- Possible cause: There may be an issue with the HTML code entered in the Content editor.
- Solution:
- Check the editor for any error or warning indicators.
- Verify that all HTML tags are properly opened and closed.
- Ensure that Mode is set to HTML.
- Correct any syntax issues and recheck the preview.
-
Issue: Content appears as plain text instead of formatted output.
- Possible cause: The Mode is not set to HTML.
- Solution:
- Go to the Text → Mode section.
- Select HTML.
- Recheck the panel preview.
-
Issue: Separator line is not visible.
- Possible cause: Height or border properties are missing in the HTML style.
- Solution:
- Ensure that height is defined in the style.
- Verify that a valid border property is added.
- Example: height:2px; border:1px solid black.
-
Issue: Panel link not working.
- Possible cause: Incorrect URL configuration or missing save action.
- Solution:
- Verify the URL entered in the Panel Link section.
- Ensure the link is properly saved.
- Check if Open in new tab is configured as expected.
-
Issue: Changes are not reflected after editing.
- Possible cause: Panel is not saved after changes.
- Solution:
- Click Save after making updates.
- Refresh the dashboard if required.
FAQs
What is an HTML Widget Visualization, and when should I use it?
An HTML Widget Visualization allows you to create custom dashboard content using HTML code instead of data-driven charts. It is best used when you want to:
- Add headings or labels
- Create separators between sections
- Provide navigation links
- Improve dashboard layout and readability
How do I create an HTML Widget panel?
- Create a new dashboard panel
- Select Visualization → Text
- Go to the Text section and select Mode → HTML
- Enter the HTML code in the Content editor
- Save the panel
What type of content can I create using HTML widgets?
You can create:
- Section headings
- Styled text blocks
- Horizontal or vertical separators
- Reference links
- Basic layout elements
Why is my HTML not rendering properly?
- Mode may not be set to HTML
- There may be syntax errors in the code
- Some HTML tags may not be properly closed
Check the editor for errors and ensure correct HTML structure.
Can I add links to other dashboards?
Yes, you can add links in two ways:
- Panel Link – Makes the entire panel clickable
- HTML links (href) – Adds clickable links inside the content
Both methods help in navigating to related dashboards or resources.
Can I edit the HTML widget after saving?
Yes. You can open the panel in edit mode and:
- Modify the HTML code
- Update panel name or description
- Change panel link configuration
