Business Chart
Overview
The Business Chart visualization enables users to create dynamic and interactive charts within vuSmartMaps dashboards. It allows users to build highly customizable charts to represent business and operational data beyond standard predefined panels. A similar concept can be seen in a smartphone health or finance app, where data is shown using interactive charts instead of plain numbers. Users can view patterns, compare values, and understand changes more easily. In the same way, Business Chart helps banking and payment teams present important operational data in a flexible and meaningful format. This visualization is useful when teams need advanced charting, custom layouts, or interactive data representation.
Why This Feature Is Useful
In banking and payment environments, teams often monitor different types of business and operational data across applications, databases, APIs, payment switches, and infrastructure. Business Chart helps users:
- Create dynamic and interactive dashboard visualizations.
- Represent business and operational data in customized layouts.
- Build charts beyond standard predefined panels.
- Customize the appearance, behavior, and interaction of the visualization.
- Design charts based on specific business or analytical requirements.
This helps teams create visualizations that better match their monitoring and analysis needs.
Example Scenario
A payment operations team wants to analyze transaction behavior across different systems. The team creates a new dashboard panel, selects the required data source, and configures the query. Instead of choosing a standard predefined panel, they select Business Chart from the Visualization section. This allows them to create a customized and interactive chart for their business analysis requirement.
When to Use This Feature
Use the Business Chart visualization when:
- You need advanced charting.
- You want to create a custom chart layout.
- You need interactive data representation.
- Standard predefined panels do not meet the visualization requirement.
- You want to customize the appearance, behavior, or interaction of a chart.
- You are building a dashboard for specific business or analytical requirements.
Avoid using Business Chart when a simple predefined visualization is enough.
Comprehensive Understanding
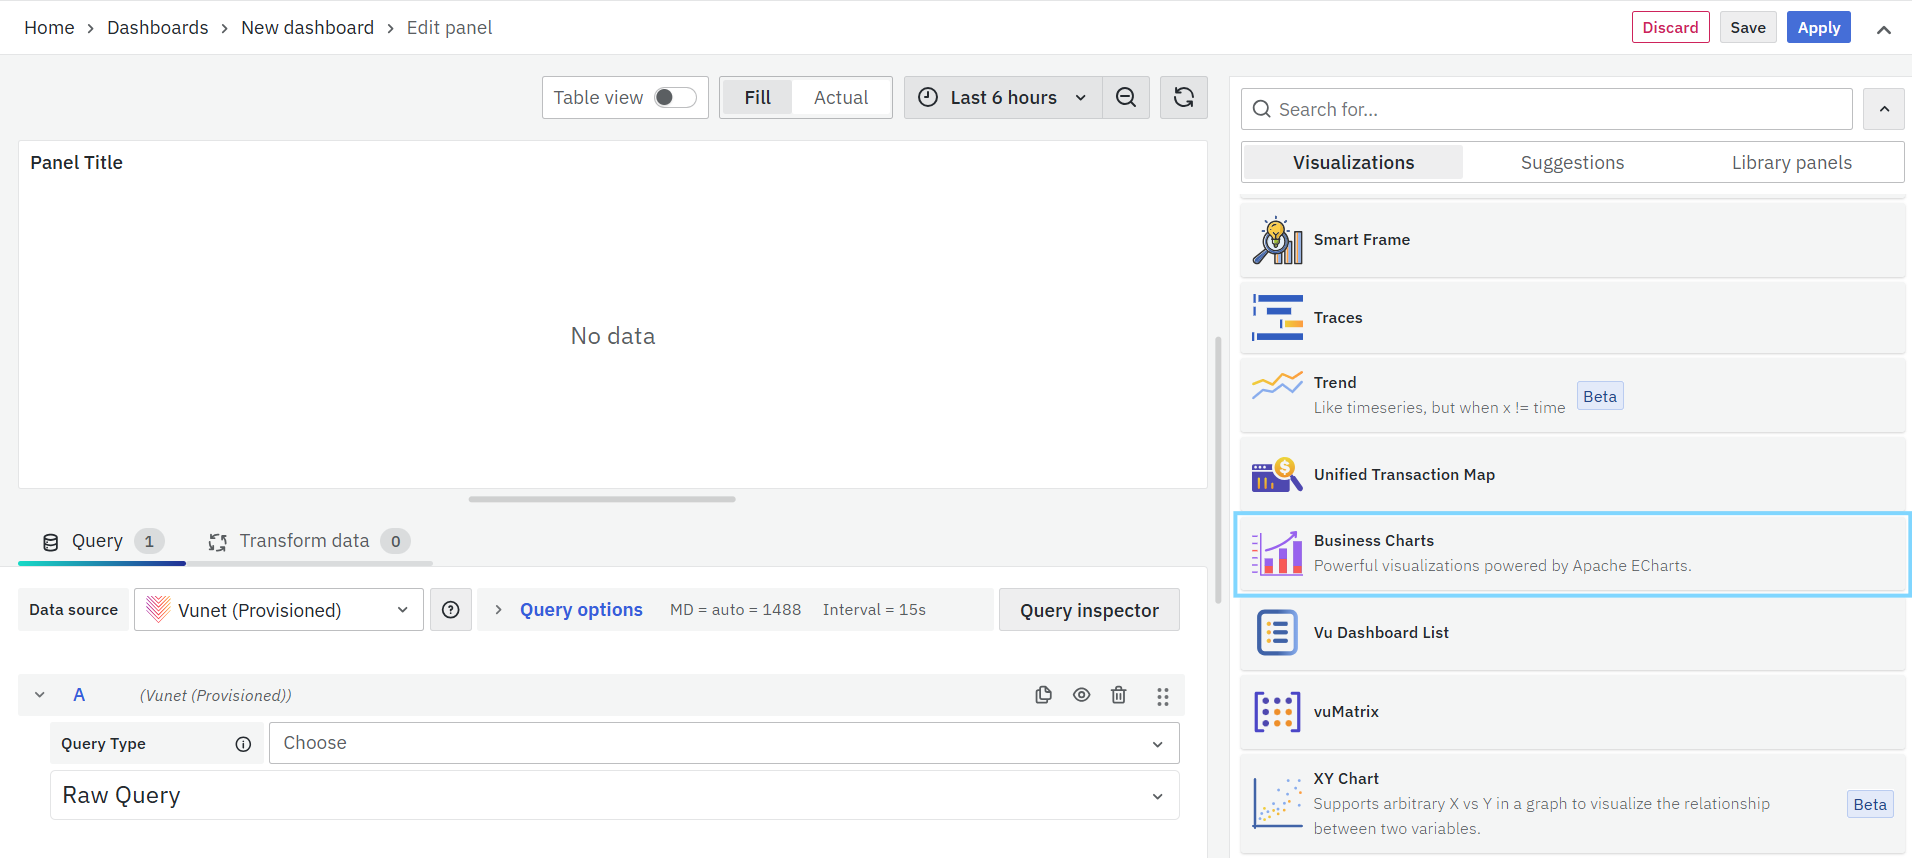
The Business Chart visualization is configured inside a dashboard panel. After creating a new dashboard panel and configuring the query, select Business Chart from the Visualization section on the right side of the panel configuration screen.
Visualization and Panel Configuration
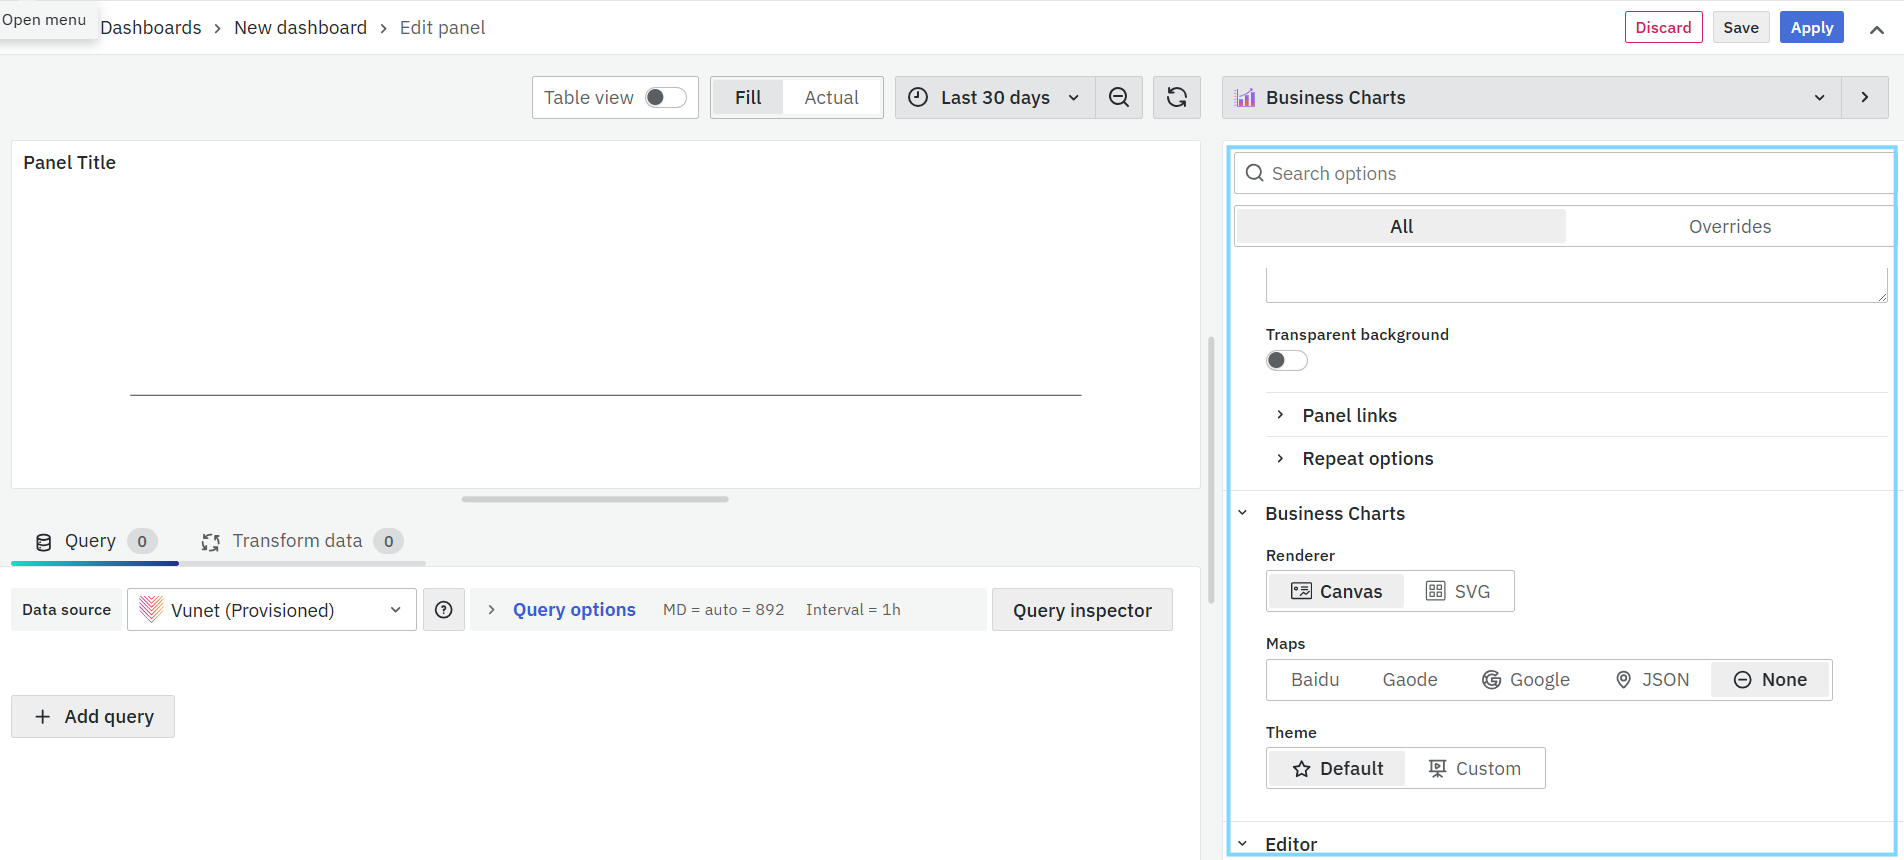
Business Chart provides extensive configuration options to customize the appearance, behavior, and interaction of the visualization. These options allow you to design charts based on specific business or analytical requirements.
Additional References
For advanced configurations, supported chart types, and plugin-specific options, refer to the official Business Chart documentation:
Step-by-Step Instructions
Creating a Business Chart
- Create a new dashboard panel in vuSmartMaps.
- Configure the query and select the appropriate data source. Refer to Dashboard > Query for more details.
- On the right side of the panel configuration screen, select Visualization.
- Choose Business Chart as the visualization type.
- Configure the visualization and panel options based on the required appearance, behavior, and interaction.
- Save the panel.
What Happens After the Steps
After saving the panel:
- The Business Chart panel is added to the dashboard.
- The configured query provides data to the chart.
- The selected Business Chart visualization displays the data.
- The chart can be customized for specific business or analytical requirements.
Tips / Best Practices
- Use Business Chart when standard predefined panels do not meet the requirement.
- Validate the query and data source before configuring the chart.
- Keep the chart layout simple and clear for end users.
- Use Business Chart for dashboards that need custom layouts or interactive data representation.
- Refer to the official Business Chart documentation for advanced configurations and supported chart types.
Troubleshooting
-
Issue: Business Chart is not displaying data.
- Possible Cause: The configured query may not be returning data, or the selected data source may not be correct.
- Solution: Verify the query and data source configuration. Refer to Dashboard > Query for more details.
-
Issue: Chart layout or behavior is not as expected.
- Possible Cause: The Business Chart configuration options may not be set according to the required business or analytical view.
- Solution: Review the Business Chart configuration settings and adjust the appearance, behavior, and interaction options.
FAQs
What is the Business Chart visualization used for?
Business Chart is used to create dynamic and interactive visualizations within vuSmartMaps dashboards.
When should I use Business Chart?
Use Business Chart when you need advanced charting, custom layouts, or interactive data representation beyond standard predefined panels.
How do I create a Business Chart?
Create a new dashboard panel, configure the query and data source, then select Business Chart from the Visualization section.
Can Business Chart be customized?
Yes. Business Chart provides configuration options to customize the appearance, behavior, and interaction of the visualization.
Where can I find advanced configuration details?
Refer to the official Business Chart by Volkov Labs documentation and Business Chart documentation for advanced configurations and supported chart types.
