Mobile Synthetic Journey Monitoring
Overview
As mobile banking and mobile-first digital experiences become the primary channel for customer engagement, ensuring that native mobile applications behave reliably across devices, operating systems, and network conditions is critical. Mobile Synthetic Journey Monitoring extends VuNet's synthetic monitoring capability to native Android applications, allowing teams to proactively validate critical mobile user journeys before real customers are impacted.
Mobile Synthetic Journey Monitoring simulates real user actions inside a native mobile application such as logging in, checking a balance, or completing a fund transfer by executing pre-authored scripts on Android emulators. It captures step-level performance metrics, device logs, network timings, crash information, and screenshots, giving teams the same proactive visibility into mobile app health that Synthetic Browser Journey Monitoring provides for web applications.
Mobile Synthetic Journey Monitoring is a separate, purpose-built module from Synthetic Browser Journey Monitoring because native mobile apps are authored, packaged, and executed differently from browser-based web applications. However, both modules are part of the same overall Synthetic Monitoring capability in vuSmartMaps and share a common visualization and alerting layer, so teams monitoring both browser and mobile journeys get a consistent, unified experience.
This module allows teams to author mobile journey scripts, manage app binaries and versions, execute journeys across multiple device, OS, and network configurations, run journeys from multiple geographic locations, and securely deploy and manage synthetic probes remotely without requiring physical, on-site access to the probe host.
Why This Feature Is Useful
- Mobile Synthetic Journey Monitoring helps organizations proactively validate critical native mobile app workflows by simulating real user interactions on Android in a controlled, repeatable environment instead of waiting for real customers to encounter a broken login, a failed transfer, or a slow-loading screen.
- Mobile applications fail in ways that are often invisible to server-side or browser-based monitoring: device and OS fragmentation, app version regressions, and highly variable mobile network conditions all affect the mobile experience differently from the web experience.
- By continuously executing mobile journeys such as login, balance checks, fund transfers, and form submissions, teams can detect failures, crashes, and performance degradation before they impact end users, and get detailed diagnostics screenshots, device logs, and network waterfalls to resolve issues quickly.
- Because mobile probes are managed centrally and remotely, operations teams can roll out new journeys, update scripts, and monitor probe health without requiring physical access to the machines running the emulators, reducing operational overhead significantly.
Example Scenario
- A bank wants to ensure that its native mobile banking app remains available and performs consistently for customers throughout the day, across the Android devices and network conditions its customers commonly use. The team authors a mobile synthetic journey that simulates a customer logging in, checking their account balance, and completing a fund transfer, executed at regular intervals from multiple locations.
- During one execution over a simulated 3G network profile, the journey reports an increased step duration and fails at the fund transfer confirmation screen. The captured screenshots, device logs, and network waterfall help the operations team quickly identify that the issue is isolated to the 3G profile and resolve it before it affects a large number of real customers.
When to Use This Feature
Use Mobile Synthetic Journey Monitoring when you need to:
- Continuously monitor critical native mobile app workflows such as login, balance checks, transfers, and form submissions.
- Validate mobile app availability and functionality without relying on real user traffic.
- Detect performance degradation and crashes before customers are impacted.
- Test how a mobile journey behaves across different Android OS versions and device profiles.
- Validate app behavior under different network conditions (Wi-Fi, 5G, 4G, 3G, 2G).
- Validate app behavior from multiple geographic locations.
- Capture step-level screenshots, device logs, and diagnostics during journey execution.
- Verify application behavior after app releases, upgrades, or backend infrastructure changes.
- Track journey success rates, execution duration, and failure trends over time.
- Compare performance across two or more app versions during a phased rollout.
Comprehensive Understanding
The Mobile Synthetic Journey Monitoring module provides a centralized interface for configuring, deploying, and monitoring synthetic mobile journeys. The module allows you to:
- Enable the Synthetic Browser Monitoring O11ySource in vuSmartMaps.
- Manage app binaries (APK) and their versions.
- Author and upload mobile journey scripts.
- Configure device, OS, and network condition profiles for execution.
- Configure single or multi-location execution.
- Schedule journeys on a cron or interval basis.
- Deploy and manage synthetic probes remotely via Omniagent.
- Monitor journey execution through shared Synthetic Monitoring dashboards.
- Analyze journey performance, execution status, diagnostics, and alerts.
Mobile Synthetic Journey Monitoring uses the same underlying visualization, alerting, and reporting layer as Synthetic Browser Journey Monitoring, giving teams a single, consistent place to review both browser and mobile journey health.
Step-by-Step Instructions
Follow these steps to set up Mobile Synthetic Journey Monitoring:
- Verify that all prerequisite network, device, and platform requirements are met.
- Enable the Synthetic Browser Monitoring O11ySource in vuSmartMaps.
- Upload the app binary (APK) and tag its version.
- Author the mobile journey script.
- Submit the script for review and approval.
- Sign the approved script bundle.
- Deploy the signed bundle to the mobile probe via Omniagent.
- Configure the device profile, OS version, and network condition profile for execution.
- Configure single- or multi-location execution as required.
- Configure the execution schedule (cron- or interval-based; minimum interval: 5 minutes).
- Configure alert conditions for the journey.
- Trigger a manual on-demand run to validate the journey end-to-end.
- Access the shared Synthetic Monitoring dashboards and monitor journey performance.
- Review step-level diagnostics whenever a journey fails.
Getting Started with Mobile Synthetic Journey Monitoring
Prerequisites
Before setting up Mobile Synthetic Journey Monitoring, ensure that your environment meets the following prerequisites.
- Probe deployment: Ensure that the mobile synthetic probe is deployed and operational at the target site using a supported deployment method. If OmniAgent is used, verify that it is installed and running before managing the probe through it.
- Probe host requirements: The probe host must support an Android emulator environment.
- Network access: The probe requires network access to the Kafka instance to which it publishes telemetry, and to the backend endpoints used by the mobile application under test.
- App binaries: Have the app binary (APK) for the version you want to monitor available for upload before journey authoring.
- vuSmartMaps access: Mobile Synthetic Monitoring outputs are visualized through vuSmartMaps. Ensure the platform is installed and operational.
- Authoring model: Unlike browser journeys, mobile journey scripts are authored directly rather than captured through a visual recorder. Script authoring and review should be planned into your onboarding timeline.
Understanding Mobile Synthetic Journey Monitoring Technologies
Mobile Synthetic Journey Monitoring is a proactive approach to evaluating the reliability, performance, and user experience of native mobile applications. The following questions cover the core concepts.
What is Mobile Synthetic Journey Monitoring?
- Mobile Synthetic Journey Monitoring involves executing scripted actions inside a native Android application on an Android emulator to replicate real user workflows such as logging in, browsing, or completing a transaction. Running these journeys in a controlled environment lets teams monitor key performance metrics, identify bottlenecks, and resolve issues before they affect end users.
Why is Mobile Synthetic Monitoring important?
- It ensures consistent delivery of high-quality mobile experiences by identifying issues before users encounter them — detecting performance bottlenecks, monitoring critical functions like login and transfers, ensuring uptime, and improving reliability through continuous testing.
- Without it, mobile-specific issues (device fragmentation, OS version regressions, network variability) often go unnoticed until customer complaints accumulate.
What is a mobile journey?
- A mobile journey is a sequence of user actions performed within a native mobile application — such as launching the app, logging in, navigating screens, and submitting data. These journeys represent typical use cases and validate that users can interact seamlessly with the application.
How are mobile journeys authored?
- Mobile journey scripts are authored directly in JS using an Appium-compatible format and uploaded to the platform. There is currently no visual recorder for mobile journeys — scripts describe the sequence of actions, elements, and assertions the journey should perform.
- A typical journey script might describe steps such as: launch the app, enter credentials, tap the login button, and verify a specific screen element to confirm successful login.
What is a mobile synthetic probe?
- A mobile synthetic probe is the component that executes mobile journey scripts against the target application on an Android emulator. It captures telemetry such as performance metrics, device logs, screenshots, and crash information where applicable, and sends this data to Kafka for downstream processing.
What devices and operating systems are supported?
- Journeys run on Android emulators covering a configurable range of OS/API levels. Device model, OS version, and app version can all be selected when configuring a journey.
How does network condition simulation work?
- Each journey can be executed under a selected network condition profile — Wi-Fi, 5G, 4G, 3G, or 2G. These fixed presets are the supported set today; custom, user-defined network profiles are planned for a later release and are not yet available.
How does multi-location execution work?
- Journeys can be configured to run from more than one execution location (Point of Presence). Running the same journey from multiple locations helps distinguish a localized network or infrastructure issue from a genuine application-level failure, and results can be compared across locations.
What tools are used in Mobile Synthetic Journey Monitoring?
- The mobile synthetic probe executes journeys on Android emulators. Kafka handles telemetry transmission. A dedicated processing engine refines and aggregates telemetry for storage. vuSmartMaps visualizes performance metrics, errors, and diagnostics. Omniagent manages the full lifecycle of the probe remotely.
How does Mobile Synthetic Monitoring benefit businesses?
- Improved user experience by ensuring mobile workflows are seamless and error-free.
- Proactive issue detection that identifies problems before they affect end users.
- Performance optimization for key mobile workflows like logins, transfers, and API-backed transactions.
- Reduced operational overhead, since probes are deployed, updated, and monitored remotely.
What is the difference between Mobile Synthetic Monitoring and Mobile Real User Monitoring (MRUM)?
- Mobile Synthetic Monitoring executes scripted journeys in a controlled environment on a defined schedule — it is proactive and works even when no real users are active.
- Mobile Real User Monitoring (MRUM) passively captures actual user sessions as they happen — it is reactive and reflects real-world usage patterns.
- The two approaches are complementary: MRUM shows what real users are experiencing, while Mobile Synthetic Monitoring proactively validates critical journeys on a deterministic, repeatable basis.
What happens if a mobile journey fails?
- The probe logs the error details for the failing step and captures available diagnostics, such as a failure screenshot, device logs, network timing information, and crash details where applicable. This data is sent to Kafka, processed, and surfaced in dashboards and alerts so teams can investigate and resolve the issue quickly.
How is security handled for mobile journey scripts?
- Journey scripts go through a review and approval step before they can be deployed, with authoring and approval kept as separate responsibilities. Approved scripts are cryptographically signed, and the probe verifies this signature before every execution — not just at deployment time — so a script cannot be silently modified on the probe host and run without detection.
- Sensitive data such as passwords, OTPs, and account numbers is masked in captured screenshots and redacted from device logs, and all script and configuration changes are recorded in an audit trail.
Mobile Synthetic Journey Monitoring Architecture
The architecture of Mobile Synthetic Journey Monitoring is designed to deliver end-to-end observability for native mobile applications, from journey authoring through secure deployment, execution, and visualization.
Key Components and Workflow
- Journey Authoring & Approval: Journey scripts are authored in YAML/JSON/JS (Appium-compatible) and submitted for review. A separate approver reviews and approves the script before it can move forward, keeping authoring and approval as distinct responsibilities.
- Signing: Once approved, the script bundle is cryptographically signed. Only signed bundles can be deployed to a probe.
- Deployment via Omniagent: The signed bundle is pushed from central management to the target probe through Omniagent, with no on-site access required. The probe verifies the signature before storing and before every subsequent execution.
- Probe Execution: The mobile synthetic probe executes the journey on an Android emulator, using the configured device profile, OS version, network condition profile, and execution location.
- Diagnostics Capture: During execution, the probe captures step-level screenshots, device logs (Logcat), network timing (waterfall), and crash reports where applicable.
- Data Transmission: Telemetry data is sent to Kafka, the same high-throughput messaging backbone used by Synthetic Browser Journey Monitoring.
- Data Processing: A dedicated processing engine refines, enriches, and aggregates the incoming telemetry, managing storage of screenshots and other artifacts, with PII masking applied before persistence.
- Visualization: Processed data is visualized through the shared Synthetic Monitoring dashboards in vuSmartMaps, alongside browser journey data.
Detailed Architecture Description
- Mobile Synthetic Probe: The probe is the execution component that runs mobile journeys against Android emulators. It applies the configured device, OS, network, and location parameters for each run, captures telemetry, and transmits it downstream.
- Omniagent: Omniagent provides zero-touch, remote lifecycle management of the probe — deployment, health monitoring, script updates, log retrieval, and decommissioning — without requiring physical access to the probe host. It also acts as the secure channel through which signed script bundles are delivered.
- Kafka and the Processing Engine: Kafka acts as the message broker for telemetry transmission, ensuring high throughput and reliability. The processing engine consumes this data, refines it for consistency, applies PII masking, manages storage of screenshots and diagnostic artifacts, and provides real-time status updates for visualization.
- Visualization with vuSmartMaps: Dashboards aggregate mobile journey data into step-by-step breakdowns, pass/fail rates, duration trends, and device/OS/network/location comparisons, using the same visualization layer as Synthetic Browser Journey Monitoring.
Deployment and Configuration
Mobile Synthetic Journey Monitoring is deployed and managed centrally through vuSmartMaps and Omniagent. This section describes how to enable the module, onboard a journey, and understand what happens at each stage.
Enabling Browser RUM O11ySource
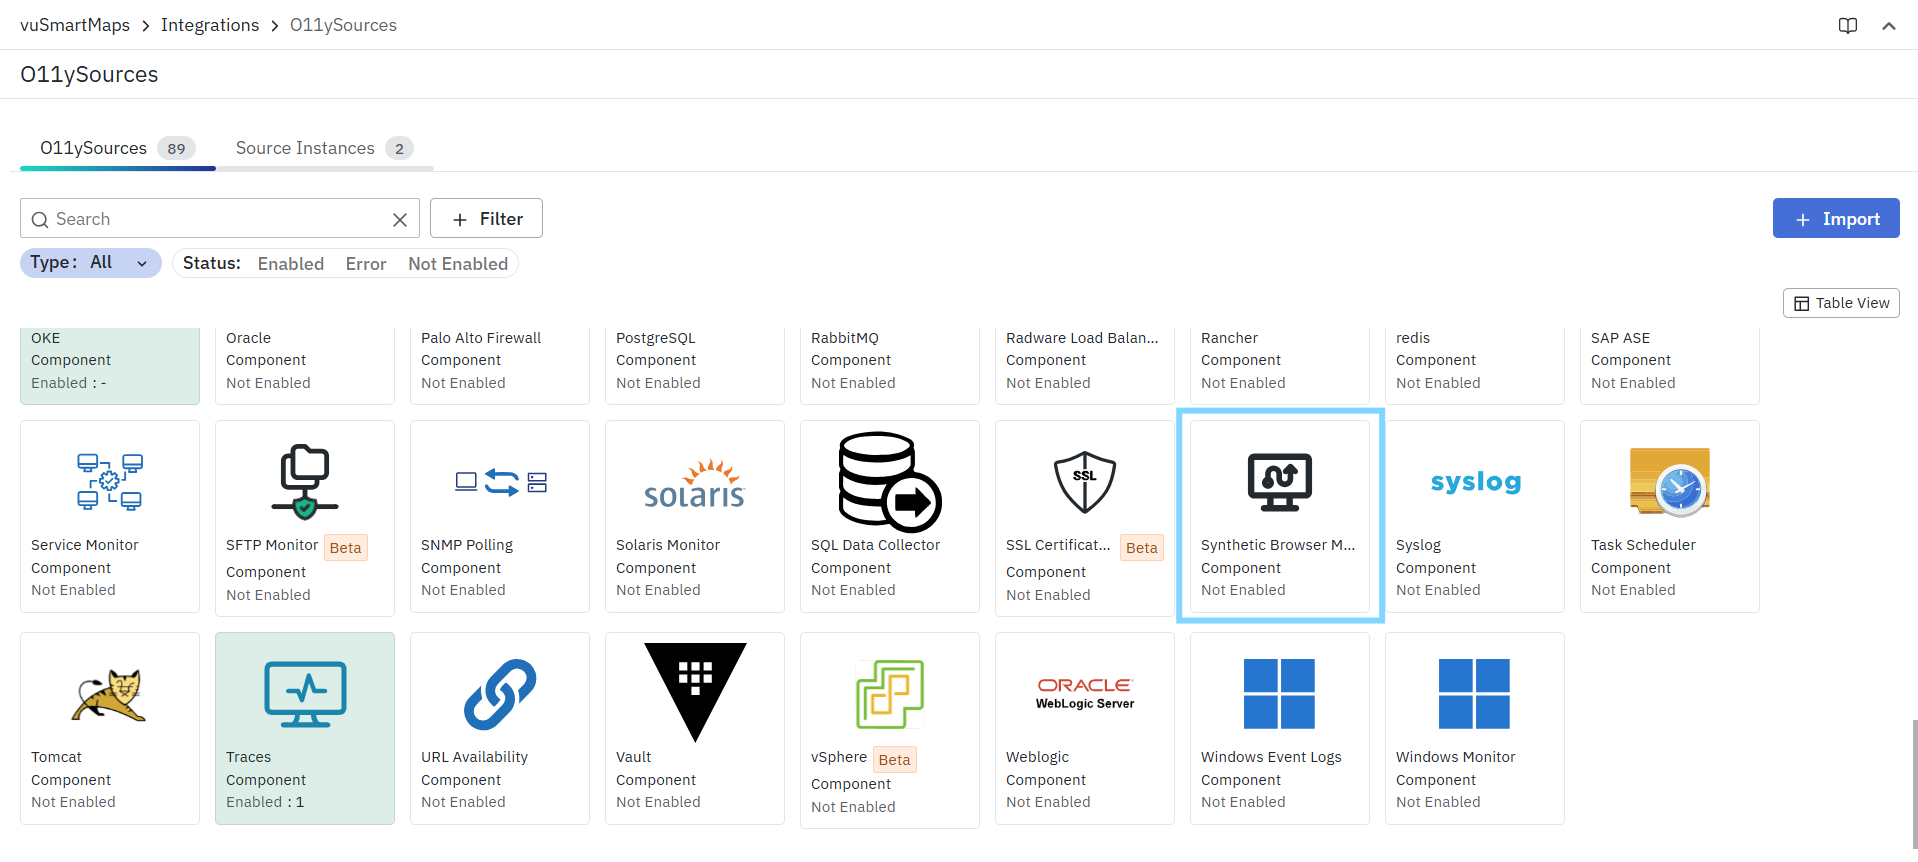
- Navigate to O11ySources:
- vuSmartMaps O11ySources can be accessed by navigating from the left navigation menu (Integrations > O11ySources).
- Locate Synthetic Browser Monitoring O11ySource on the landing page.
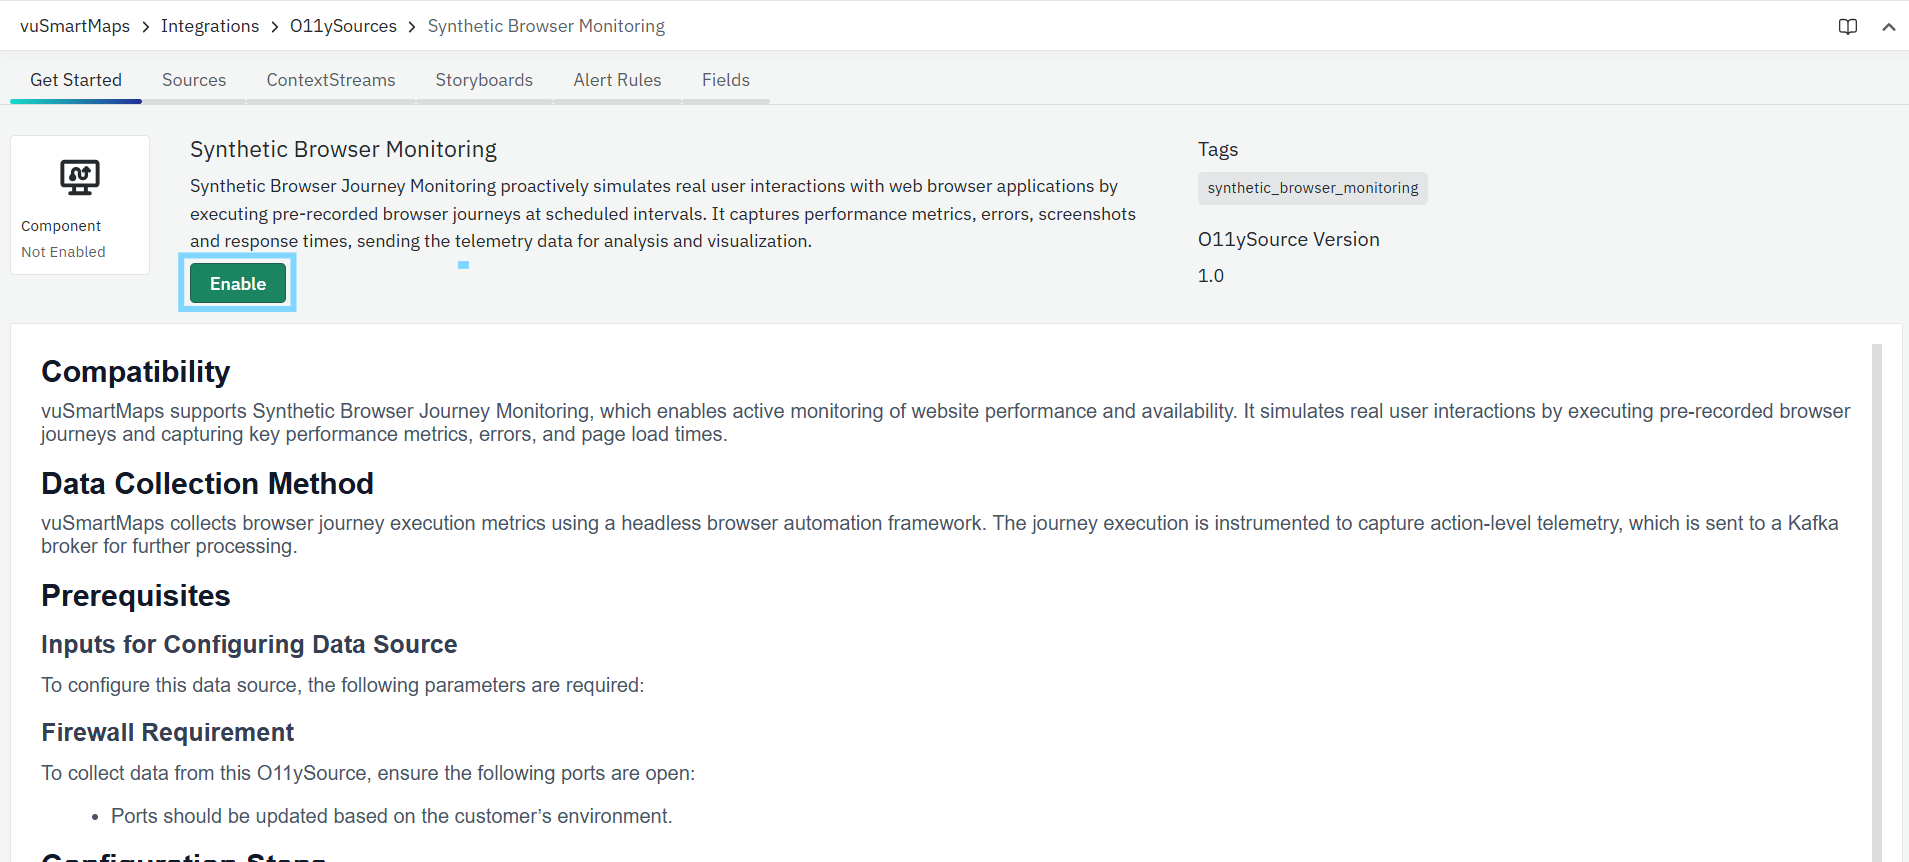
- Enable vuSyntheticBrJourney O11ySources:
- Click the Enable button to activate vuSyntheticBrJourney O11ySource.
Onboarding a Mobile Synthetic Journey
Onboarding a new mobile synthetic journey follows a defined, security-conscious flow so that only reviewed and signed scripts ever reach a probe:
- Author: A journey script is written in JS (Appium-compatible) describing the steps to be executed.
- Approve: A separate approver reviews the script and approves it for deployment. The same person cannot author and approve a script.
- Sign: The approved script bundle is cryptographically signed.
- Deploy: The signed bundle is pushed to the target probe via Omniagent.
- Verify: The probe verifies the signature before storing the bundle, and again before every execution.
- Execute: The probe runs the journey on the configured device, OS, network, and location profile.
Data Collection and Processing
During each execution, the probe captures performance metrics, step-level screenshots, device logs, network waterfall timings, and (where applicable) crash reports. This data is transmitted to Kafka and processed by the mobile synthetic processing engine, which refines the data, applies PII masking, and makes it available for dashboards, alerts, and reports.
Step 1: App Binary Upload
Upload the APK binary for the app version you want to monitor, and tag it with a version identifier. Multiple app versions can be managed concurrently to support version comparison.
Step 2: Journey Script Upload
Upload the authored journey script. The script references the app binary version, the steps to execute, and the assertions used to confirm success at each step.
Step 3: Device, OS & Network Configuration
Select the device profile, OS version, and network condition profile (Wi-Fi, 5G, 4G, 3G, or 2G) the journey should run under. Multiple configurations can be defined to cover the range of conditions relevant to your users. Custom, non-preset network profiles are not yet available.
Step 4: Location & Scheduling
Select one or more execution locations for the journey, and configure the run schedule (cron or interval-based, with a minimum interval of 5 minutes). Maintenance windows and blackout periods can be configured to suppress runs and alerts during planned downtime.
Step 5: Review and Deploy
Submit the journey for approval. Once approved and signed, the bundle is deployed to the target probe via Omniagent, and the journey becomes active according to its schedule.
Steps to Configure and Run a Mobile Synthetic Journey
- Navigate to the Mobile Synthetic Journey Monitoring module in vuSmartMaps.
- Upload the app binary (APK) and assign a version tag.
- Upload the journey script and associate it with the app version.
- Configure the device, OS, and network condition profile(s).
- Configure the execution location(s) and schedule.
- Submit the journey for approval and signing.
- Once deployed, trigger a manual on-demand run to validate the journey end-to-end.
- Confirm that telemetry data is being received and visualized in the dashboards.
What Happens After the Step
Once a journey is deployed and active, the probe executes it on the configured schedule. Each run produces a result (pass, fail, or error), step-level diagnostics, and telemetry that is transmitted to Kafka, processed, and made available in the dashboards within a few minutes of execution. Any configured alert conditions are evaluated against each run, and notifications are sent through the configured channels if a condition is met.
Tips and Best Practices
- Keep journeys focused on a small number of critical steps (login, balance check, transfer) rather than exhaustive end-to-end flows, so that failures are easy to isolate.
- Use multi-location execution for journeys that are business-critical, so that a single location or network issue does not generate a false positive.
- Review and update journey scripts whenever the app UI changes significantly, to avoid false failures caused by stale element references.
- Use maintenance windows during planned releases to avoid alert noise from expected downtime.
- Periodically review app binary versions in use and retire versions that are no longer relevant to reduce clutter in version-comparison dashboards.
Mobile Synthetic Journey Monitoring Features
| Feature | Description |
|---|---|
| Script-based journey authoring | Author mobile journeys inJS (Appium-compatible) for native Android apps. |
| App binary management | Upload and version APK binaries, with support for multiple concurrent versions. |
| Android execution | Execute journeys on Android emulators. |
| Network condition simulation | Run journeys under 5 fixed presets: Wi-Fi, 5G, 4G, 3G, or 2G. Custom profiles are planned for a later release. |
| Multi-location execution | Run the same journey from multiple geographic locations and compare results. |
| Cron/interval scheduling | Schedule journeys regularly, with maintenance windows and blackout periods. |
| Manual on-demand trigger | Run a journey on demand with parameter overrides for device, network, or location. |
| Step-level diagnostics | Capture screenshots, device logs, network waterfall timings, and crash reports for every step. |
| Failure alerting | Alert on consecutive failures, cross-location consensus, and duration regressions. |
| Omniagent-managed probes | Deploy, update, and monitor probe health remotely — no on-site access required. |
| Secure script packaging | Cryptographically signed scripts with pre-execution signature verification and tamper detection. |
| PII masking | Automatic masking of sensitive fields in screenshots and logs. |
| Audit trails | Full audit history of script changes, approvals, deployments, and executions. |
| Role-based access control | Separate author, approver, and viewer responsibilities. |
Mobile Synthetic Journey Monitoring Console
The Mobile Synthetic Journey Monitoring console provides a single place to manage the full lifecycle of mobile journeys:
- A journey list view showing each configured journey, its current status, and last execution result.
- App binary management, showing uploaded APK versions and which journeys reference them.
- Journey configuration screens for device, OS, network, location, and schedule settings.
- Approval and signing status for each journey script.
- Probe status, showing which probes are online, their last health check, and any pending updates.
- A manual trigger option to run a journey on demand.
Mobile Synthetic Journey Monitoring Dashboards
Mobile Synthetic Journey Monitoring uses the same underlying Synthetic Monitoring dashboard suite as Synthetic Browser Journey Monitoring — both browser and mobile journeys are visualized through a shared, central dashboard experience. The following dashboards are available:
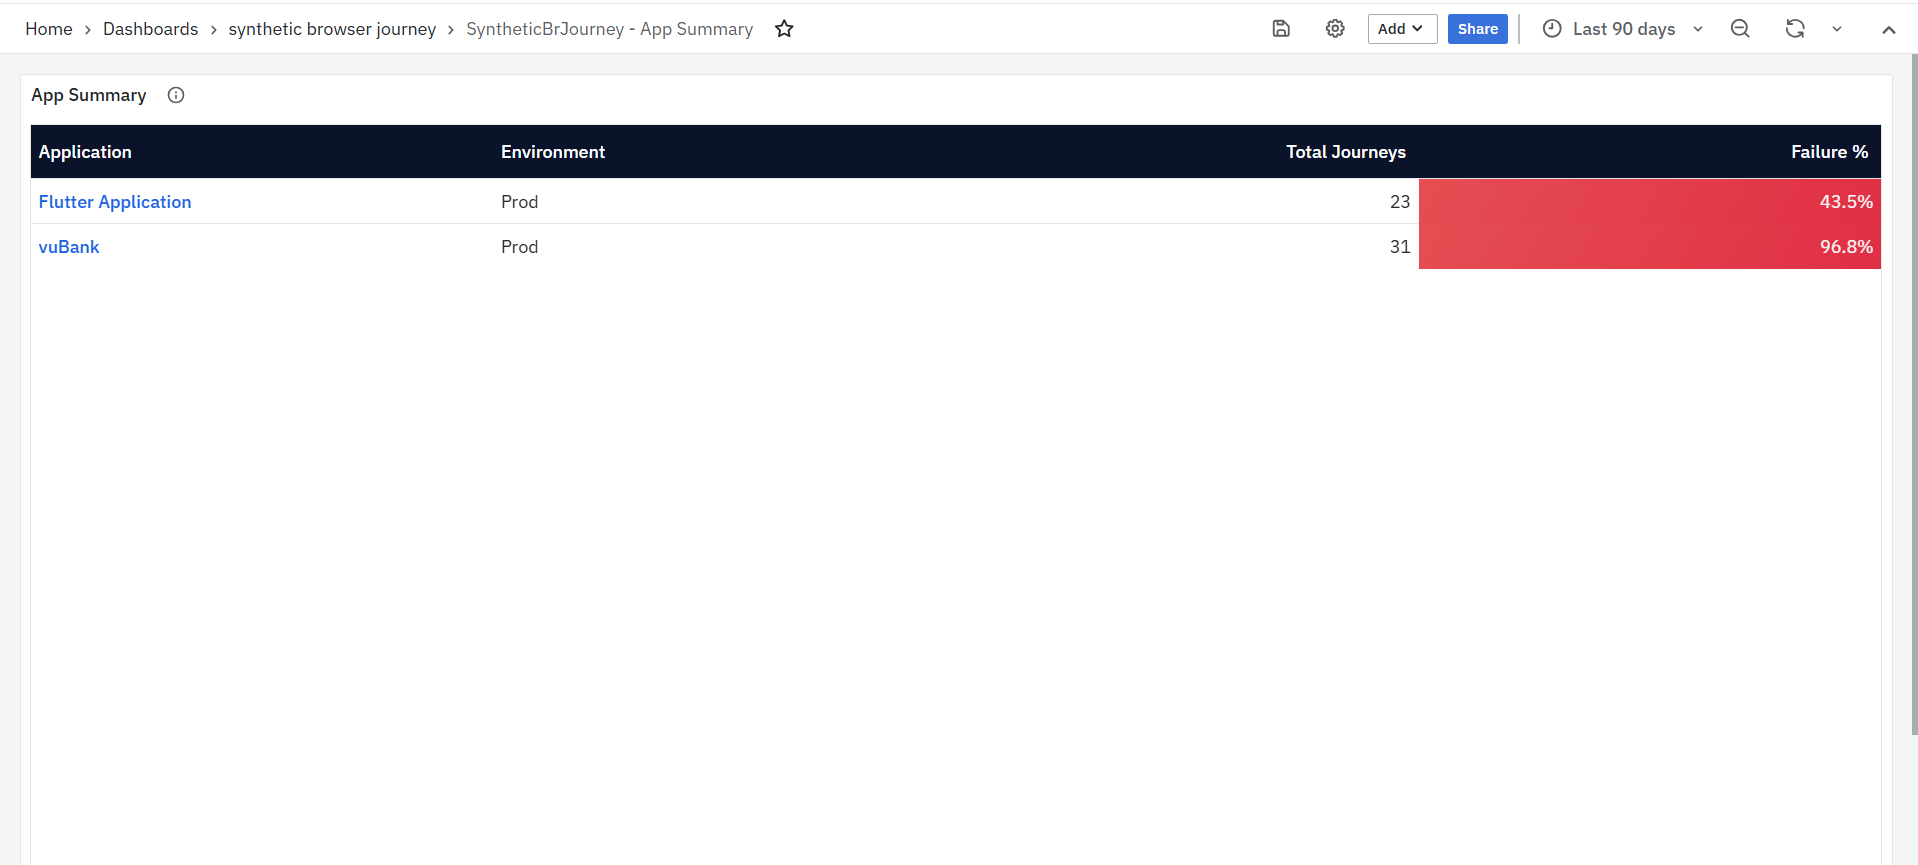
App Summary
The App Summary dashboard is the entry point into mobile journey monitoring. It lists every monitored application along with its environment, total number of journeys, and failure percentage, giving teams an at-a-glance view of which applications need attention before drilling into a specific app or journey.
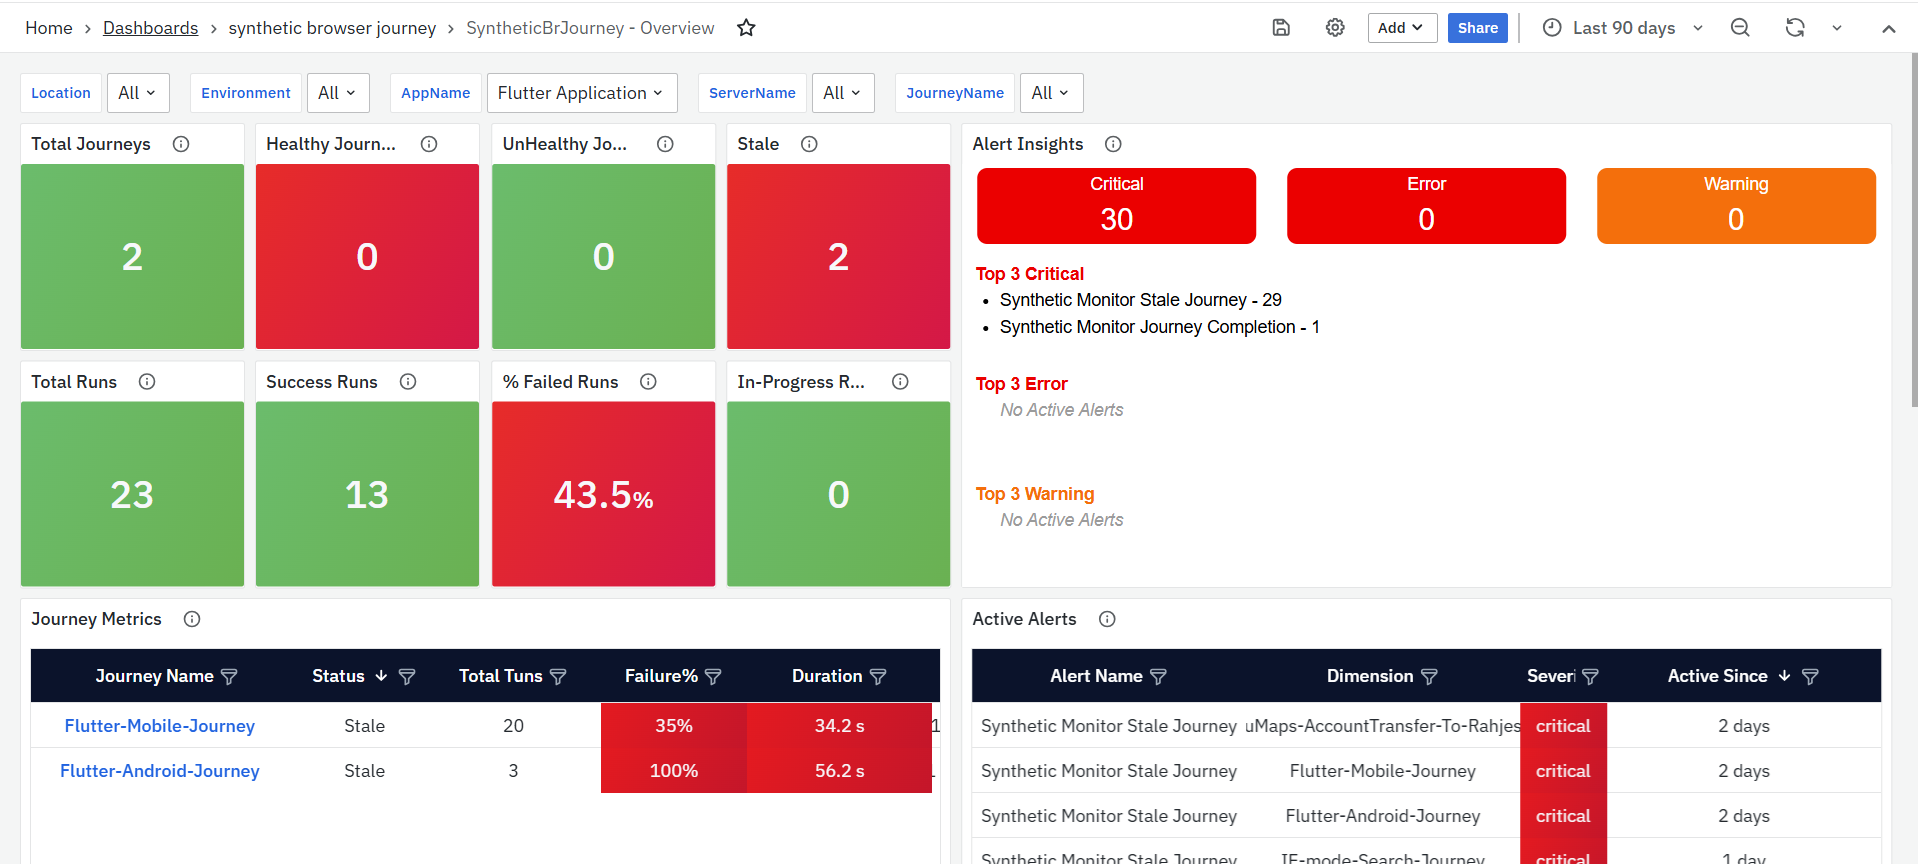
Overview
The Overview dashboard provides a comprehensive summary of synthetic monitoring across all mobile journeys — total journeys monitored, their health status (healthy, unhealthy, or stale), execution statistics such as total runs, success rates and failures, along with real-time alerts and performance trends. It acts as a centralized starting point for monitoring, troubleshooting, and optimizing mobile journeys.
Journey-Level
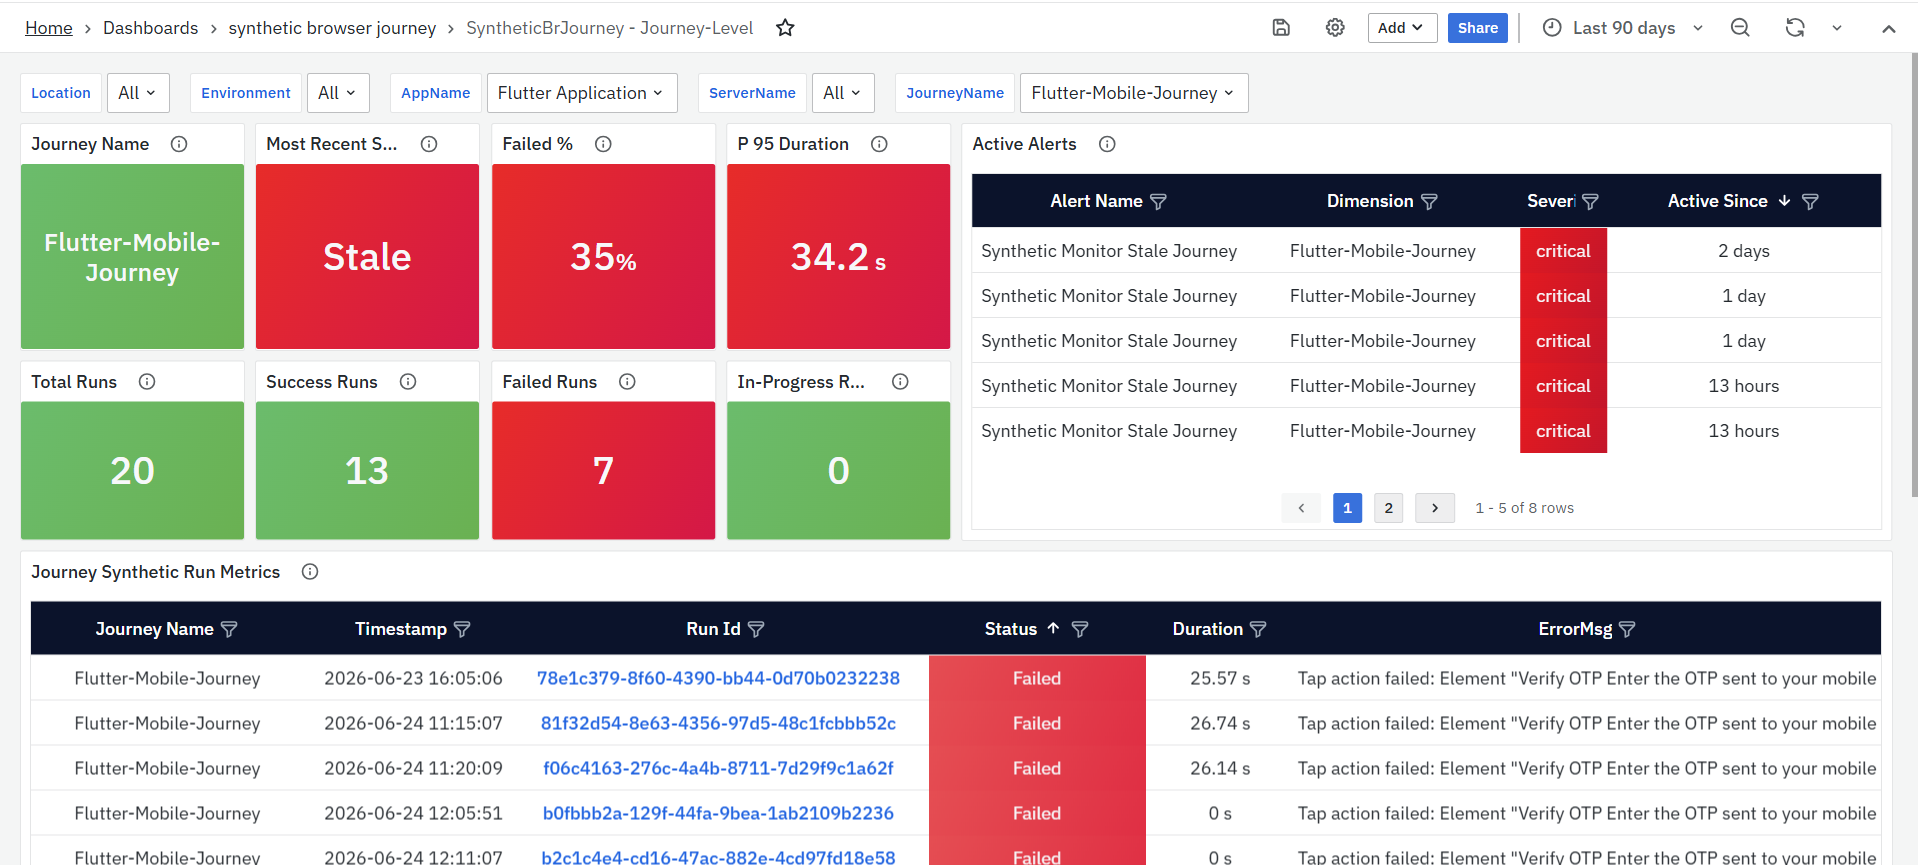
The Journey-Level dashboard gives a real-time view of a single journey's performance — status, failure rate, run times, and active alerts — along with detailed logs, screenshots, and visual trends to help prioritize and address issues quickly.
Run Level Page
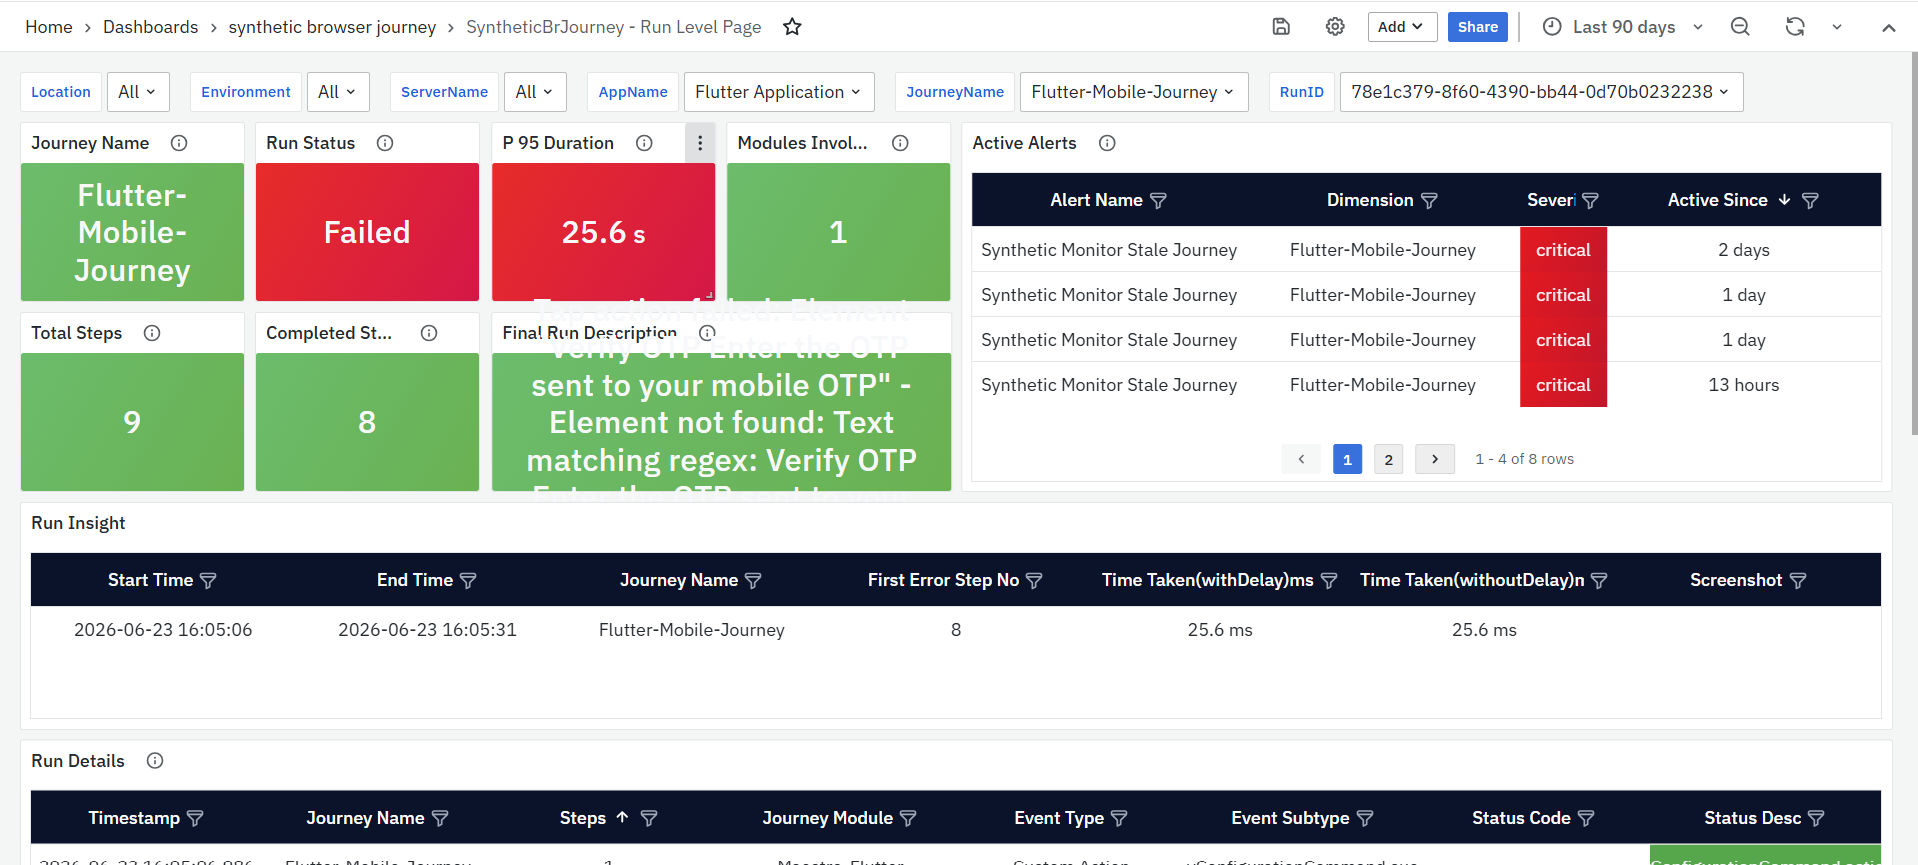
The Run Level Page dashboard offers a detailed, step-by-step breakdown of a single test run — run status, execution time, failed steps, and the cause of failure — along with screenshots and logs for quick troubleshooting.
Screenshot View
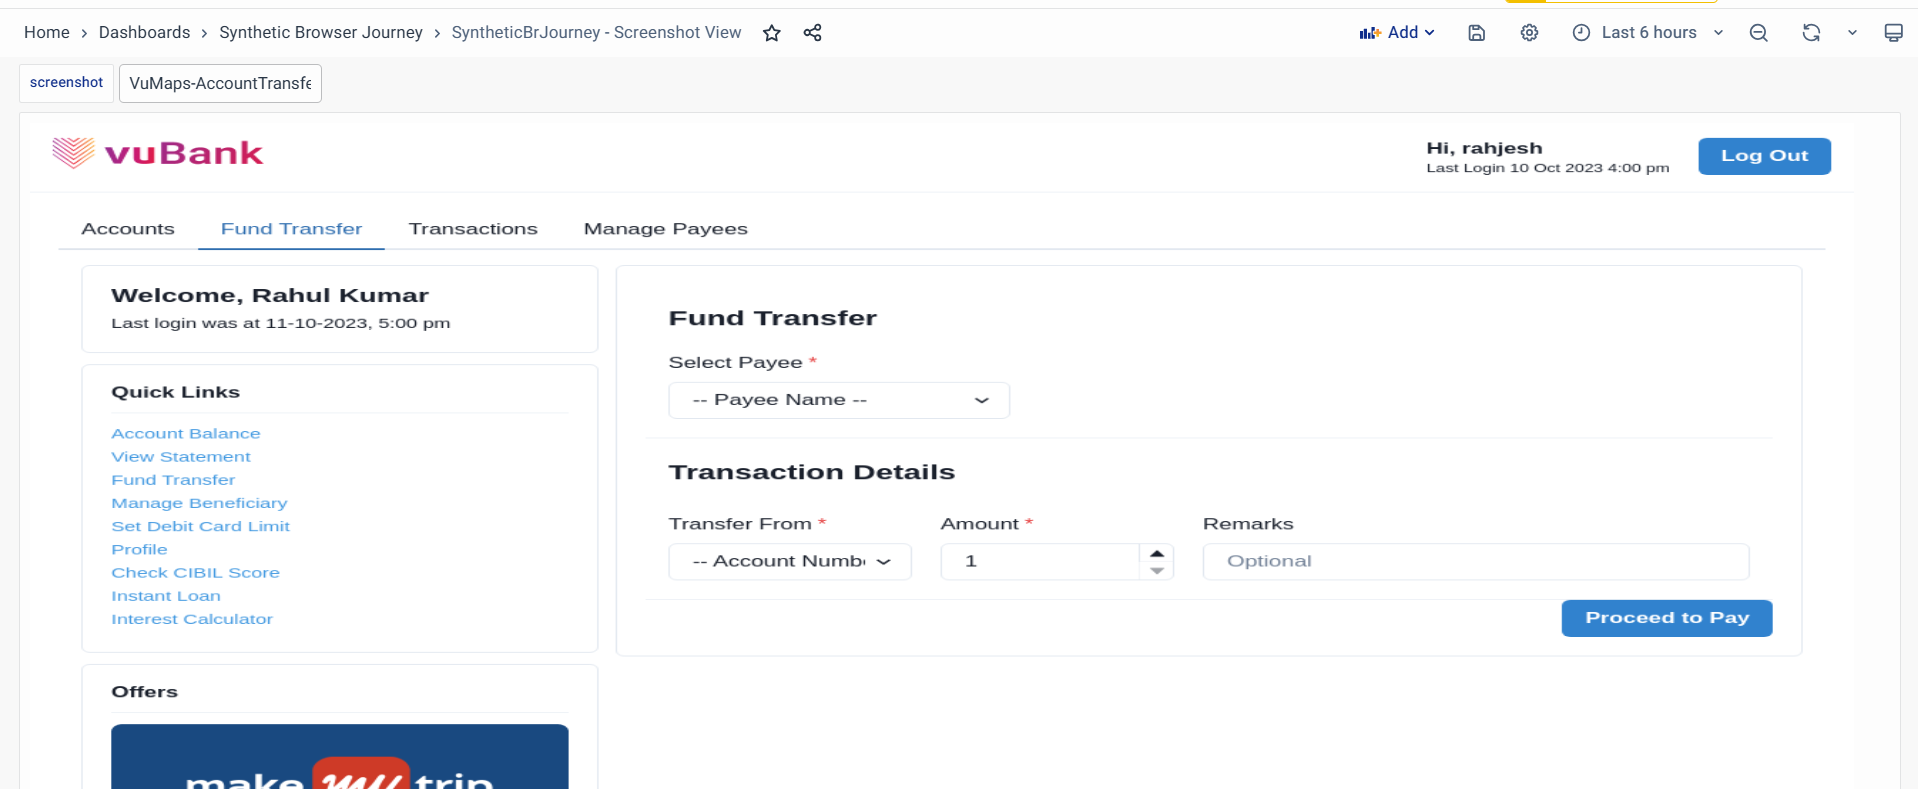
The Screenshot View dashboard displays the screenshots captured at each step of a run, allowing teams to visually confirm errors, UI behavior, and performance issues.
For a more detailed breakdown of each dashboard's panels and widgets, refer to the Synthetic Browser Journey Monitoring Dashboards since both modules share the same dashboard suite; that document covers the panel-level detail in depth.
Mobile Synthetic Journey Monitoring Real-World Applications
Mobile Banking Reliability
Banks simulate login, balance check, and fund transfer journeys across Android devices and network conditions to ensure consistent, reliable mobile banking experiences.
E-Commerce Mobile Checkout
Retail apps simulate browsing, adding to cart, and checkout flows to catch mobile-specific checkout failures before they affect shoppers.
Ride-Hailing Booking Flow
Ride-hailing apps simulate searching for a ride, confirming a booking, and tracking a driver to ensure the core booking flow stays reliable during peak demand.
Healthcare Appointment Apps
Healthcare apps simulate booking appointments and viewing test results to ensure smooth access, particularly during high-demand periods.
Streaming App Playback
Streaming apps simulate login and content playback start to catch buffering or playback failures on specific device/OS/network combinations.
Food Delivery Order Flow
Food delivery apps simulate browsing menus, placing orders, and tracking delivery status to maintain a smooth ordering experience.
Insurance Claim Submission
Insurance apps simulate policy lookup and claim submission flows to ensure customers can complete critical actions without friction.
Travel Booking Apps
Travel apps simulate flight search and booking flows to ensure quick, reliable booking experiences, including during high-traffic periods.
Troubleshooting
- Issue: Journey execution fails.
- Possible Cause: The target application backend is unreachable, or there is a network connectivity issue from the probe.
- Solution: Verify that the backend endpoints are accessible from the probe host and ensure the required network connectivity is available.
- Issue: Probe does not register with OmniAgent.
- Possible Cause: OmniAgent is not running, or the probe has not been provisioned correctly.
- Solution: Verify that OmniAgent is installed and running on the host, then review the probe provisioning steps to ensure the probe is configured correctly.
- Issue: Script deployment is blocked.
- Possible Cause: The script has not been approved and signed, or it fails signature verification on the probe.
- Solution: Confirm that the script has completed the approval and signing workflow, then redeploy the signed bundle through OmniAgent.
- Issue: No data appears in the dashboards.
- Possible Cause: The probe is not running, or telemetry data is not reaching the platform.
- Solution: Verify that the probe is running successfully and check the Kafka connectivity and data source configuration.
- Issue: Screenshots are not captured during execution.
- Possible Cause: The journey terminated unexpectedly, or execution failed before the screenshot capture step.
- Solution: Validate the journey script, resolve any execution errors, and rerun the journey.
- Issue: The requested device or OS combination is unavailable.
- Possible Cause: The probe host does not have the required Android emulator image configured.
- Solution: Confirm that the required Android emulator image is available and properly configured on the probe host.
Conclusion
Mobile Synthetic Journey Monitoring extends VuNet's proactive monitoring capability to native Android applications, giving teams the same early-warning visibility into mobile app health that Synthetic Browser Journey Monitoring provides for web applications. With script-based journey authoring, multi-device and multi-network execution, multi-location validation, and secure, remotely-managed probes, teams can detect mobile-specific issues before they impact customers — all through the same unified Synthetic Monitoring experience used for browser journeys.
