Browser RUM V2 Dashboards
The Browser RUM V2 Dashboards, included with Browser RUM, can be accessed by clicking Dashboards in the left menu. On the Dashboards page, use the Search bar to locate the Browser RUM V2 dashboards.
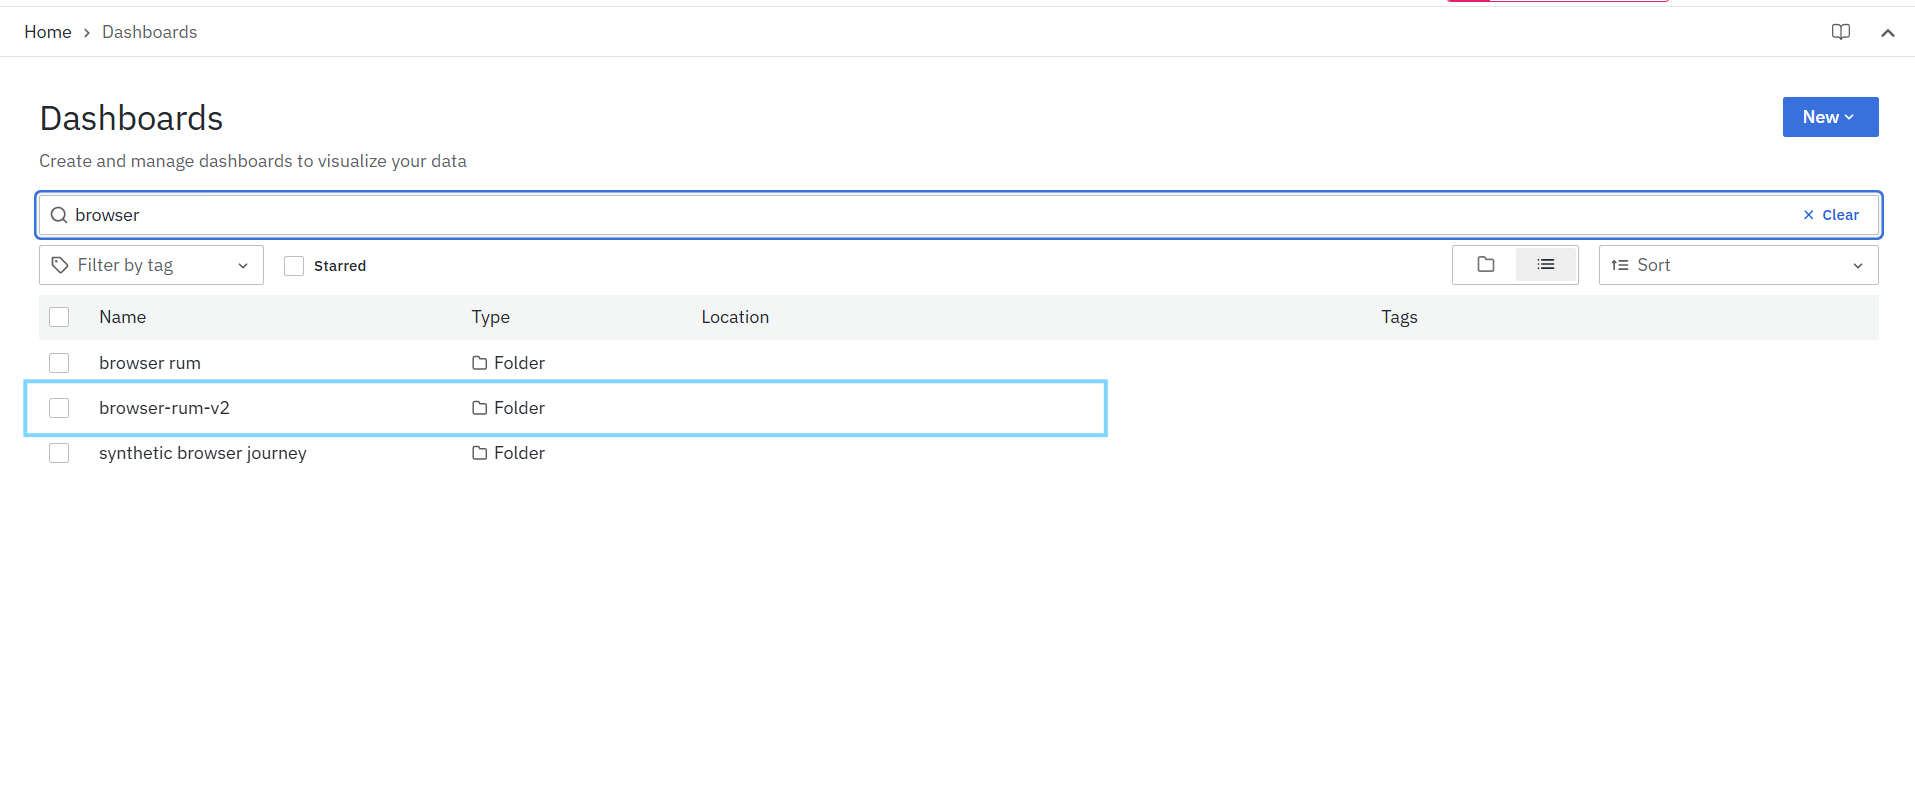
Once you access the Browser RUM dashboards, the first page displayed is the App Overview Dashboard. Browser RUM provides a set of dashboards designed to help you monitor application performance, analyze user experience, investigate errors, and troubleshoot performance issues.
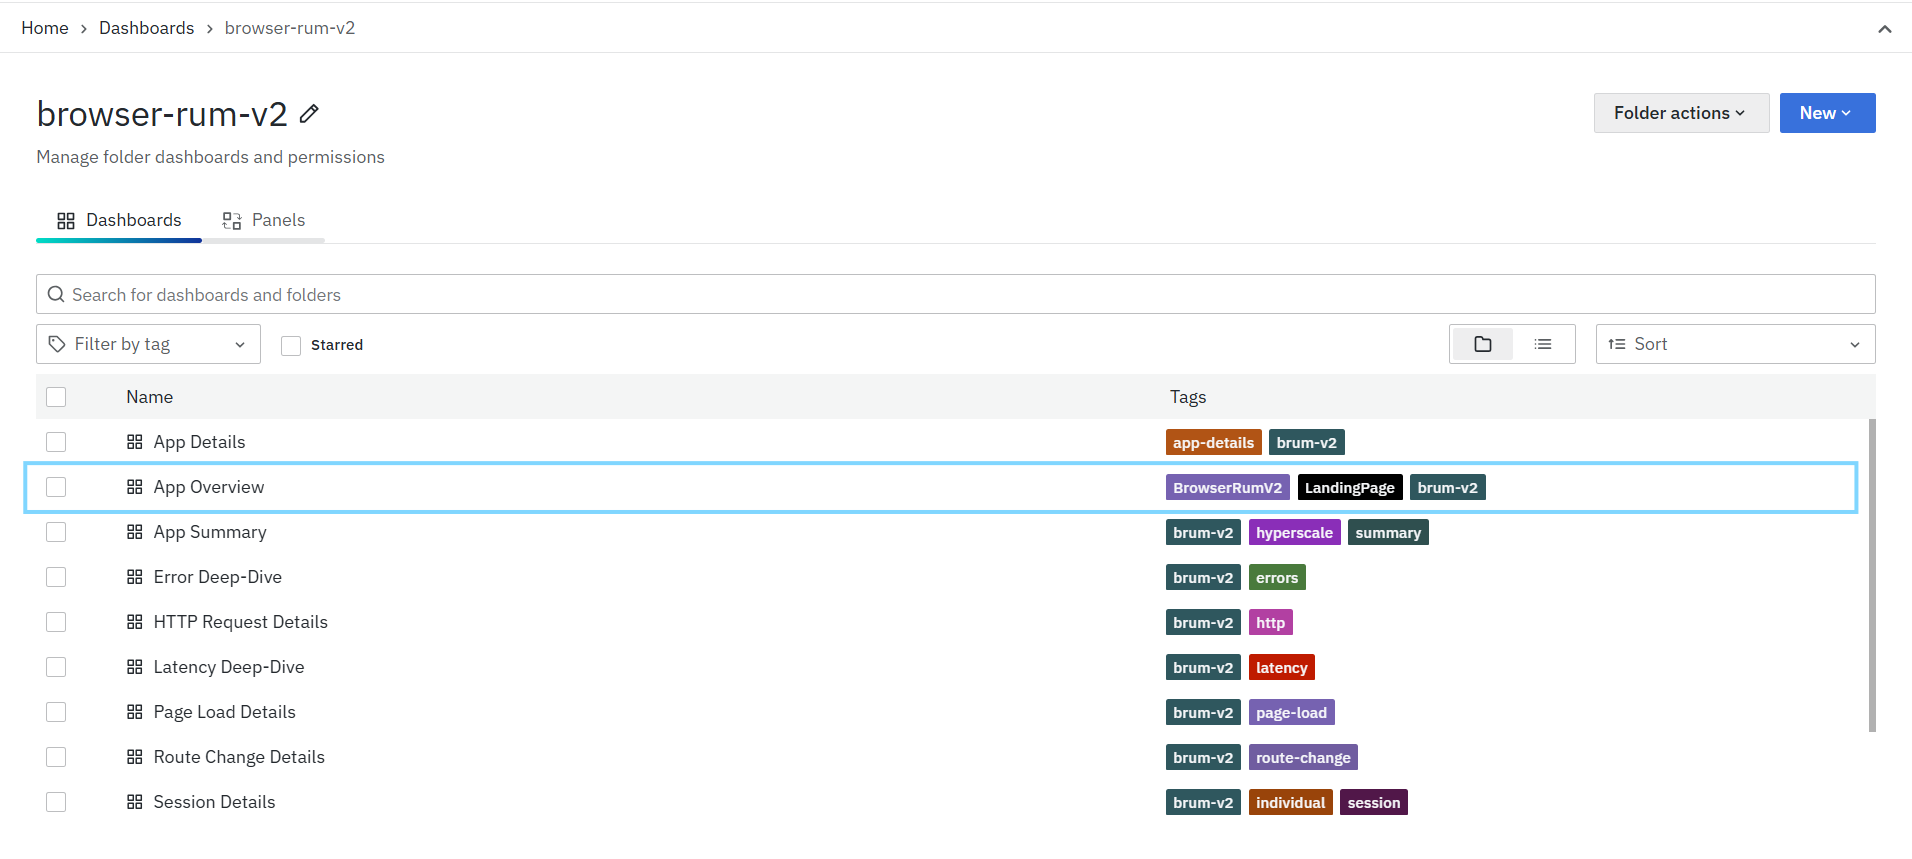
The available dashboards are:
- App Overview Dashboard: Provides a high-level summary of all monitored applications. It offers visibility into key performance indicators such as latency, throughput, error trends, and overall application health, enabling users to quickly identify applications that require further investigation.
- App Details Dashboard: Provides detailed insights into a selected application. This dashboard includes metrics related to page performance, HTTP requests, route changes, web vitals, user interactions, geographic distribution, session activity, and application performance trends.
- Latency Deep-Dive Dashboard: Enables detailed analysis of application latency and performance bottlenecks. It helps identify slow-loading pages, delayed API requests, route performance issues, and user experience degradation caused by latency-related problems.
- Throughput Deep-Dive Dashboard: Provides insights into application traffic and usage patterns. This dashboard helps analyze request volumes, page activity, route activity, user interactions, and overall application throughput trends.
- Error Deep-Dive Dashboard: Offers comprehensive visibility into application errors and failures. It helps identify JavaScript errors, failed requests, error-prone pages, and application components contributing to poor user experience.
- Session Overview Dashboard: Provides a consolidated view of user sessions across the application. It helps analyze user engagement, session trends, session health, and user activity patterns for better understanding of application usage.
- Session Details Dashboard: Offers detailed session-level analysis by capturing individual user journeys, navigation paths, interactions, performance metrics, and errors encountered during a specific user session.
- HTTP Request Details Dashboard: Provides detailed analysis of browser-generated HTTP requests, including request volume, response times, throughput, error rates, and request performance characteristics.
- Page Load Details Dashboard: Provides detailed insights into page load performance, web vitals, rendering metrics, resource loading behavior, and page-level user experience.
- Route Change Details Dashboard: Provides detailed visibility into route transition performance within single-page applications, helping identify delays and navigation-related performance issues.
- TraceMap Waterfall Dashboard: Provides an end-to-end visualization of transaction execution, displaying spans, dependencies, timing breakdowns, and service interactions to support detailed root-cause analysis and performance troubleshooting.
Dashboard Navigation Flow
The Browser RUM dashboards are designed to support a progressive investigation workflow:
App Overview → App Details
From App Details, users can navigate to:
- Latency Deep-Dive
- Throughput Deep-Dive
- Error Deep-Dive
- Session Overview
Session Overview → Session Details
Latency Deep-Dive, Error Deep-Dive, and Session Details can further drill down into:
- Trace Listing
- Trace Map
This workflow enables users to move from high-level application monitoring to detailed root-cause analysis efficiently.
App Overview Dashboard
The App Overview Dashboard provides a high-level view of all monitored browser applications. It helps users quickly compare application performance, latency, throughput, and error behavior across applications from a single page.
This dashboard is useful as the starting point for BRUM analysis. Users can identify which application is slow, has high error rate, or shows abnormal traffic trends, and then drill down into the detailed App Details dashboard for deeper investigation.
![][image11]
The dashboard includes the following section:
- App Performance Overview
App Performance Overview
The App Performance Overview panel lists all monitored applications or services with key browser performance metrics. It provides a quick comparison of latency, throughput, and error rate across applications. This panel is primarily used to identify applications that need attention before moving into detailed analysis.

It helps you identify:
-
Applications with high average latency
-
Applications with increasing or abnormal latency trends
-
Applications with high request throughput
-
Applications with failed request percentages
-
Applications with changing error trends over the selected time range
-
Applications that require drill-down analysis
The panel includes the following columns:
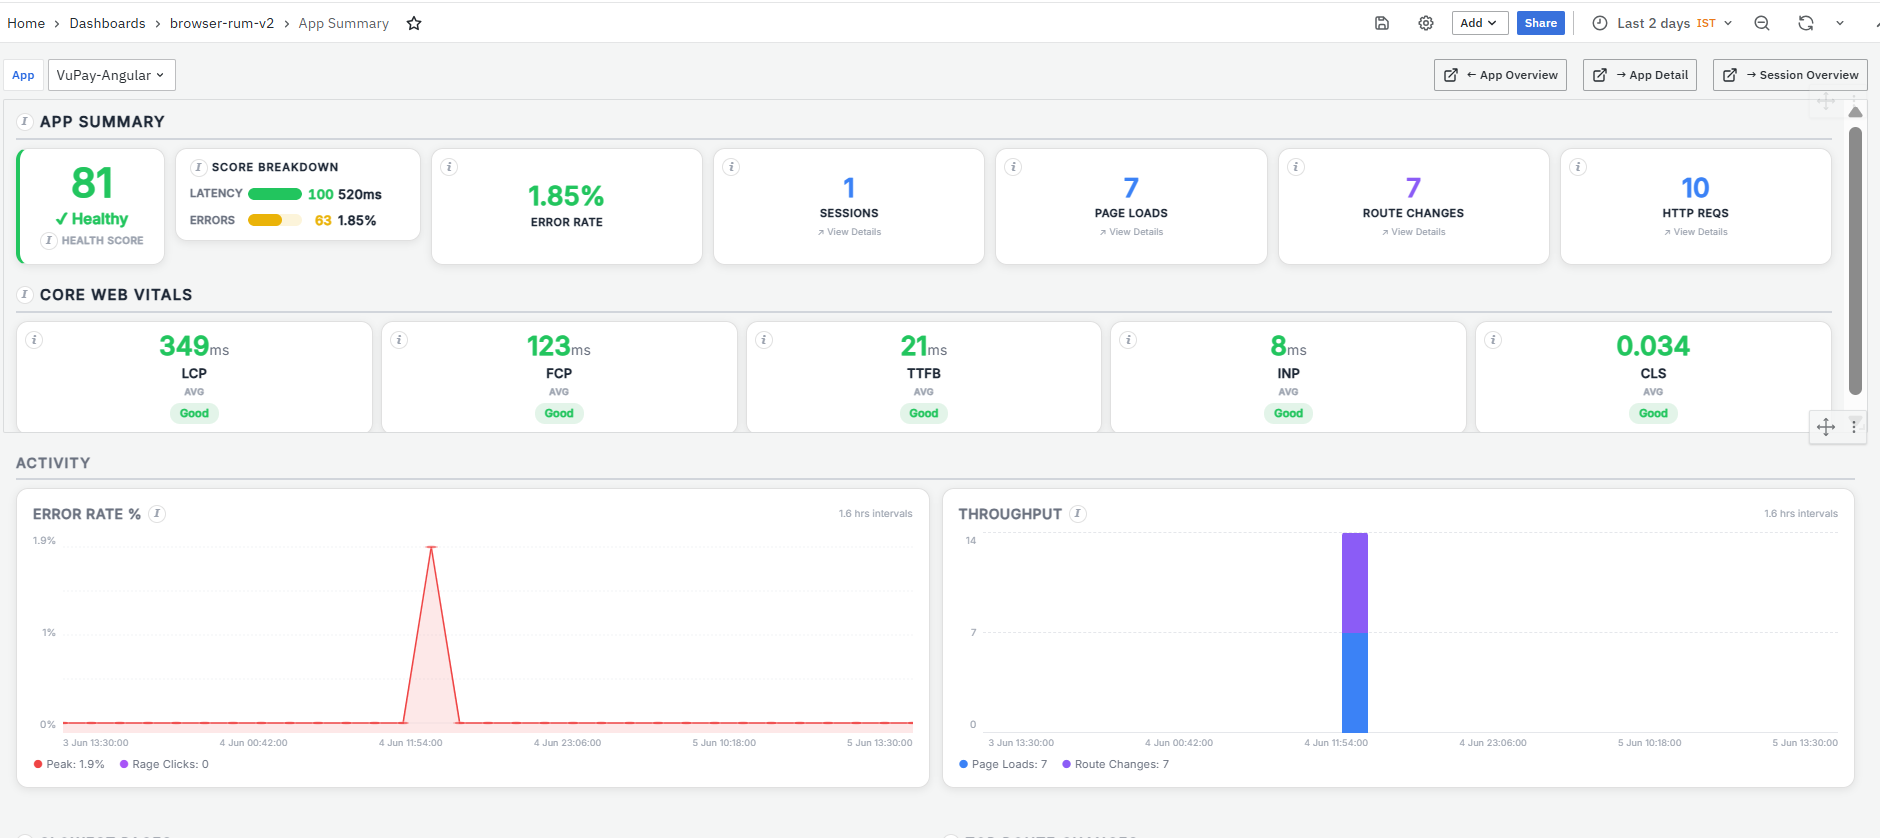
- Name: Displays the application or service name. The Name value is clickable. When clicked, it opens the App Summary dashboard for the selected application.
-
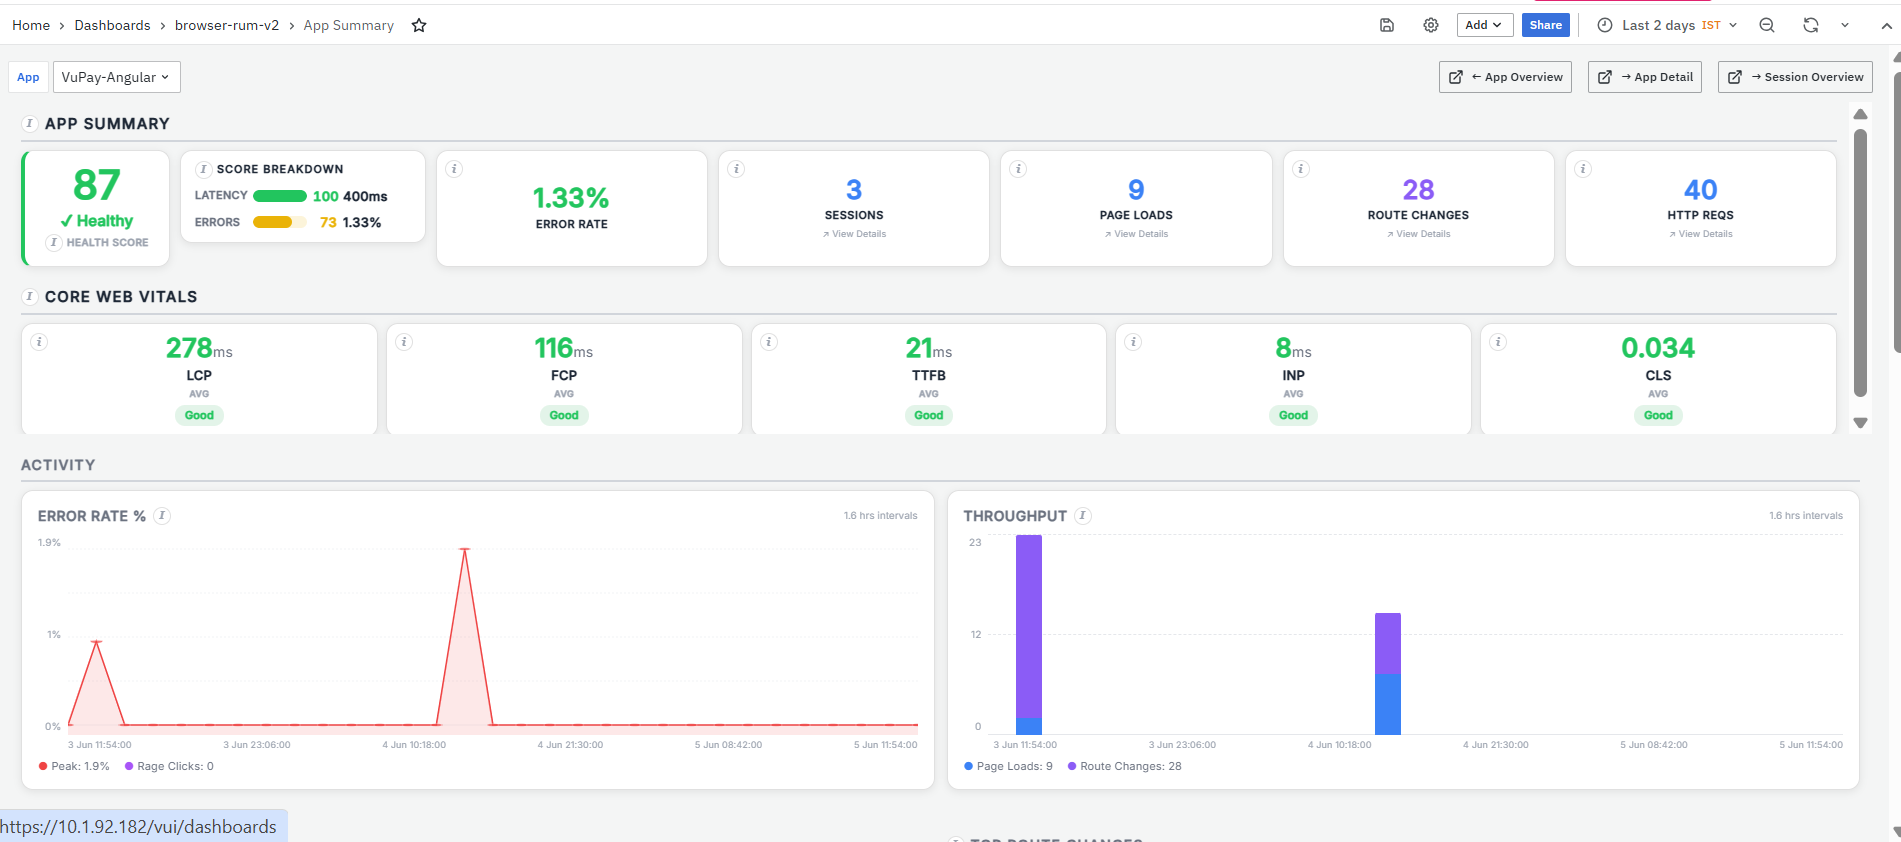
The App Summary dashboard provides a consolidated view of the selected application’s browser performance. It shows health score, error rate, sessions, page loads, route changes, HTTP requests, core web vitals, activity trends, slowest pages, top endpoints, prioritized issues, user agent details, and geography-level performance. To learn more about this page, refer to App Summary.
-
Environment: Displays the environment where the application is running, such as production.
-
Avg Latency: Displays the average latency for the application. Lower latency indicates better browser-side performance. The Avg Latency value is clickable. When clicked, it opens the Latency Deep-Dive dashboard for the selected application.

-
The Latency Deep-Dive dashboard provides a detailed view of latency across the selected application. It shows overall latency summary, latency by category, page load latency, HTTP request latency, route change latency, and user interaction latency. To learn more about this page, refer to Latency Deep-Dive.
-
Latency Trend: Displays a sparkline showing how latency changed over the selected time range.
-
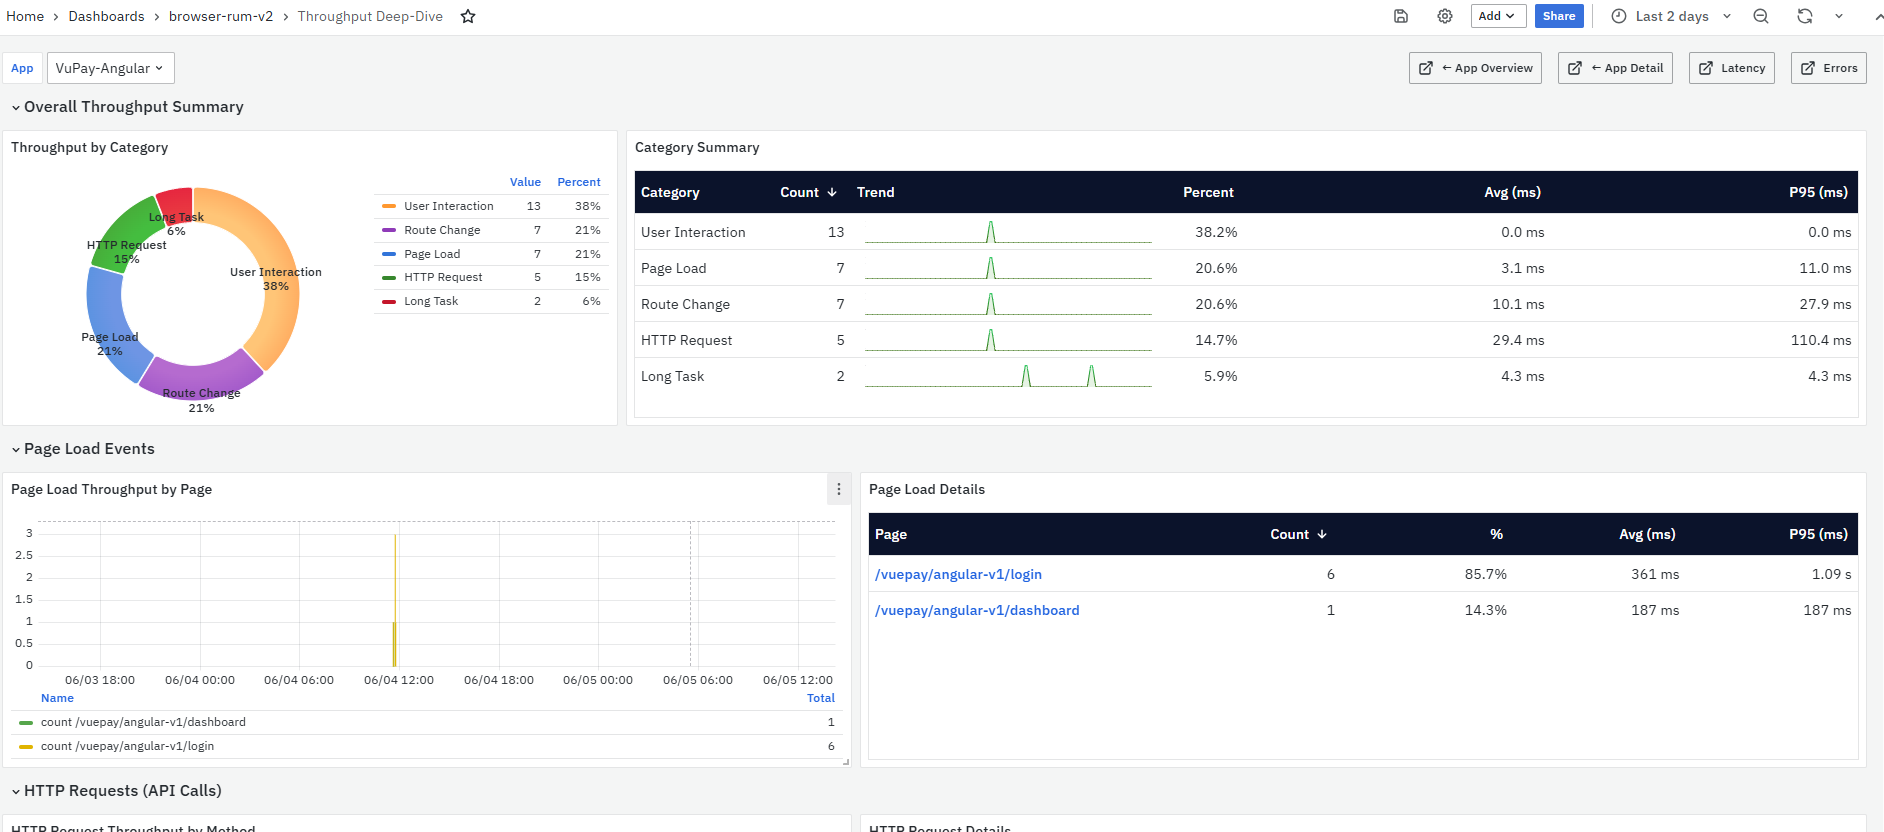
Throughput: Displays the request volume or requests per minute for the application. The Throughput value is clickable. When clicked, it opens the Throughput Deep-Dive dashboard for the selected application.
-
The Throughput Deep-Dive dashboard provides a detailed view of application traffic and activity volume. It shows throughput by category, page load events, HTTP request calls, route changes, user interactions, and long tasks. This dashboard helps users understand traffic patterns, frequently used pages or routes, and high-activity user actions. To learn more about this page, refer to Throughput Deep-Dive.
-
Error Rate: Displays the percentage of failed requests. A lower error rate indicates better application stability. The Error Rate value is clickable. When clicked, it opens the Error Deep-Dive dashboard for the selected application.

-
The Error Deep-Dive dashboard provides a detailed view of application errors across the selected application. It shows error summary by category, page load errors, HTTP request errors, route change errors, and user interaction errors. To learn more about this page, refer to Error Deep-Dive.
-
Error Trend: Displays a sparkline showing how the error rate changed over the selected time range.
App Summary Dashboard
The App Summary Dashboard is a dashboard in the Browser Real User Monitoring module. It provides a consolidated summary of the selected application’s browser-side performance, health, activity, web vitals, slow pages, top routes, HTTP endpoints, prioritized issues, user agent details, and geography-level performance.
This dashboard helps users quickly understand the overall user experience for an application. It can be used to check whether the application is healthy, whether users are facing errors, which pages or endpoints are slow, and which browsers, devices, or locations are affected.
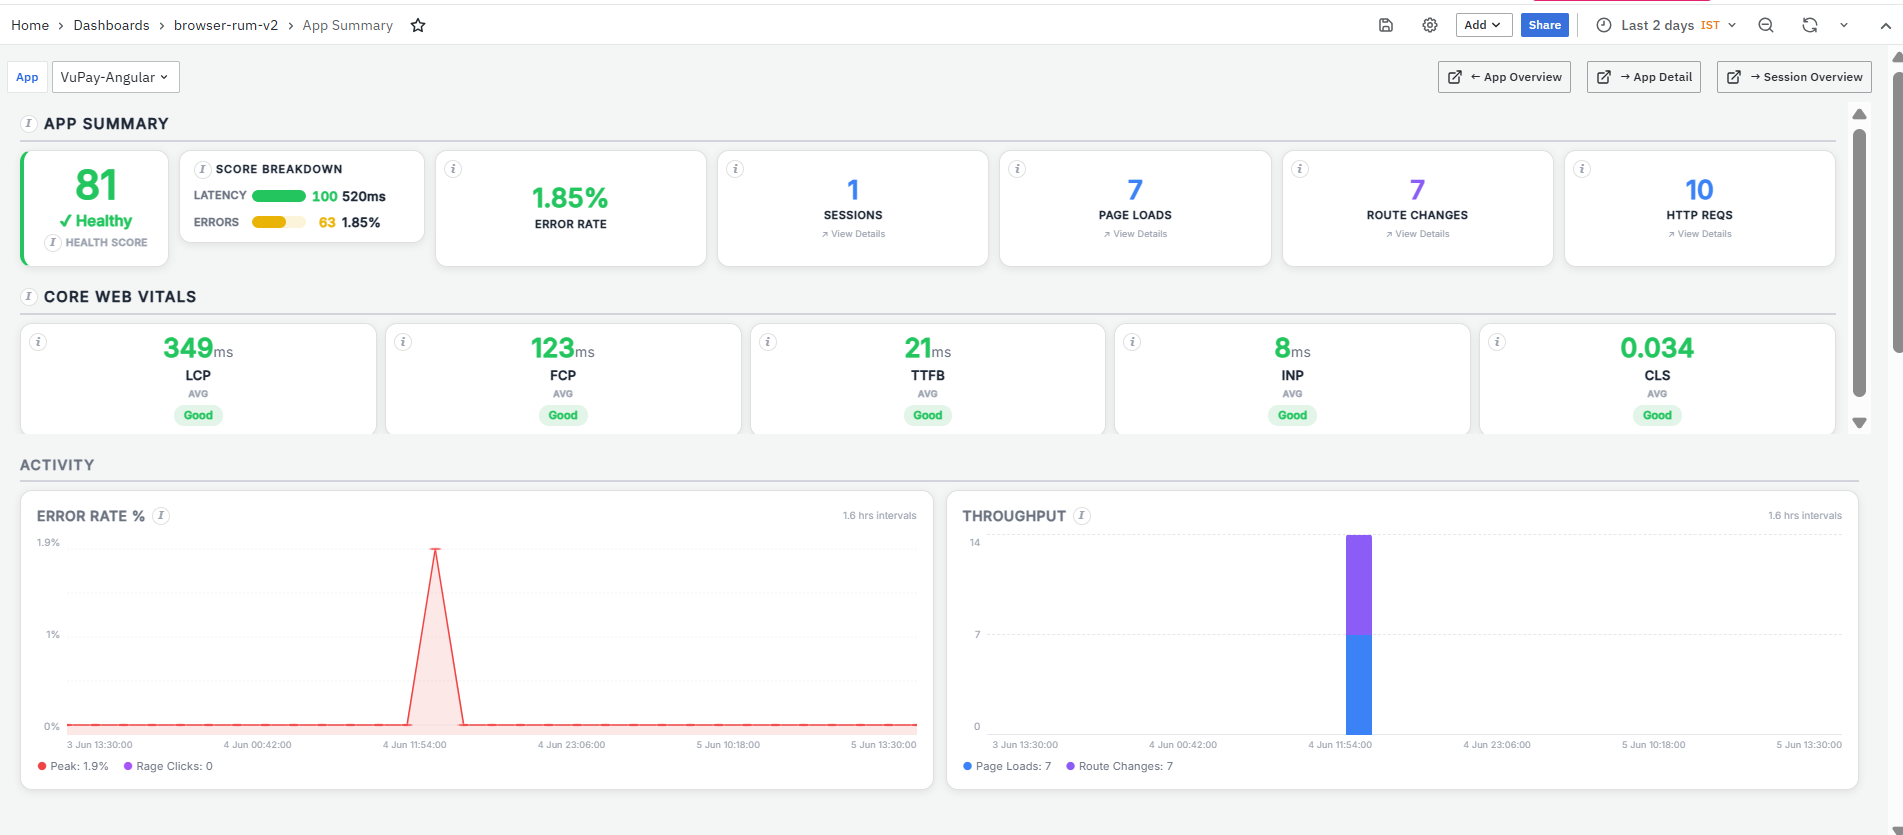
The dashboard is divided into the following sections:
- App Summary
- Core Web Vitals
- Activity
- Slowest Pages
- Top Route Changes
- Top HTTP Endpoints
- Top Issues — Prioritized
- User Agent
- Geography
Related Dashboards
The App Summary dashboard includes related dashboard links at the top-right side of the page. These links help users move from the summary view to other BRUM dashboards for deeper analysis.
The available links are:
-
App Overview - The dashboard provides a high-level view of all monitored browser applications. It helps users compare applications by environment, average latency, latency trend, throughput, error rate, and error trend. For more details refer to App Overview.
-
App Detail - The dashboard provides a detailed view of the selected application’s browser-side performance. It helps users analyze app health, impact analysis, errors, performance timeline, HTTP requests, web vitals, user segments, geography, sessions, and traces. For more details refer to App Detail
-
Session Overview - The dashboard provides a detailed view of user sessions for the selected application. It helps users analyze total sessions, sessions with errors, average duration, navigation behavior, conversion tracking, session outcomes, long tasks, errors, user segments, and session list. For more details refer to Session Overview.
App Summary
The App Summary section provides a high-level health and activity summary for the selected application. It helps users quickly check the application’s health score, latency score, error score, error rate, session count, page load count, route change count, and HTTP request count.
This section includes the following panels:
- Health Score
- Score Breakdown
- Error Rate
- Sessions
- Page Loads
- Route Changes
- HTTP Reqs
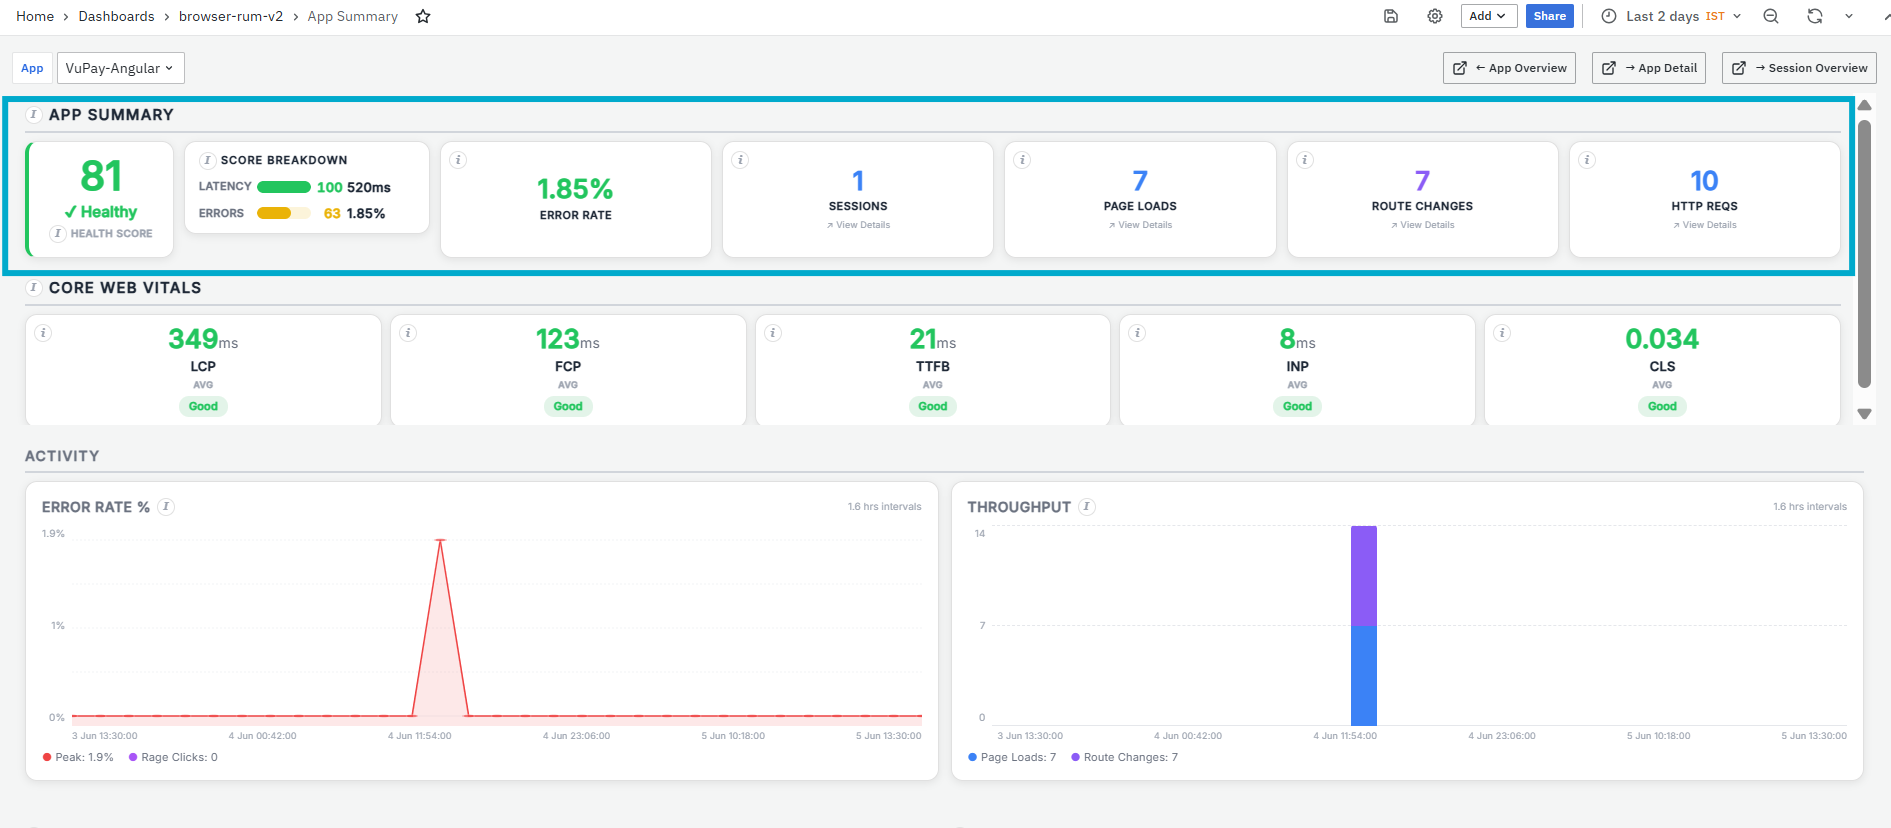
Health Score
The Health Score panel shows the overall real-user performance of the application on a scale of 0–100. The score combines latency performance and error rate, with values above 80 marked as healthy, 60–79 needing attention, and values below 60 marked as critical. The Health Score panel is clickable. When clicked, it opens the App Details dashboard.
![][image19]
- The App Details Dashboard provides a consolidated view of browser-side application performance, user experience, errors, page latency, web vitals, user segments, geographic performance, sessions, and traces. For more information refer to App Details Dashboard.
Score Breakdown
The Score Breakdown panel explains how the Health Score is calculated. It separates the score into Latency and Errors, where the latency score is based on span duration and the error score starts at 100 and loses points based on error rate. The Score Breakdown panel is clickable. When clicked, it opens the App Details dashboard.
![][image19]
- The App Details Dashboard provides a consolidated view of browser-side application performance, user experience, errors, page latency, web vitals, user segments, geographic performance, sessions, and traces. For more information refer to App Details Dashboard.
Error Rate
The Error Rate panel shows the percentage of spans or requests that ended with errors. It helps users quickly understand whether application failures are affecting the real-user experience.
Sessions
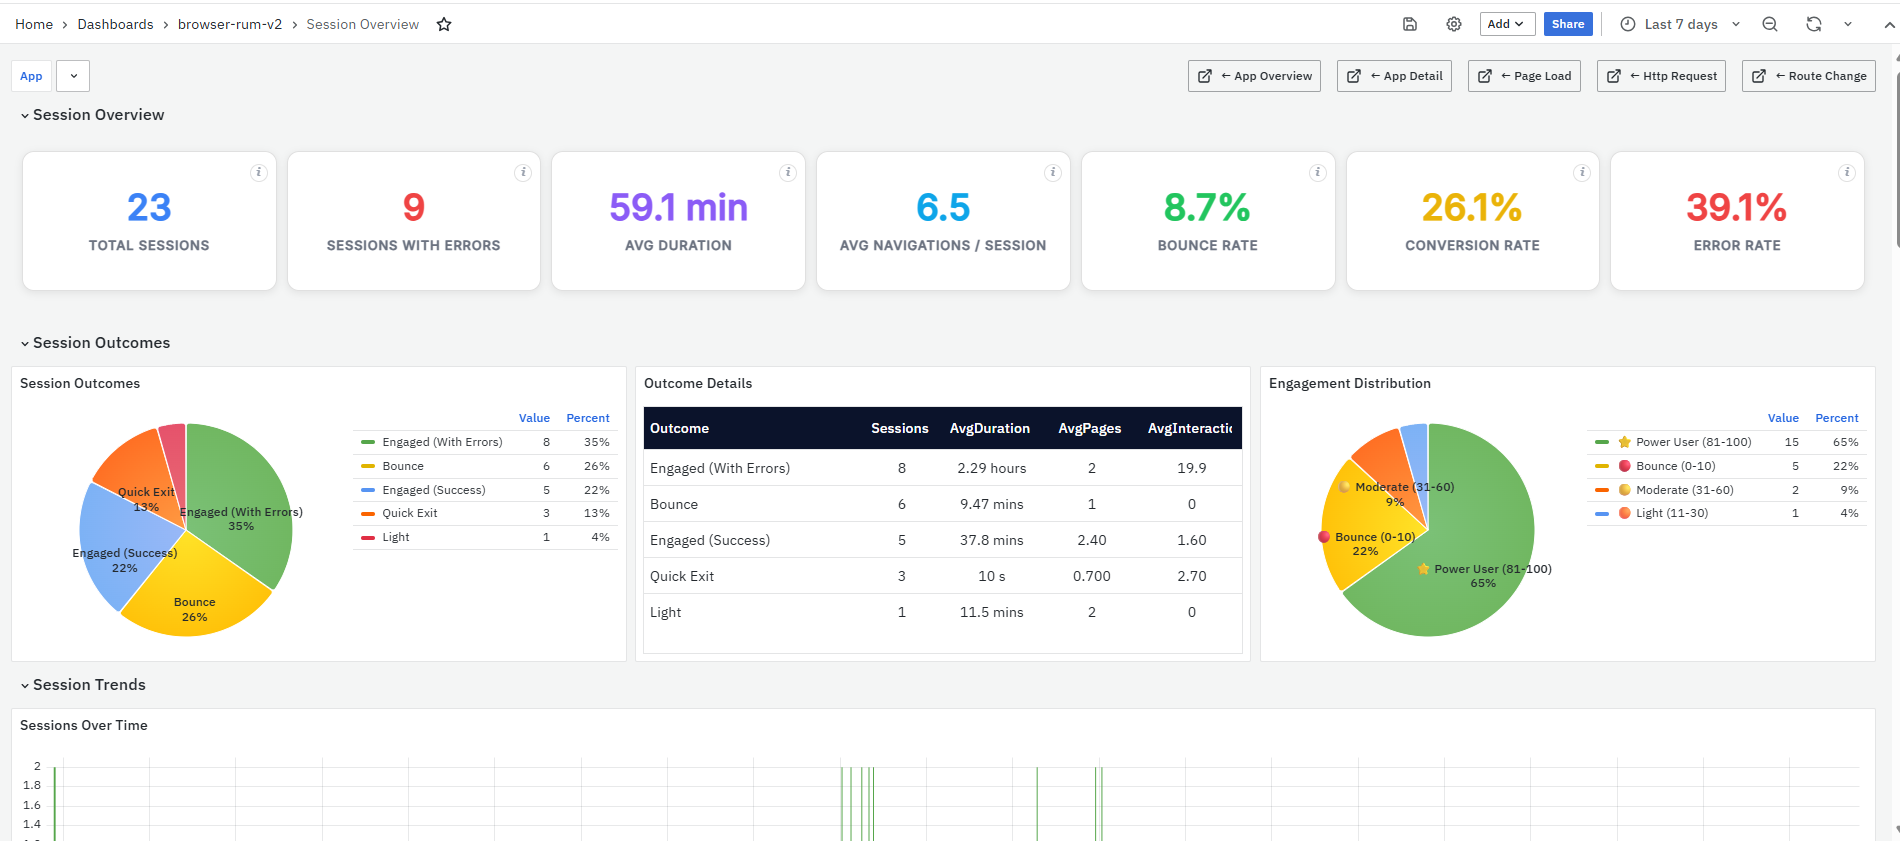
The Sessions panel shows the number of unique browser sessions captured during the selected time range. Users can click View Details to move into session-level analysis. The Session panel is clickable. When clicked, it opens the Session Overview dashboard.
The Session Overview Dashboard is a dashboard in the Browser Real User Monitoring module. It provides an application-level view of user sessions, session outcomes, engagement, conversions, journey flow, session performance, long tasks, errors, user segments, and session-level drill-down data.
Page Loads
The Page Loads panel shows the total number of full page loads captured for the application. This includes document load spans and represents browser navigation activity. The Page Load panel is clickable. When clicked, it opens the Page Load Details dashboard.
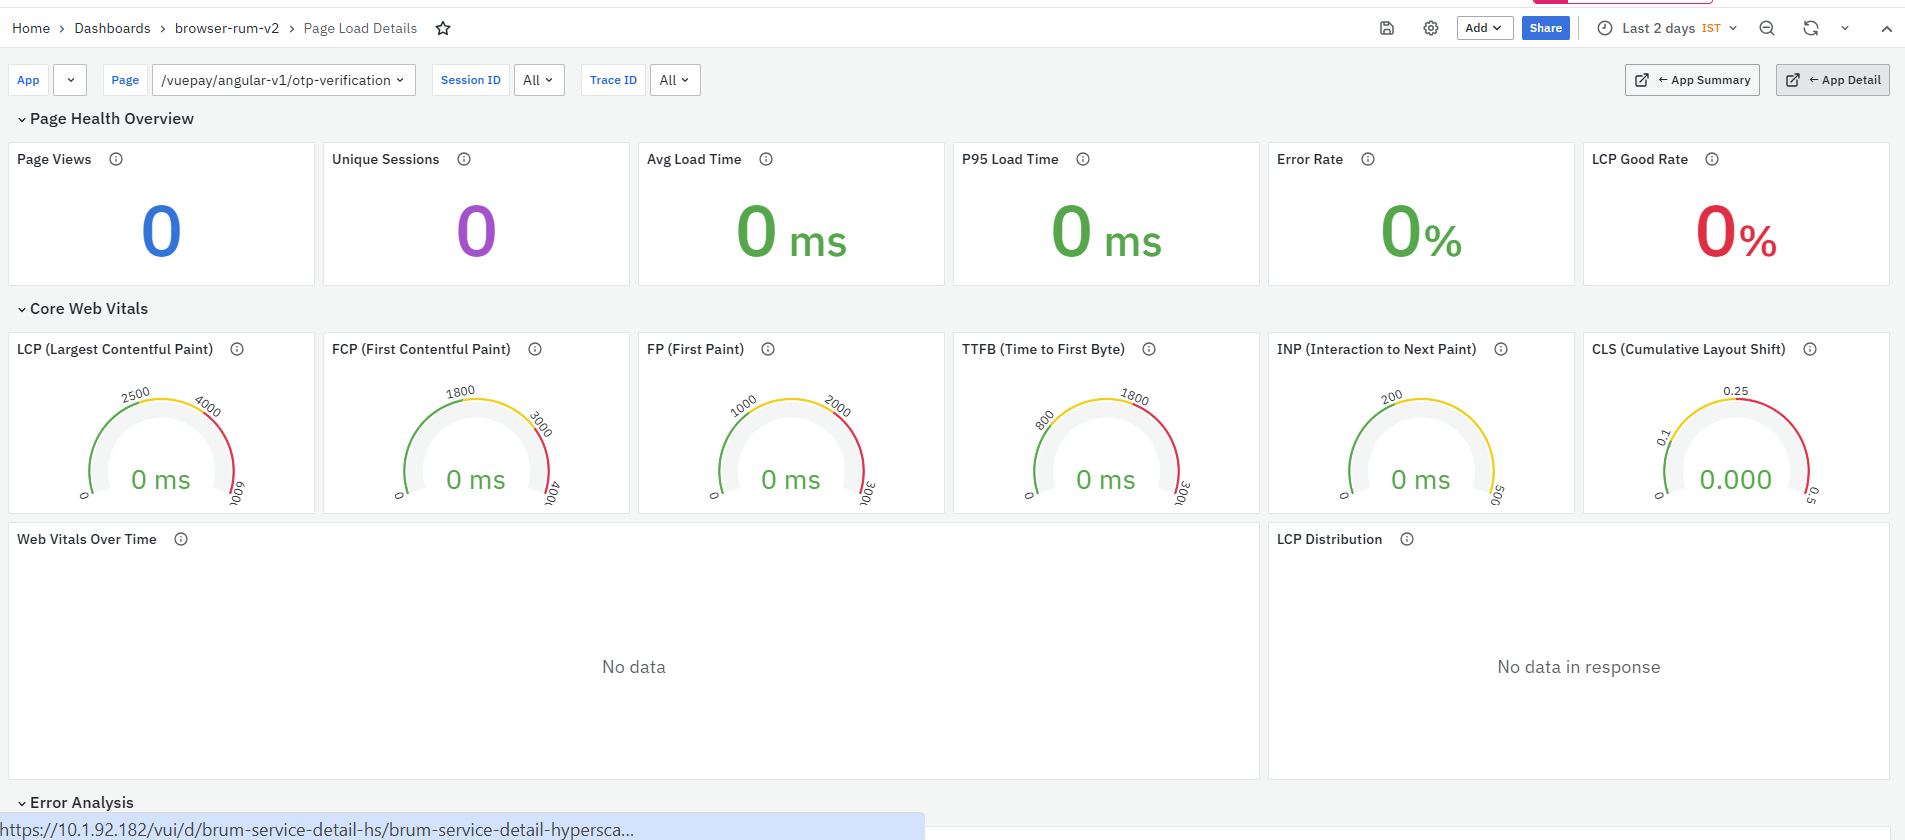
The Page Load Details dashboard provides a detailed view of the selected page’s performance. It shows page views, load time, web vitals, errors, resource loading, HTTP requests, user segments, traces, and sessions related to that page. For more details refer to Page Load Details.
Route Changes
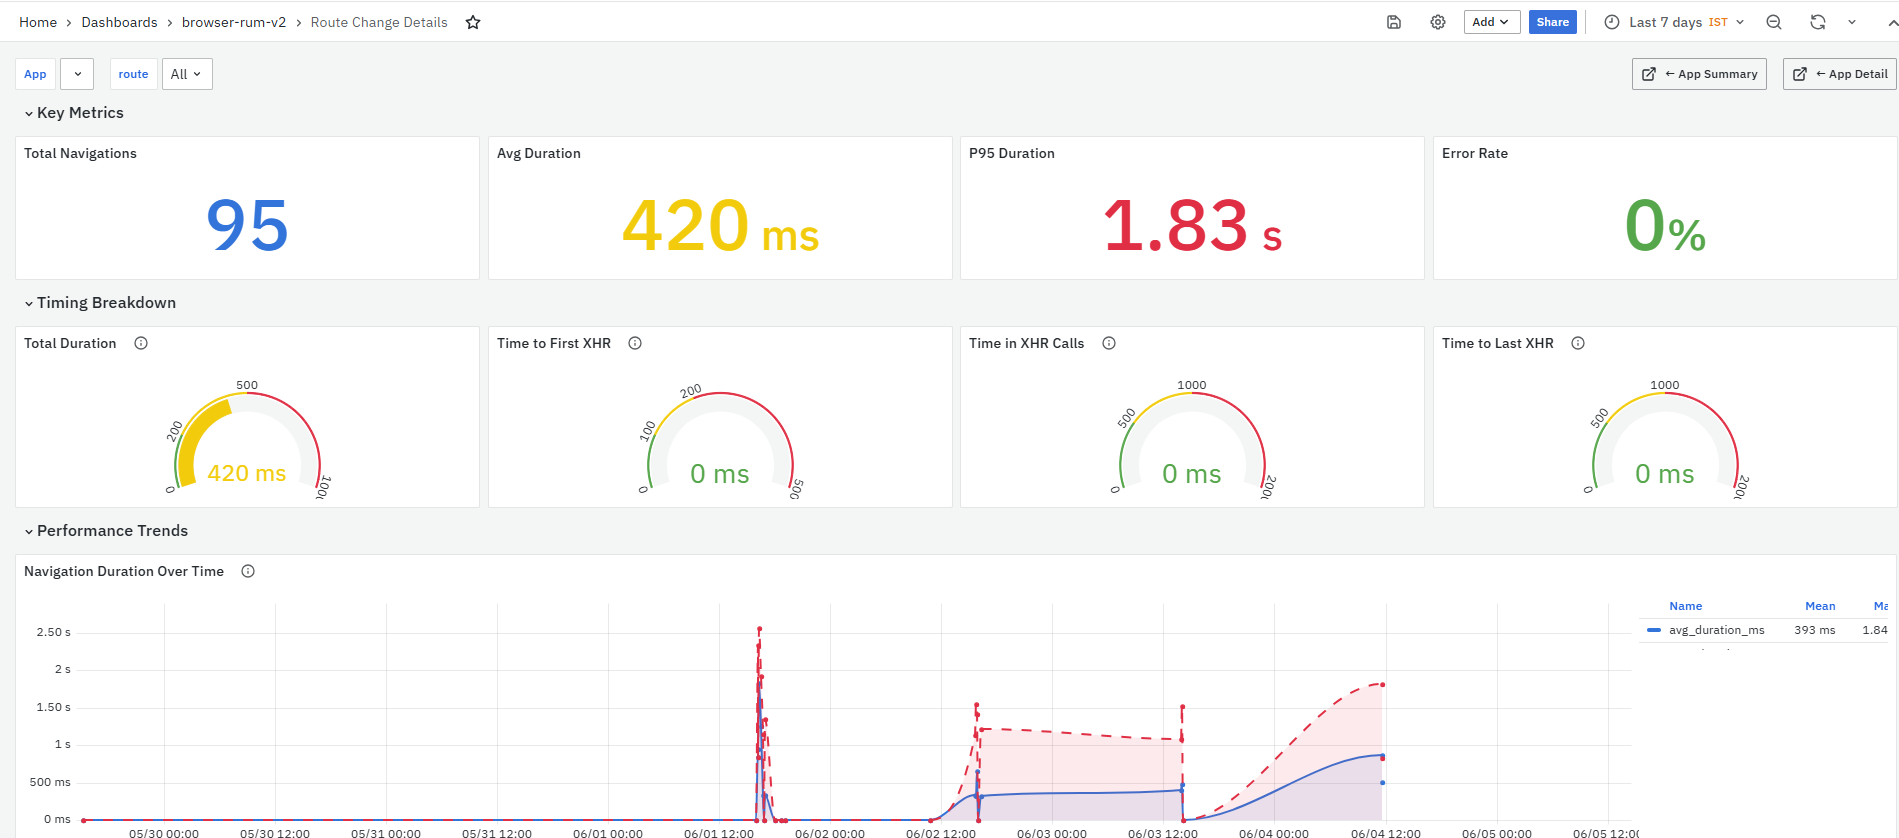
The Route Changes panel shows the number of Single Page Application route changes captured. This includes user-triggered and programmatic route changes within the application. The Route Changes panel is clickable. When clicked, it opens the Route Change Details dashboard.

The Route Change Details dashboard provides a detailed view of the selected route navigation. It shows total navigations, average duration, P95 duration, error rate, timing breakdown, navigation trend, HTTP requests, navigation flow, and user segments. For more details refer to Route Change Details.
HTTP Reqs
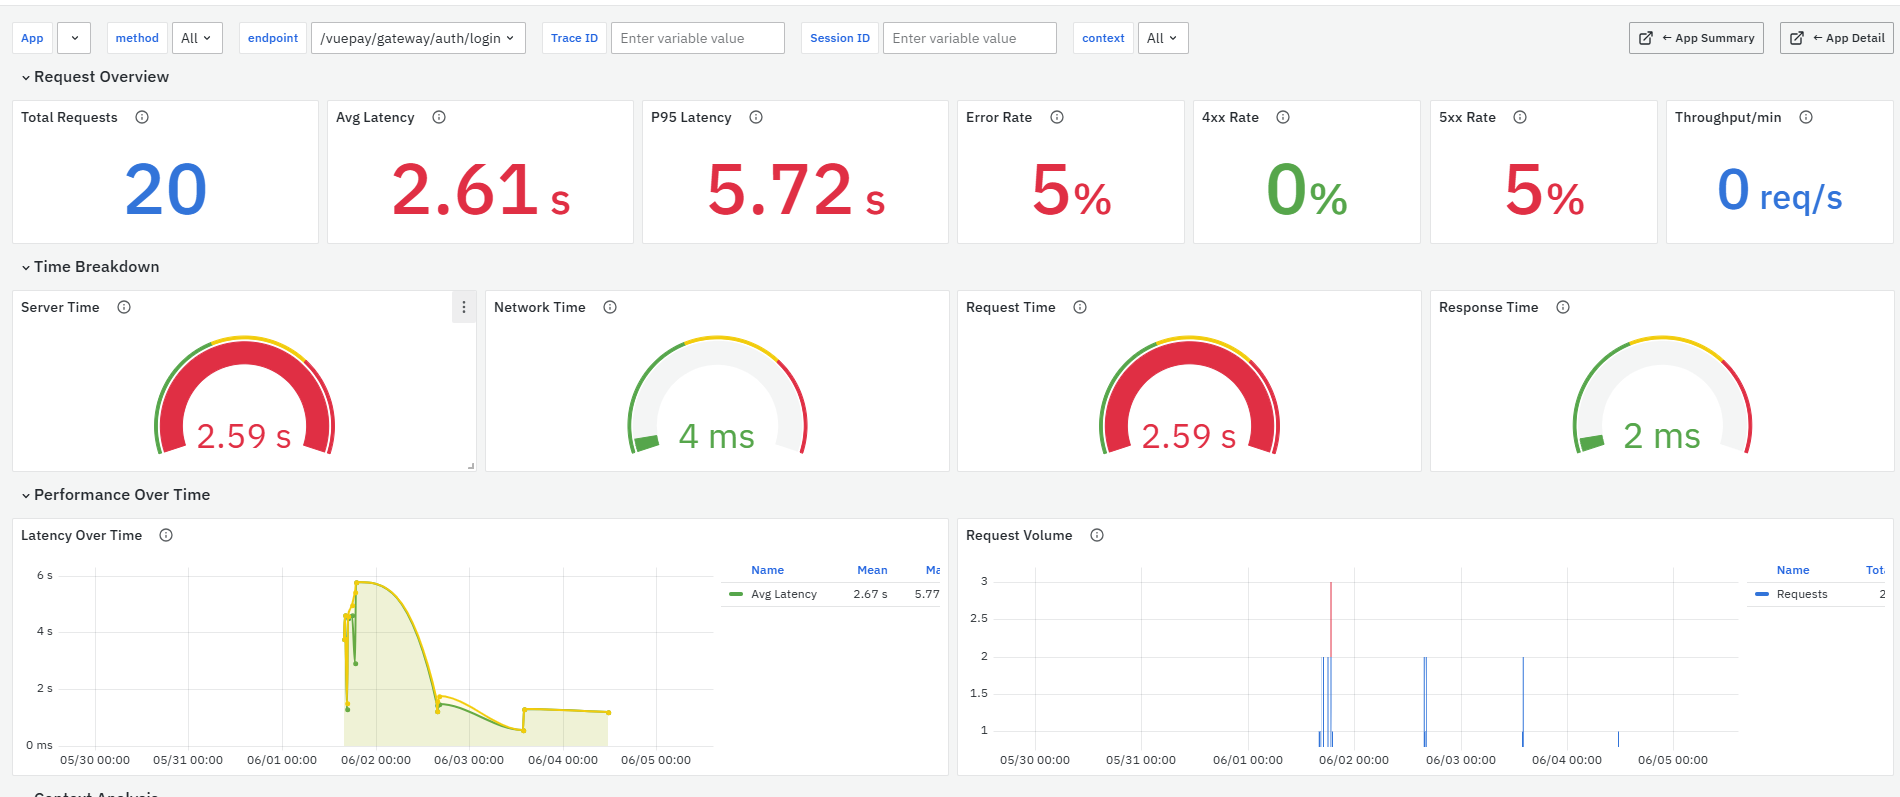
The HTTP Reqs panel shows the total number of HTTP requests captured by the SDK, such as XHR and Fetch calls. This helps users understand the API/request activity generated from the browser. The HTTP Requests panel is clickable. When clicked, it opens the HTTP Request Details dashboard for the selected application.
The HTTP Request Details dashboard provides a detailed view of the selected API endpoint. It shows total requests, average latency, P95 latency, error rate, 4xx/5xx rate, throughput, timing breakdown, error analysis, user segments, recent errors, and recent requests. For more details refer to HTTP Request Details dashboard.
Core Web Vitals
The Core Web Vitals section shows key browser experience metrics for the selected application. These metrics help users understand page loading speed, server response time, interactivity, and visual stability based on real user activity.
This section includes the following panels:
- LCP
- FCP
- TTFB
- INP
- CLS
LCP
The LCP panel shows Largest Contentful Paint, which measures the time taken to render the largest visible element on the page. It helps users understand how quickly the main page content becomes visible.
FCP
The FCP panel shows First Contentful Paint, which measures the time taken for the first text or image to appear on the page. It helps users identify whether the page starts showing content quickly after loading begins.
TTFB
The TTFB panel shows Time To First Byte, which measures server response time. It helps users identify whether backend, server, or network delays are affecting page load performance.
INP
The INP panel shows Interaction to Next Paint, which measures how quickly the page responds to user input. It helps users understand whether the application feels responsive during actions such as clicks, taps, or typing.
CLS
The CLS panel shows Cumulative Layout Shift, which measures visual stability. It helps users identify whether page elements move unexpectedly during loading or usage, which can affect the user experience.
Activity
The Activity section displays how error rate and traffic volume change over the selected time range. This section helps users understand whether the application had error spikes, traffic spikes, or unusual activity patterns during a specific period.

This section includes two panels:
- Error Rate %
- Throughput
Error Rate %
The Error Rate % panel shows the span-level error rate over time. Errors include HTTP 4xx/5xx status codes, JavaScript exceptions, and severity ≥17 events. Each point or bar represents one time bucket.
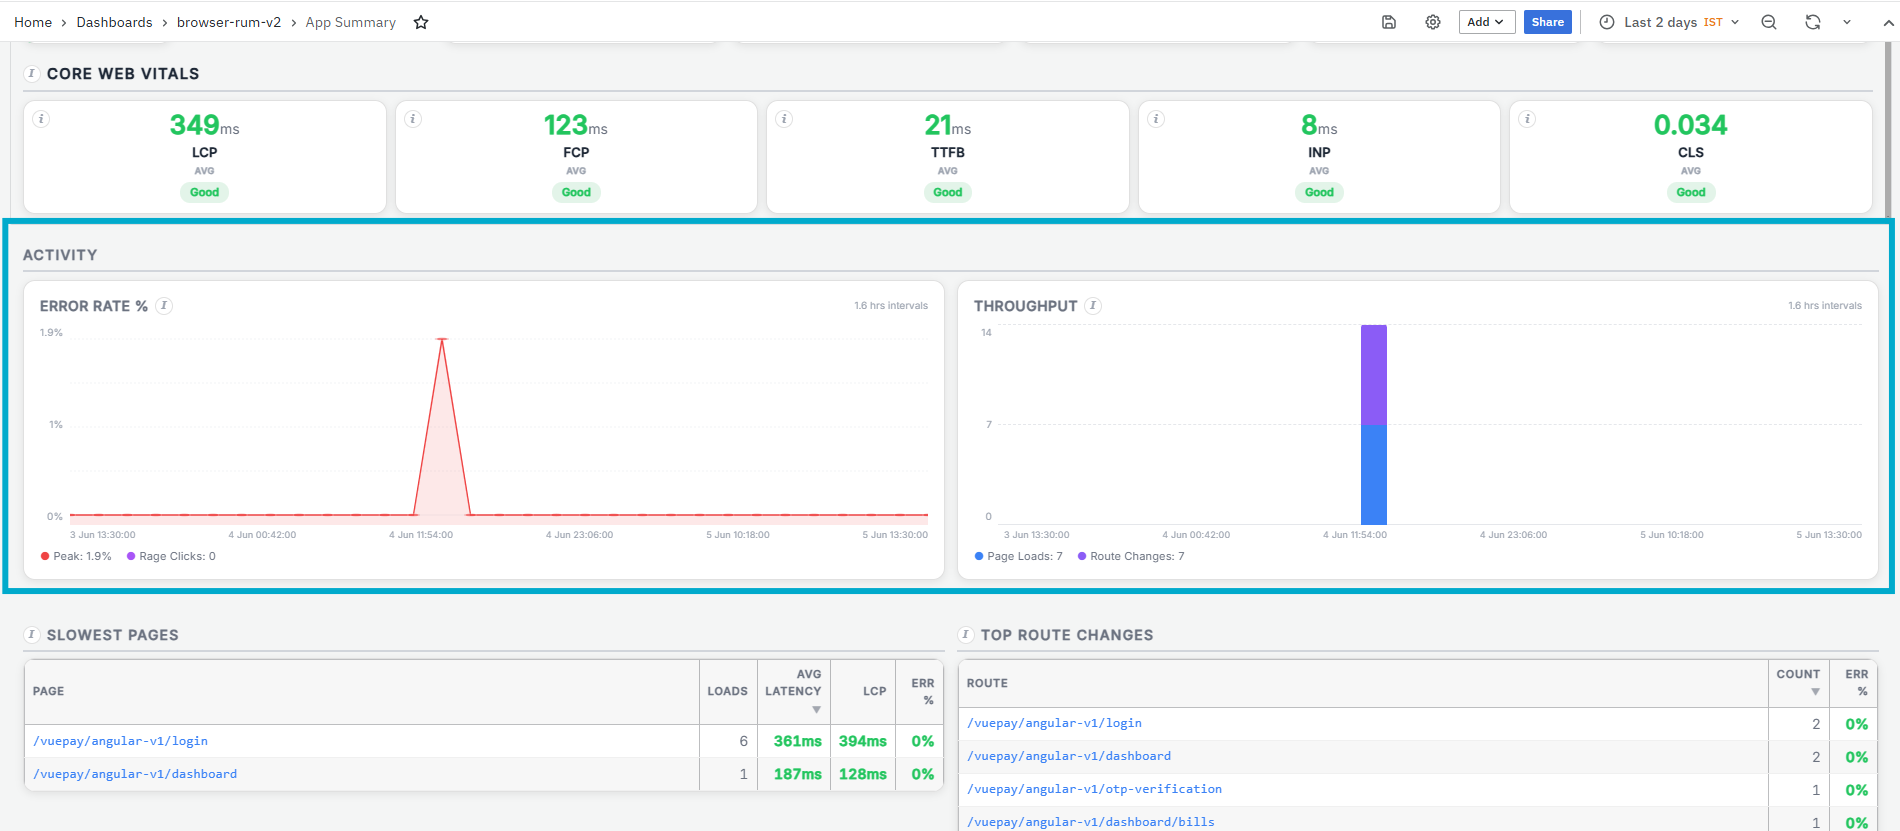
It helps you identify:
-
Periods where the application error rate increased
-
Error spikes affecting real-user experience
-
Whether errors are isolated to a short period or repeated over time
-
Time windows that need deeper error investigation
Throughput
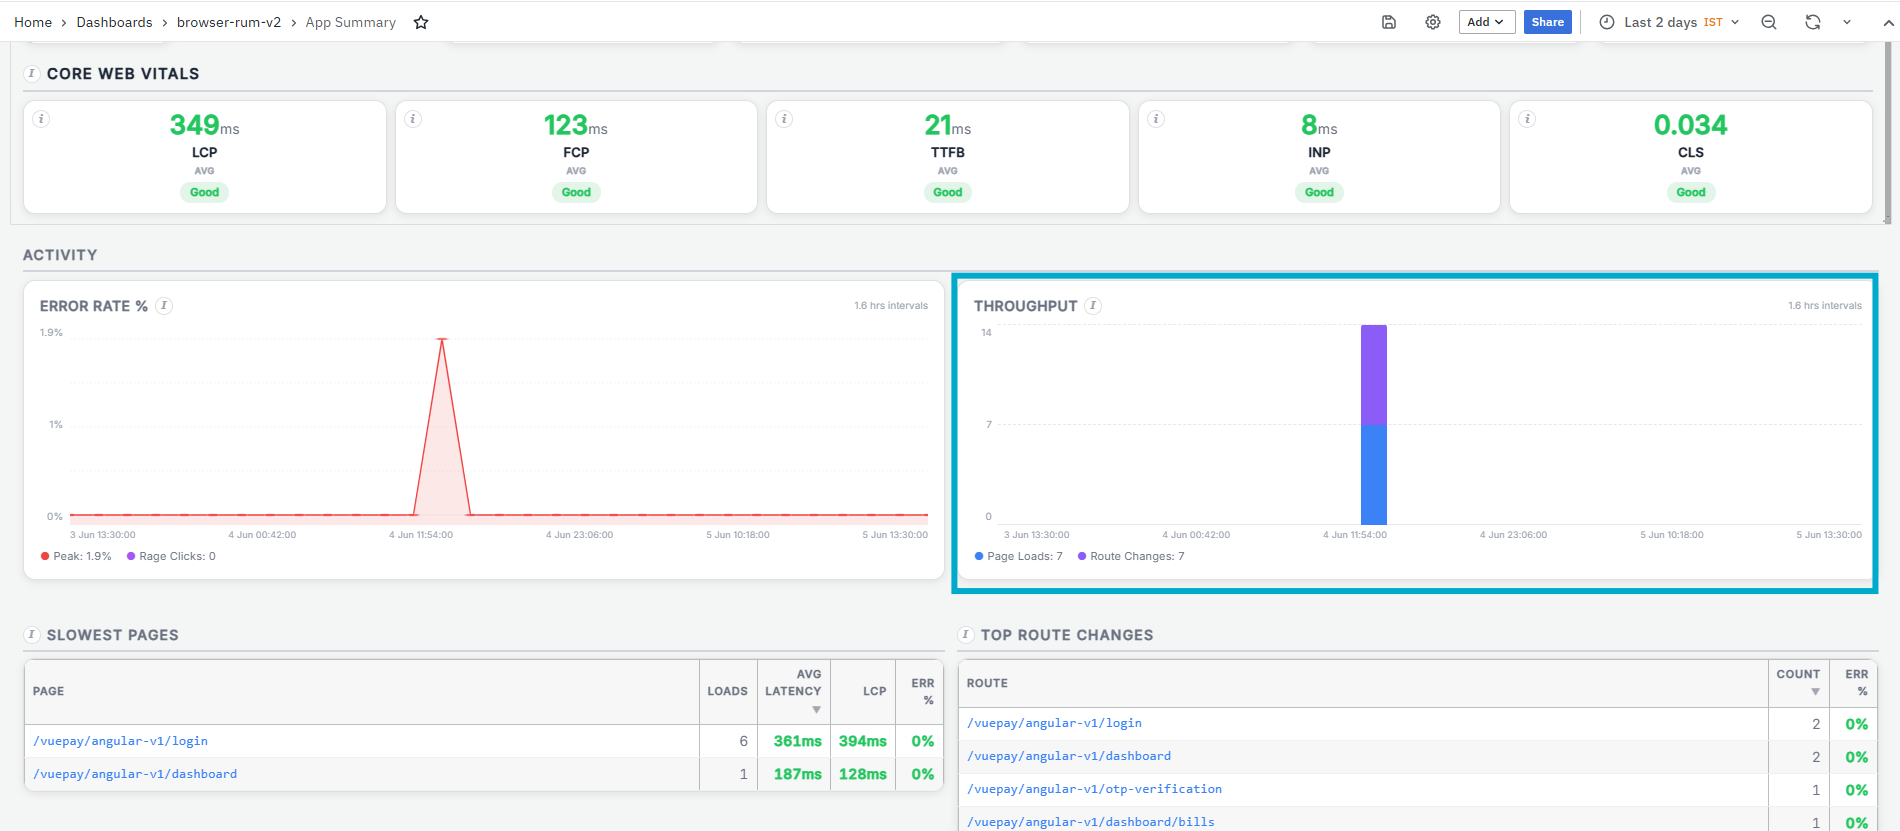
The Throughput panel shows application activity volume over time using a stacked bar chart. It displays page loads and SPA route changes per time bucket, while HTTP requests are tracked separately in the KPI above.

It helps you identify:
- High-traffic periods for the selected application
- Spikes in page loads or route changes
- Whether user activity increased during a specific time range
- Traffic patterns that can be compared with error or latency behavior
Slowest Pages
The Slowest Pages section displays the top pages ranked by average load time. This section helps users identify which pages are taking longer to load and may require performance optimization.
This section includes two panels:
- Slowest Pages
- Top Route Changes
Slowest Pages
The Slowest Pages panel lists the top pages based on average load time. It shows page-level metrics such as load count, average latency, LCP, and error percentage. This panel is primarily used to identify slow pages that may be affecting the real-user experience.
It helps you identify:
- Pages with high average load time
- Pages with high LCP value
- Pages with errors
- Pages that should be reviewed for frontend or backend optimization
- Pages that users are accessing frequently
The panel includes the following columns:
- Page: Displays the page URL or route. The Page value is clickable. When clicked, it opens the Page Load Details dashboard for the selected page.
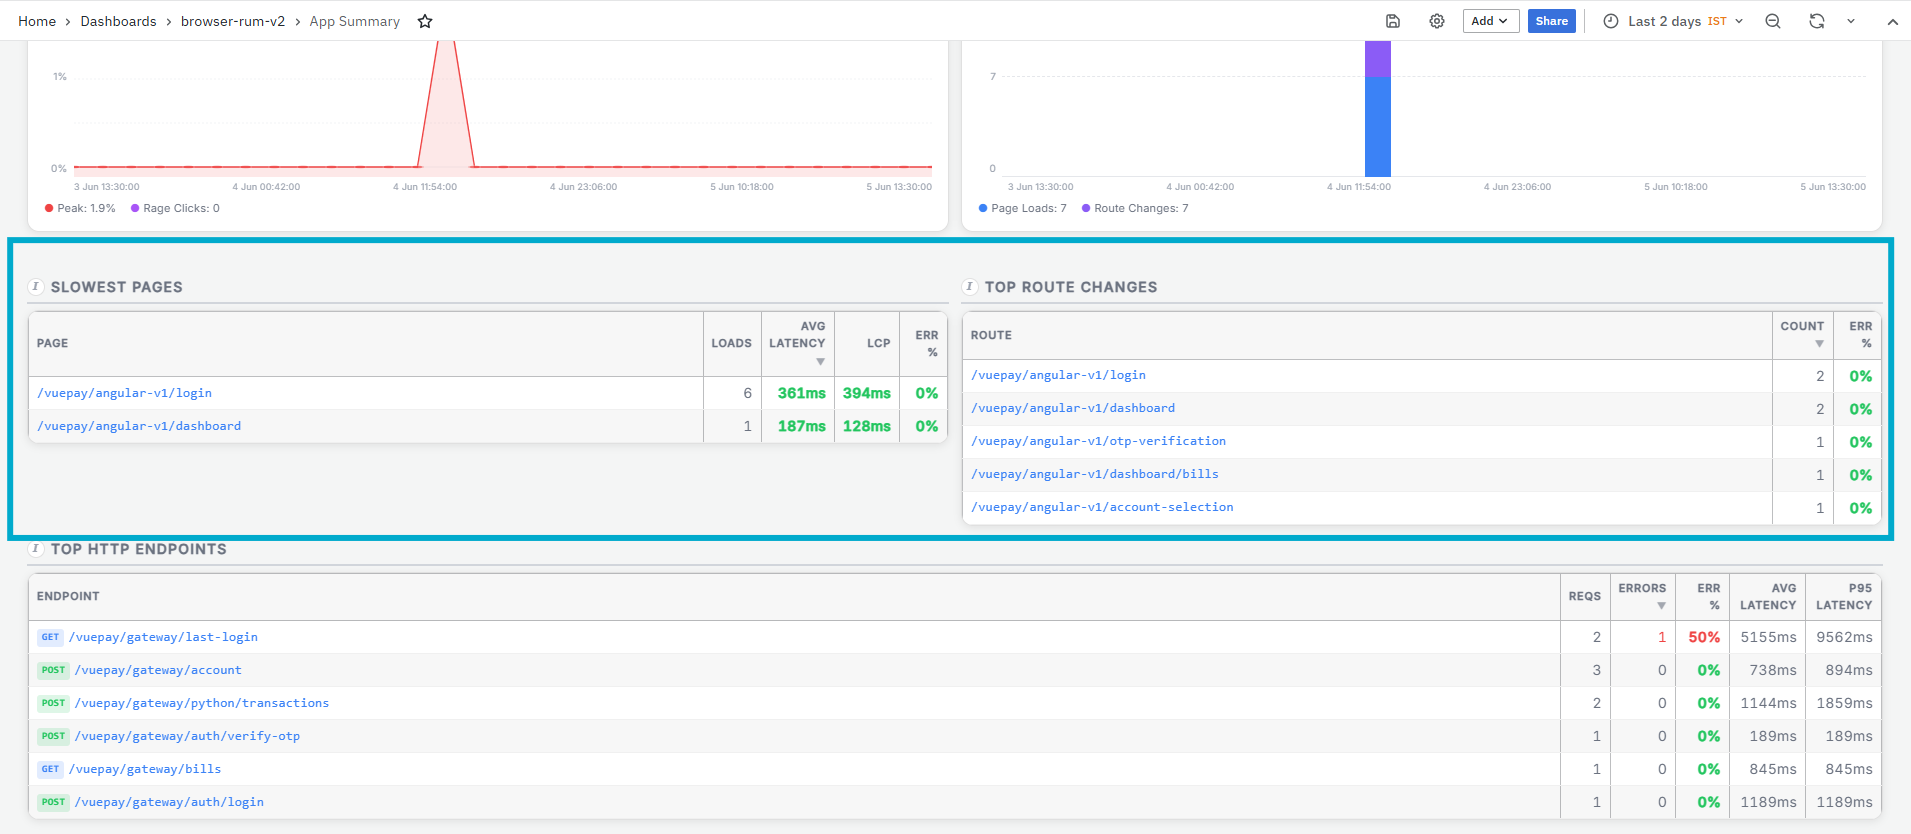
- The Page Load Details dashboard provides a detailed view of the selected page’s performance. It shows page views, load time, web vitals, errors, resource loading, HTTP requests, user segments, traces, and sessions related to that page. For more details refer to Page Load Details.
- Loads: Displays the number of times the page was loaded.
- Avg Latency: Displays the average load time for the page.
- LCP: Displays the Largest Contentful Paint value for the page. This indicates how long the main visible content took to load.
- Err%: Displays the error percentage for the page.
Top Route Changes
The Top Route Changes panel displays the top SPA route changes by occurrence count. A route change is captured when users navigate between pages or views in a Single Page Application without a full page reload. This panel is primarily used to understand which routes are accessed most frequently and whether any route has errors.
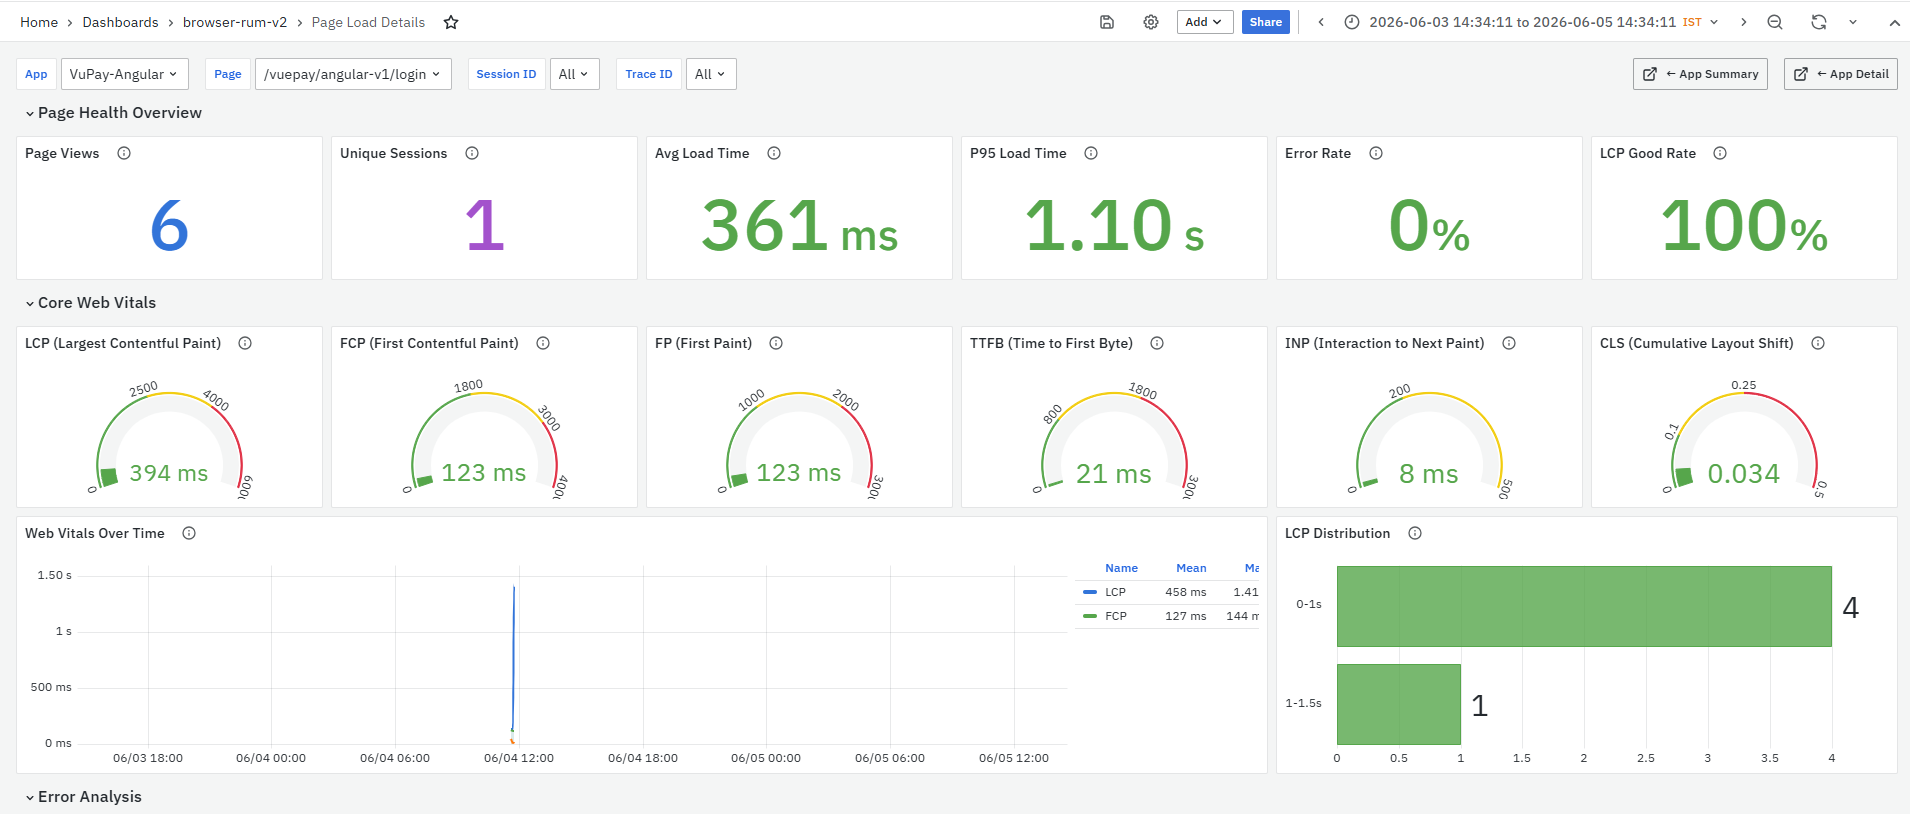
It helps you identify:
- Most frequently accessed SPA routes
- Routes with high navigation count
- Routes with error percentage
- Routes that may require deeper route-level analysis
The panel includes the following columns:
- Route: Displays the SPA route path. The Route value is clickable. When clicked, it opens the Route Change Details dashboard for the selected route.
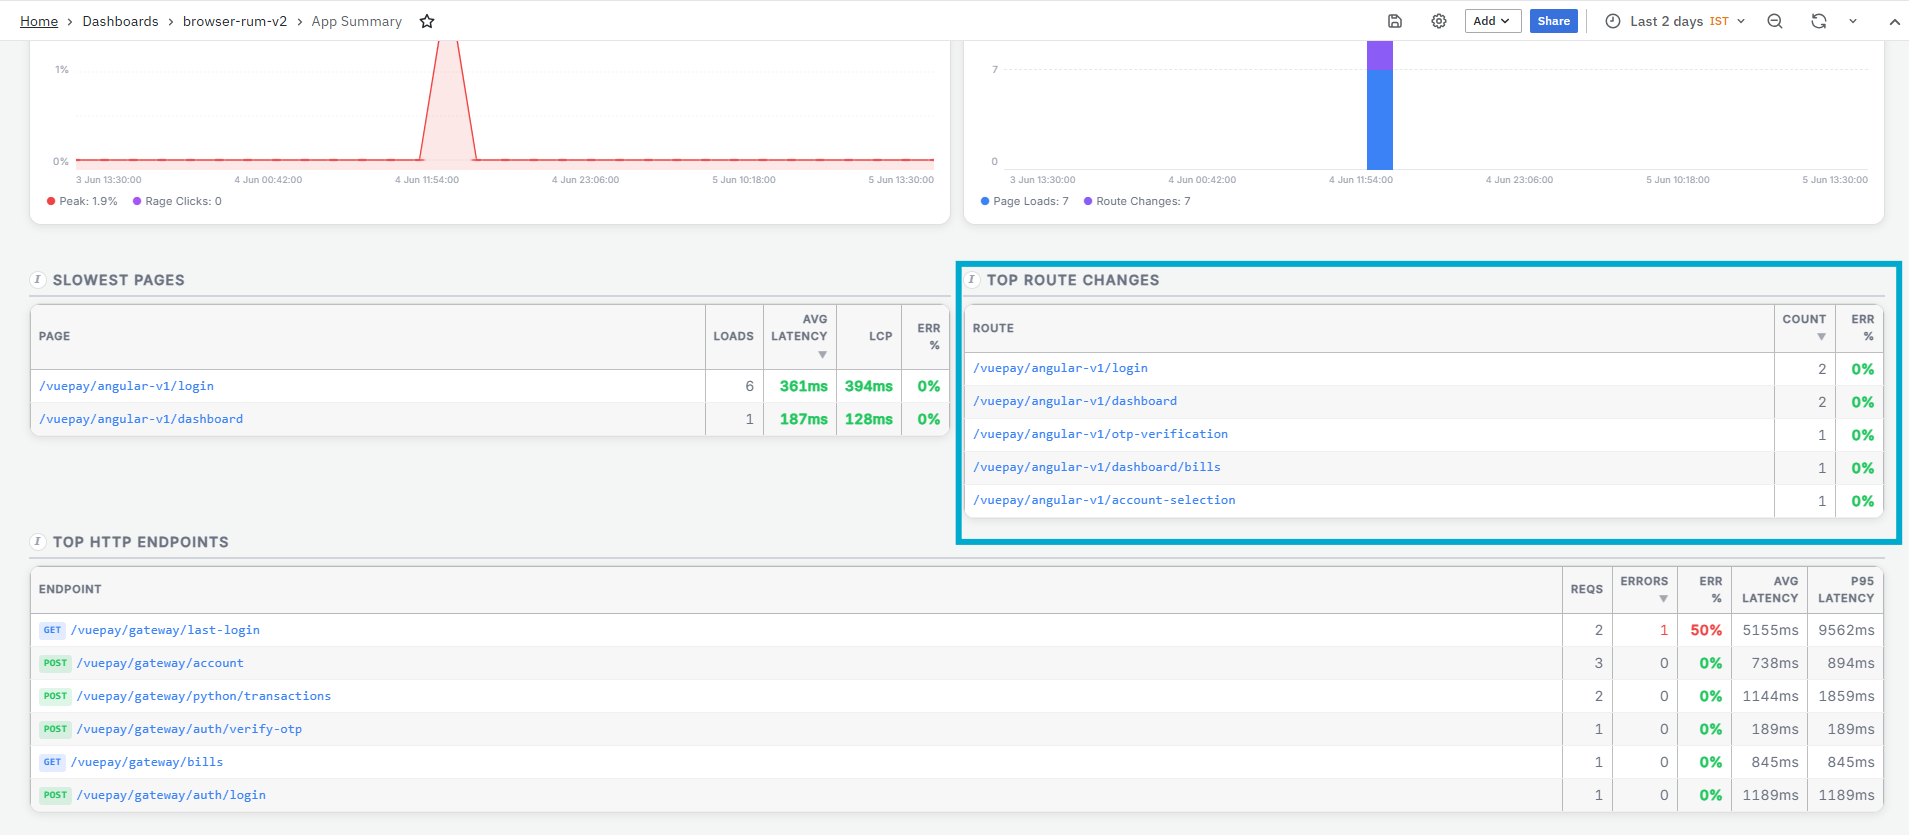
- The Route Change Details dashboard provides a detailed view of the selected route navigation. It shows total navigations, average duration, P95 duration, error rate, timing breakdown, navigation trend, HTTP requests, navigation flow, and user segments. For more details refer to Route Change Details.
- Count: Displays the number of times the route change occurred.
- Err%: Displays the error percentage for the route.
Top HTTP Endpoints
The Top HTTP Endpoints panel lists the top HTTP endpoints sorted by request and error activity. It shows request count, error count, error rate, average latency, and P95 latency for each endpoint. This panel is primarily used to identify high-traffic, slow, or error-prone API endpoints.

It helps you identify:
- Endpoints with high request volume
- Endpoints with high error count
- Endpoints with high error percentage
- Endpoints with high average latency
- Endpoints with high P95 latency
- APIs that need deeper investigation
The panel includes the following columns:
- Endpoint: Displays the HTTP endpoint. The Endpoint value is clickable. When clicked, it opens the HTTP Request Details dashboard for the selected endpoint.

- The HTTP Request Details dashboard provides a detailed view of the selected API endpoint. It shows total requests, average latency, P95 latency, error rate, 4xx/5xx rate, throughput, timing breakdown, error analysis, user segments, recent errors, and recent requests.
- Reqs: Displays the total number of requests made to the endpoint.
- Errors: Displays the number of failed requests for the endpoint.
- Err%: Displays the percentage of requests that resulted in errors.
- Avg Latency: Displays the average response time for the endpoint.
- P95 Latency: Displays the 95th percentile latency for the endpoint. This helps identify slower responses experienced by some users.
Top Issues — Prioritized
The Top Issues — Prioritized panel displays the top issues ranked by impact score. The impact score is calculated based on the number of affected users and the severity weight of the issue. Issue categories can include HTTP errors, slow pages, JavaScript exceptions, and rage clicks. For example, HTTP errors such as 4xx or 5xx responses are treated as high-severity issues, while slow pages and rage clicks are also considered based on their impact on user experience.
 It helps you identify:
- Issues affecting the highest number of users
- High-severity HTTP errors
- Slow pages that may degrade user experience
- User frustration signals such as rage clicks
- Issues that should be prioritized first for troubleshooting
The panel includes the following columns:
- Category: Displays the issue category, such as HTTP Error or Slow Page.
- Issue: Displays the affected endpoint, page, or user action where the issue occurred.
- Users: Displays the number of users affected by the issue.
- Count: Displays the number of times the issue occurred.
- Impact: Displays the calculated impact score using a visual bar. A higher impact value indicates that the issue should be reviewed with higher priority.
User Agent
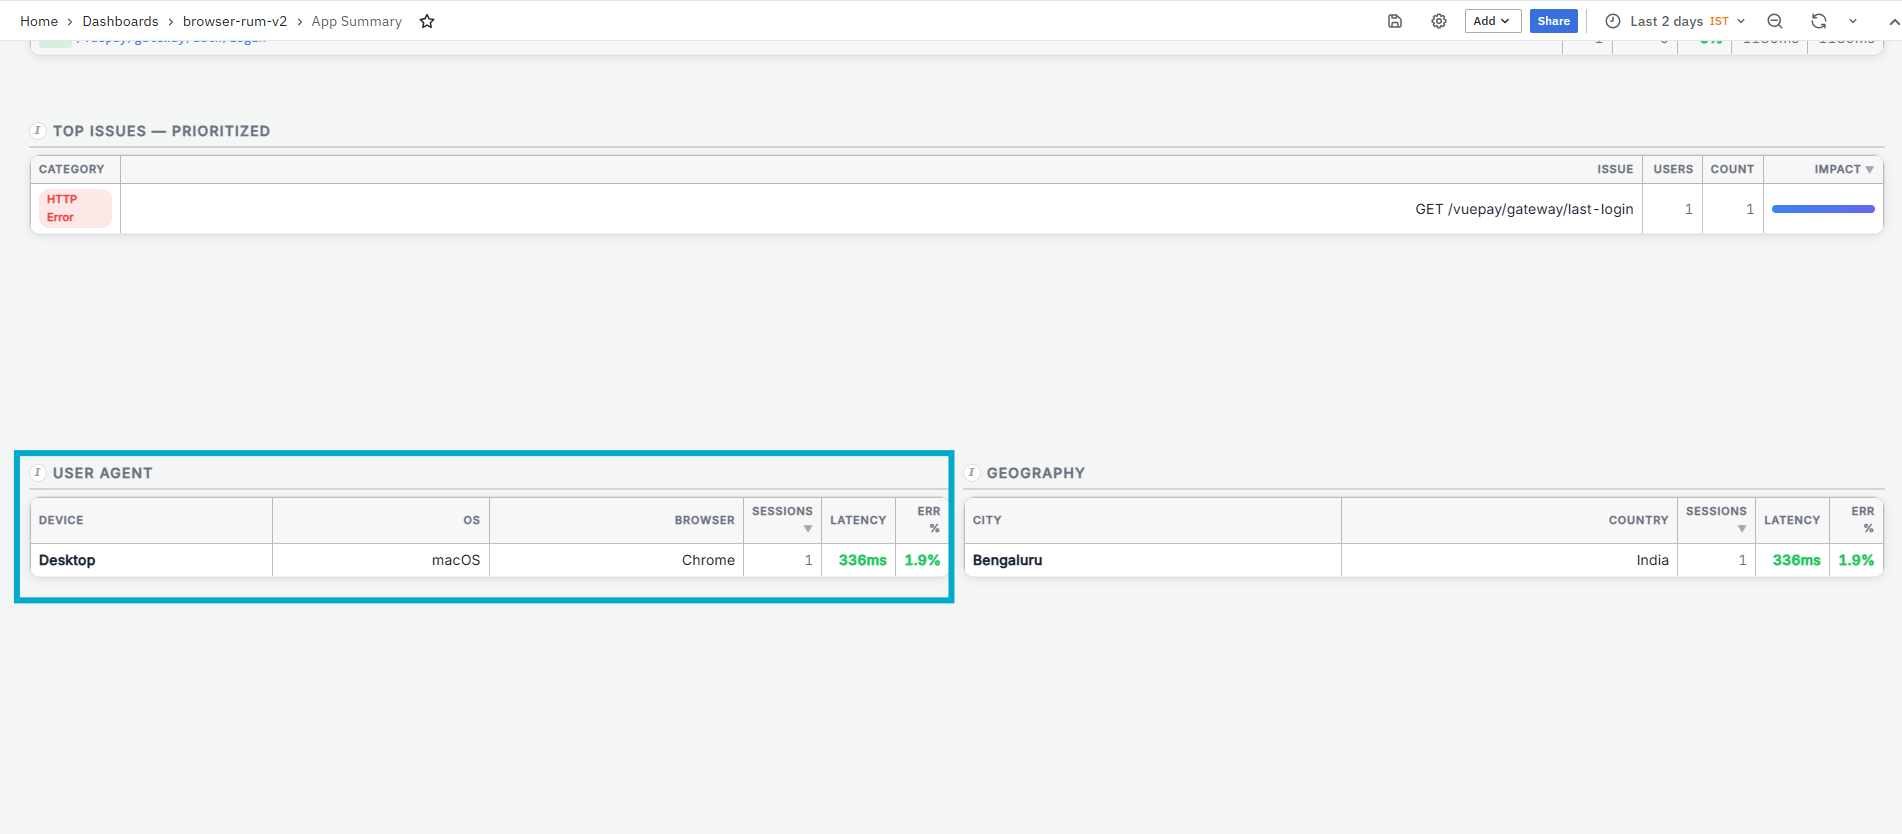
The User Agent panel lists the top device, operating system, and browser combinations by session count. It also shows average page latency and error percentage for each combination.
This panel is primarily used to identify browser-specific or device-specific performance issues.
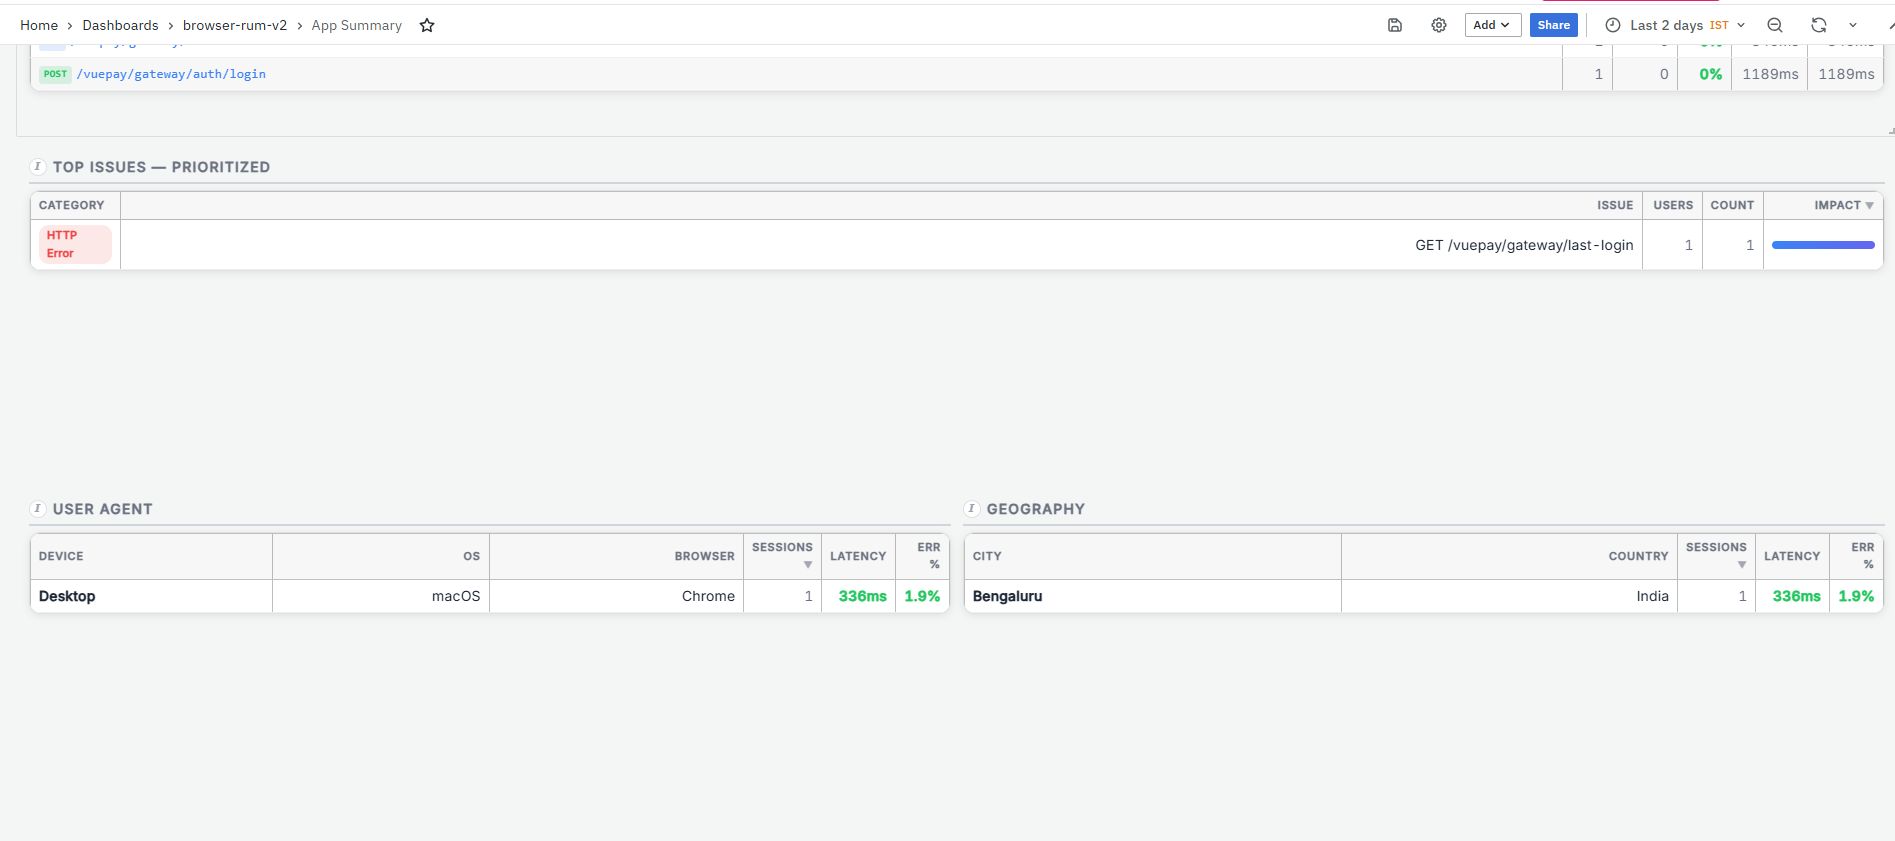
It helps you identify:
- Device and browser combinations used by application users
- Operating systems with higher session activity
- Browser-specific latency differences
- Device-specific or OS-specific error patterns
- User environments that may need further investigation
The panel includes the following columns:
- Device: Displays the device type used by the user, such as Desktop.
- OS: Displays the operating system used by the user, such as Linux or macOS.
- Browser: Displays the browser used by the user, such as Chrome or Safari.
- Sessions: Displays the number of sessions recorded for the device, OS, and browser combination.
- Latency: Displays the average page latency for that combination. A higher value indicates that users on that environment may be experiencing slower performance.
- Err%: Displays the error percentage for that combination. This helps identify whether a specific browser, operating system, or device type is facing more errors.
Geography
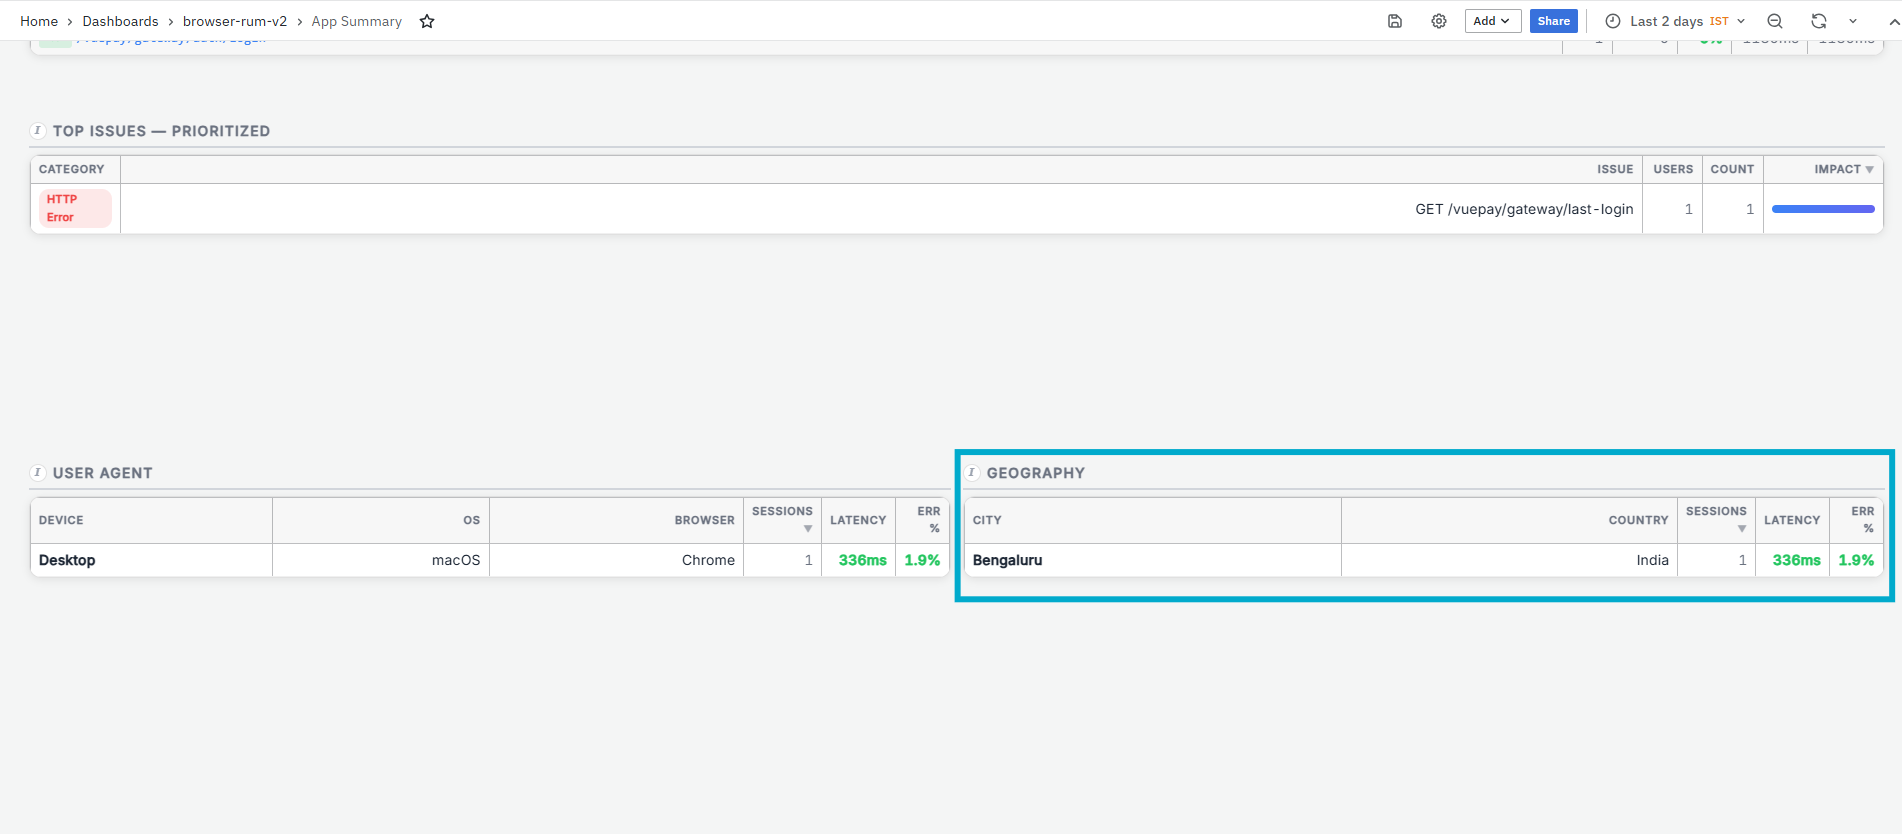
The Geography panel lists the top geographic locations by session count. It shows the city, country, session count, average latency, and error percentage for each location. This panel is primarily used to identify region-specific performance or availability issues.
It helps you identify:
- Cities or countries from where users accessed the application
- Locations with higher session activity
- Locations with higher average latency
- Locations with higher error percentage
- Region-specific performance issues that may need investigation
The panel includes the following columns:
- City: Displays the city from where users accessed the application.
- Country: Displays the country associated with the city.
- Sessions: Displays the number of sessions recorded from that location.
- Latency: Displays the average latency for users from that location. A higher value indicates that users in that region may be experiencing slower performance.
- Err%: Displays the error percentage for that location. This helps identify whether users from a specific location are facing more failures.
App Details Dashboard
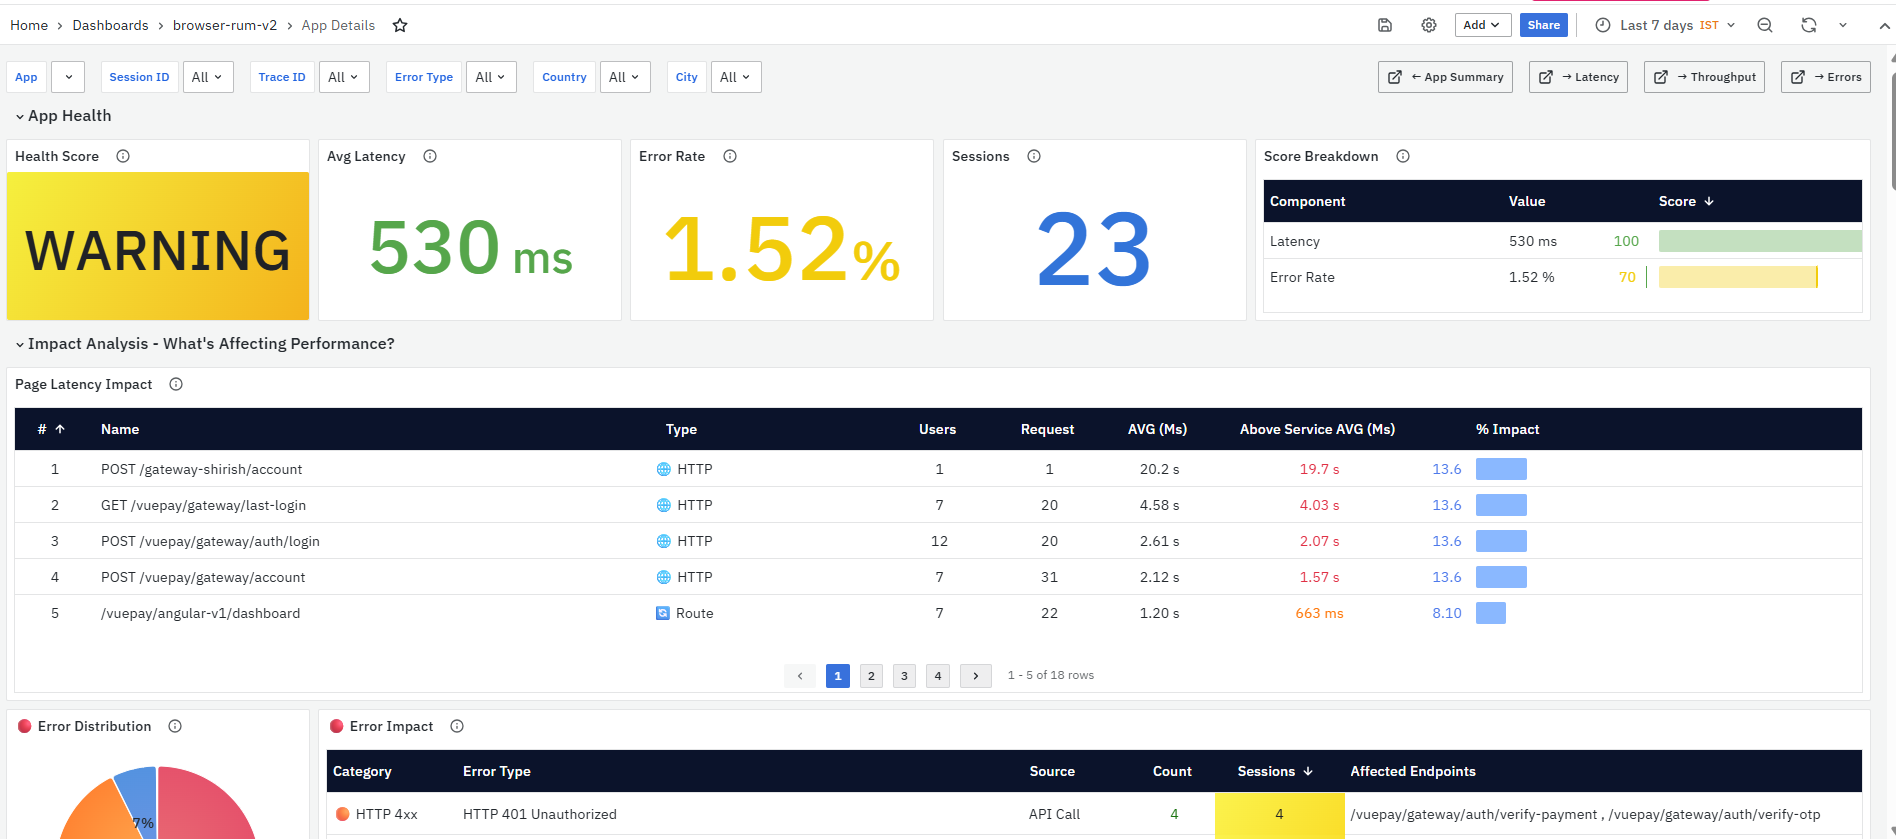
The App Details Dashboard is a dashboard in the Browser Real User Monitoring module. It provides a consolidated view of browser-side application performance, user experience, errors, page latency, web vitals, user segments, geographic performance, sessions, and traces. This dashboard helps users understand how real users are experiencing the selected application from their browsers. It can be used to identify slow pages, high-error endpoints, affected sessions, browser-specific issues, city-level performance problems, and traces that need deeper investigation.
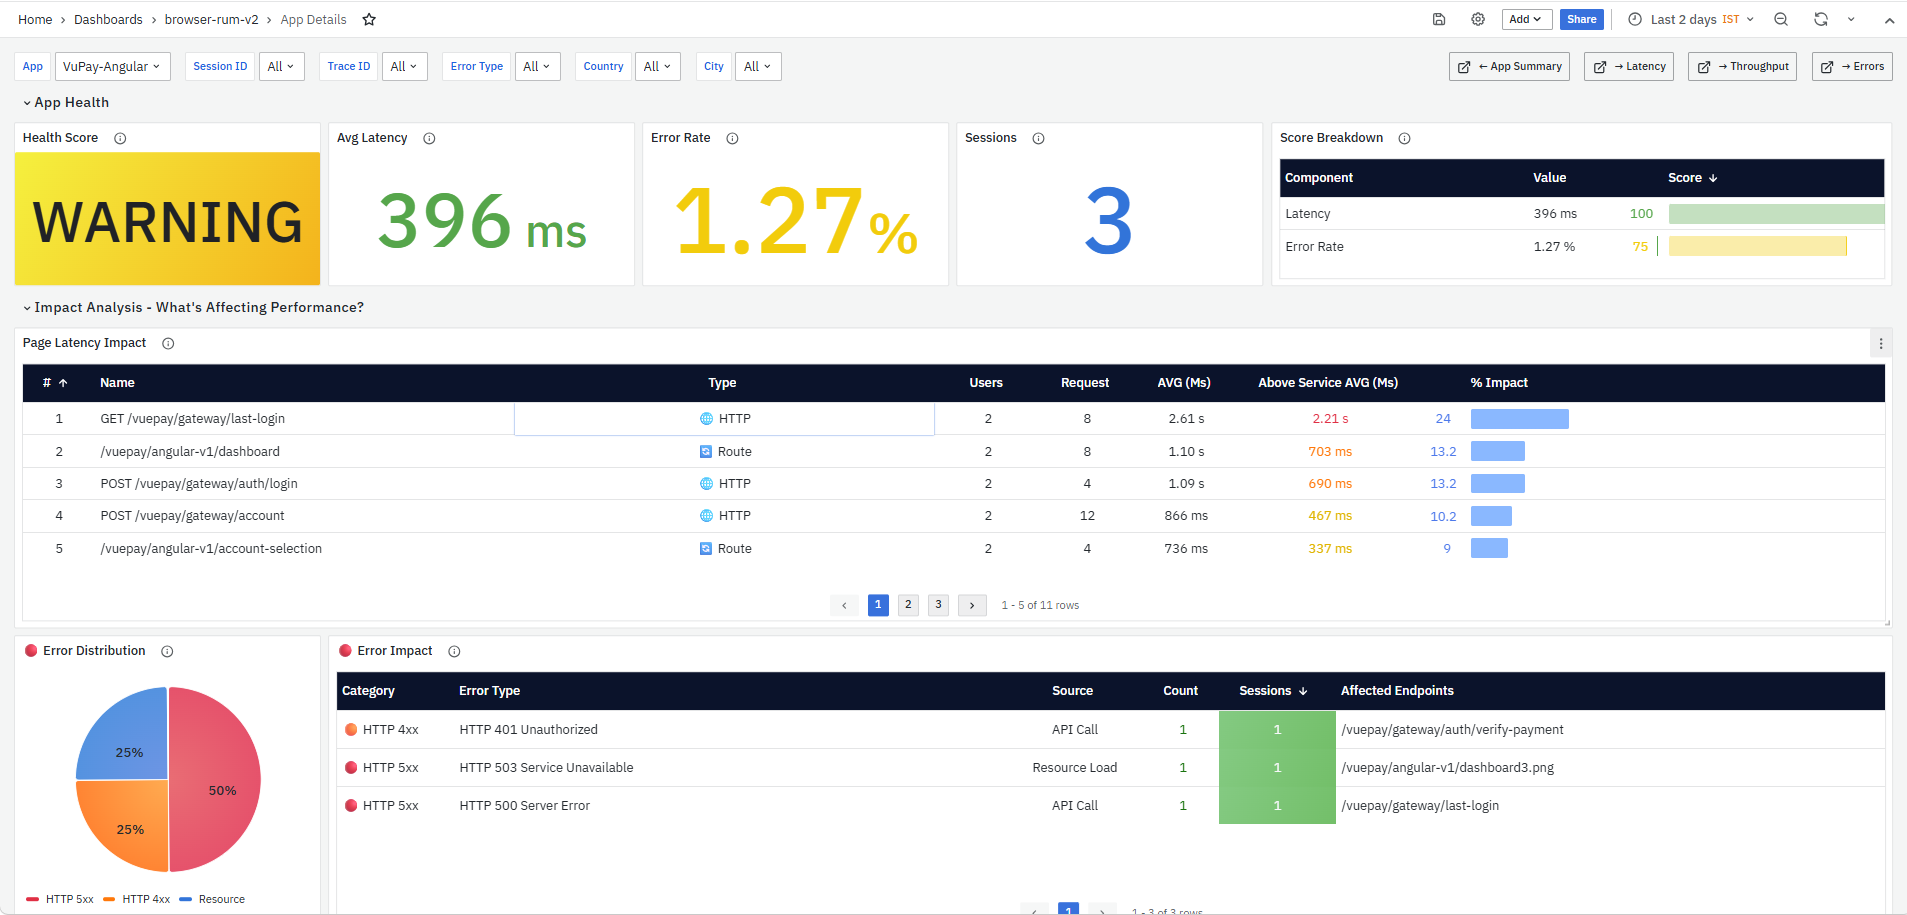
The dashboard is divided into the following sections:
- App Health
- Impact Analysis - What's Affecting Performance?
- Performance Timeline
- HTTP Requests
- Page Performance
- Route Changes (SPA Navigation)
- Web Vitals
- User Segments
- Geographic Performance Map
- Sessions & Traces (Filtered)
Each dashboard section includes Settings and Delete options in the section header. The Settings option opens the row options window, where the section Title can be updated and the Repeat for option can be configured. The Delete option opens a confirmation window before removing the selected row or row panels, helping prevent accidental deletion.
The App Details dashboard includes the following filters:
- App: Filters the dashboard data for the selected application.
- Session ID: Filters the dashboard for a specific user session.
- Trace ID: Filters the dashboard for a specific trace.
- Error Type: Filters the data based on the selected error type.
- Country: Filters the user experience and performance data by country.
- City: Filters the user experience and performance data by city.
These filters help users move from a broad application-level view to a focused investigation of a specific session, trace, error type, country, or city.
Related Dashboard
The App Details dashboard includes related dashboard links at the top-right side of the page. These links help users move from the App Details view to focused BRUM dashboards for deeper analysis.
App Summary
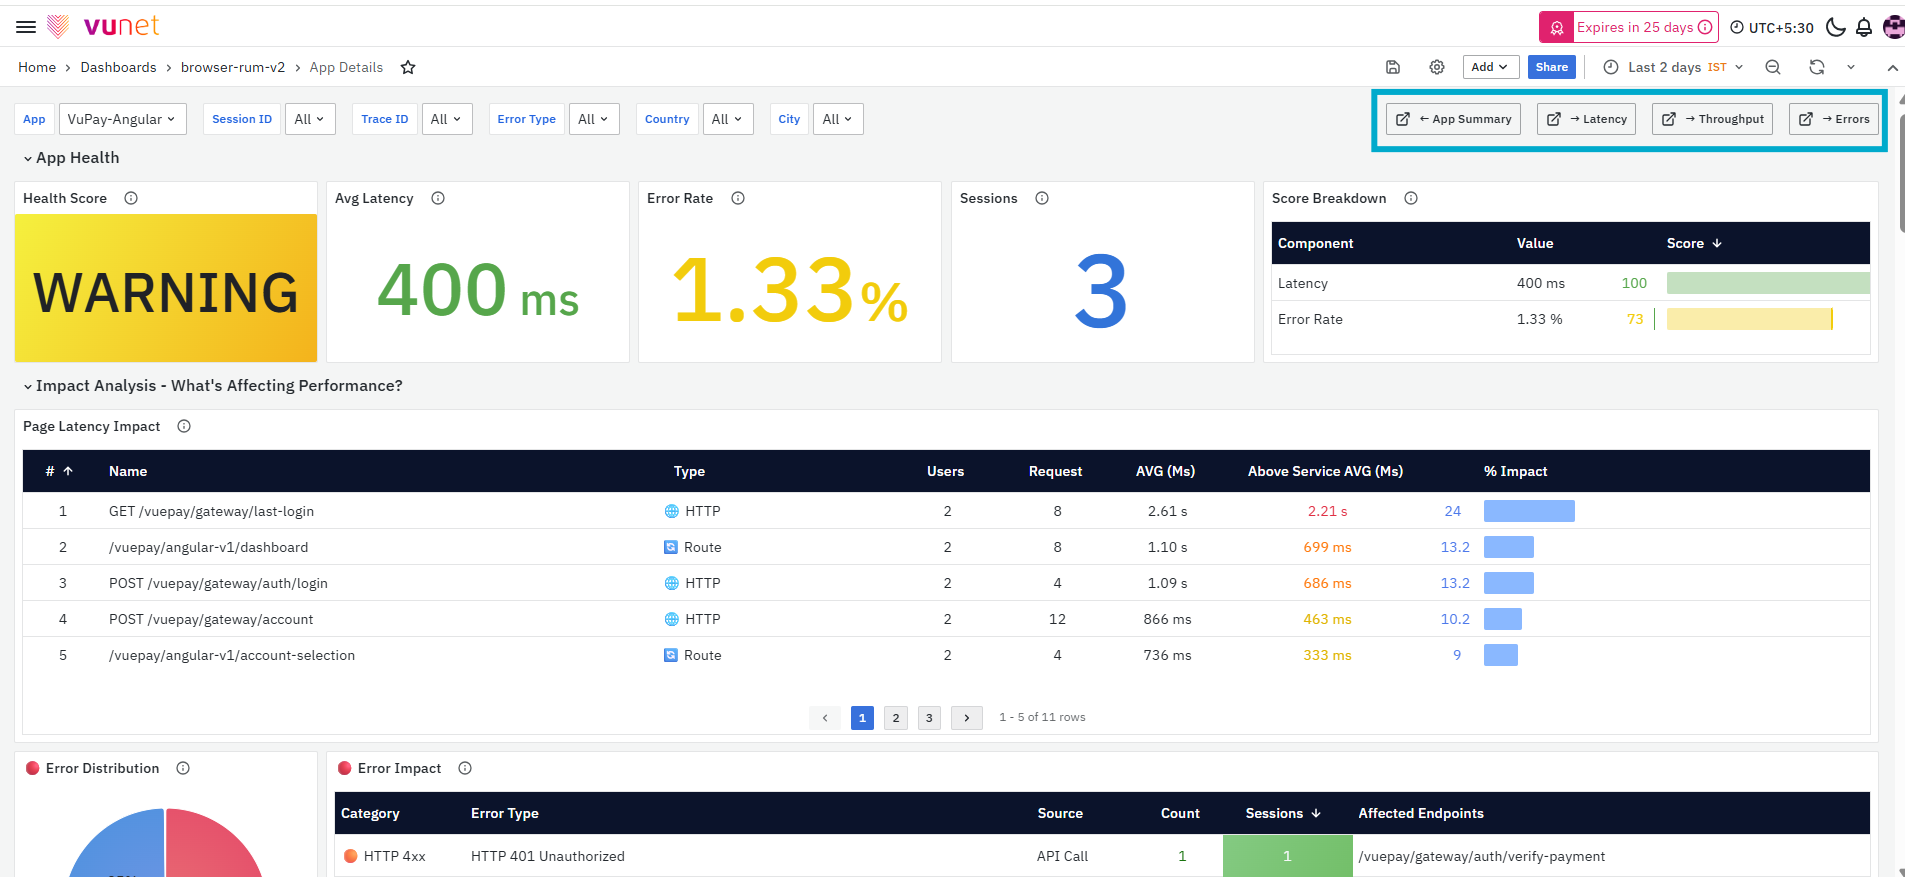
The App Summary dashboard provides a consolidated overview of the selected application’s browser-side performance. It shows application health, error rate, sessions, page loads, route changes, HTTP requests, and core web vitals. It also highlights activity trends, slowest pages, top route changes, top HTTP endpoints, prioritized issues, user agent details, and geography-based performance. For more details refer to App Summary Dashboard.
Latency
The Latency dashboard provides a focused view of latency across the selected application. It helps users analyze latency by category, page load, HTTP request, route change, and user interaction. This dashboard is useful when users need to identify slow pages, slow APIs, slow routes, or user actions that are increasing response time. For more details refer to Latency Deep-Dive Dashboard.
Throughput

The Throughput dashboard provides a focused view of application traffic and activity volume. It shows throughput by category, page load events, HTTP request calls, route changes, user interactions, and long tasks. This dashboard is useful when users need to understand request volume, traffic patterns, frequently used routes, and high-activity pages or actions. For more details refer to Throughput Deep-Dive Dashboard.
Errors

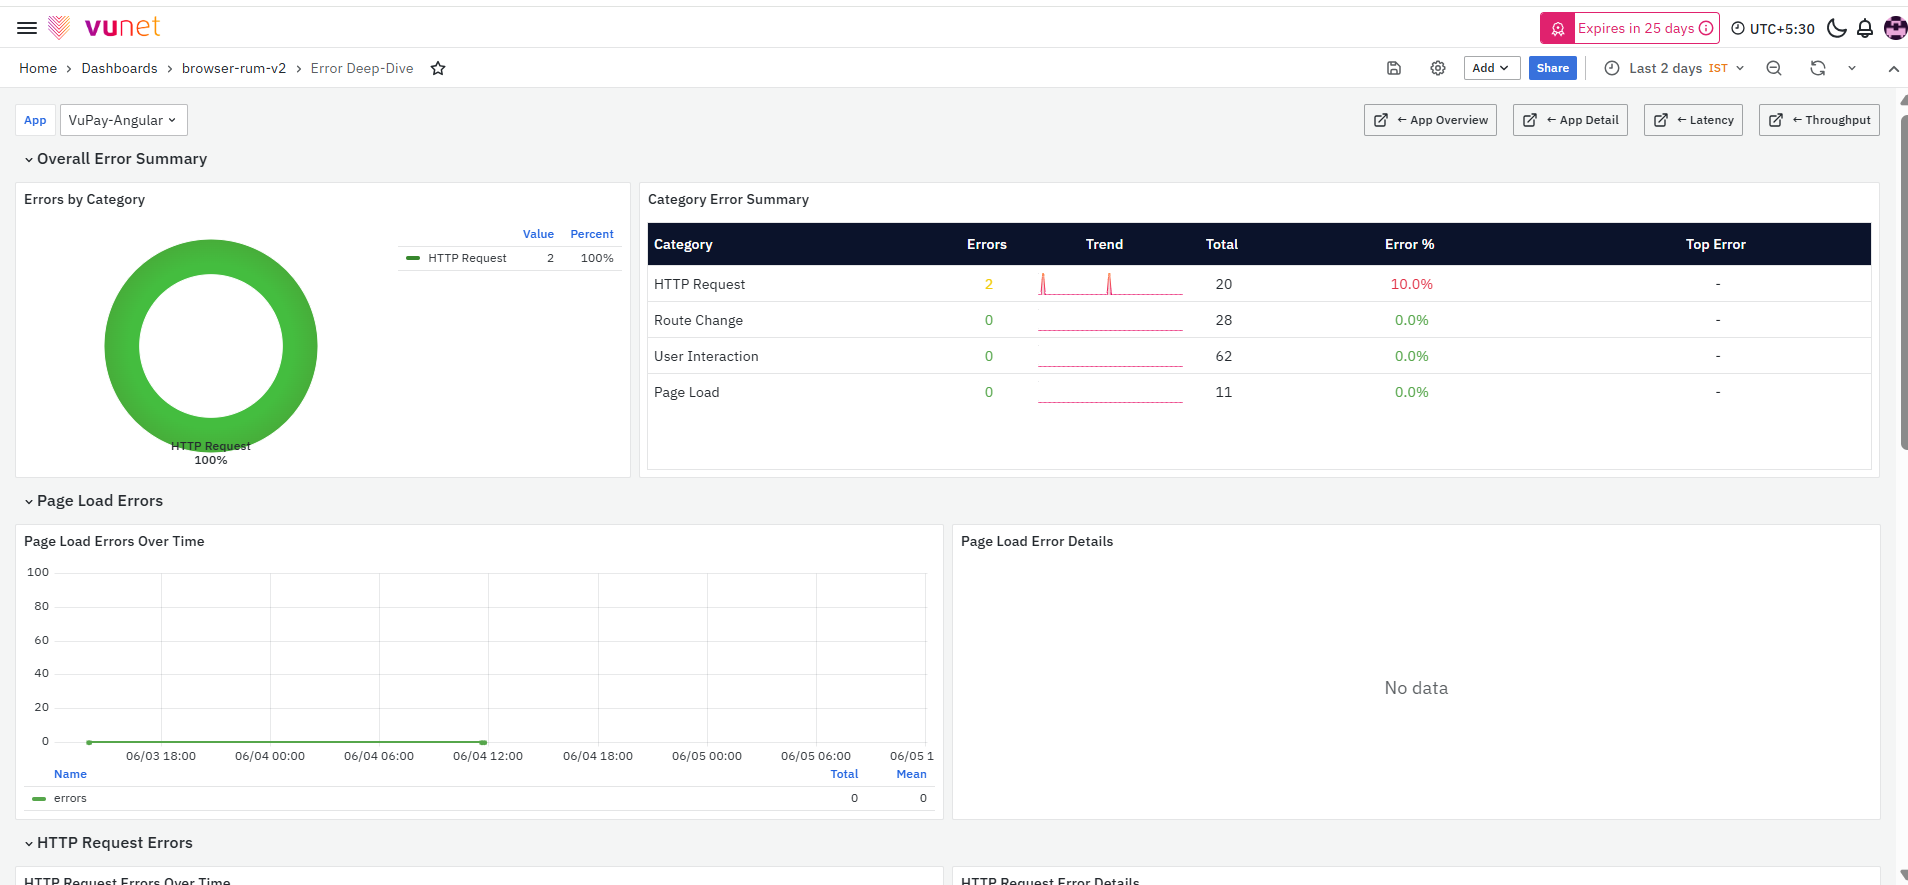
The Errors dashboard provides a focused view of application errors. It shows errors by category, category-level error summary, page load errors, HTTP request errors, route change errors, and user interaction errors. This dashboard is useful when users need to investigate error trends, affected endpoints, error status codes, and areas where users are facing failures. For more details refer to Error Deep-Dive Dashboard.
App Health
The App Health section provides a high-level summary of the selected application’s browser-side performance and user experience.
This section includes five panels:
- Health Score
- Avg Latency
- Error Rate
- Sessions
- Score Breakdown
Health Score
The Health Score panel shows the overall health of the application on a scale of 0 to 100. The score combines latency performance and error rate. A score above 90 is considered good. A score between 70 and 89 needs attention. A score between 50 and 69 indicates degraded performance. A score below 50 indicates a critical condition.
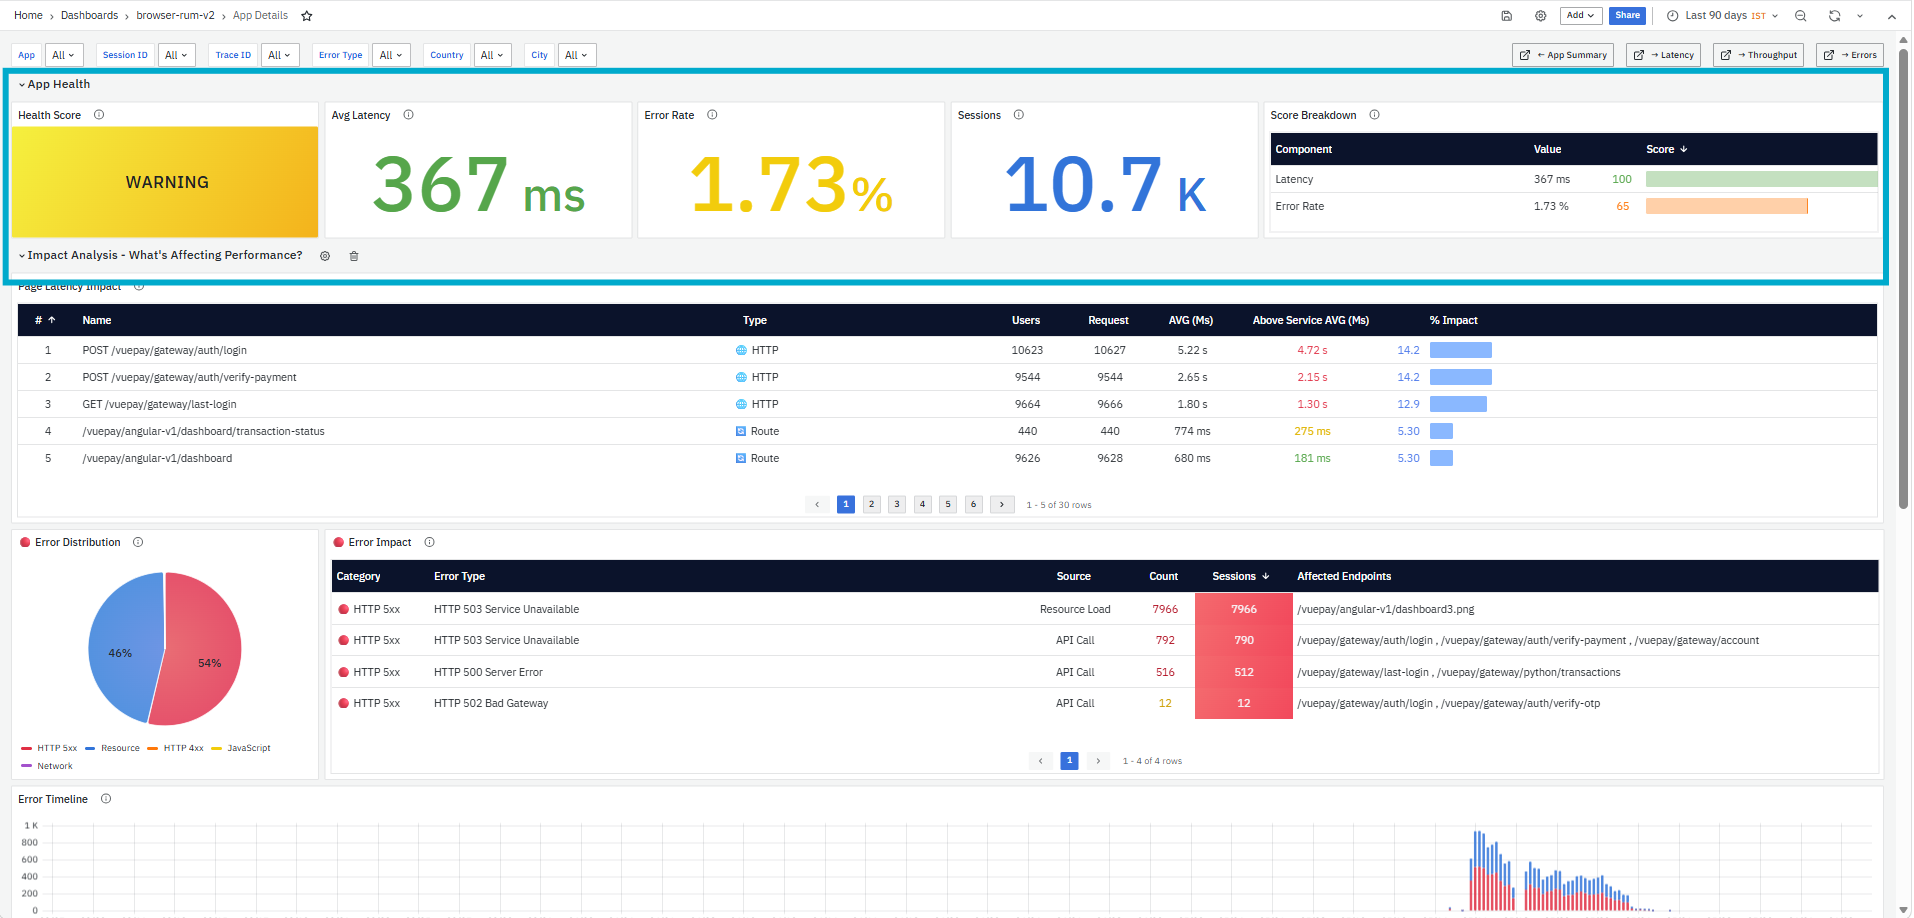
It helps you identify:
-
Whether the application is healthy, degraded, or critical
-
Whether users may be facing performance issues
-
Whether the application needs immediate attention
This panel should be used as the primary indicator of application health.
Avg Latency
The Avg Latency panel displays the average time taken to complete operations in the selected application. The value is measured in milliseconds. Lower latency indicates better user experience. Higher latency may indicate slow page loads, delayed responses, or backend/API delays affecting browser users.

It helps you identify:
-
Whether users are experiencing delayed responses
-
Whether average application performance is acceptable
-
Whether latency needs to be compared with expected service-level objectives
Error Rate
The Error Rate panel displays the percentage of requests that resulted in errors out of all requests. A value of 0% means no errors were observed in the selected time range. Higher values indicate that users may be facing failed requests or broken application experiences.
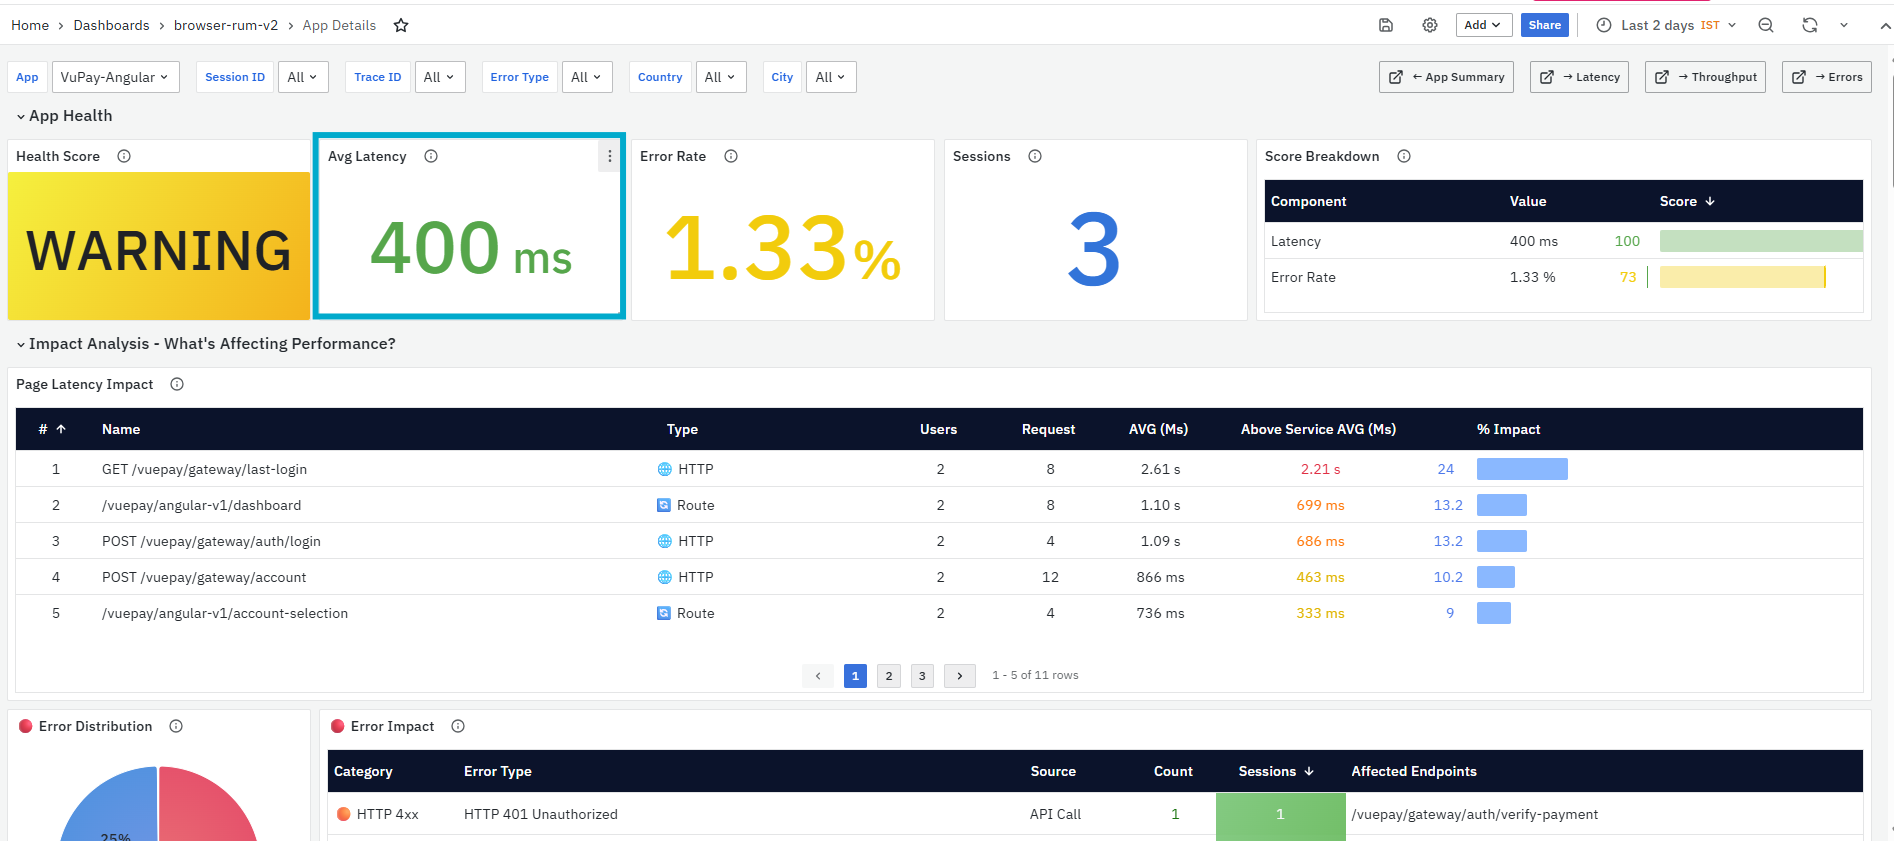
It helps you identify:
-
Whether users are facing errors
-
Whether the error rate is increasing
-
Whether errors may be impacting user experience
Sessions
The Sessions panel displays the total number of user sessions for the selected application and time range. A session represents a user’s interaction period with the application. This metric provides context for latency and error analysis because performance issues should be reviewed along with the number of affected sessions.
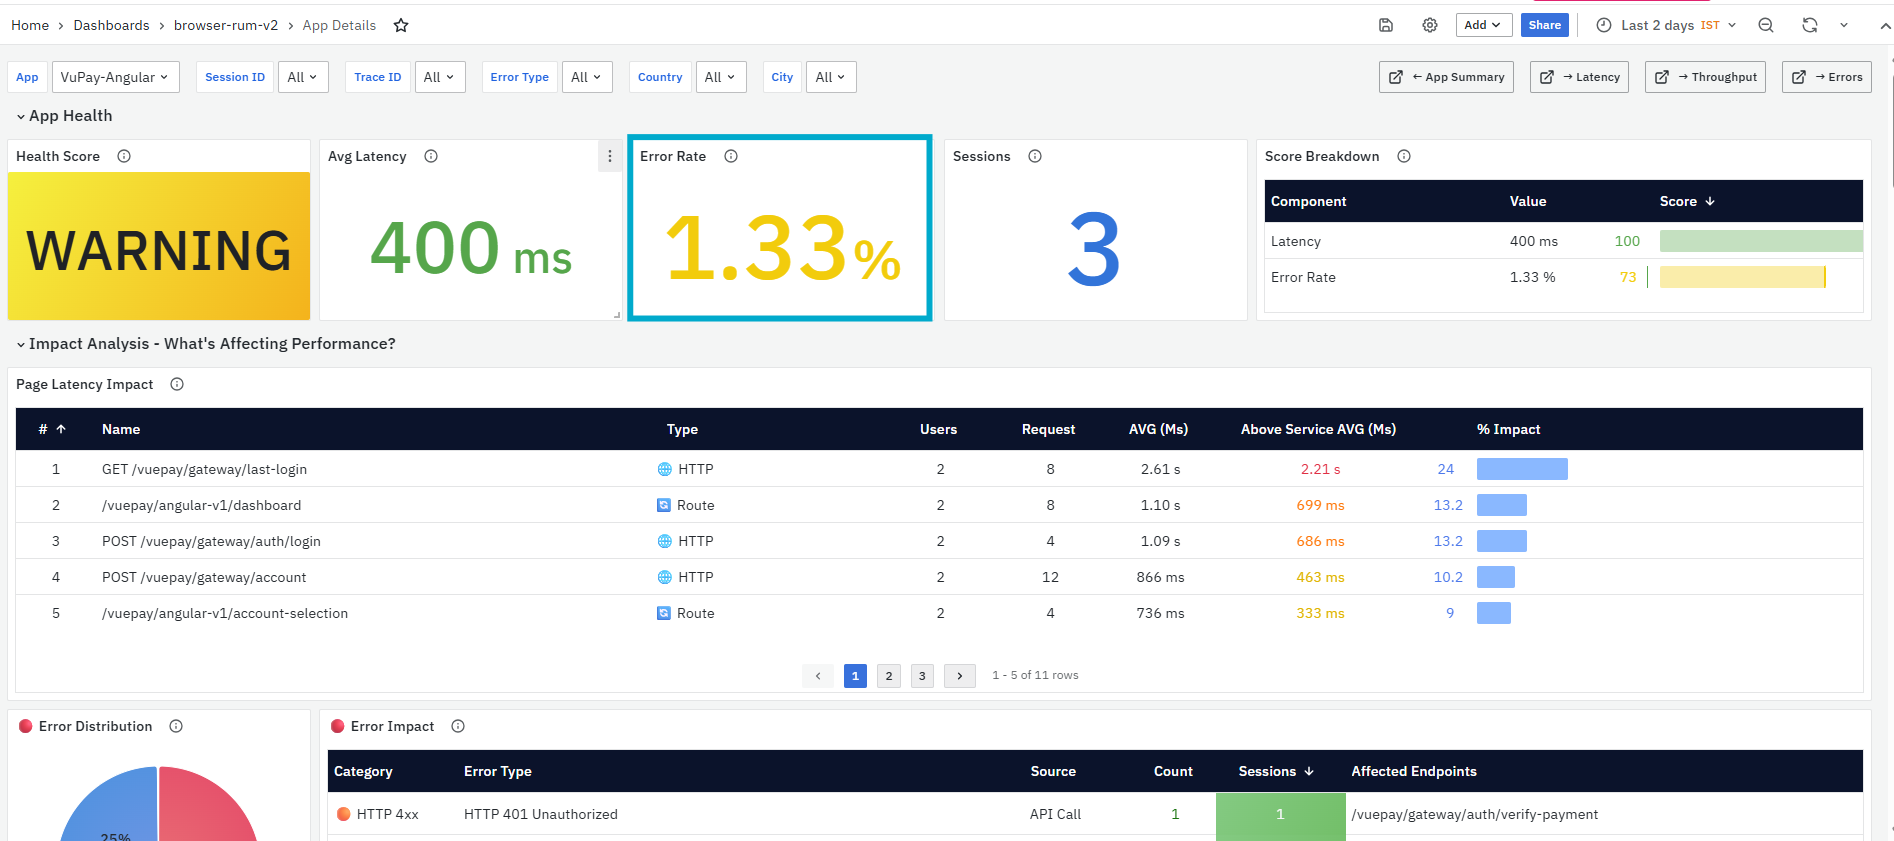
It helps you identify:
-
Total user activity for the selected application
-
Whether many users were active during the selected period
-
Whether errors or latency issues affected a large user base
Score Breakdown
The Score Breakdown panel breaks down the health score into individual components. Each component is scored on a scale of 0 to 100 and shown with a colored score indicator. This helps users understand whether latency or errors are affecting the overall health score the most.
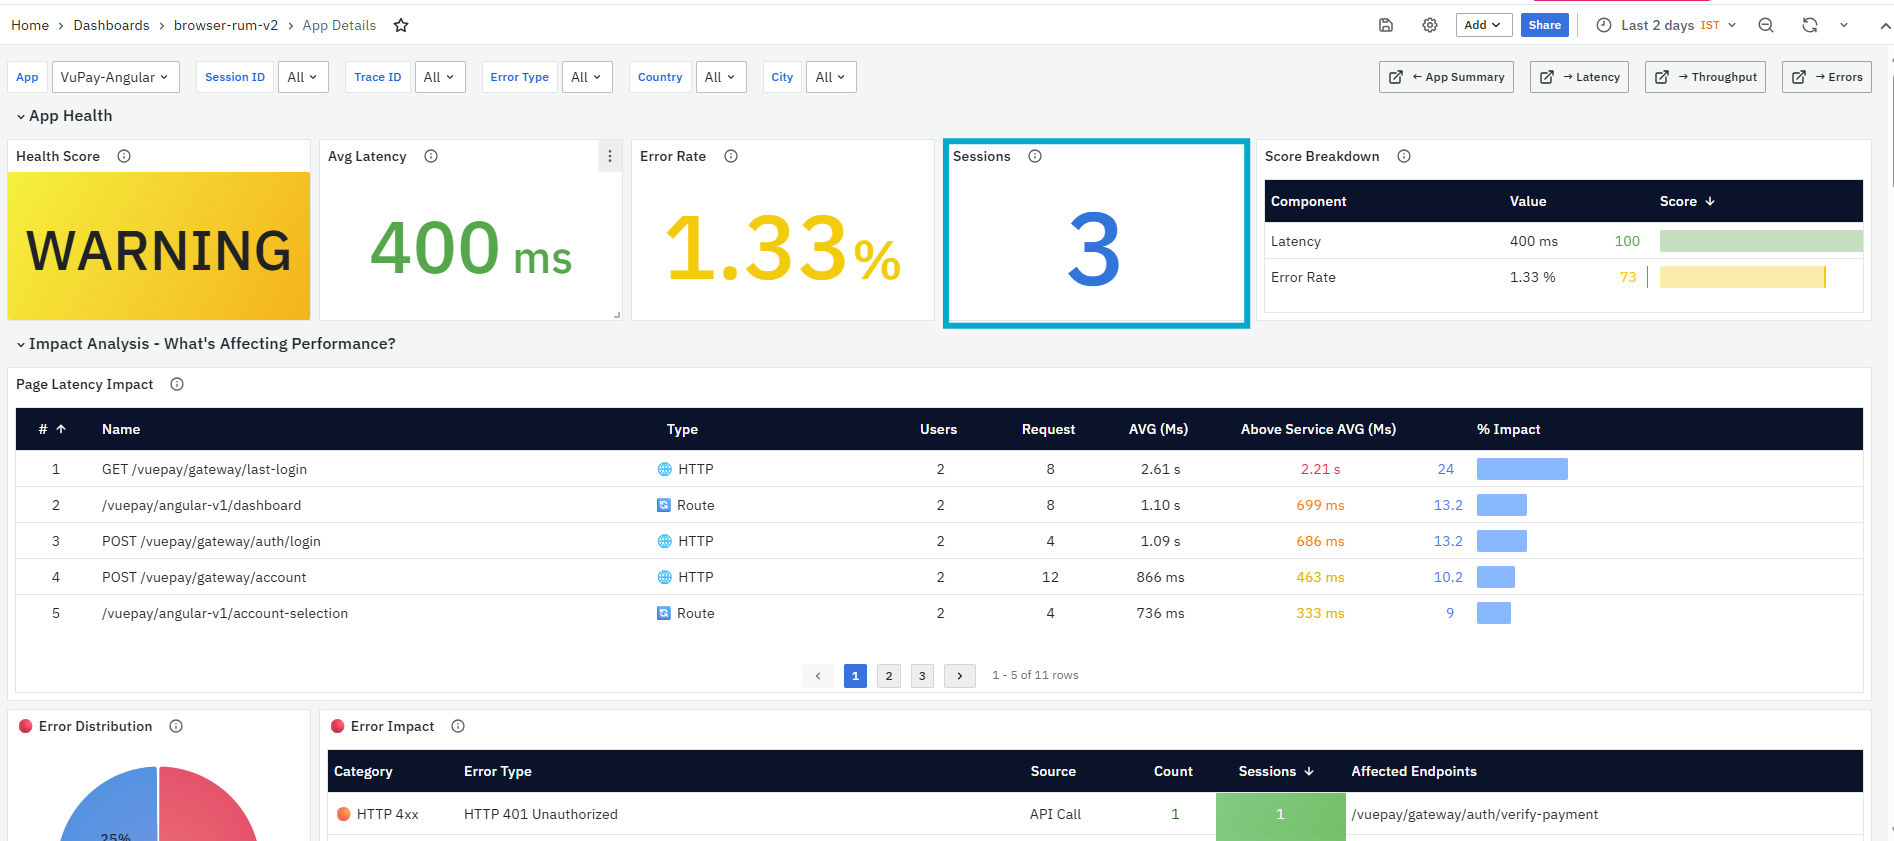
The panel includes the following columns:
-
Component: Displays the component used in the health score calculation, such as Latency or Error Rate.
-
Value: Displays the measured value for the component.
-
Score: Displays the score for that component.
It helps you identify:
-
Whether latency is reducing the health score
-
Whether error rate is reducing the health score
-
Which area should be investigated first
Impact Analysis - What’s Affecting Performance?
The Impact Analysis - What’s Affecting Performance section identifies the pages, routes, requests, and errors that are contributing most to degraded user experience.
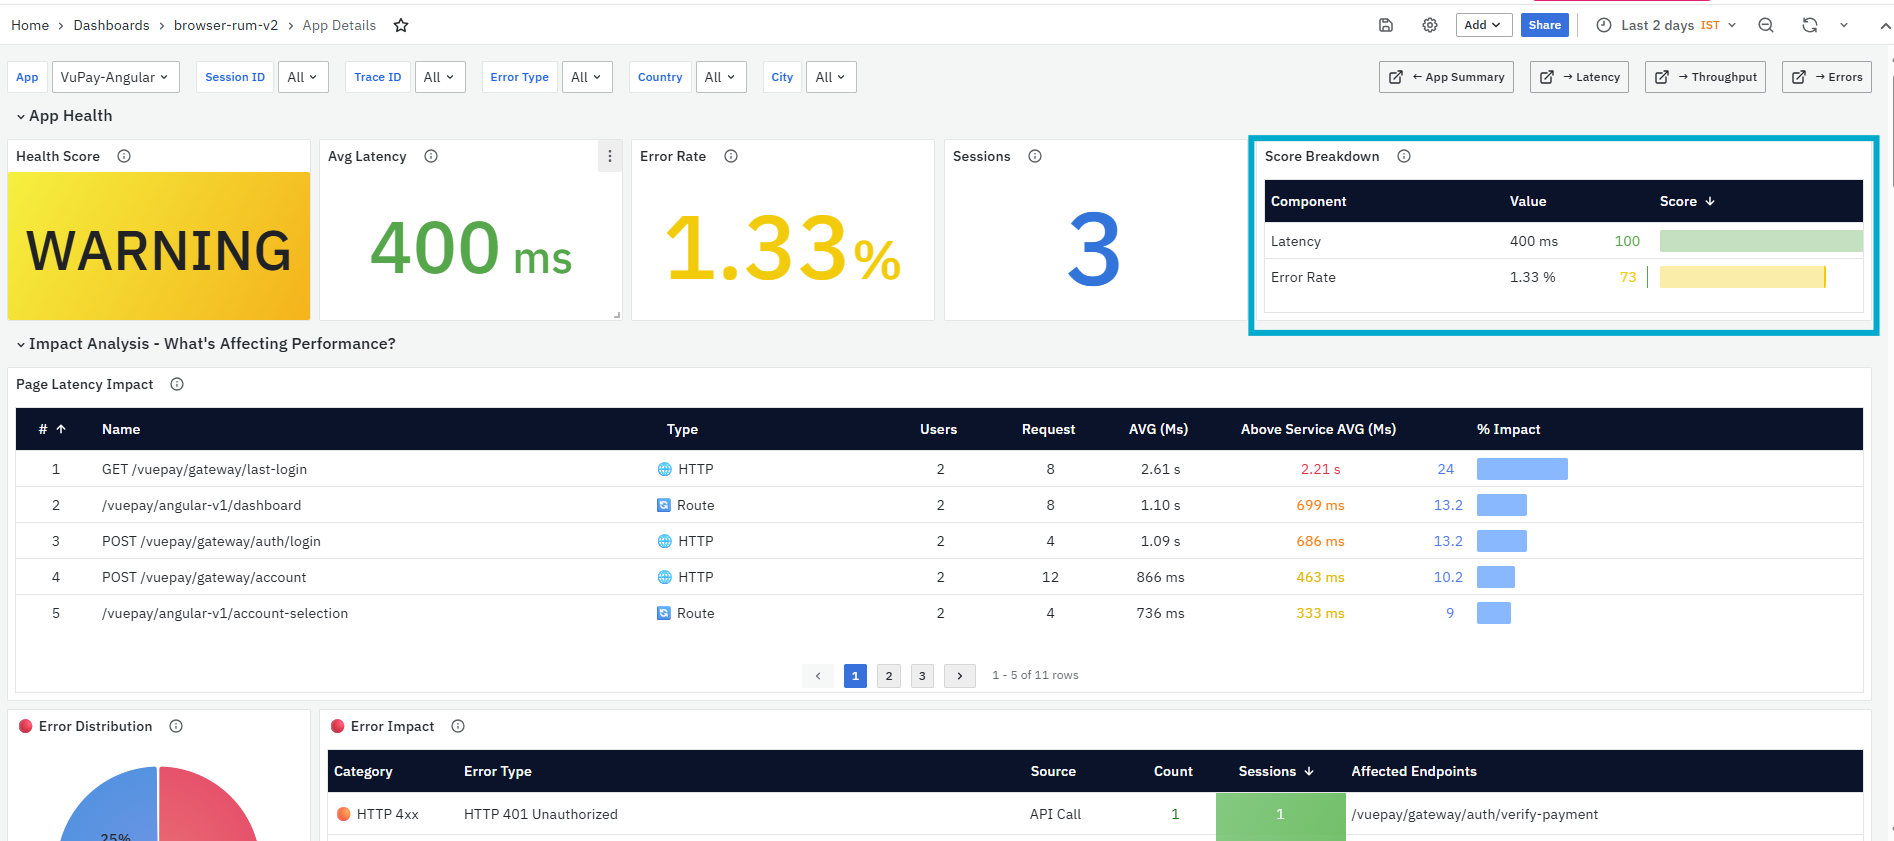
This section includes seven panels:
- Page Latency Impact
- Error Distribution
- Error Impact
- Error Timeline
- Recent Errors
- Errors by Endpoint
- Errors by Browser
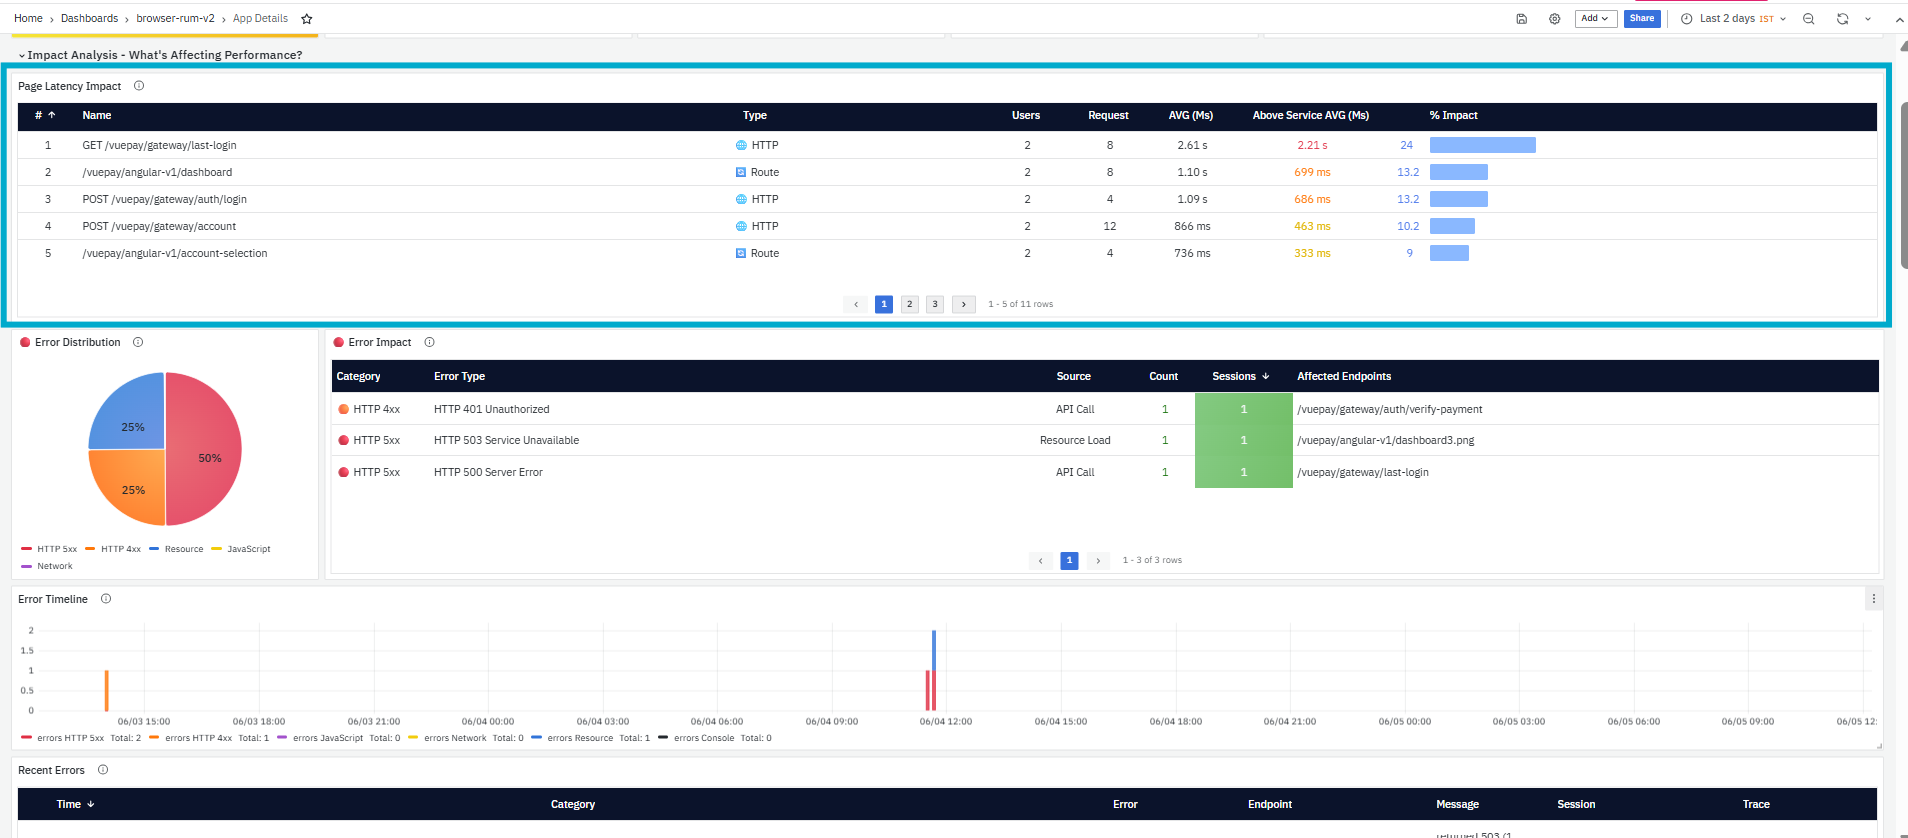
Page Latency Impact
The Page Latency Impact panel identifies which pages or actions are causing the highest performance impact. Pages are ranked by impact. The impact considers how slow the page or action is compared to the average and how many users are affected. Actions at the top of the list should be reviewed first because they have the highest user impact.
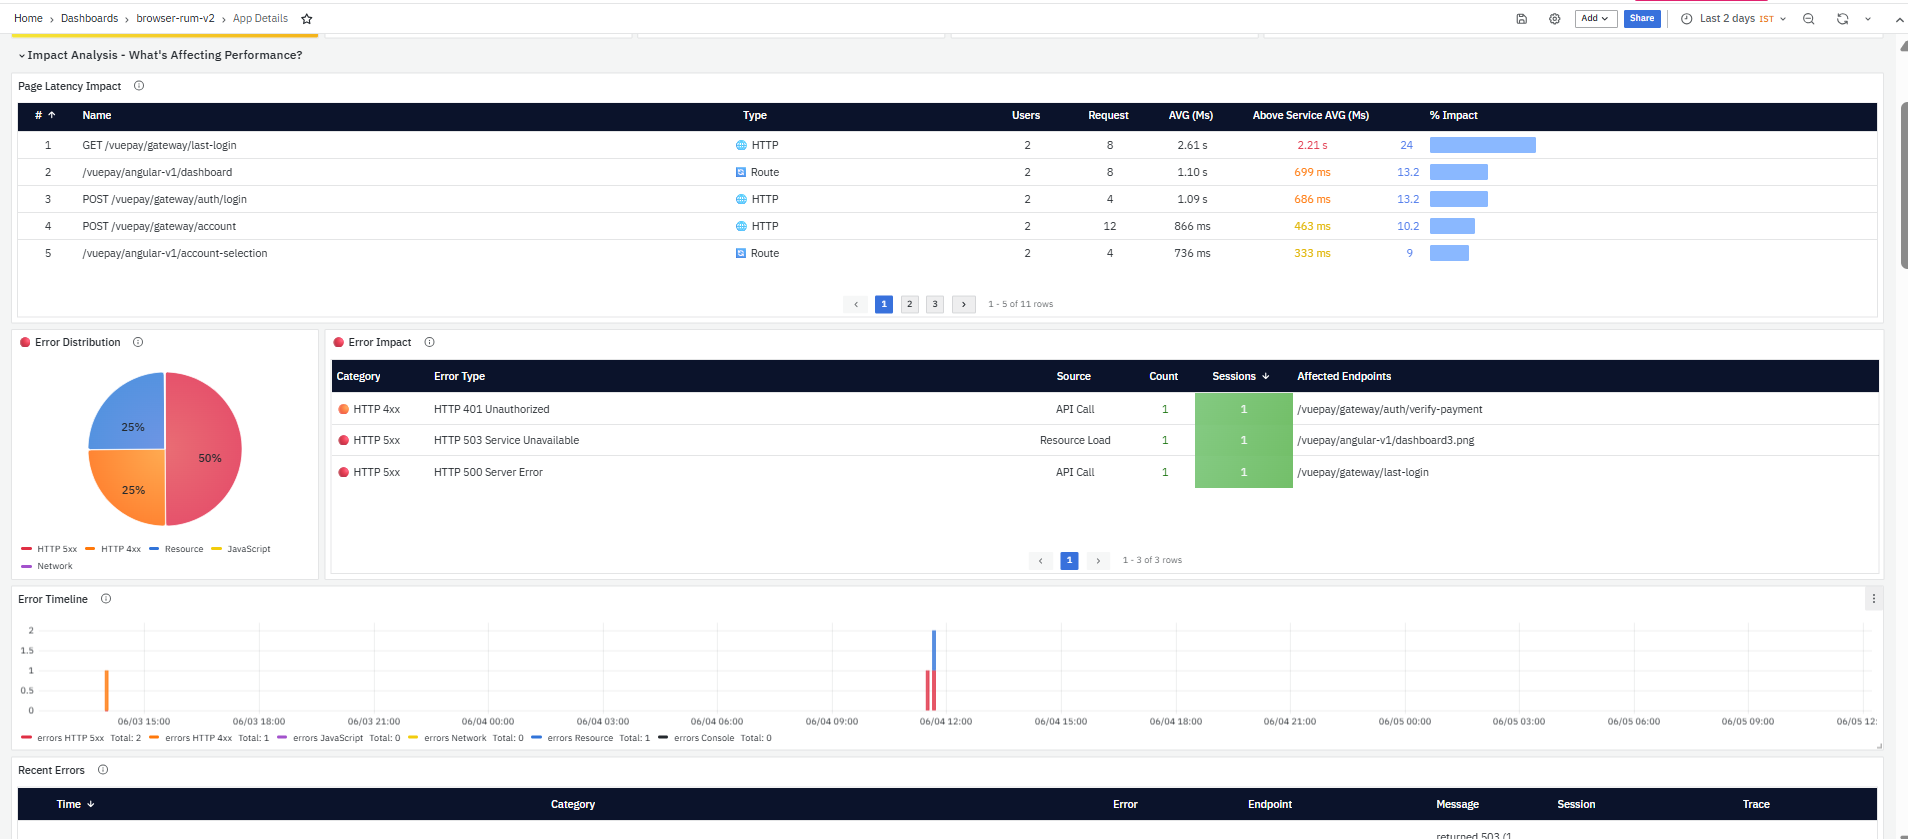
It helps you identify:
-
Pages or actions with the highest latency impact
-
High-traffic pages that are slower than expected
-
Routes or HTTP requests affecting many users
-
Optimization priorities based on user impact
The panel includes the following columns:
-
#: Displays the rank of the page or action.
-
Name: Displays the page, route, or request name.
-
Type: Displays the type, such as HTTP or Route.
-
Users: Displays the number of users affected.
-
Request: Displays the number of requests.
-
AVG (Ms): Displays the average latency.
-
Above Service AVG (Ms): Displays how much slower the item is compared to the service average.
-
% Impact: Displays the impact percentage with a visual bar.
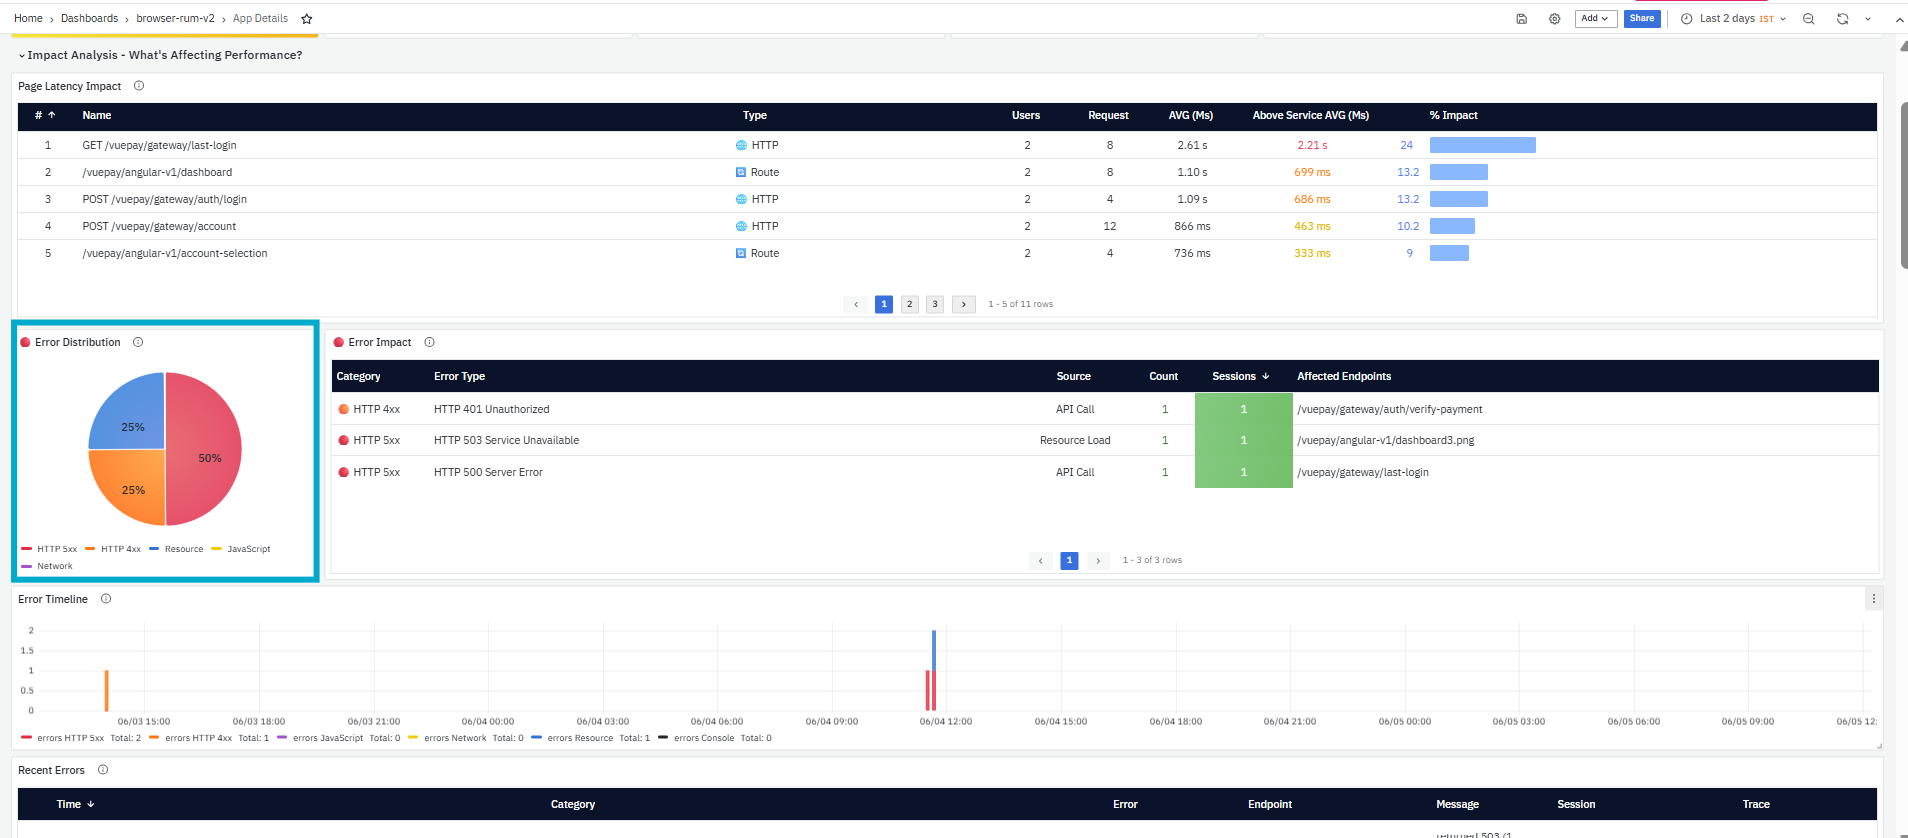
Error Distribution
The Error Distribution panel displays the distribution of error types in a pie chart. Errors are categorized separately, such as HTTP 5xx, resource errors, HTTP 4xx, JavaScript errors, and network errors.
It helps you identify:
-
Which error category contributes the most errors
-
Whether server-side errors or browser-side errors are dominant
-
Whether resource loading issues are affecting users
-
Which error category should be prioritized first
Error Impact
The Error Impact panel lists the most common errors affecting users, grouped by type. It shows how many sessions were impacted by each error type. It also displays sample affected endpoints, which helps developers quickly locate where the error is occurring.
It helps you identify:
-
Most common error types
-
Error sources such as API calls or resource loads
-
Number of sessions affected by each error
-
Endpoints impacted by each error
The panel includes the following columns:
-
Category: Displays the error category.
-
Error Type: Displays the specific error type.
-
Source: Displays the source of the error, such as API Call or Resource Load.
-
Count: Displays the number of error occurrences.
-
Sessions: Displays the number of affected sessions.
-
Affected Endpoints: Displays the endpoints where the error occurred.
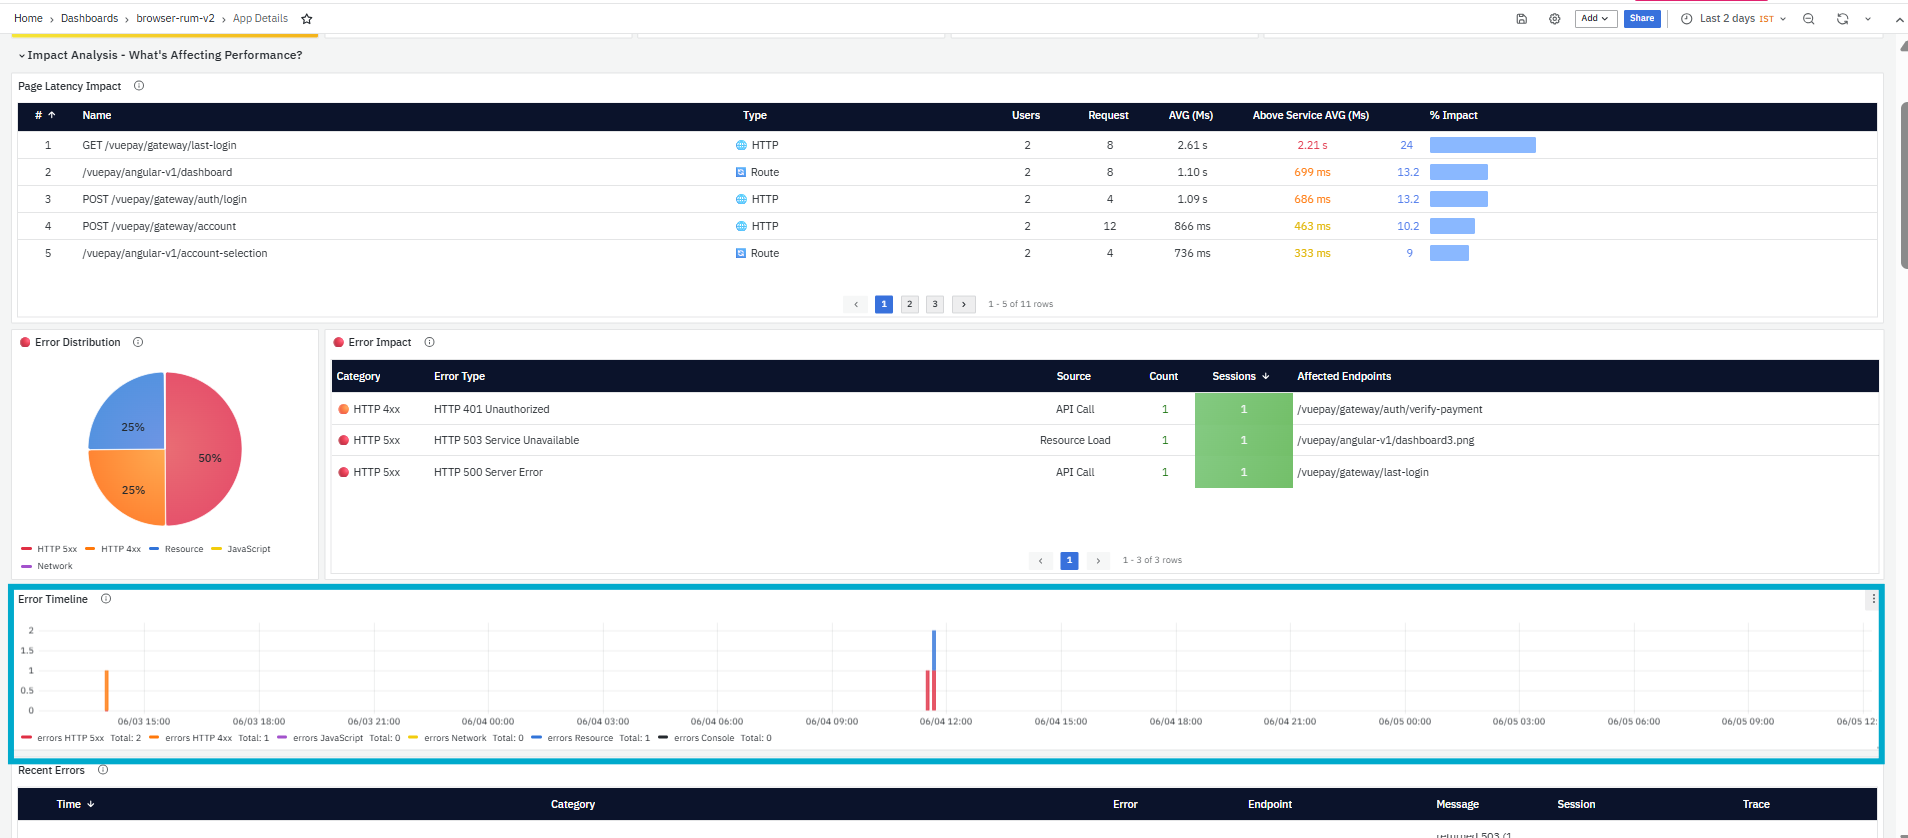
Error Timeline
The Error Timeline panel displays error activity over time. It helps users understand when errors occurred and whether there were spikes during the selected time range.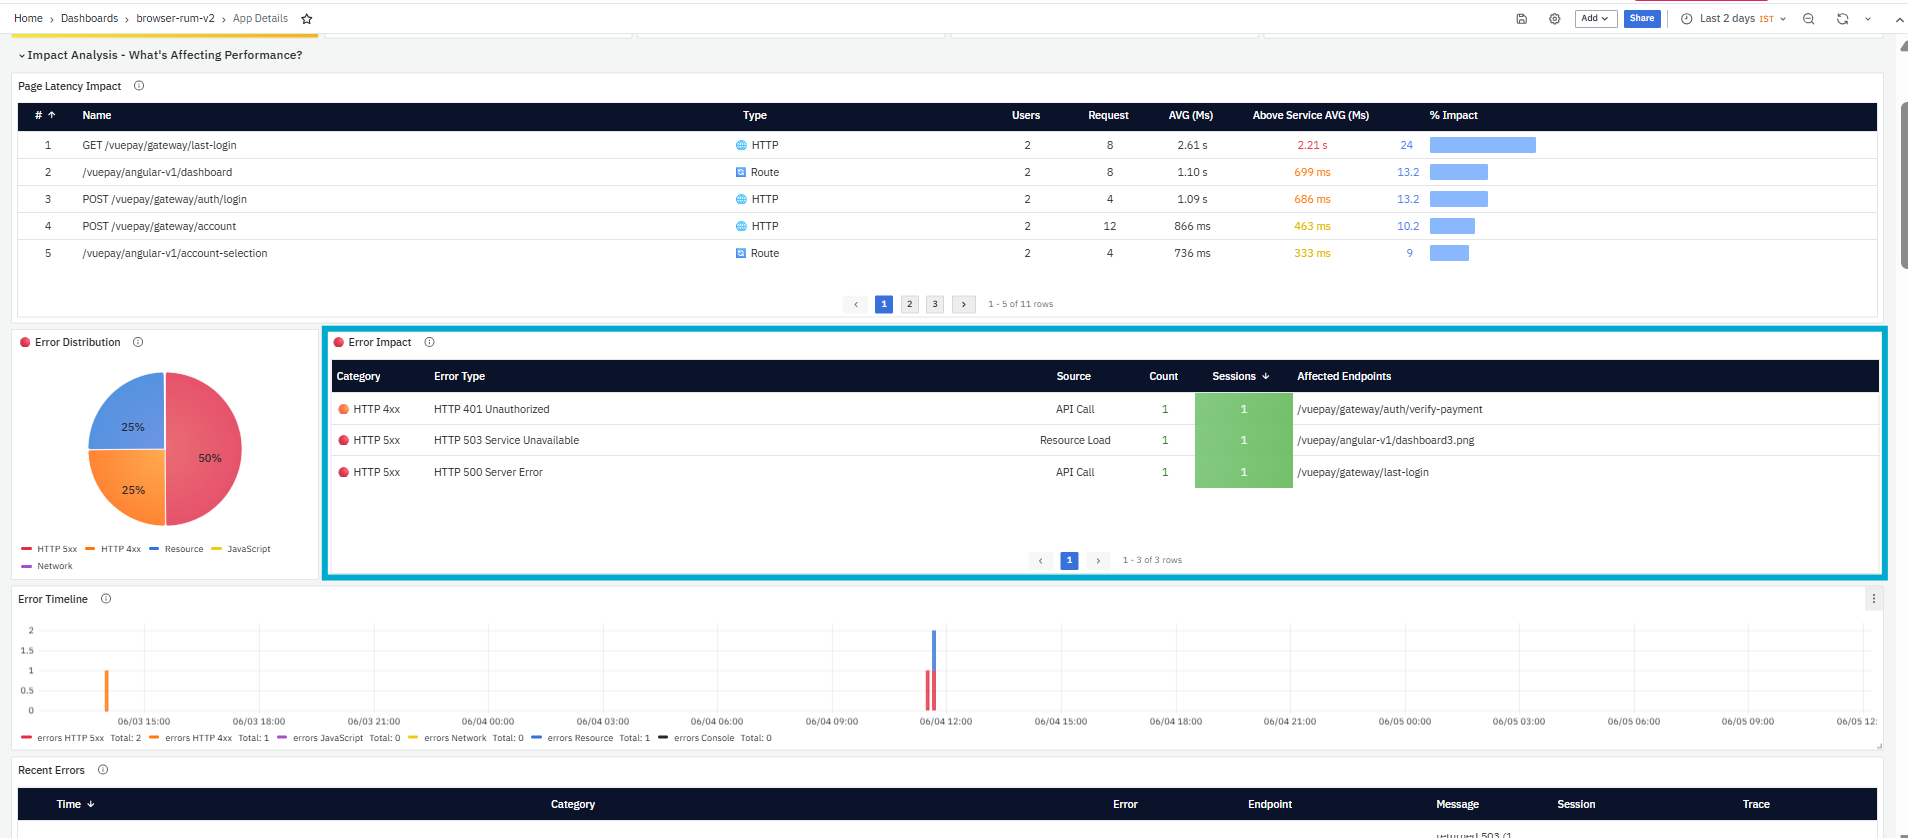
It helps you identify:
-
Time periods with high error activity
-
Sudden error spikes
-
Whether errors are increasing or decreasing
-
Which error categories contributed to a specific spike
Recent Errors
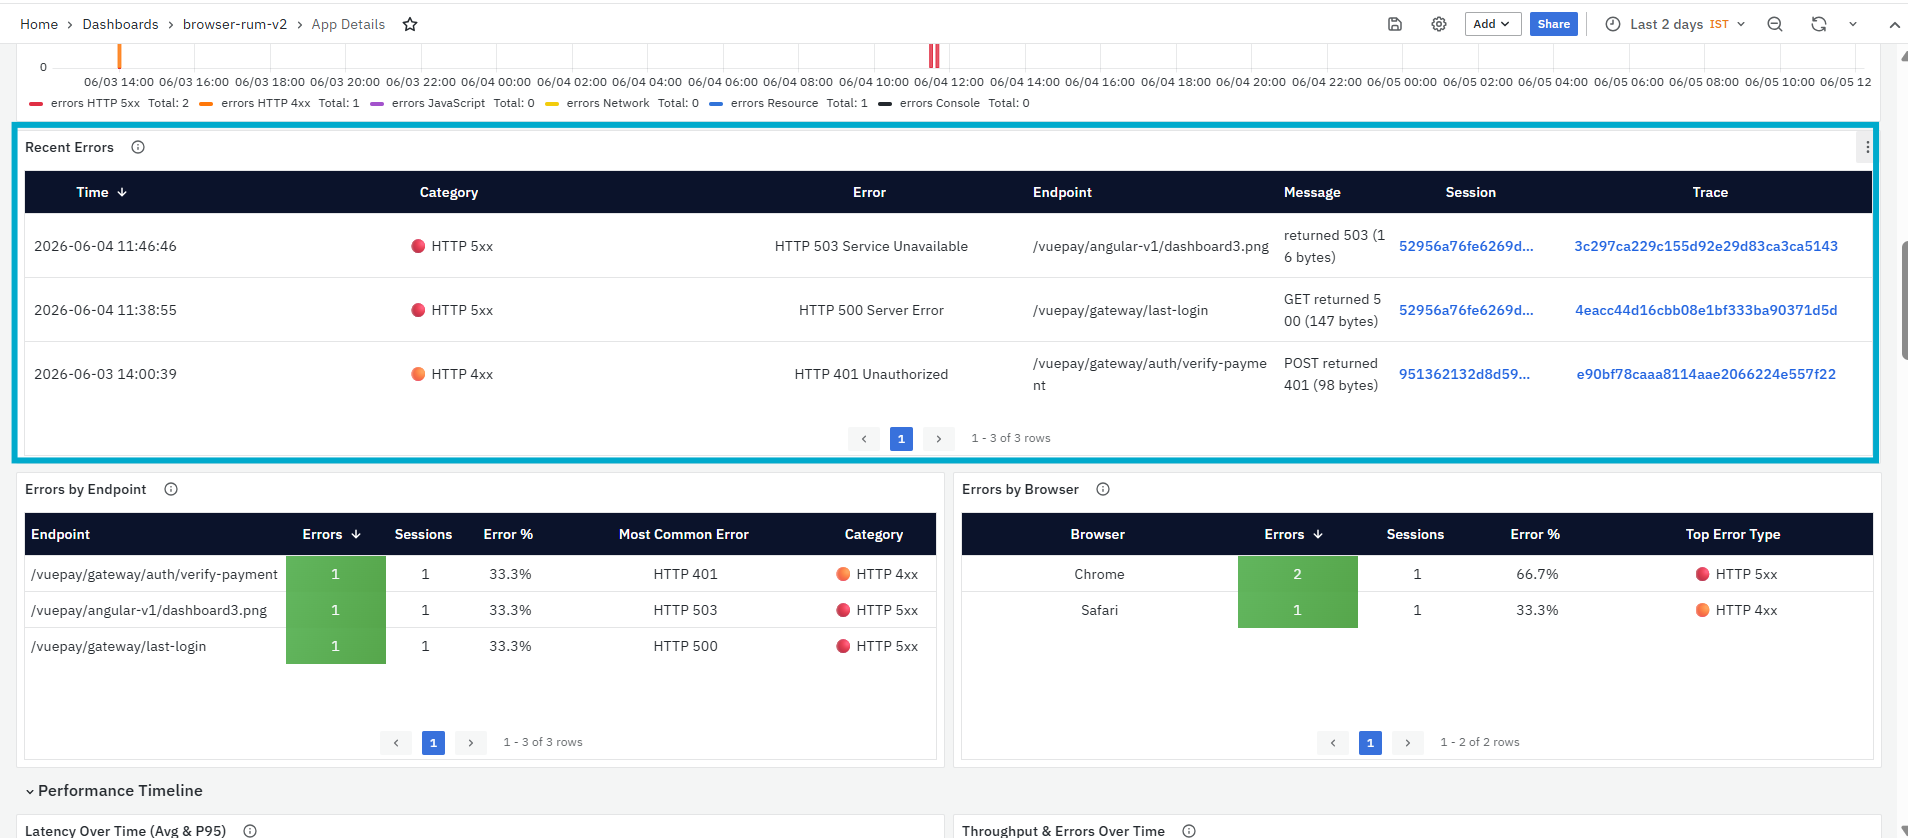
The Recent Errors panel displays the latest errors captured for the selected application within the selected time range. This panel is primarily used to review recent failures and quickly identify where the error occurred, what type of error was reported, and which session or trace can be used for deeper investigation.
It helps you identify:
- Recently reported application or browser-side errors
- The error category, such as HTTP 5xxThe exact error type, such as HTTP 503 Service Unavailable
- The endpoint where the error occurred
- The error message returned by the application or resource
- The session and trace linked to the error for further analysis
The panel includes the following columns:
- Time: Displays the timestamp when the error occurred.
- Category: Displays the error category.
- Error: Displays the specific error type or error name.
- Endpoint: Displays the page, API, or resource endpoint where the error occurred.
- Message: Displays the error message captured for the event.
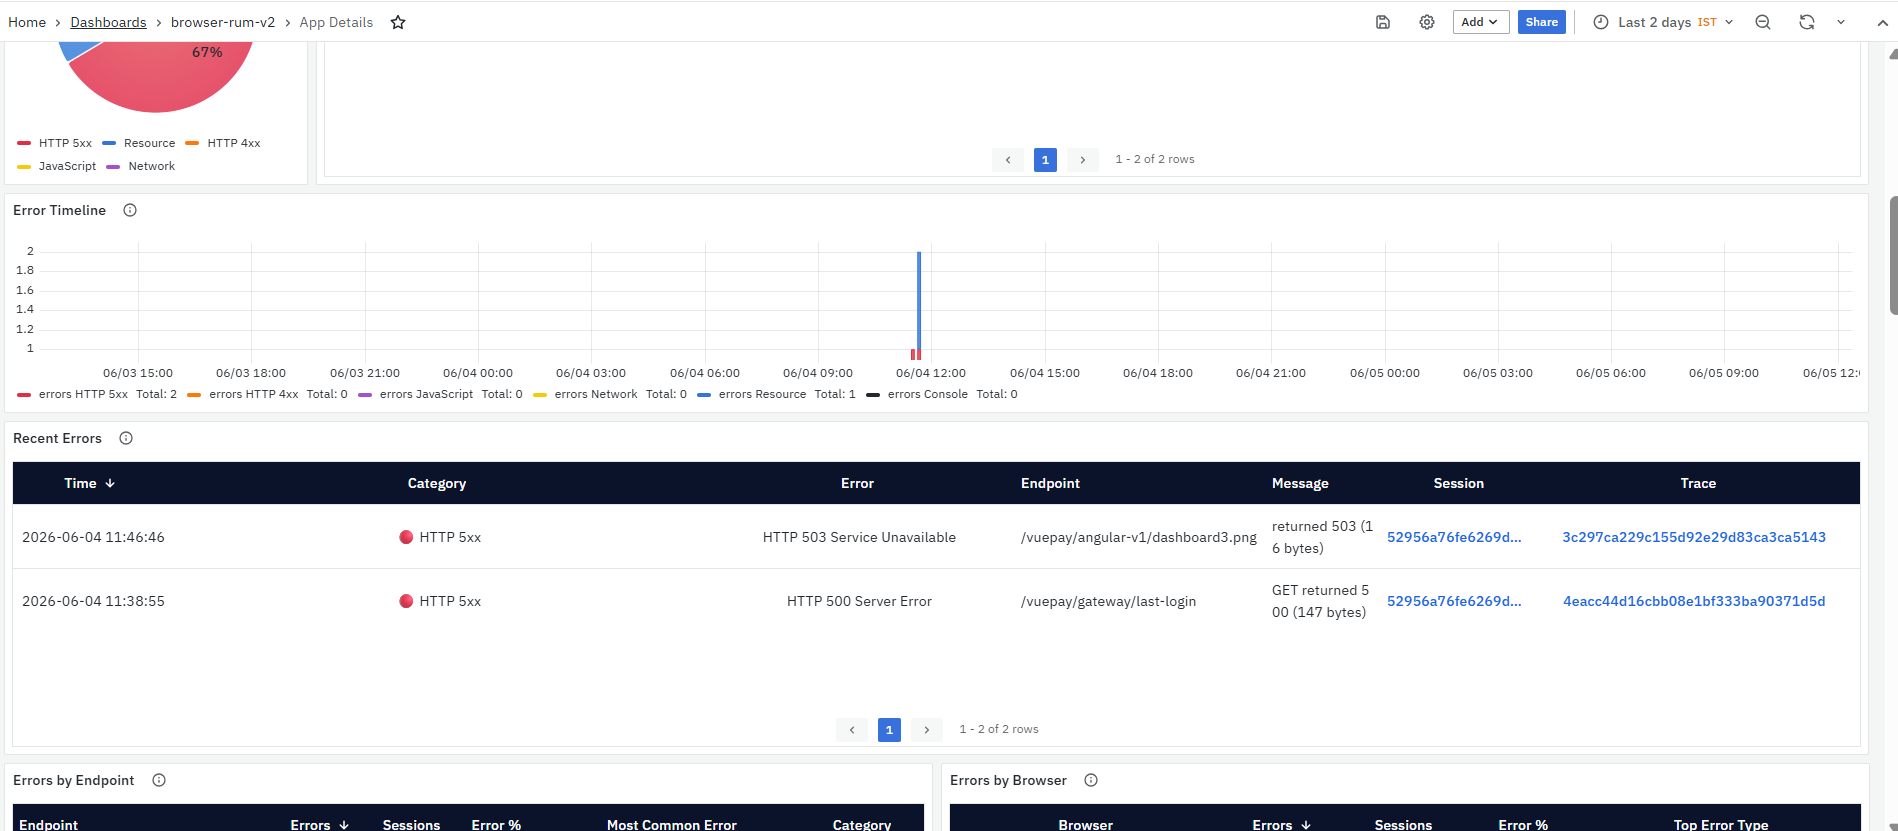
- Session: Displays the session identifier associated with the error. The Session value is clickable. When clicked, a context menu is displayed with the following options:
- View Session: Filters the dashboard sections based on the selected session and shows the related details for that session.
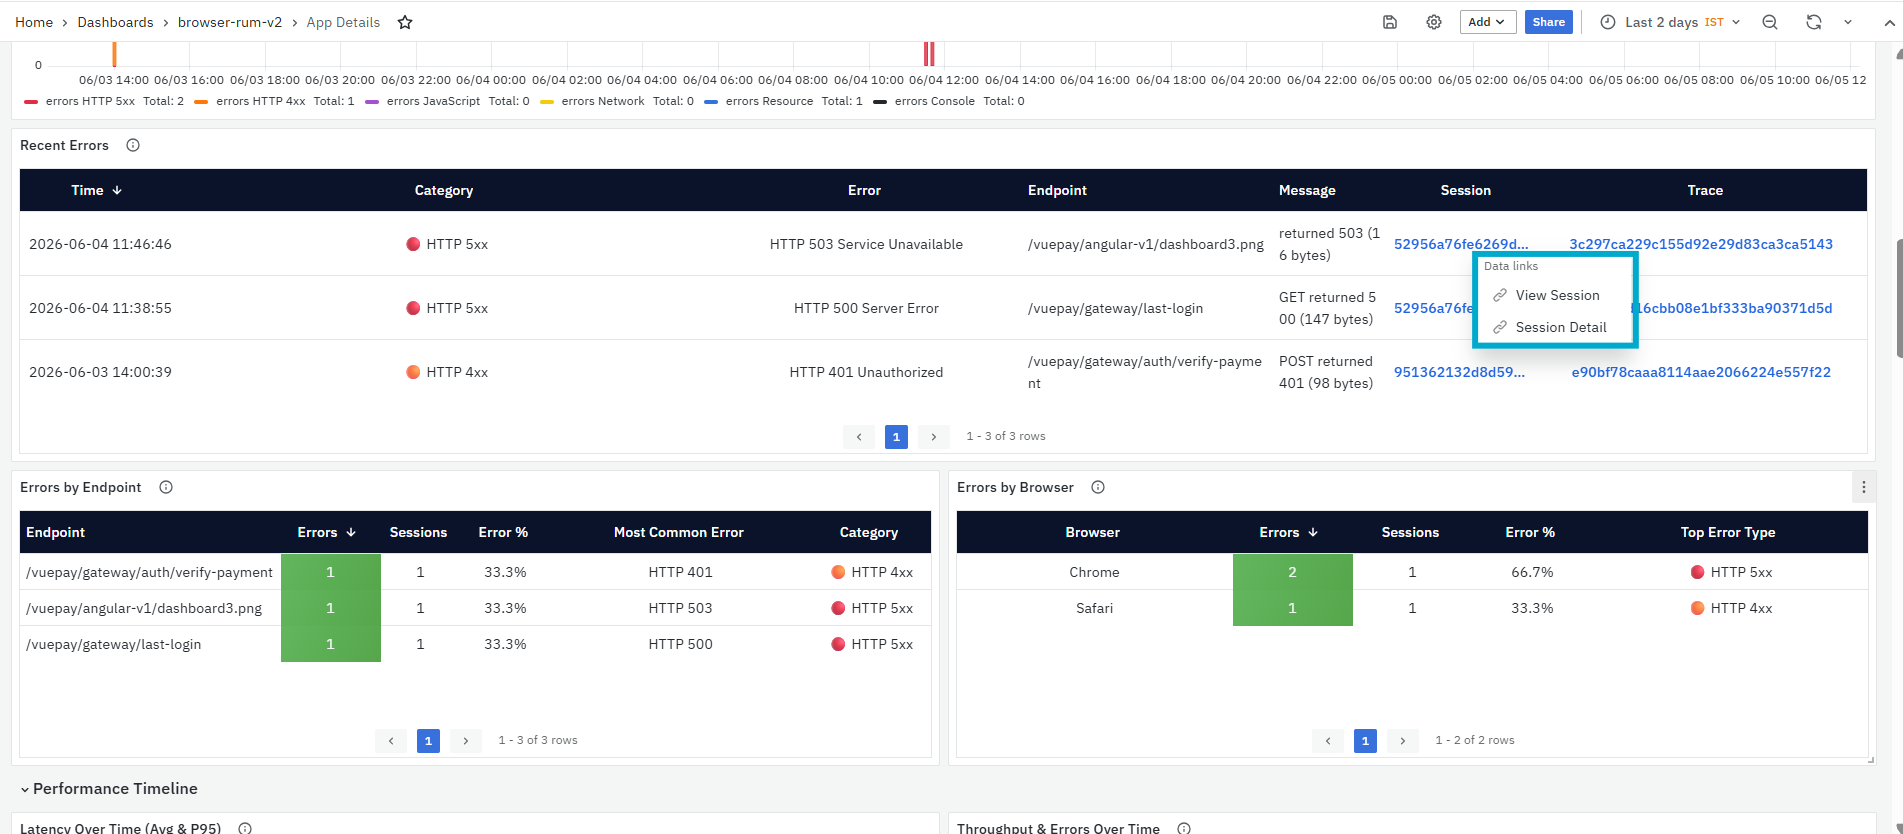
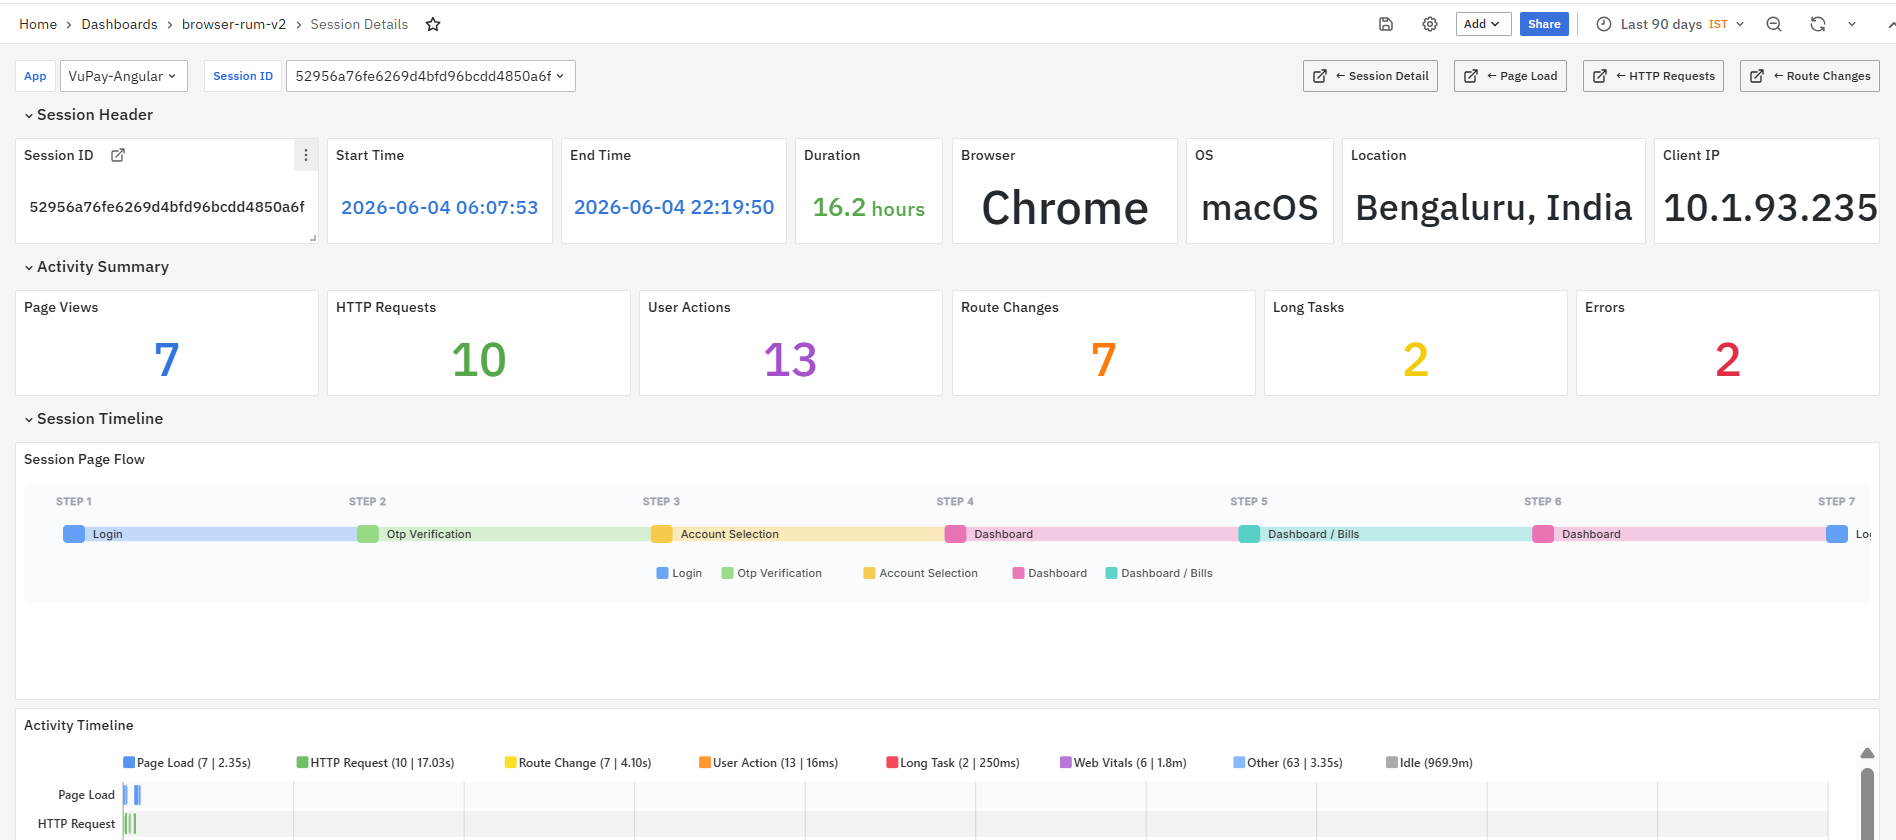
- Session Detail: Opens the Session Details dashboard for the selected session. This dashboard provides a detailed view of the selected user session, including session summary, activity timeline, performance overview, page views, HTTP requests, route changes, errors, network timing, and complete event timeline. To learn more about this page, refer to Session Details.
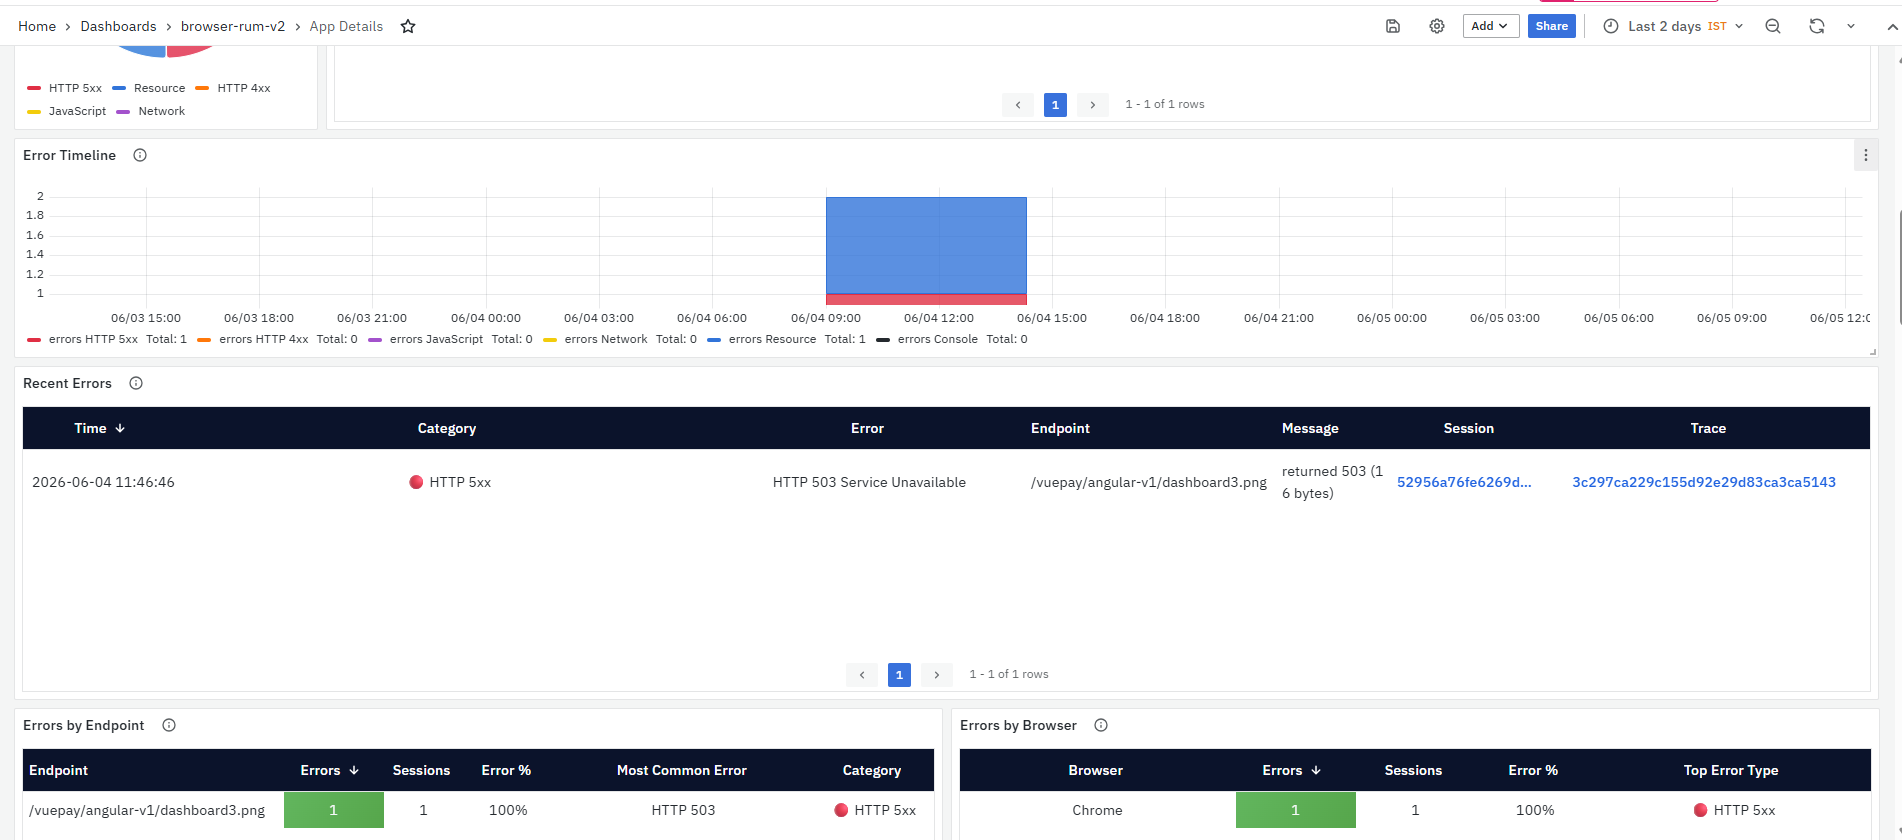
● Trace: Displays the trace identifier associated with the error. The Trace value is clickable. When clicked, a context menu is displayed with the following options:

- View Trace: Filters the dashboard sections based on the selected trace and shows the related details for that trace.

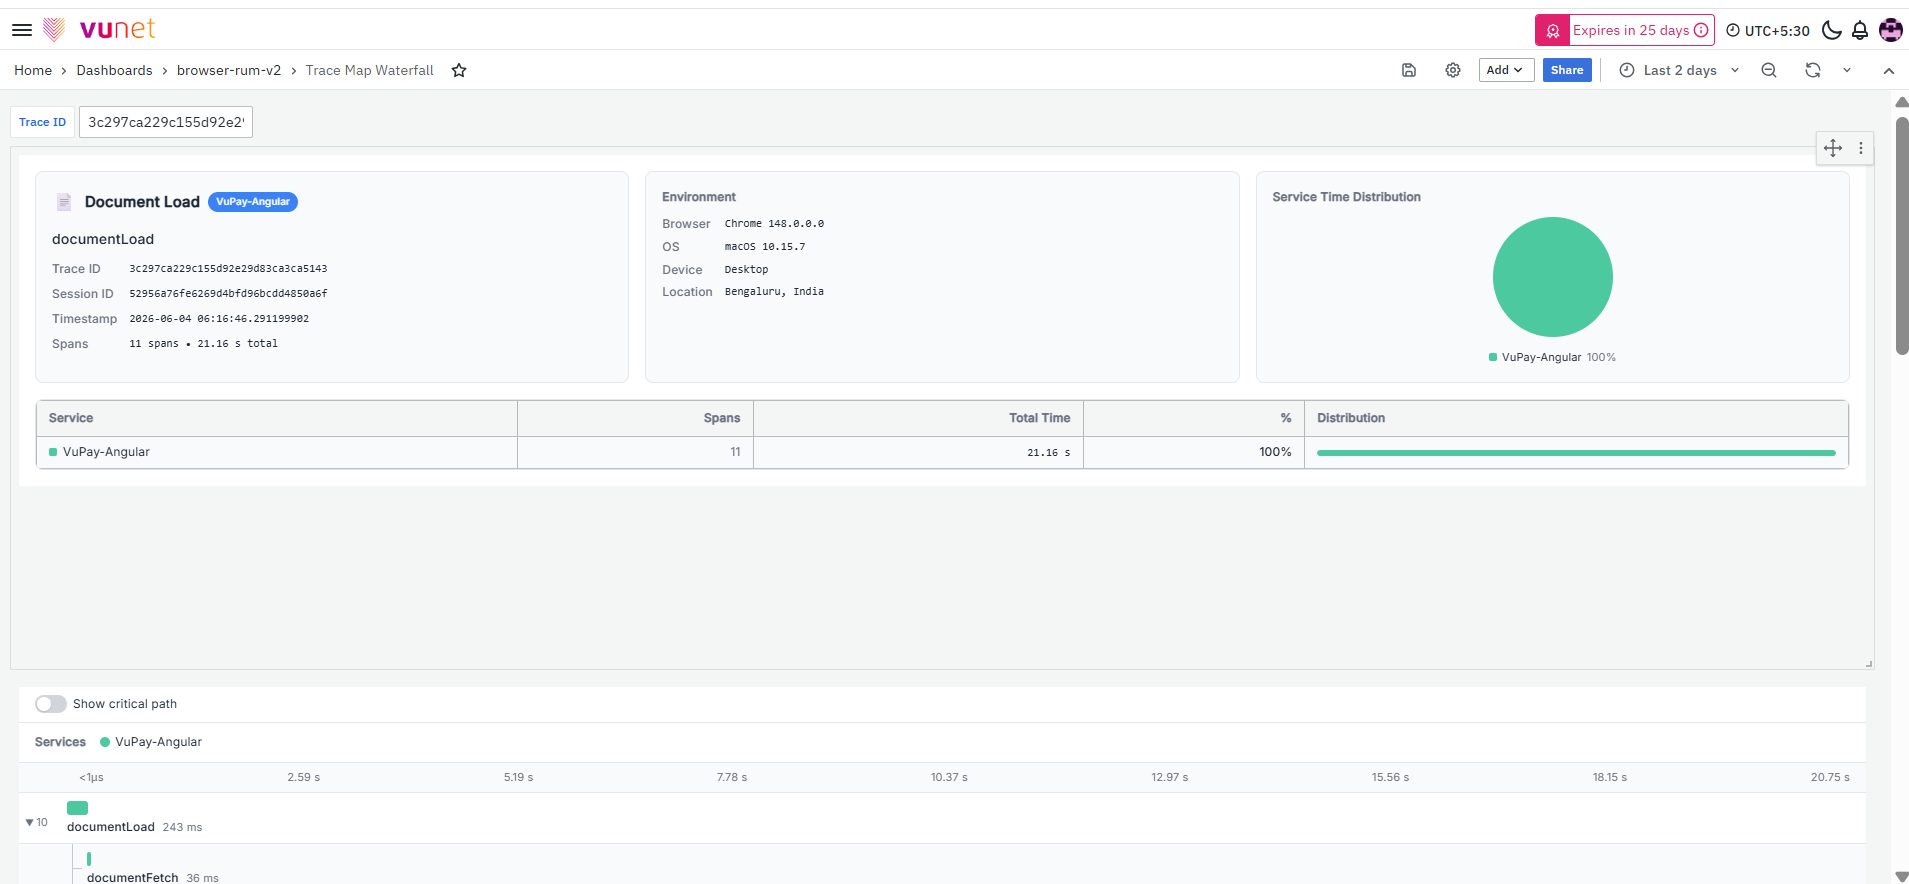
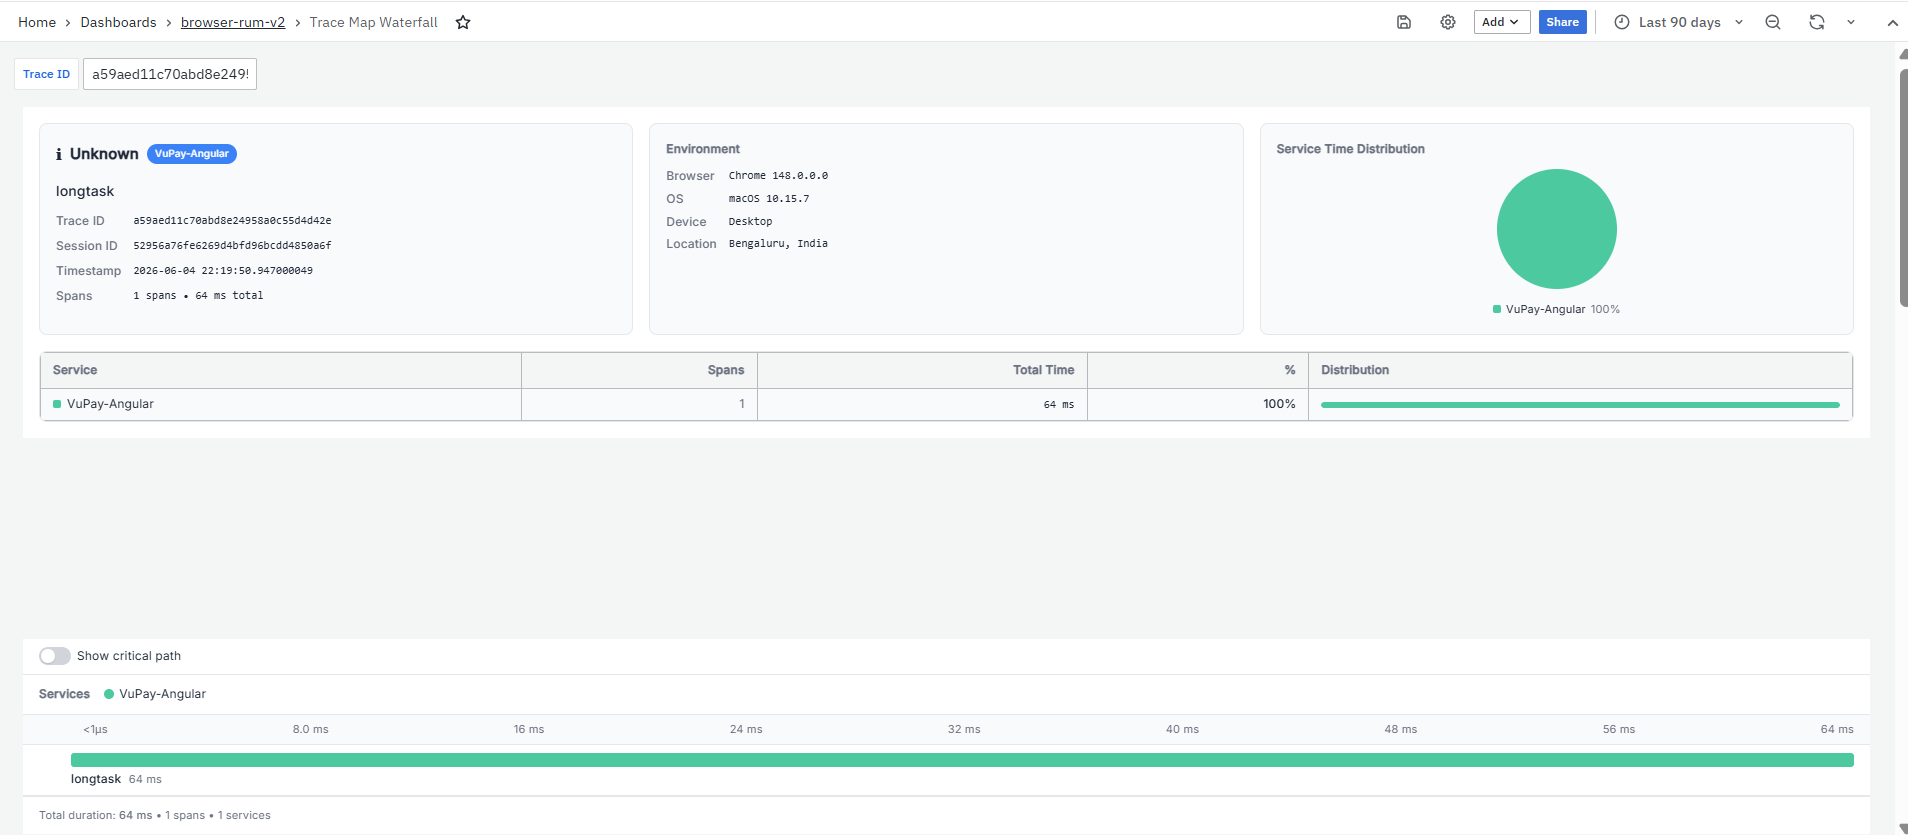
- View Trace Map: Opens the TraceMap Waterfall dashboard for the selected trace. This dashboard provides a waterfall-style view of the trace, including trace summary, environment details, service time distribution, span sequence, and execution duration. To learn more about this page, refer to TraceMap Waterfall.
Errors by Endpoint
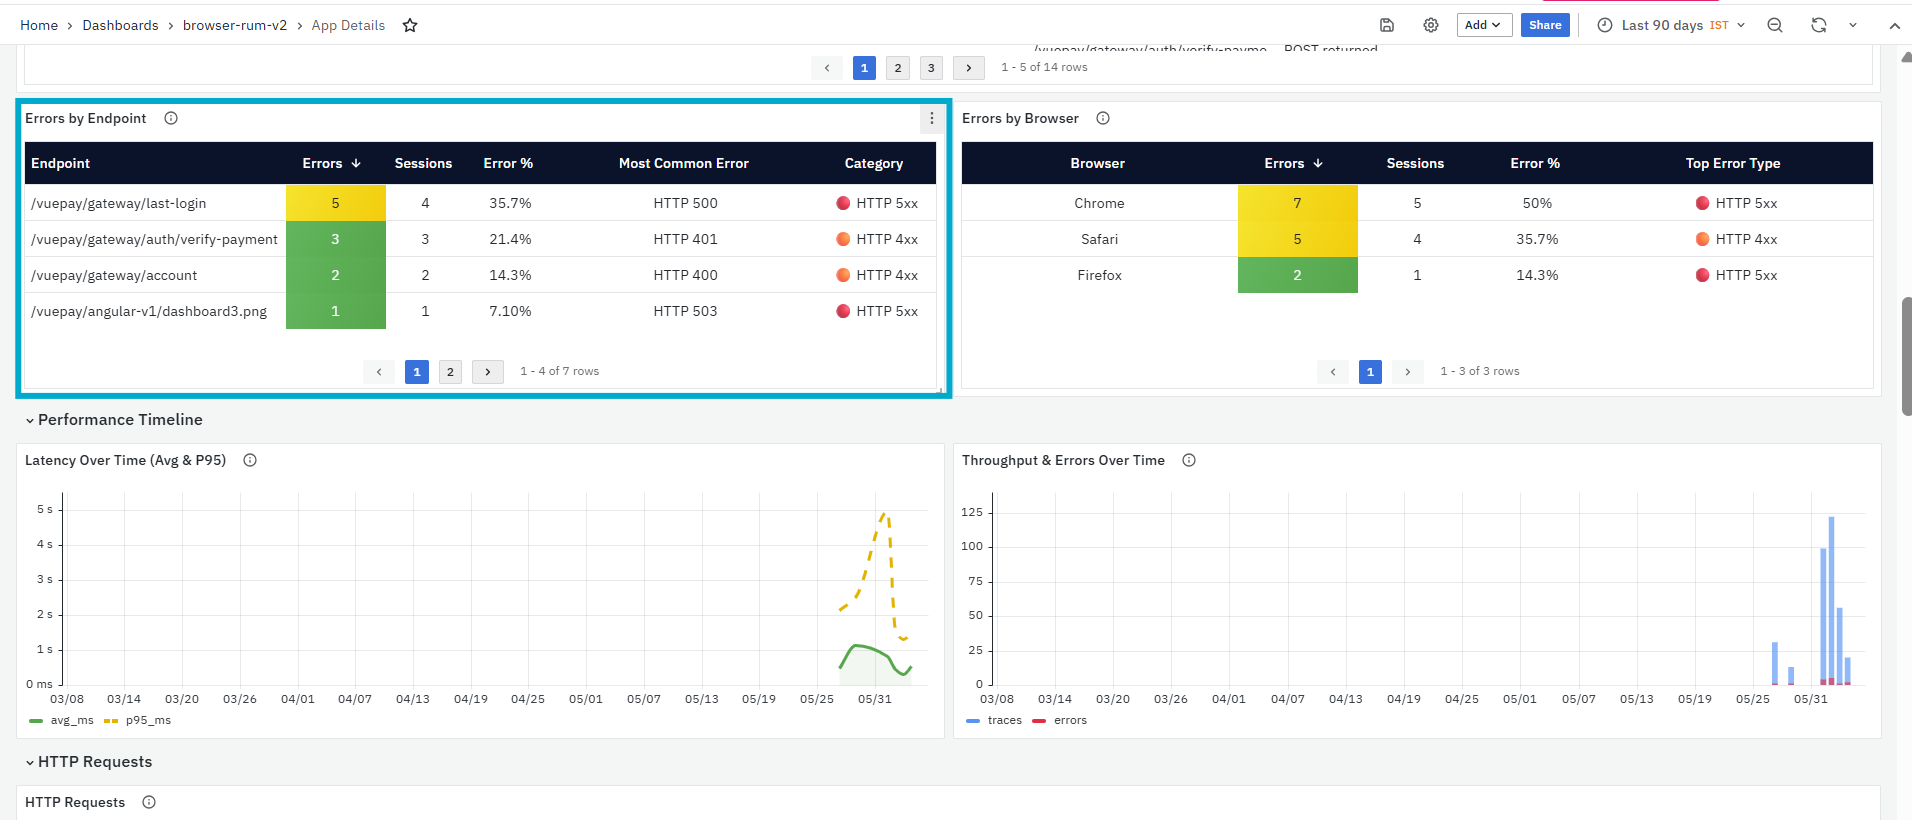
The Errors by Endpoint panel displays error metrics grouped by endpoint. This panel helps identify which endpoints are generating the most errors and how many sessions are affected.
 It helps you identify:
-
Endpoints with the highest number of errors
-
Endpoints with high error percentage
-
The most common error for each endpoint
-
API or page endpoints that need immediate attention
The panel includes the following columns:
-
Endpoint: Displays the affected endpoint.
-
Errors: Displays the number of errors.
-
Sessions: Displays the number of affected sessions.
-
Error %: Displays the error percentage.
-
Most Common Error: Displays the most frequent error for the endpoint.
-
Category: Displays the error category.
Errors by Browser
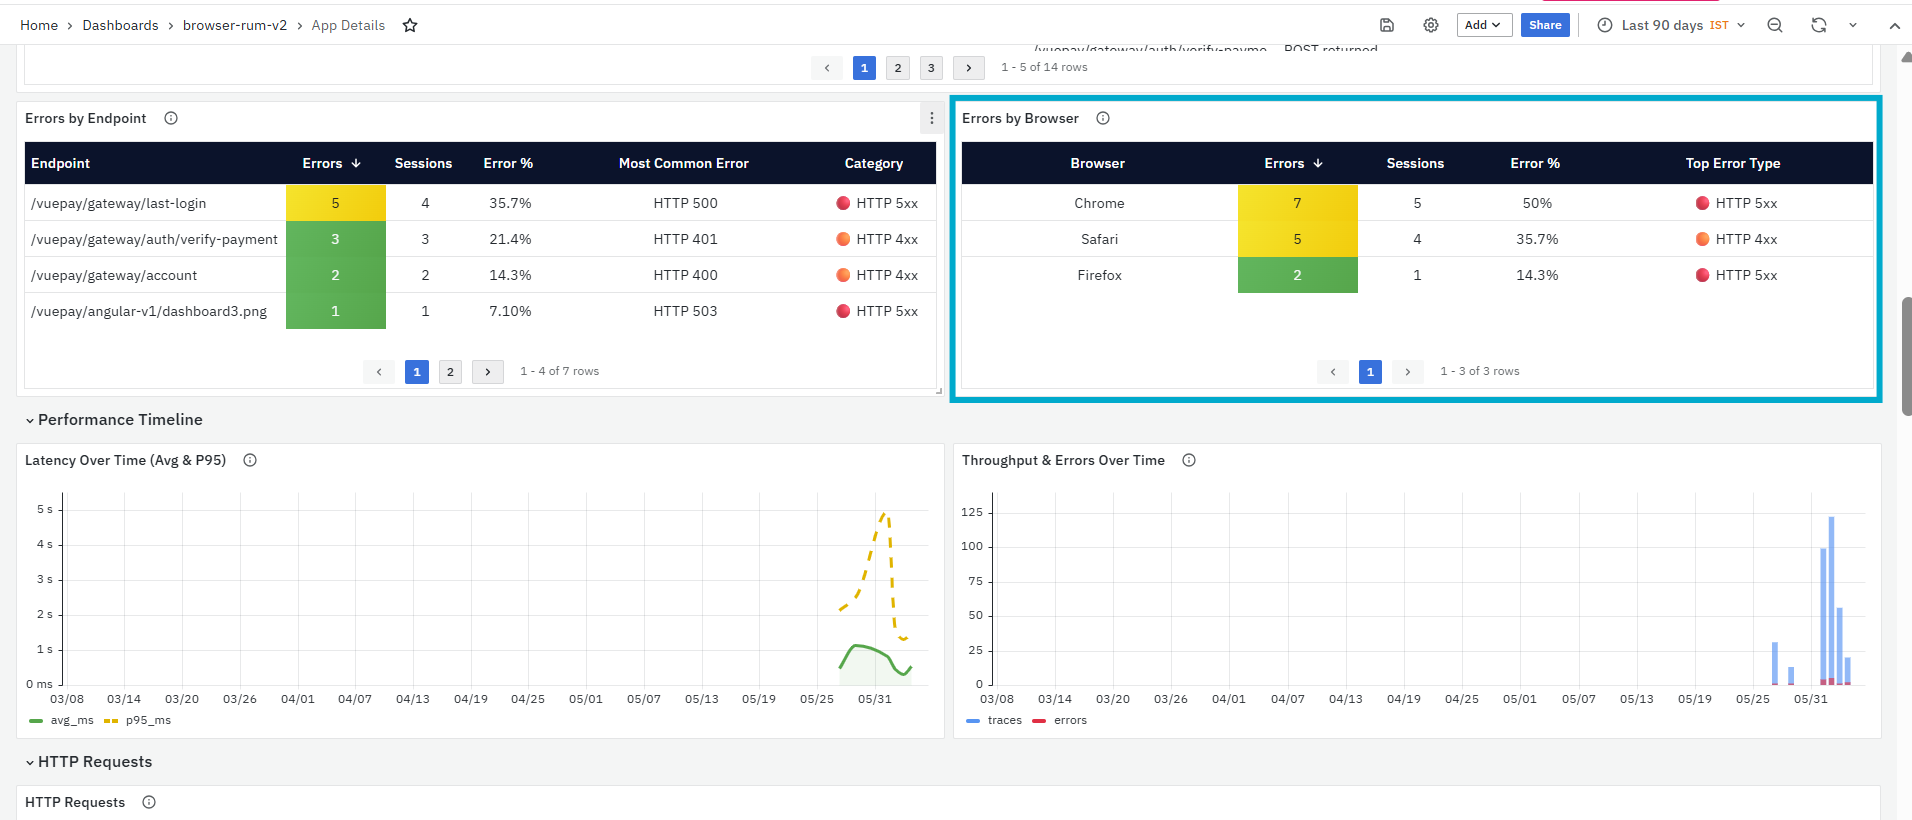
The Errors by Browser panel displays errors grouped by browser. This panel helps users identify whether errors are browser-specific or common across browsers.
It helps you identify:
-
Browsers with the highest error count
-
Browser-specific error patterns
-
Whether a browser is contributing to most of the errors
-
The top error type for each browser
The panel includes the following columns:
-
Browser: Displays the browser name.
-
Errors: Displays the number of errors.
-
Sessions: Displays the number of sessions.
-
Error %: Displays the error percentage.
-
Top Error Type: Displays the most common error type for the browser.
Performance Timeline
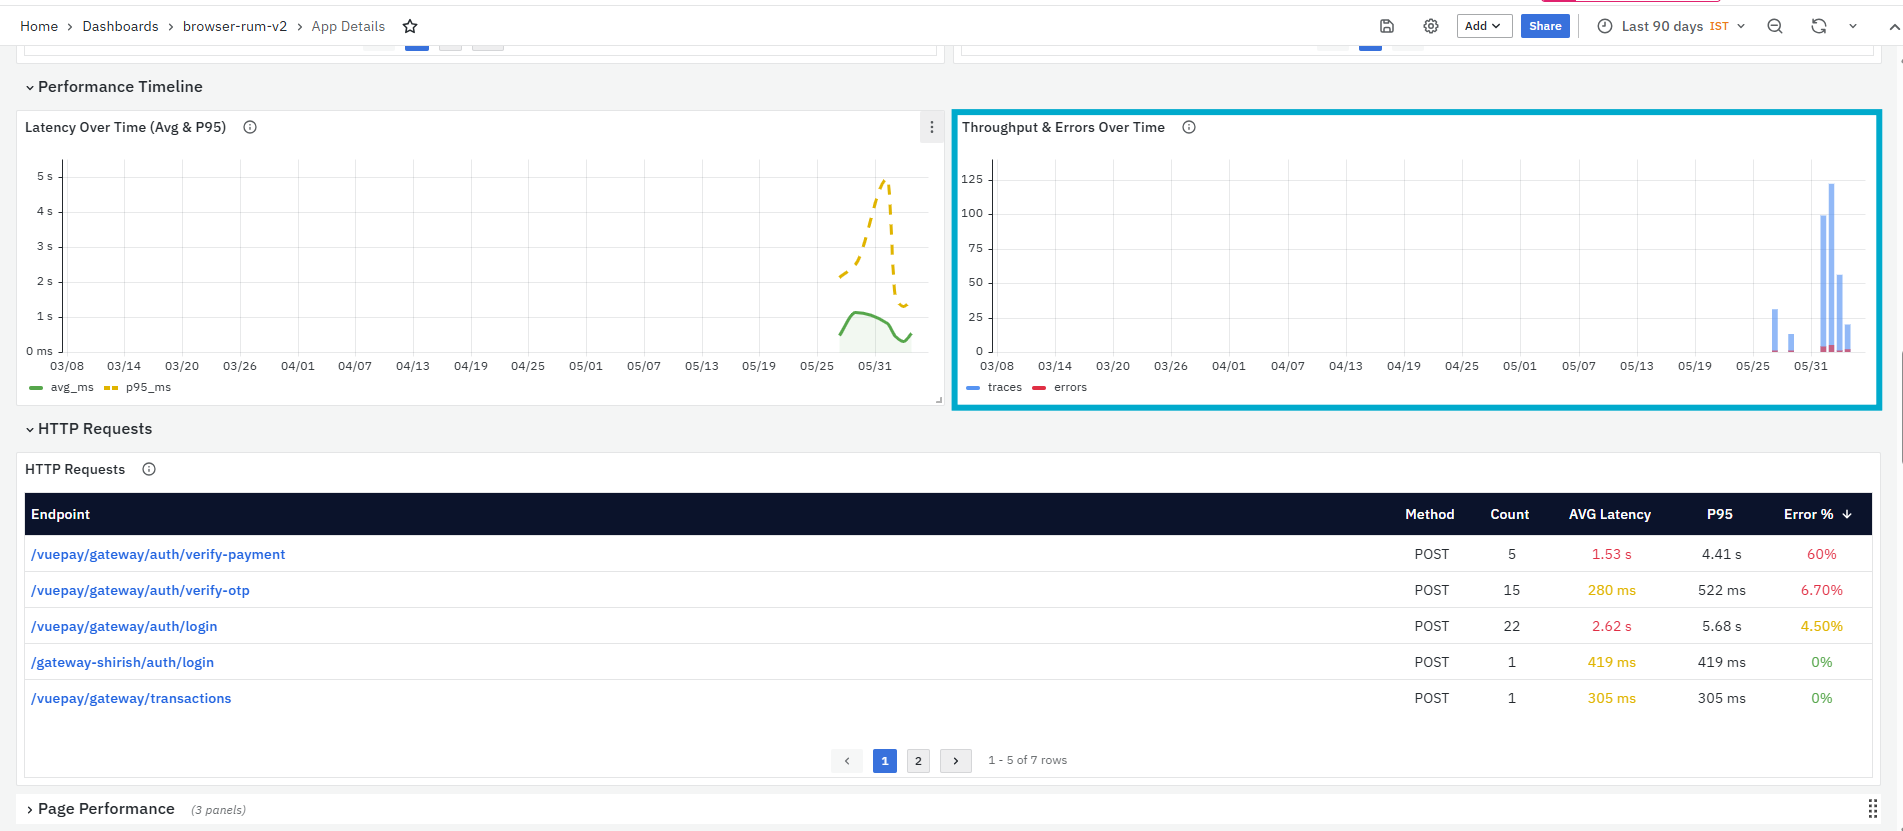
The Performance Timeline section displays how latency, request volume, and errors change over the selected time range. This section is primarily used to understand whether application performance is stable or whether users experienced slow responses or errors during specific periods.
This section includes two panels:
- Latency Over Time (Avg & P95)
- Throughput & Errors Over Time
Latency Over Time (Avg & P95)
The Latency Over Time (Avg & P95) panel visualizes how service latency changes over time. It compares average latency with P95 latency. Average latency shows the normal response time pattern for the application. P95 latency shows the latency value under which 95% of requests were completed.
It helps you identify:
- How latency changes across the selected time range
- Time periods where application response became slower
- Gaps between average latency and P95 latency
- Inconsistent performance affecting some users
- Whether high latency is occasional or recurring
Throughput & Errors Over Time
The Throughput & Errors Over Time panel displays request volume and error count over time. This panel helps users understand whether errors are related to traffic load. The panel displays throughput and errors together so that users can compare them easily. If errors increase during high-throughput periods, the application, API, or backend service may need further investigation.
It helps you identify:
- Request volume trends over time
- Error spikes during the selected time range
- Whether errors increase when traffic increases
- Possible capacity issues under higher load
- Problems that appear only during traffic spikes
HTTP Requests
The HTTP Requests section displays HTTP/API requests made by the selected application. The requests are grouped by endpoint URL and HTTP method.
This section includes one panel:
- HTTP Requests
HTTP Requests
The HTTP Requests panel lists all HTTP/API requests made by the application. It provides request count, average latency, P95 latency, and error percentage for each endpoint. This panel is primarily used to identify slow or failing API endpoints that may be affecting user experience.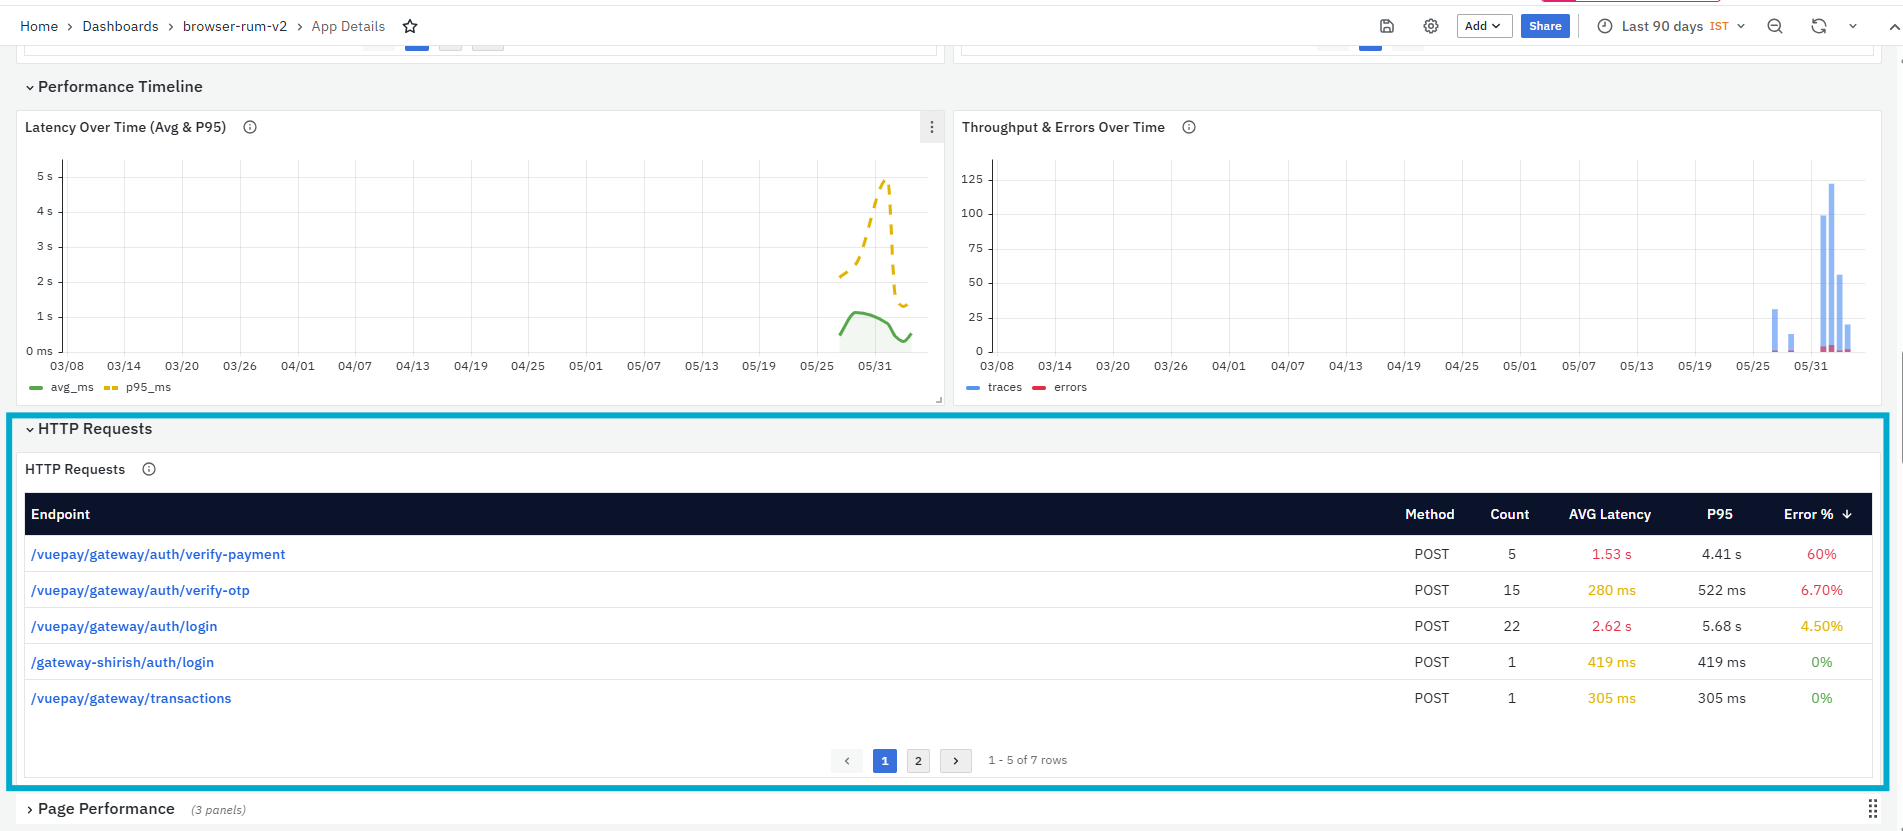
It helps you identify:
- API endpoints with high request volume
- Endpoints with high average latency
- Endpoints with high P95 latency
- Endpoints with high error percentage
- Slow or failing APIs used during page load, user actions, or background activity
The panel includes the following columns:
- Endpoint: Displays the HTTP/API endpoint called by the application. The endpoint value is clickable. When clicked, it opens the HTTP Request Details dashboard for the selected endpoint.
-
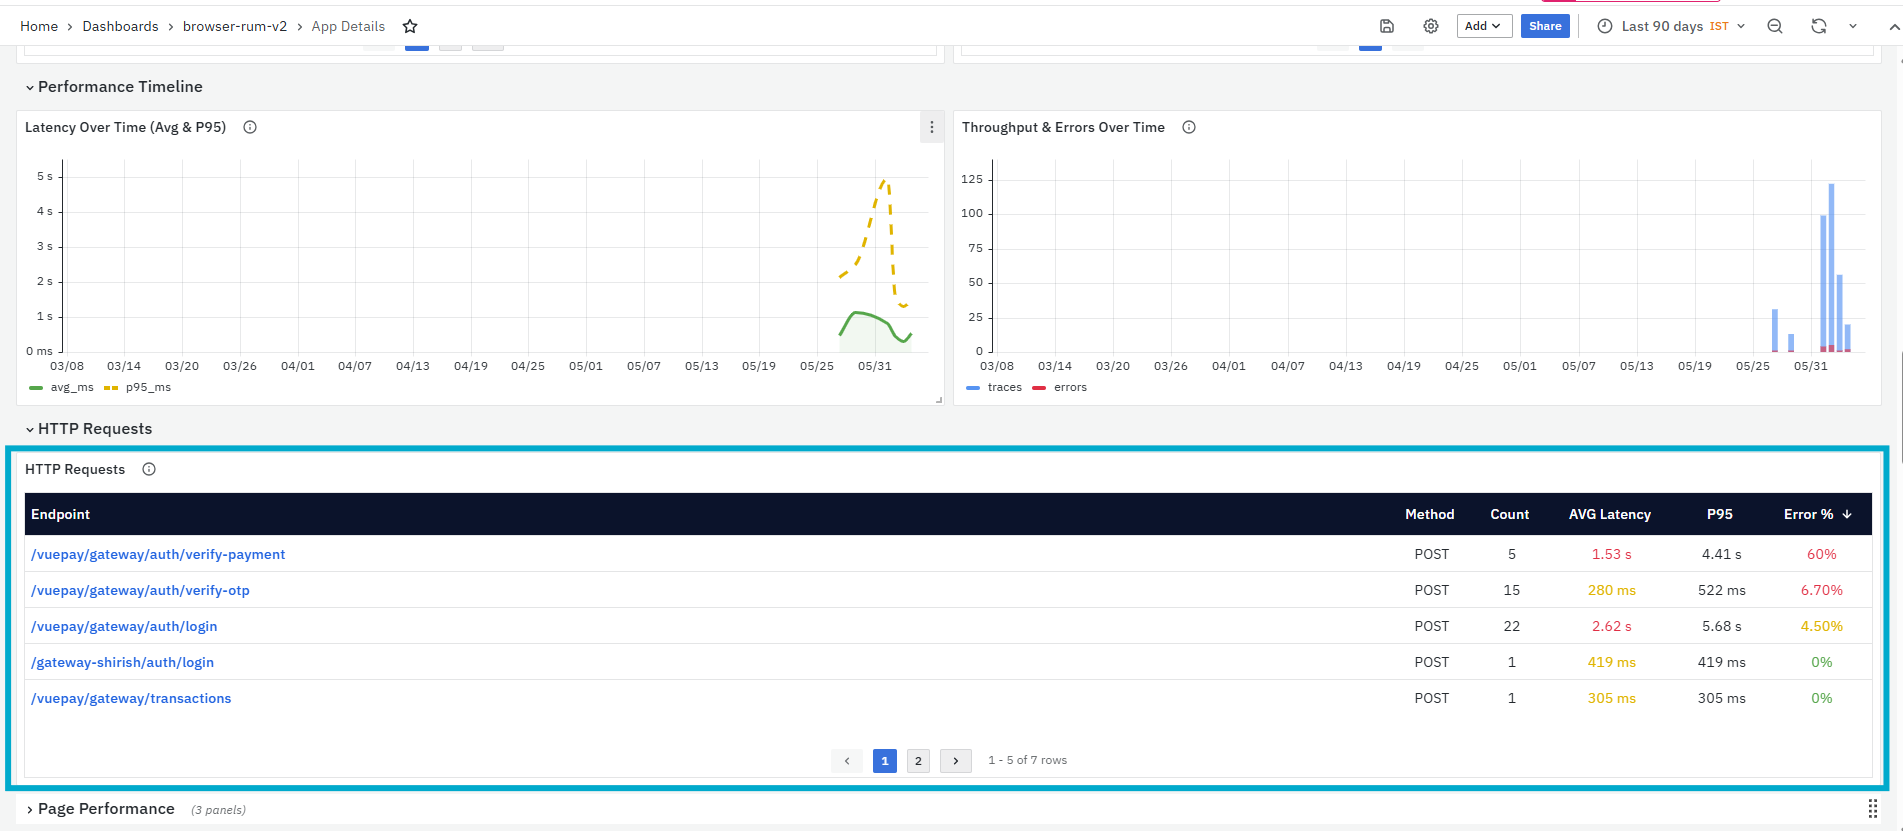
HTTP Request Details - This dashboard provides a detailed view of the selected HTTP request, including total requests, latency, P95 latency, error rate, 4xx/5xx rate, throughput, timing breakdown, performance trends, context analysis, endpoint analysis, error analysis, user segments, and recent requests. To learn more about this page, refer to HTTP Request Details.
-
Method: Displays the HTTP method used for the request, such as GET or POST.
-
Count: Displays the total number of requests made to the endpoint.
-
AVG Latency: Displays the average response time for the endpoint.
-
P95: Displays the 95th percentile latency for the endpoint. This helps identify slower responses that may affect some users.
-
Error %: Displays the percentage of requests that resulted in errors.
Page Performance
The Page Performance section provides page-level performance details for the selected application. It helps users understand how each page loads, which web vitals are affected, and which resources are slowing down page performance.

This section includes three panels:
- Page Load Performance (With Web Vitals)
- Page Load Time Breakdown
- Slowest Resources
Page Load Performance (With Web Vitals)
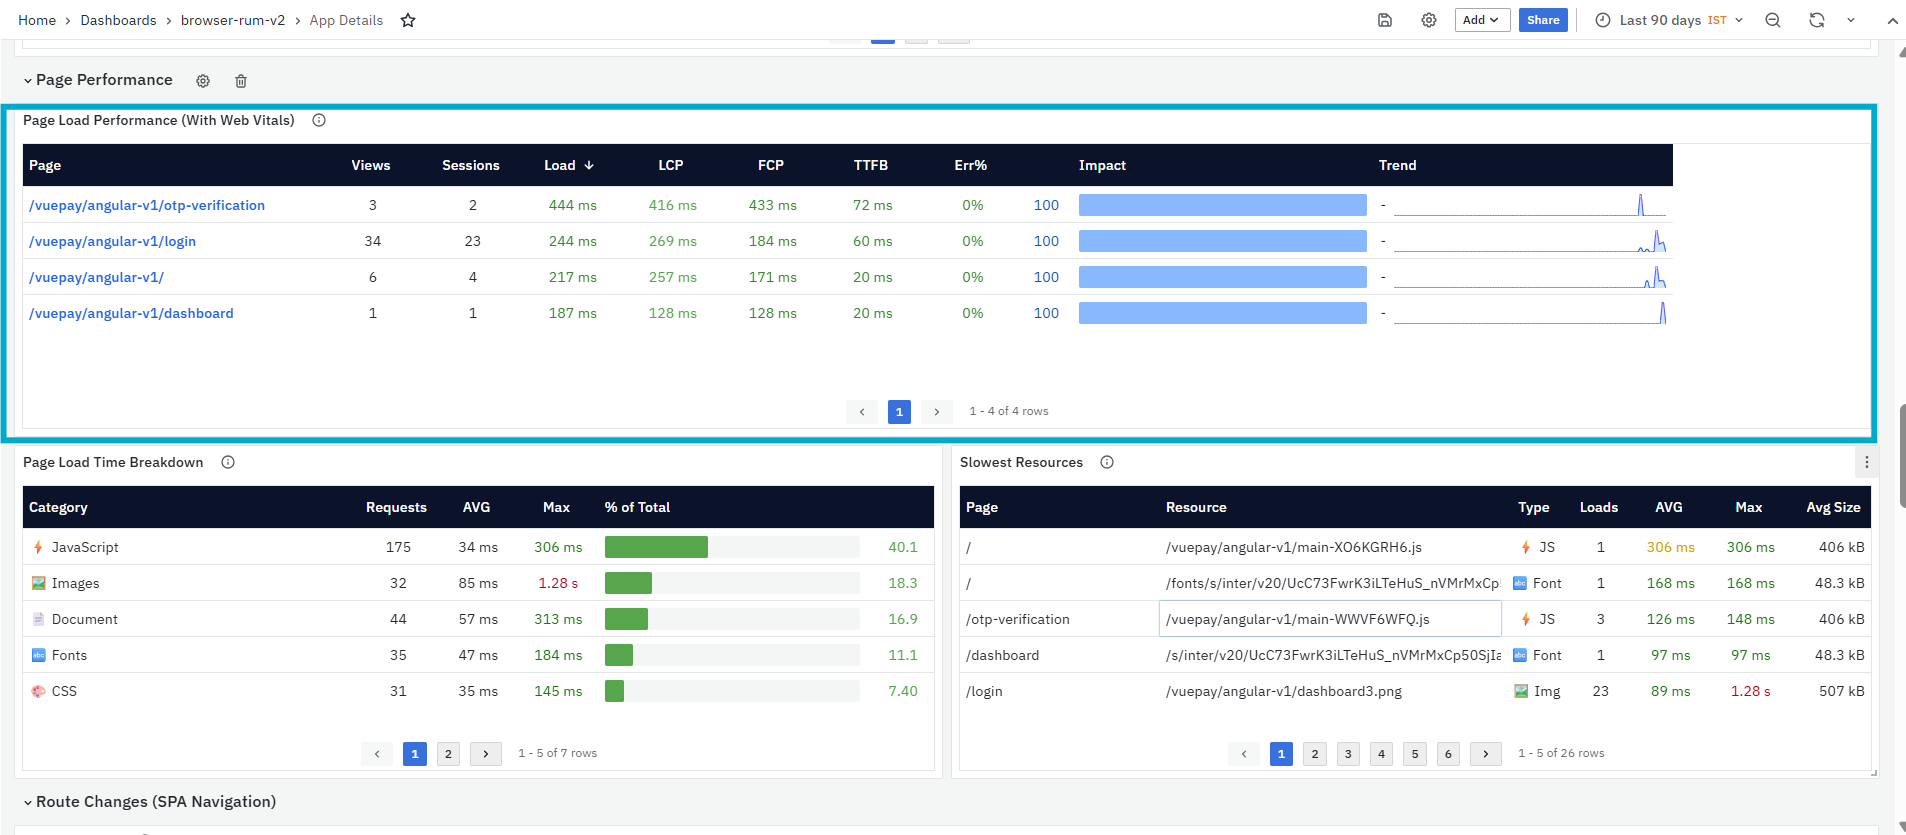
The Page Load Performance (With Web Vitals) panel displays detailed performance metrics for each page in the application. It includes load time, web vitals, error percentage, impact score, and trend information. This panel is primarily used to identify slow pages and understand which pages are affecting the overall browser experience.
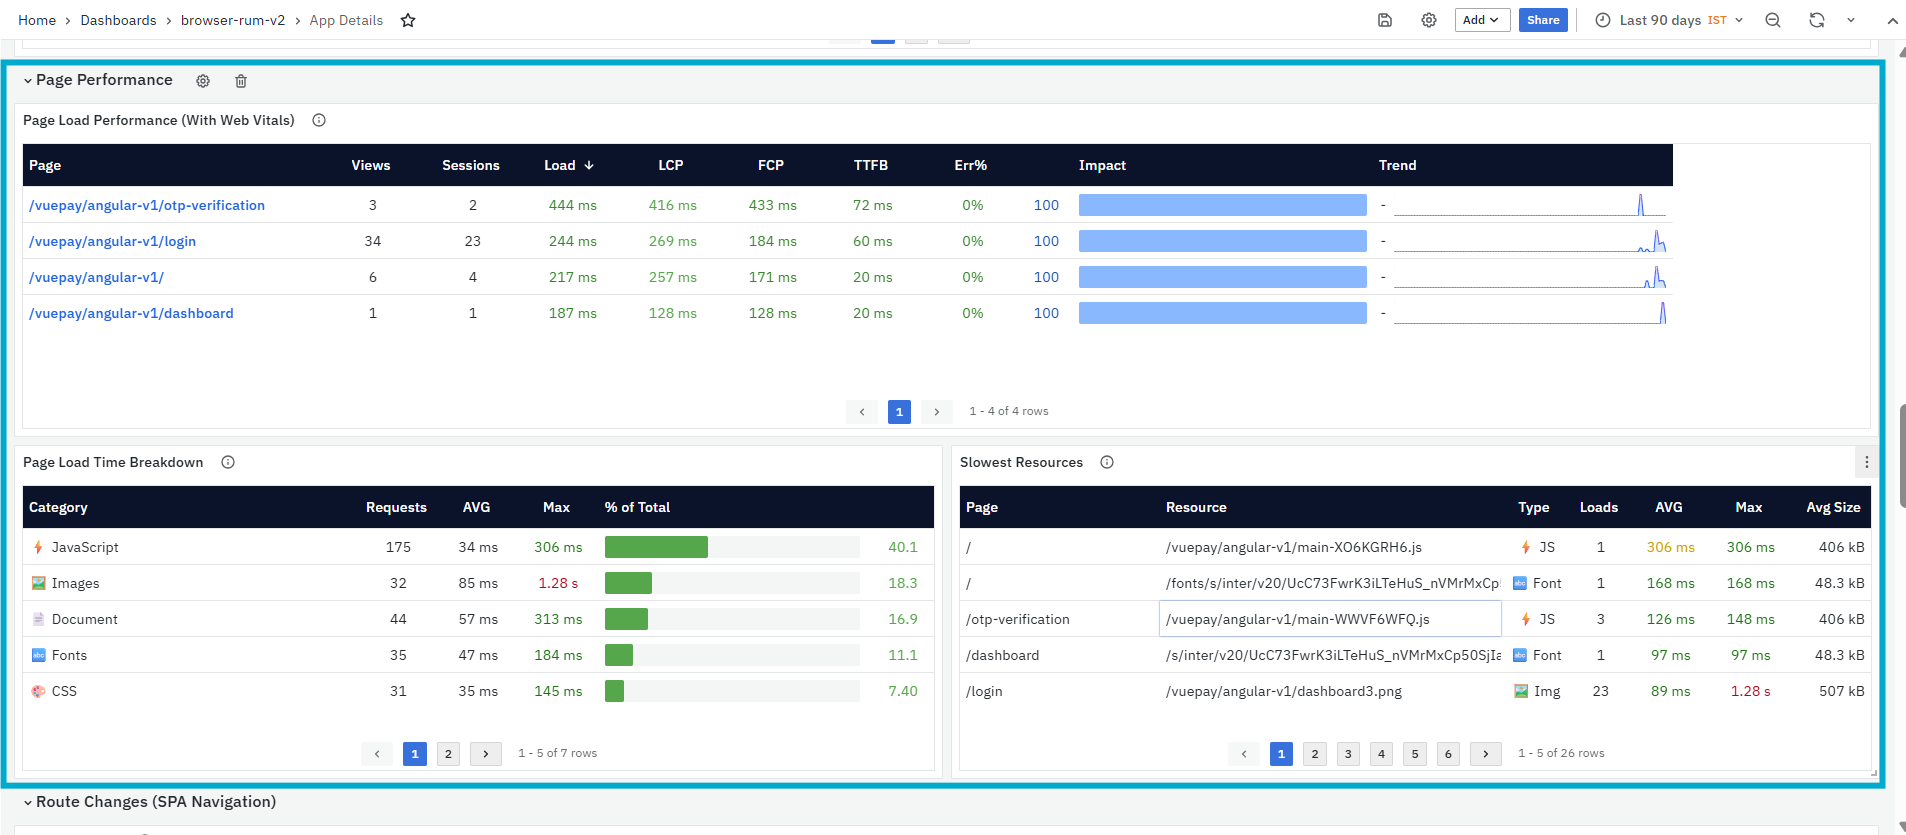
It helps you identify:
-
Pages with high load time
-
Pages with poor web vitals
-
Pages with error impact
-
Pages that contribute more to degraded user experience
-
Page traffic trends over the selected time range
The panel includes the following columns:
- Page: Displays the page or route name. The Page value is clickable. When clicked, it opens the Page Load Details dashboard for the selected page.
-
The Page Load Details dashboard provides a detailed view of the selected page’s browser performance. It includes page views, unique sessions, average load time, P95 load time, error rate, LCP good rate, core web vitals, error analysis, page loading breakdown, resource loading analysis, HTTP requests, user segments, recent page loads, trace waterfall, and page-load sessions. To learn more about this page, refer to Page Load Details.
-
Views: Displays the number of times the page was viewed during the selected time range. This helps identify high-traffic pages.
-
Sessions: Displays the number of user sessions in which the page was accessed. This helps understand how many user sessions were affected by the page performance.
-
Load: Displays the page load time.
-
LCP: Displays Largest Contentful Paint. This indicates how long it takes for the largest visible content element to load.
-
FCP: Displays First Contentful Paint. This indicates how long it takes for the first visible content to appear.
-
TTFB: Displays Time To First Byte. This indicates how long the browser waits before receiving the first byte of response from the server.
-
Err%: Displays the error percentage for the page.
-
Impact: Displays the impact score for the page. A higher impact value indicates that the page has a stronger effect on overall application performance.
-
Trend: Displays a sparkline showing how the page traffic changed during the selected time period.
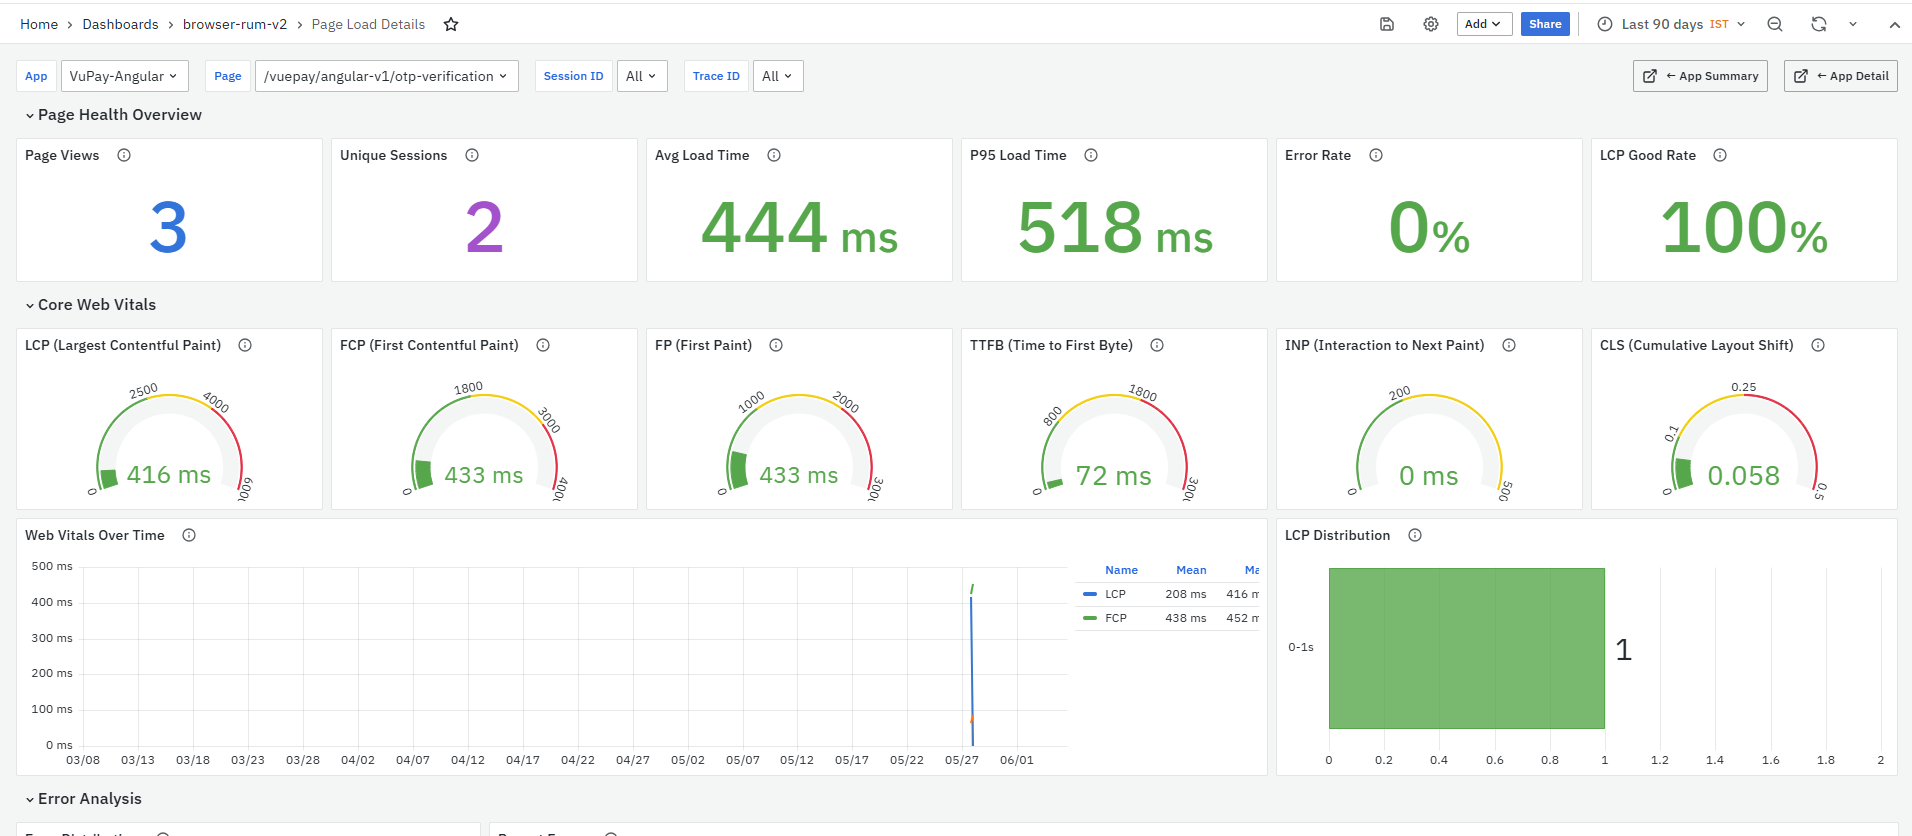
Page Load Time Breakdown
The Page Load Time Breakdown panel breaks down page load time by resource type. Resource types may include JavaScript, CSS, fonts, images, documents, and API calls. This panel is primarily used to understand which type of resource is contributing most to page load time.
It helps you identify:
-
Resource types that take the most time to load
-
Whether JavaScript, CSS, images, fonts, or documents are slowing down the page
-
Resource categories contributing the highest percentage of load time
-
Frontend optimization opportunities
-
Areas where code splitting, compression, caching, or lazy loading may help
The panel includes the following columns:
-
Category: Displays the type of resource, such as Font, Image, JavaScript, Document, or CSS.
-
Requests: Displays the number of requests made for that resource type.
-
AVG: Displays the average load time for that resource type.
-
Max: Displays the maximum load time observed for that resource type.
-
% of Total: Displays how much that resource type contributes to the total page load time.
Slowest Resources
The Slowest Resources panel lists the individual resources that take the longest time to load across pages. These resources can include scripts, stylesheets, fonts, images, and documents. This panel is primarily used to identify specific files that are slowing down the page.
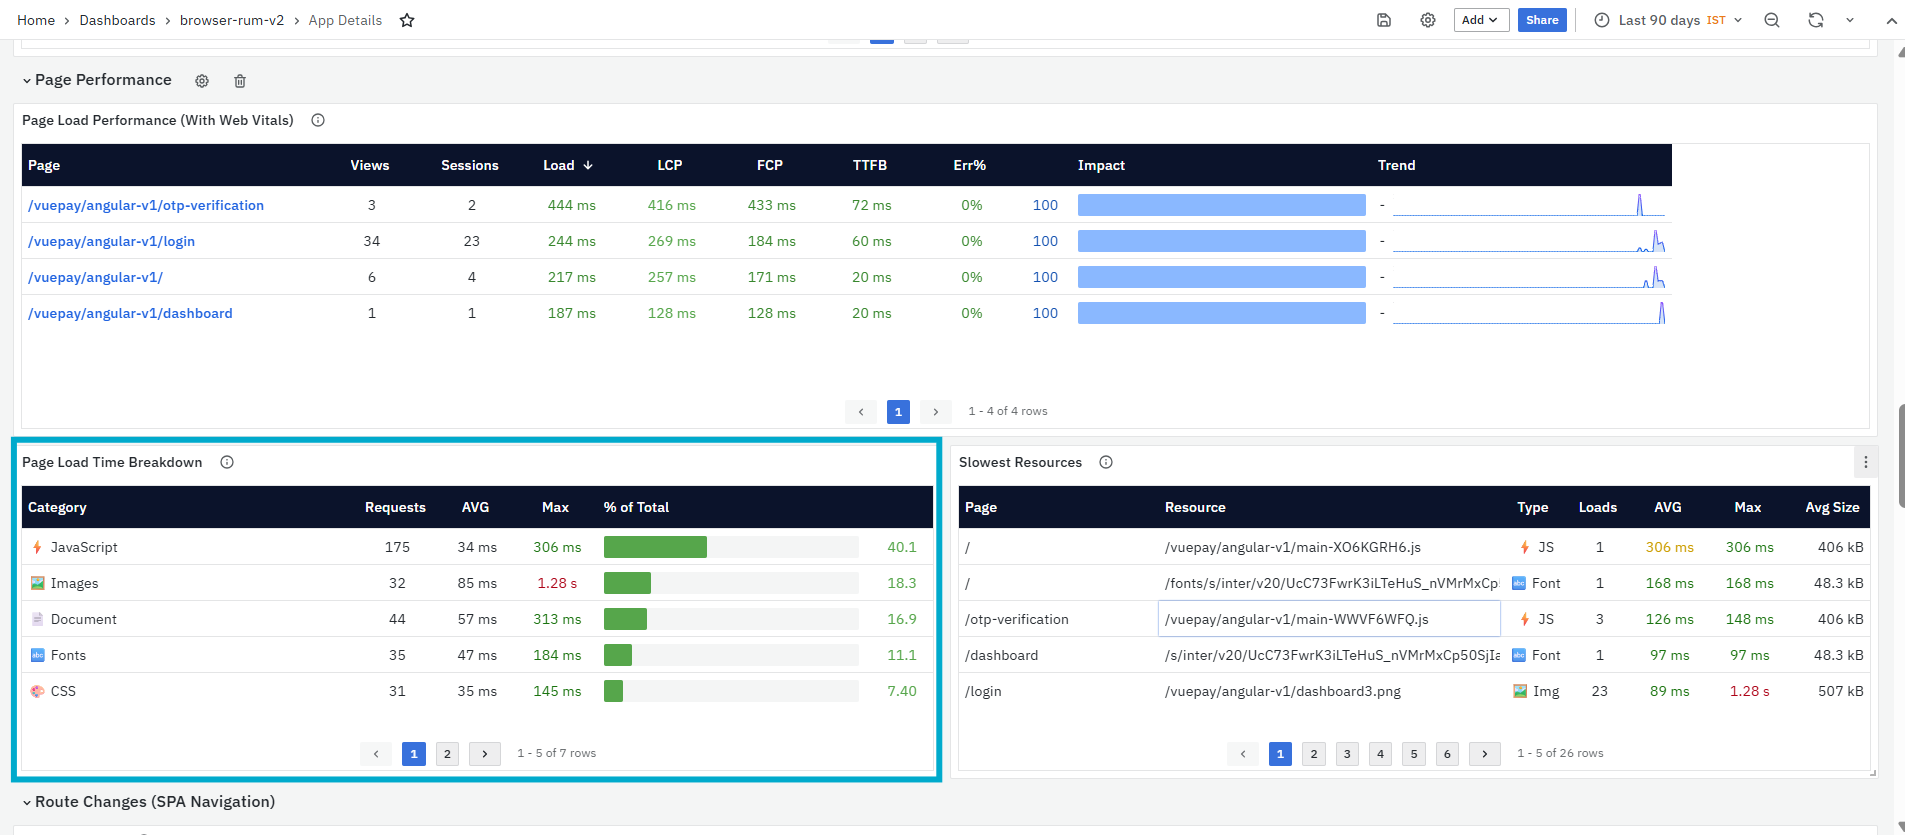
It helps you identify:
-
Individual resources with high load time
-
Slow scripts, stylesheets, fonts, images, or documents
-
Resources with high maximum load time
-
Large files that may need compression
-
Resources that can be optimized or lazy-loaded
The panel includes the following columns:
-
Resource: Displays the resource file name or resource path.
-
Page: Displays the page where the resource was loaded.
-
Type: Displays the resource type, such as Font, Img, JS, Doc, or CSS.
-
Loads: Displays how many times the resource was loaded.
-
AVG: Displays the average load time for the resource.
-
Max: Displays the maximum load time observed for the resource.
-
Avg Size: Displays the average size of the resource.
Route Changes (SPA Navigation)
The Route Changes (SPA Navigation) section displays route-level navigation performance for Single Page Applications. In a Single Page Application, users can move between different views or pages without a full page reload. This section helps users understand how those route changes perform and whether any route is slow, error-prone, or frequently accessed.

This section includes one panel:
- Route Changes
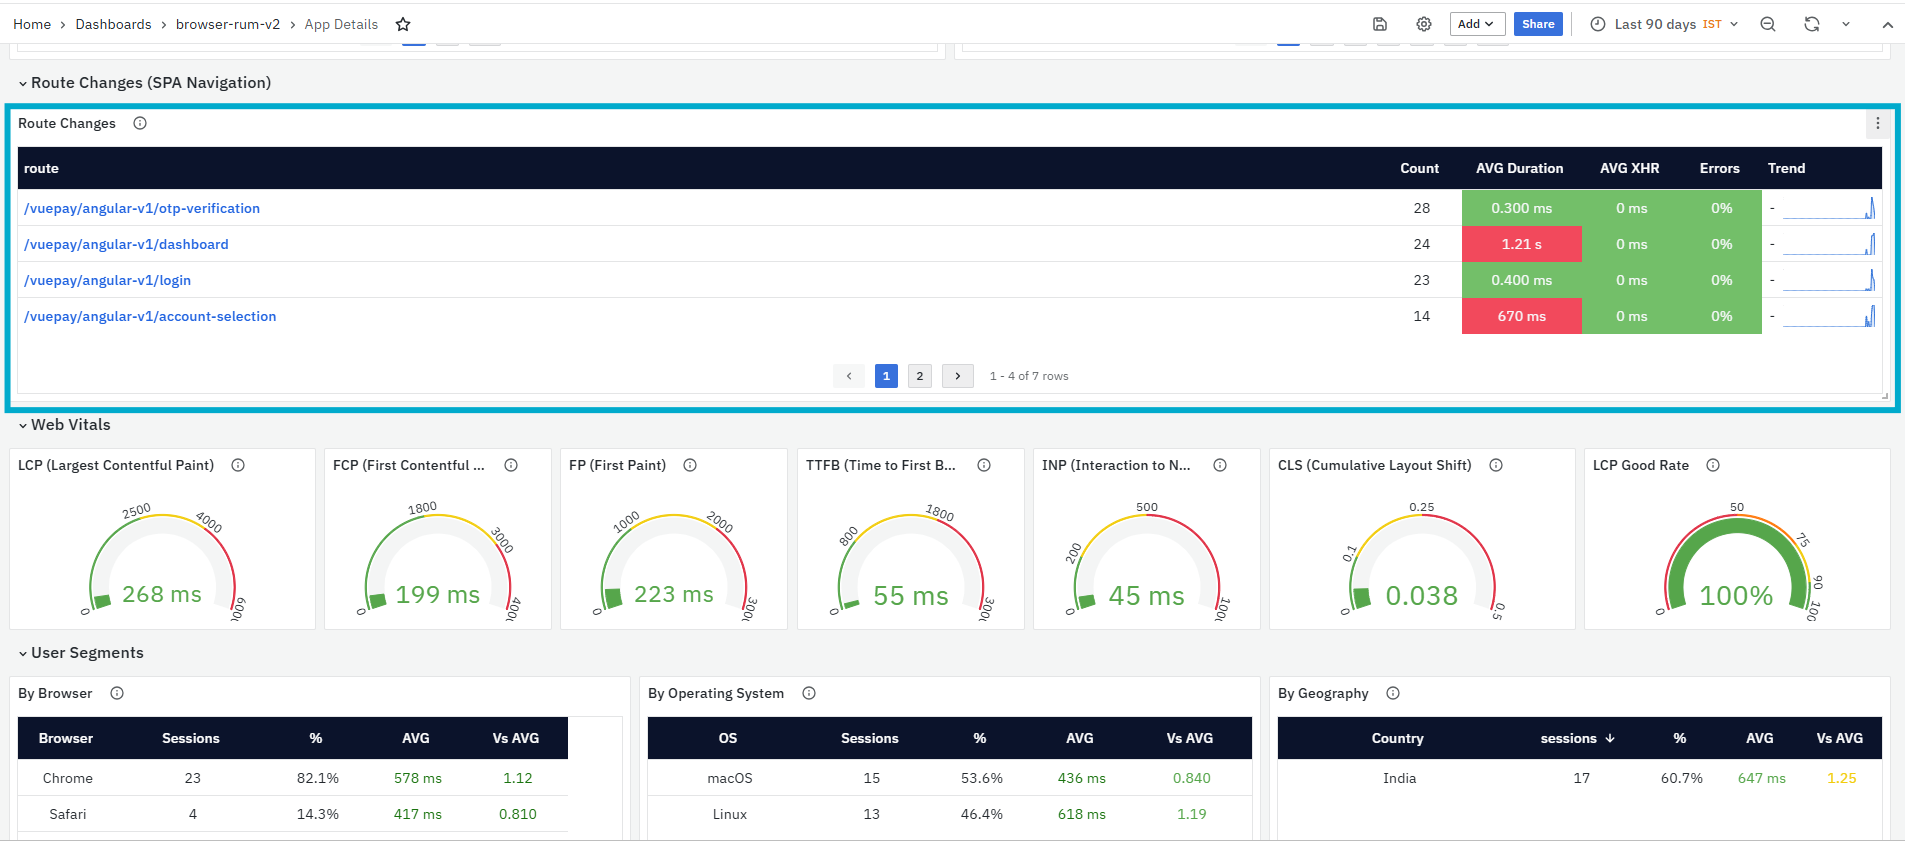
Route Changes
The Route Changes panel lists all Single Page Application route changes captured for the selected application and time range. It shows the route path, how often the route was accessed, the average navigation duration, XHR/API time, error percentage, and navigation trend.
This panel is primarily used to analyze frontend navigation performance in applications where users move between pages without reloading the browser page.
It helps you identify:
-
Routes that are accessed most frequently
-
Routes with high average navigation duration
-
Routes where API/XHR calls are contributing to delay
-
Routes with errors during navigation
-
Navigation patterns over the selected time range
-
Routes that may need performance optimization
The panel includes the following columns:
- route: Displays the SPA route or page path accessed by users. The route value is clickable. When clicked, it opens the Route Change Details dashboard for the selected route.
-
Route Change Details - Provides a detailed view of the selected route navigation. It includes key metrics such as total navigations, average duration, P95 duration, and error rate. It also shows timing breakdown, navigation duration trend, HTTP request details, navigation flow, and user segments. To learn more about this page, refer to Route Change Details.
-
Count: Displays how many times the route change occurred during the selected time range. A higher count indicates that the route is frequently accessed.
-
AVG Duration: Displays the average time taken to complete the route change. This helps identify slow navigation experiences. A higher value indicates that users may be waiting longer while moving to that route.
-
AVG XHR: Displays the average time spent on XHR/API calls during the route change. This helps identify whether backend/API calls are contributing to route delay.
-
Errors: Displays the error percentage for the route. This helps identify whether users faced errors while navigating to or using that route.
-
Trend: Displays a sparkline that shows route navigation frequency over time. This helps users understand whether the route was accessed consistently or had sudden spikes.
Web Vitals
The Web Vitals section displays browser-side user experience metrics for the selected application. These metrics help users understand how quickly the page loads, how soon users can see content, how responsive the page is after user interaction, and whether the page layout remains stable. This section is primarily used to identify frontend performance issues that can directly affect user experience.
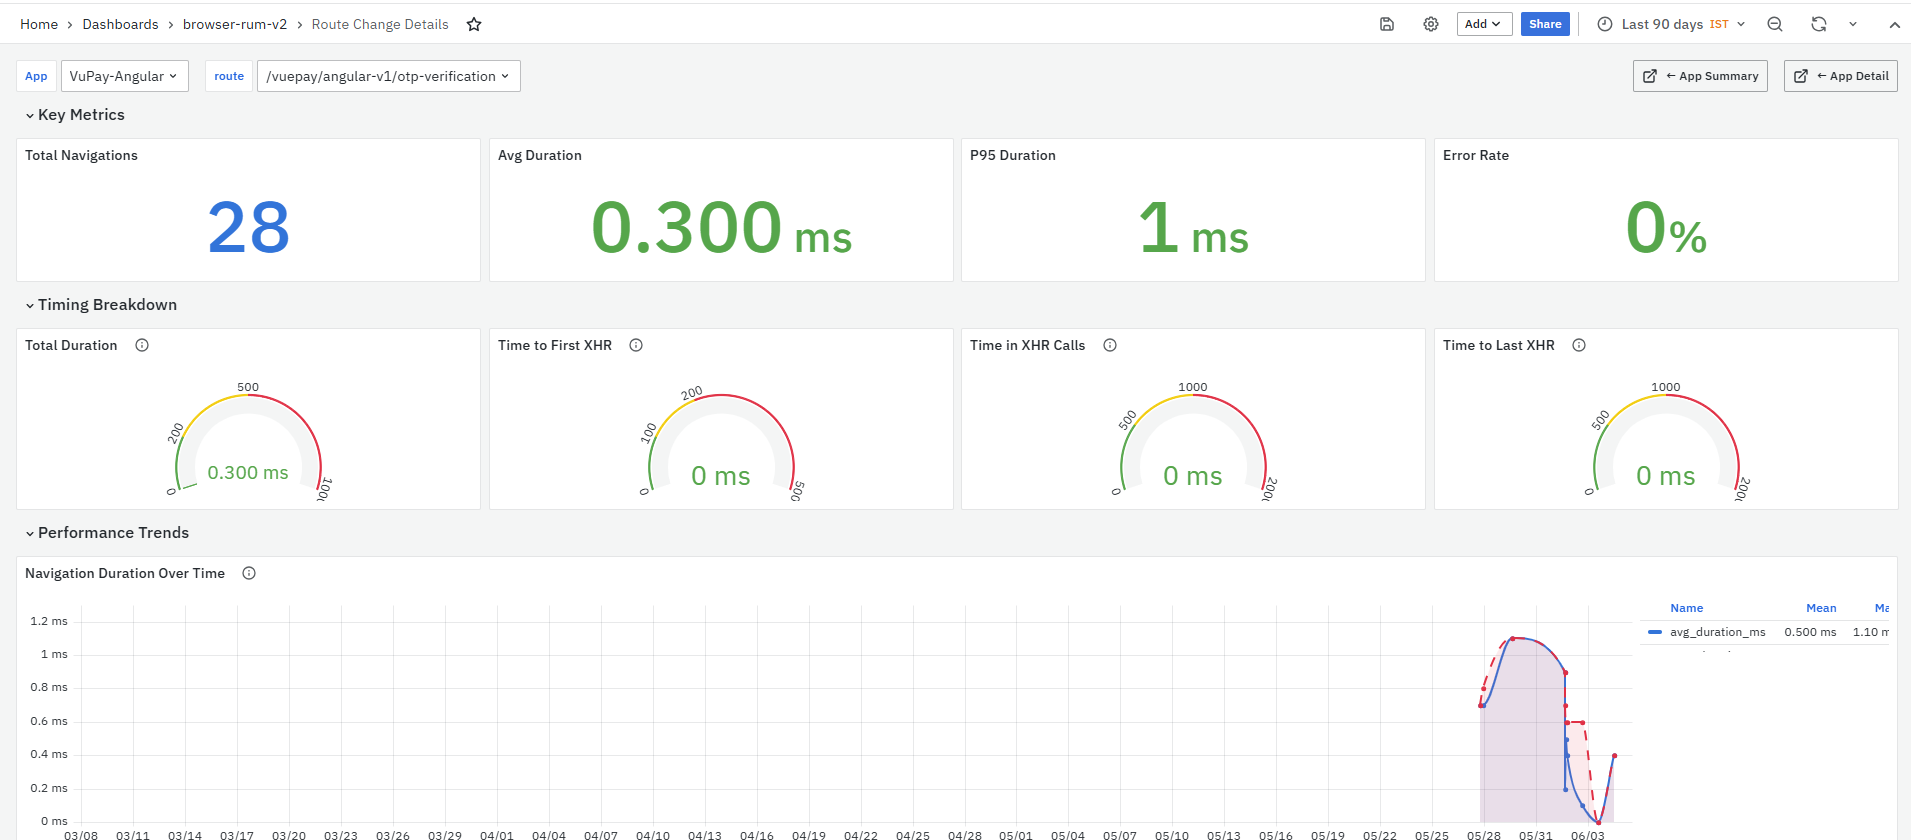
This section includes seven panels:
-
LCP (Largest Contentful Paint)
-
FCP (First Contentful Paint)
-
FP (First Paint)
-
TTFB (Time to First Byte)
-
INP (Interaction to Next Paint)
-
CLS (Cumulative Layout Shift)
-
LCP Good Rate
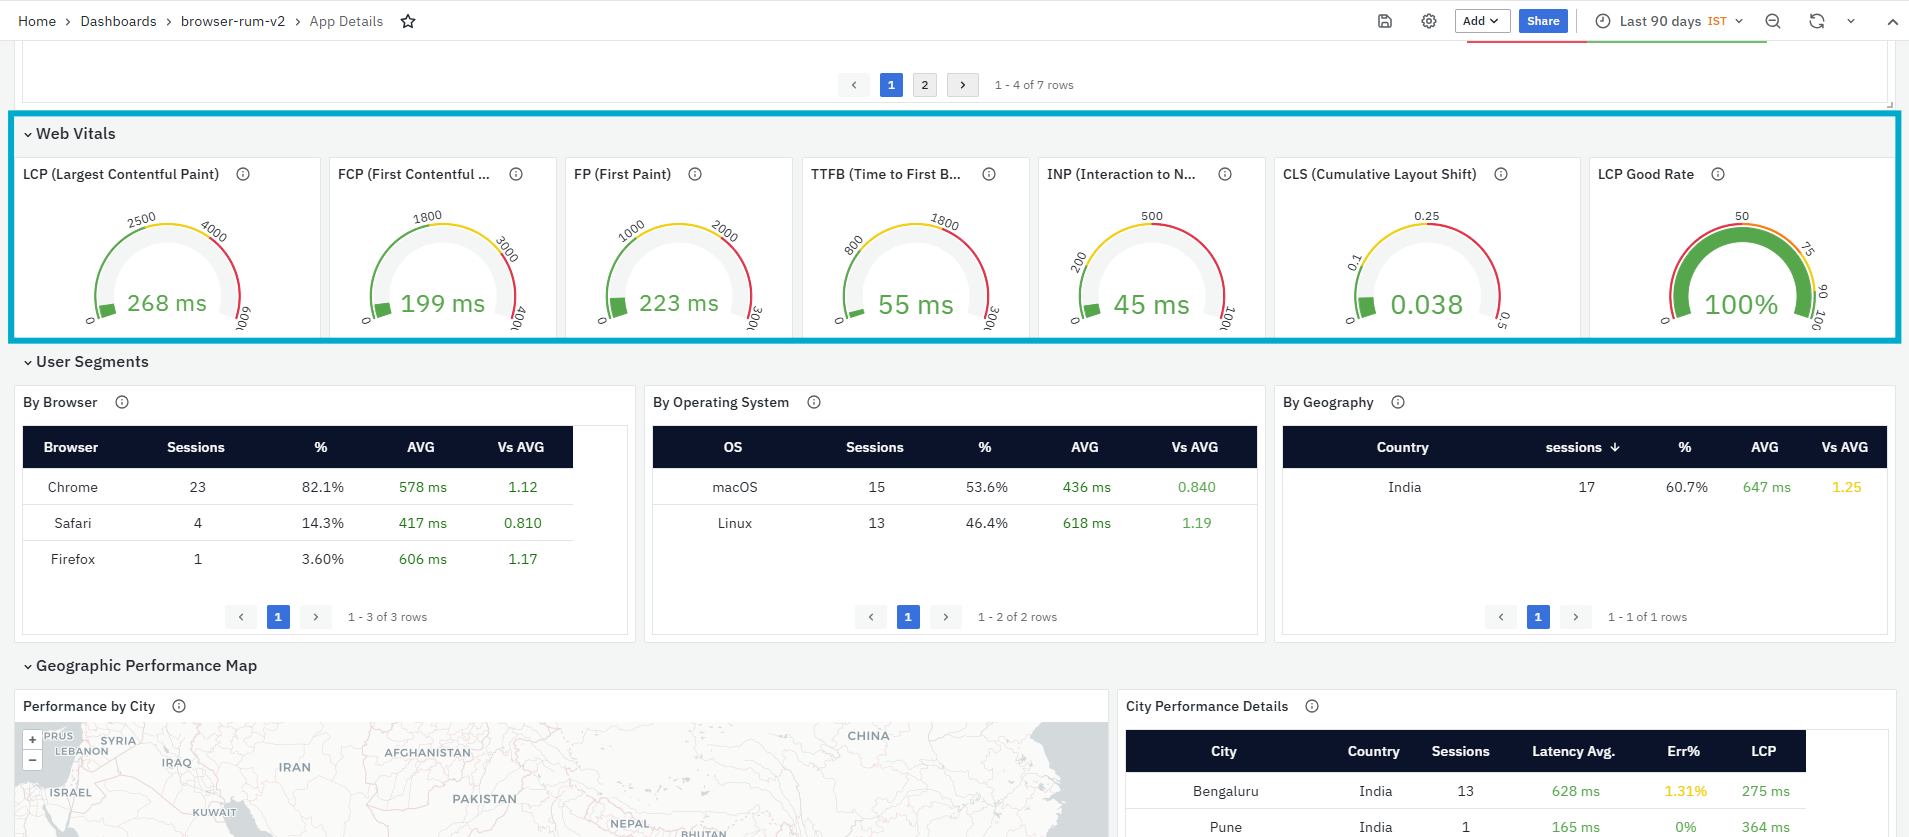
Each panel is shown as a gauge. The gauge helps users quickly understand whether the metric is in a good, needs improvement, or poor range.
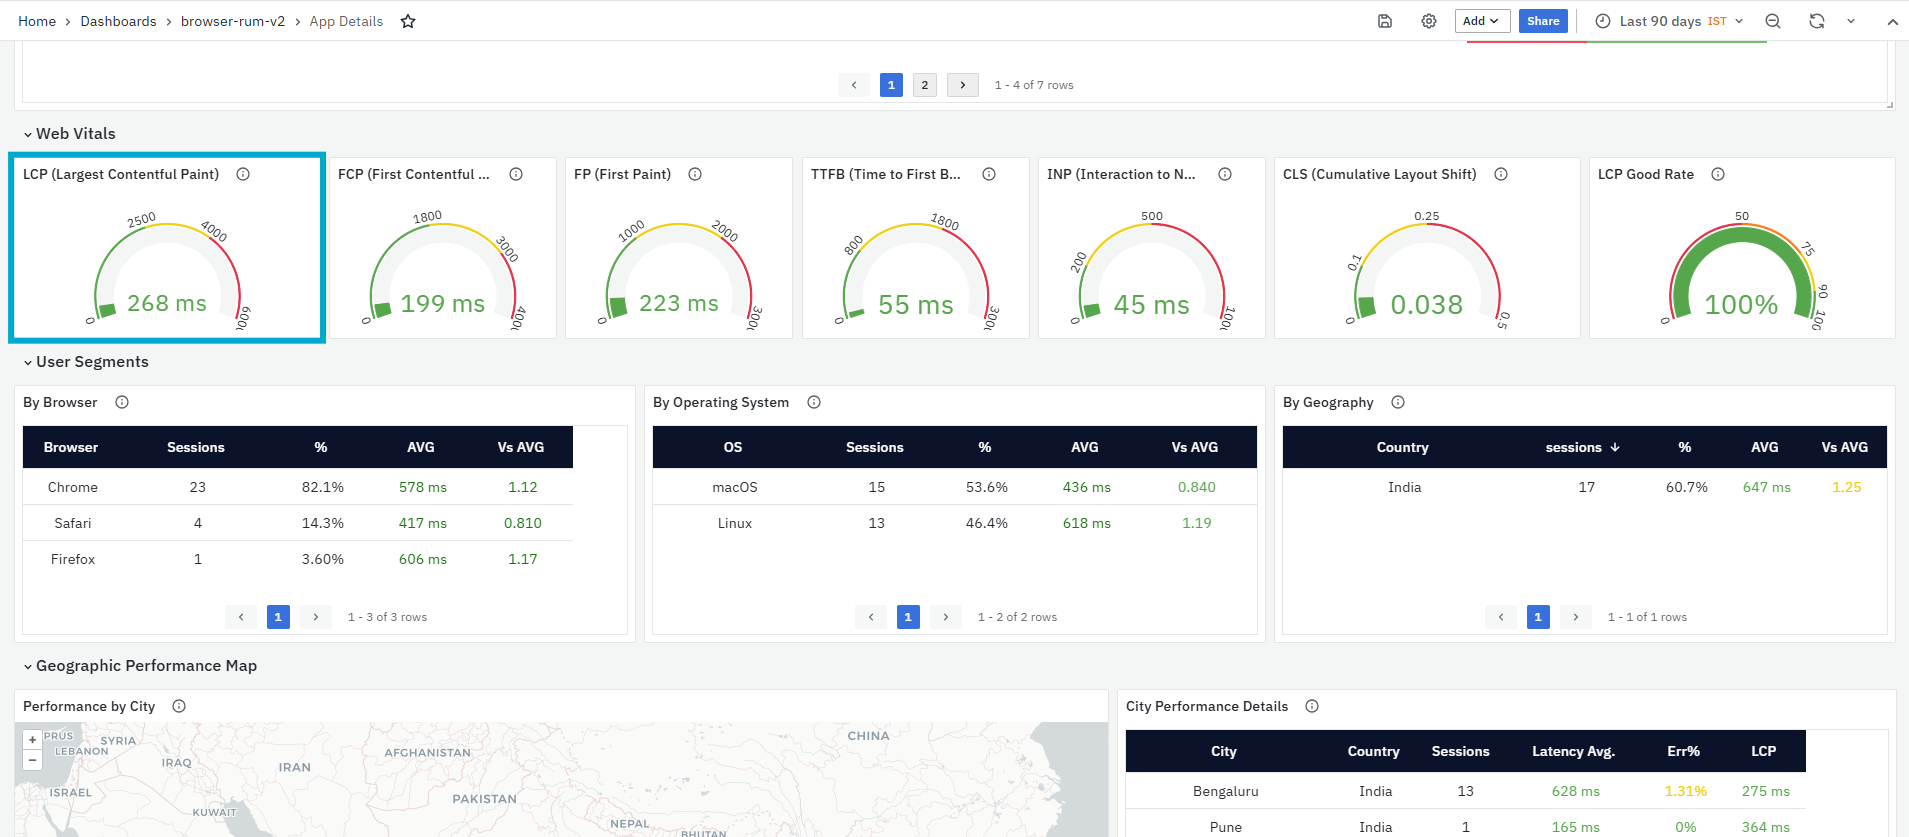
LCP (Largest Contentful Paint)
The LCP (Largest Contentful Paint) panel measures when the main content of the page becomes visible to the user. It usually represents the time taken for the largest visible element, such as a banner, image, or main content block, to load. This panel is primarily used to understand whether users are able to see the main page content quickly. A good LCP is under 2.5 seconds. A value between 2.5 seconds and 4 seconds needs improvement. A value above 4 seconds is poor.
It helps you identify:
- Pages where the main content is loading slowly
- Delays caused by large images, heavy content, or rendering issues
- Poor page loading experience for users
- Pages that may affect user experience and search ranking
A lower LCP value indicates better page loading experience.
FCP (First Contentful Paint)
The FCP (First Contentful Paint) panel measures when the first text or image appears on the page. This panel is primarily used to understand how quickly users start seeing visible page content after opening the page. A good FCP is under 1.8 seconds. A value between 1.8 seconds and 3 seconds needs improvement. A value above 3 seconds is poor.
It helps you identify:
-
Delays before the first visible content appears
-
Pages where users may see a blank screen for longer
-
Frontend rendering delays
-
Initial page loading issues
A slow FCP means users may wait longer before seeing any useful content on the page.
FP (First Paint)
The FP (First Paint) panel measures when any pixel is first rendered on the screen. This can include background colors, layout blocks, or any early visual change. This panel is primarily used to understand when the browser first starts showing visual feedback to the user.

It helps you identify:
-
How quickly the page starts visually loading
-
Early rendering delays in the browser
-
Whether the user receives quick visual feedback after opening the page
-
Initial loading behavior before actual content appears
A lower FP value indicates that the browser begins rendering the page faster.
TTFB (Time to First Byte)
The TTFB (Time to First Byte) panel measures server response time. It shows how long the browser waits before receiving the first byte of content from the server. This panel is primarily used to understand whether delays are happening before the browser starts receiving the page response. A good TTFB is under 800 ms. A value between 800 ms and 1800 ms needs improvement. A value above 1800 ms is poor.

It helps you identify:
-
Slow server response time
-
Backend or infrastructure delays
-
Network delay before page rendering starts
-
Server-side performance issues affecting browser users
A high TTFB often indicates that the backend, server, or network path should be investigated.
INP (Interaction to Next Paint)
The INP (Interaction to Next Paint) panel measures page responsiveness. It shows how quickly the page responds after a user interaction, such as a click, tap, or key press. This panel is primarily used to understand whether the application feels responsive during user actions. A good INP is under 200 ms. A value between 200 ms and 500 ms needs improvement. A value above 500 ms is poor.

It helps you identify:
-
Delays after user clicks or actions
-
Pages that feel slow or unresponsive
-
Frontend processing delays
-
User interaction issues affecting page experience
A high INP means the page may feel sluggish to users.
CLS (Cumulative Layout Shift)
The CLS (Cumulative Layout Shift) panel measures visual stability. It shows how much the page content shifts around while loading or during use. This panel is primarily used to identify whether users are seeing unexpected movement of page elements. A good CLS is under 0.1. A value between 0.1 and 0.25 needs improvement. A value above 0.25 is poor.

It helps you identify:
-
Unexpected movement of text, buttons, images, or sections
-
Layout instability during page load
-
Pages where users may accidentally click the wrong element
-
Visual experience issues caused by shifting content
A lower CLS value indicates a more stable page layout.
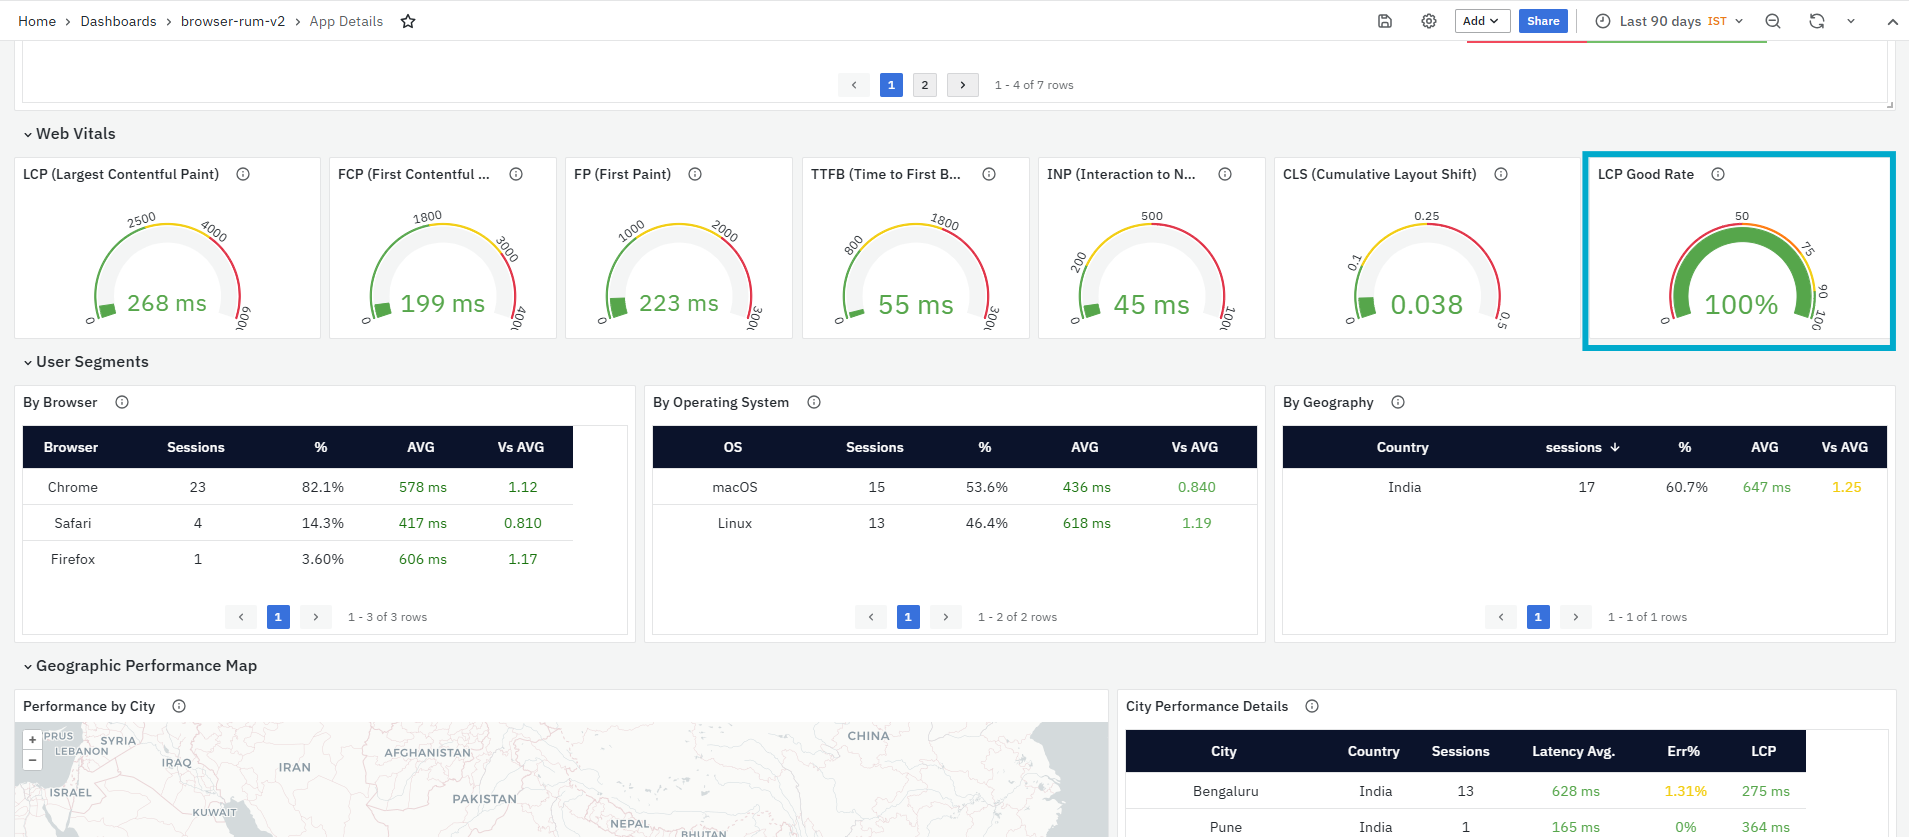
LCP Good Rate
The LCP Good Rate panel shows the percentage of page loads where LCP is good, which means LCP is under 2.5 seconds. This panel is primarily used to understand how many page loads delivered a good main-content loading experience.

It helps you identify:
-
Percentage of users receiving good LCP performance
-
Whether the application provides a consistent page loading experience
-
Whether LCP performance is poor for a significant number of page loads
-
Possible impact on user experience and search ranking
A higher LCP Good Rate indicates that more users are experiencing good page load performance.
User Segments
The User Segments section displays application performance grouped by user environment and geography. This section helps users understand whether performance issues are common across all users or limited to a specific browser, operating system, or location.
This section is primarily used to identify browser-specific, operating system-specific, or geography-specific performance issues.
This section includes three panels:
- By Browser
- By Operating System
- By Geography
By Browser
The By Browser panel shows which browsers users are using, how many sessions each browser accounts for, and the average performance for each browser. This panel is primarily used to identify whether one browser has slower performance compared to others. If one browser performs significantly worse, users can investigate browser-specific issues.
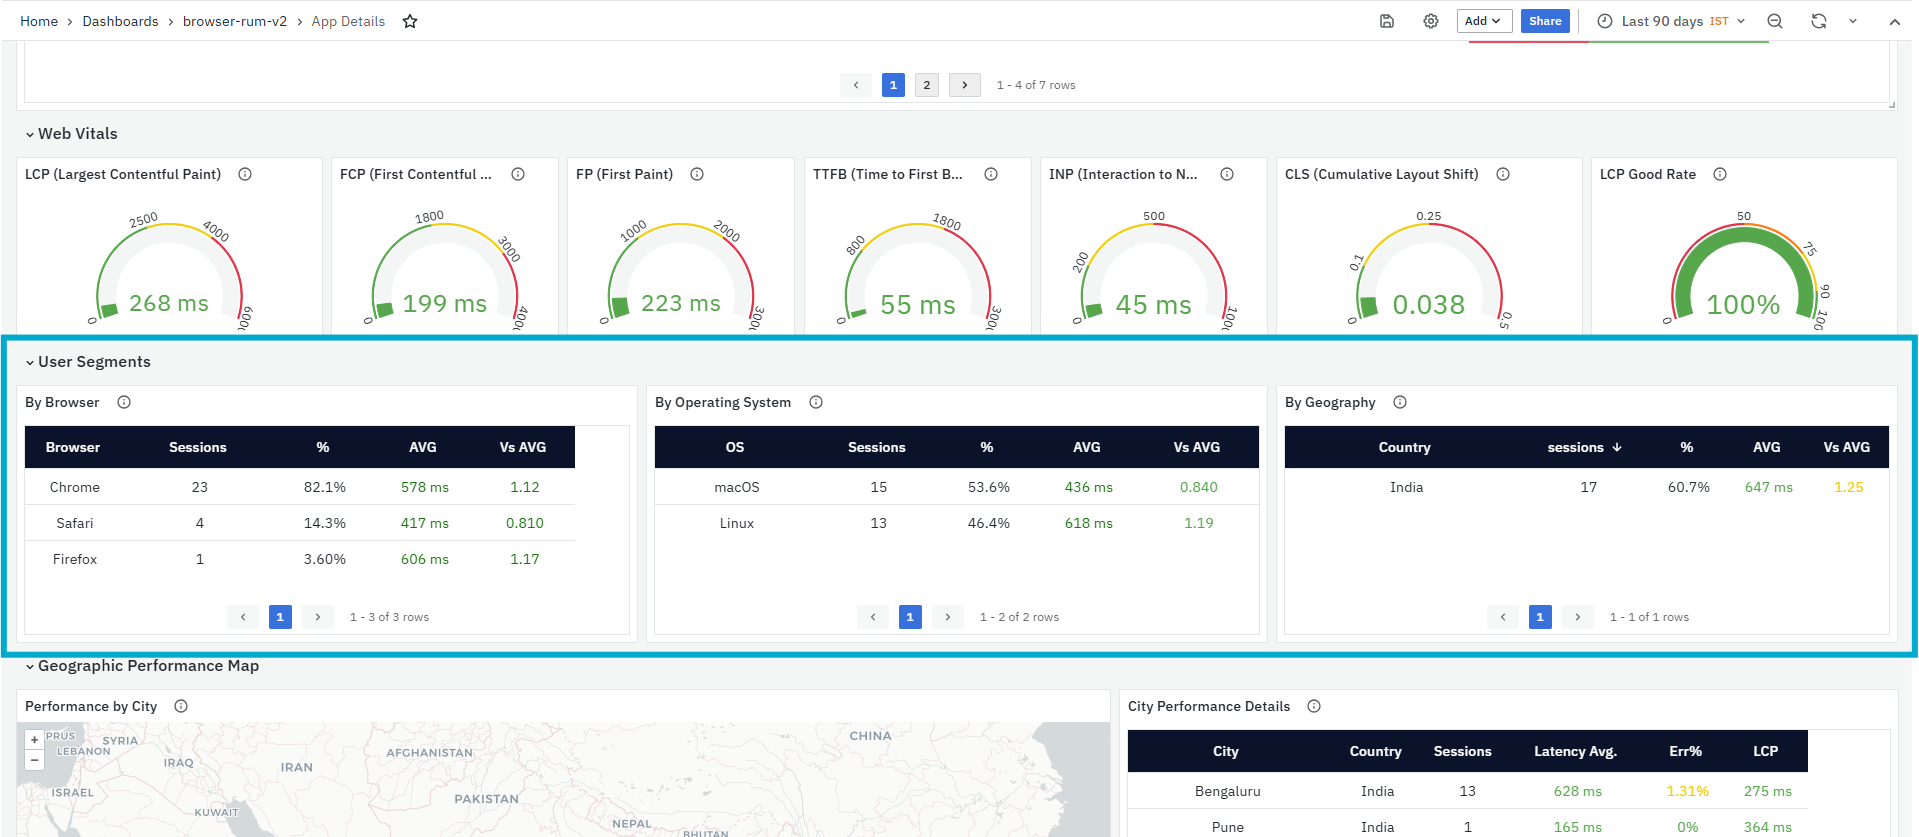
It helps you identify:
-
Browsers used by application users
-
Number of sessions from each browser
-
Browser-wise performance differences
-
Browsers performing worse than the overall average
-
Browser-specific issues that may need further investigation
The panel includes the following columns:
-
Browser: Displays the browser name, such as Chrome or Safari.
-
Sessions: Displays the number of sessions recorded for that browser.
-
%: Displays the percentage contribution of that browser to the total sessions.
-
AVG: Displays the average performance value for that browser. This helps compare browser-level user experience.
-
Vs AVG: Displays how the browser performance compares with the overall average. A higher value indicates that the browser is performing worse than the average, while a lower value indicates better performance.
By Operating System
The By Operating System panel shows which operating systems users are using and the average performance for each operating system. This panel is primarily used to identify whether users on a specific operating system are facing slower performance. Different operating systems, such as Windows, macOS, Linux, Android, or iOS, may show different performance behavior.

It helps you identify:
-
Operating systems used by application users
-
Number of sessions from each operating system
-
OS-wise performance differences
-
Operating systems performing worse than the overall average
-
Whether mobile or desktop users are experiencing different performance levels
The panel includes the following columns:
-
OS: Displays the operating system name, such as Linux or macOS.
-
Sessions: Displays the number of sessions recorded for that operating system.
-
%: Displays the percentage contribution of that operating system to the total sessions.
-
AVG: Displays the average performance value for that operating system.
-
Vs AVG: Displays how the operating system performance compares with the overall average. This helps identify operating systems that are slower or faster than the application average.
This panel is useful when users need to check whether performance issues are related to a specific operating system or device environment.
By Geography
The By Geography panel shows where users are located geographically and how the application performs for those users. This panel is primarily used to identify whether users from a specific country are experiencing higher latency or poor performance. Users in distant locations may experience higher latency due to network distance.

It helps you identify:
-
Countries from where users are accessing the application
-
Number of sessions from each country
-
Country-wise performance differences
-
Countries performing worse than the overall average
-
Locations where network distance may be affecting performance
The panel includes the following columns:
-
Country: Displays the country from where users accessed the application.
-
sessions: Displays the number of sessions recorded from that country.
-
%: Displays the percentage contribution of that country to the total sessions.
-
AVG: Displays the average performance value for users from that country.\
-
Vs AVG: Displays how the country-level performance compares with the overall average. A higher value indicates that users from that country are experiencing slower performance compared to the overall average.
Geographic Performance Map
The Geographic Performance Map section displays location-based performance for the selected application. This section helps users understand how the application performs across different cities and whether users from specific locations are experiencing higher latency or errors. This section is primarily used to identify geography-specific performance issues. It helps users quickly check whether poor performance is affecting all users or only users from a particular city or region.

This section includes two panels:
- Performance by City
- City Performance Details
Performance by City
The Performance by City panel displays application performance on a geographic map. Each location is shown on the map based on the city from where users accessed the application. The map uses circles to represent user activity and performance. Larger circles indicate more users from that location. The color of the circle indicates performance condition, where green represents good performance and red represents poor performance.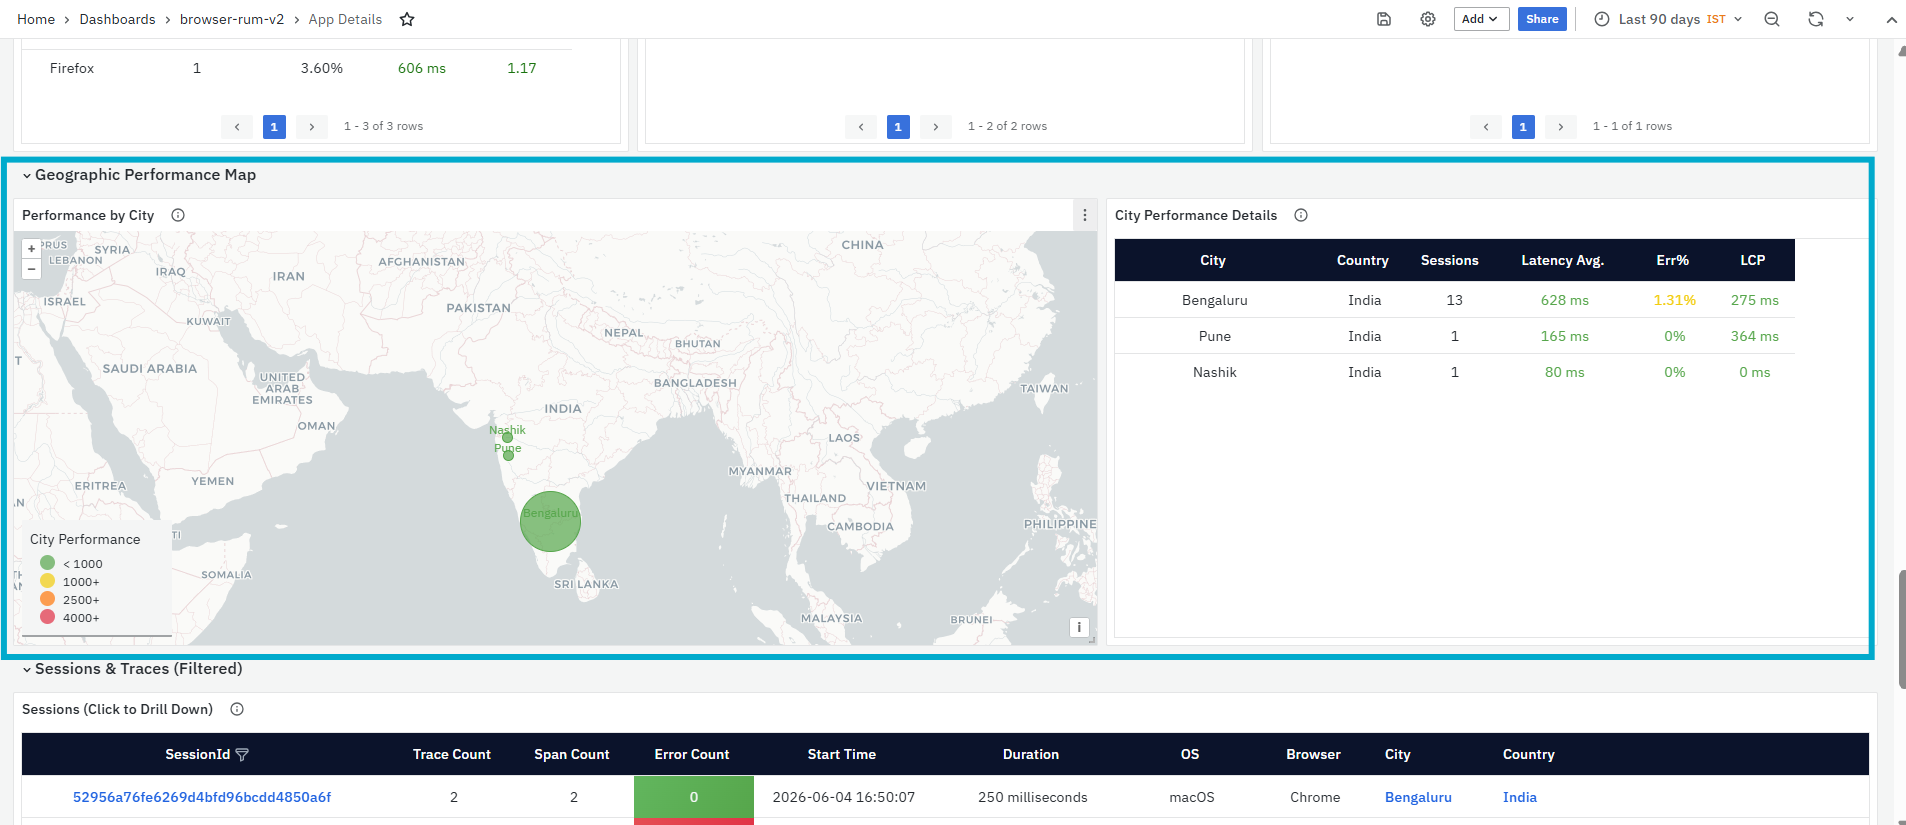
It helps you identify:
-
Cities from where users are accessing the application
-
Locations with higher or lower performance
-
Regions where users may be experiencing latency issues
-
Whether the issue is location-specific or spread across multiple regions
-
Cities that need deeper performance investigation
The panel also includes a City Performance legend. The legend helps users interpret the performance indicators shown on the map.
City Performance Details
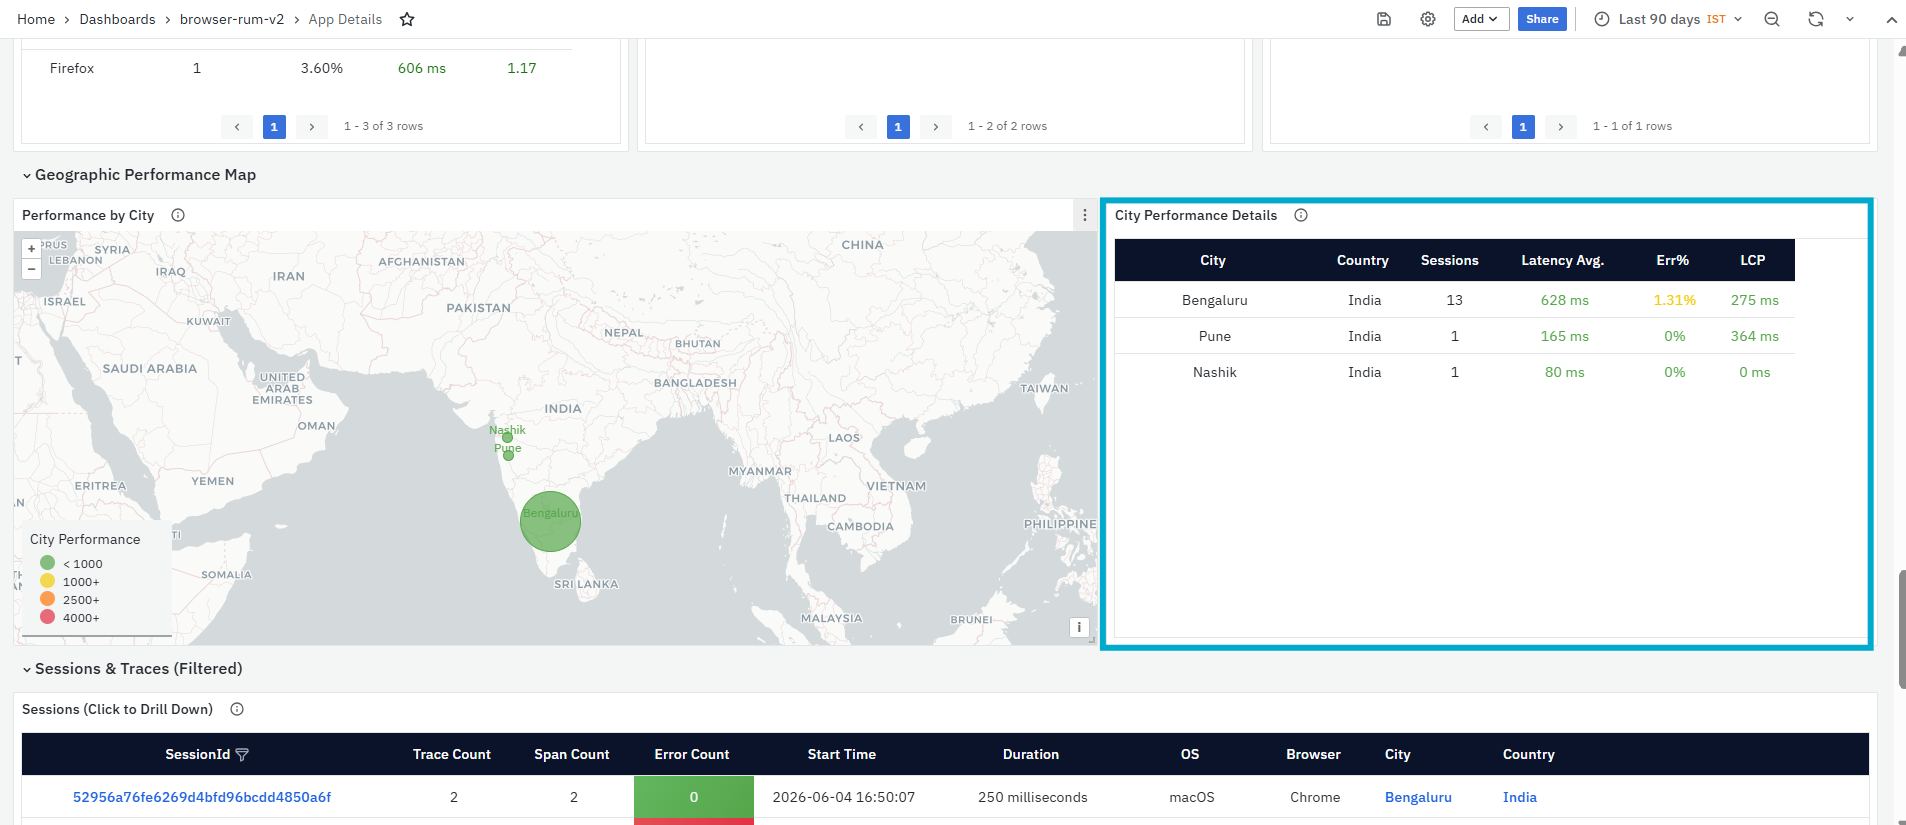
The City Performance Details panel displays detailed performance metrics by city. This panel provides a table view of the same location-based performance information shown on the map. This panel is primarily used to identify the exact cities where performance optimization may be needed.
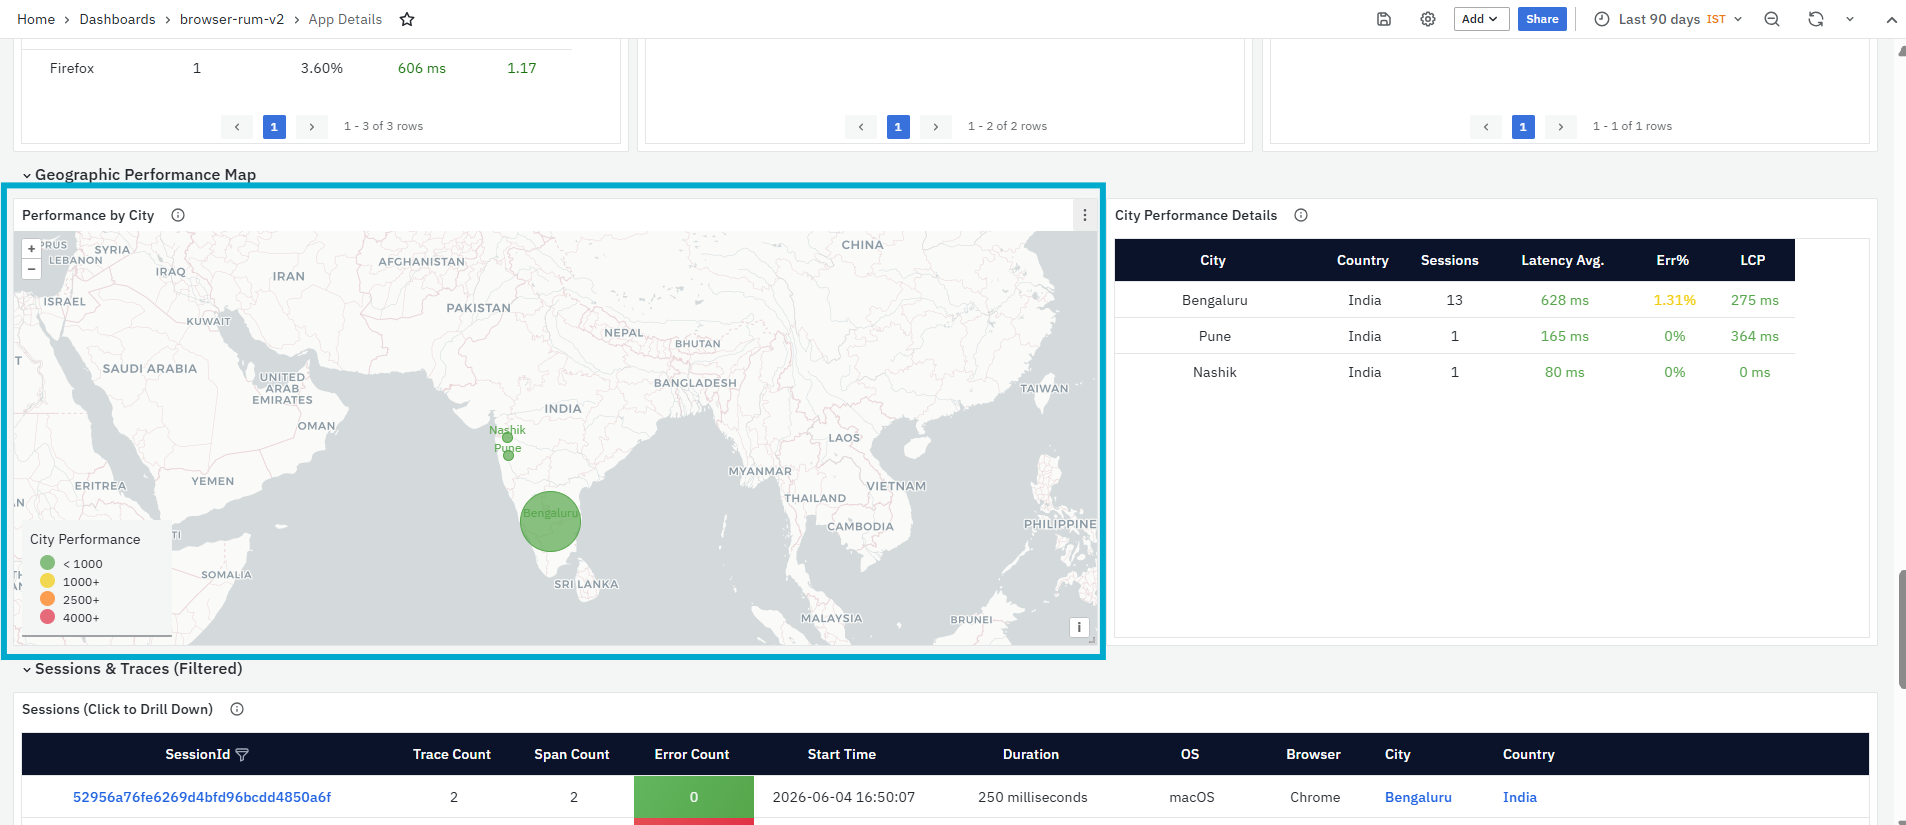
It helps you identify:
-
Number of sessions from each city
-
Average latency for each city
-
Error percentage for each city
-
LCP performance for each city
-
Cities where users may be facing poor browser experience
The panel includes the following columns:
-
City: Displays the city from where users accessed the application.
-
Country: Displays the country associated with the city.
-
Sessions: Displays the number of user sessions recorded from that city.
-
Latency Avg.: Displays the average latency observed for users from that city. This helps identify whether users in that location are experiencing slow responses.
-
Err%: Displays the error percentage for that city. This helps identify whether users from the city are facing request failures or browser-side errors.
-
LCP: Displays the Largest Contentful Paint value for that city. This helps understand how quickly the main page content loaded for users from that location.
Sessions & Traces (Filtered)
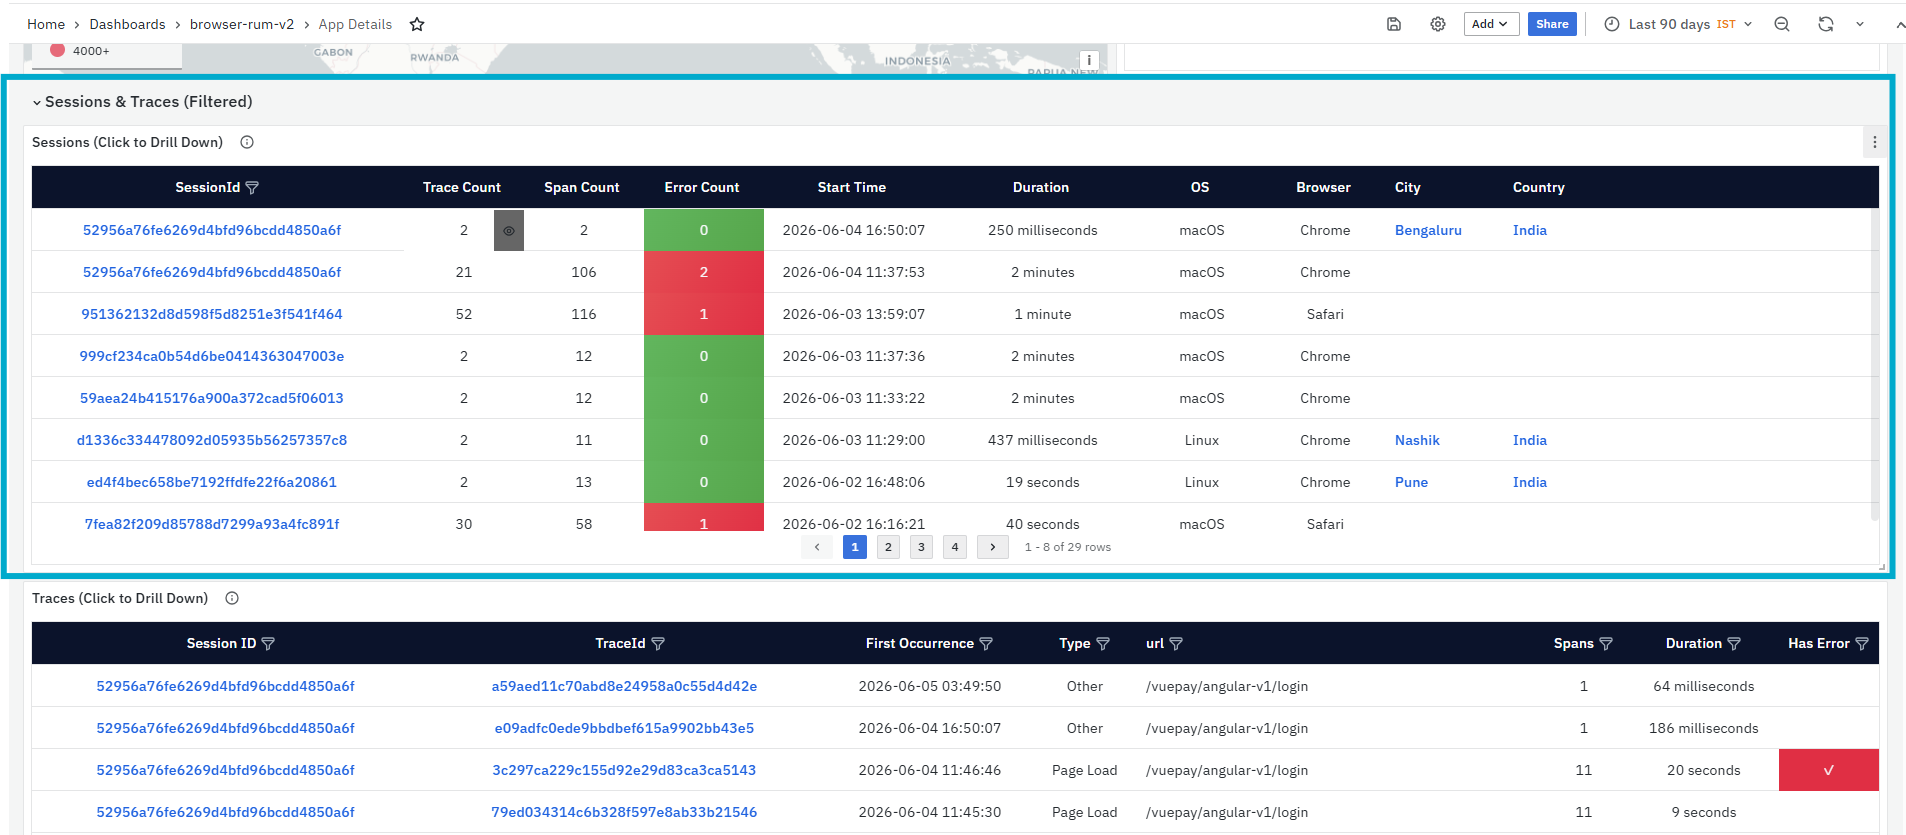
The Sessions & Traces (Filtered) section displays user sessions and traces that match the selected dashboard filters. This section helps users move from application-level performance analysis to user-level and trace-level investigation. This section is primarily used when users need to investigate a specific user journey, reported issue, slow page load, failed action, or trace with errors.
This section includes two panels:
- Sessions (Click to Drill Down)
- Traces (Click to Drill Down)
Sessions (Click to Drill Down)
The Sessions (Click to Drill Down) panel lists user sessions within the selected filters. A session represents a user’s activity during a specific period, including the pages visited, actions performed, traces generated, spans captured, and errors encountered. This panel is primarily used to investigate user-reported issues and understand what happened during a specific user session. Users can click a SessionId to drill down into the selected session and review the user’s activity in more detail.

It helps you identify:
-
Sessions with errors
-
Sessions with high trace count
-
Sessions with high span count
-
Sessions with longer duration
-
The operating system and browser used in the session
-
Sessions that require deeper user journey analysis
The panel includes the following columns:
- SessionId: Displays the unique session identifier. The SessionId value is clickable. When clicked, a context menu is displayed with the following options:
- Filter by Session ID: Filters all dashboard sections based on the selected session and shows the detailed view for that session across the App Details dashboard.
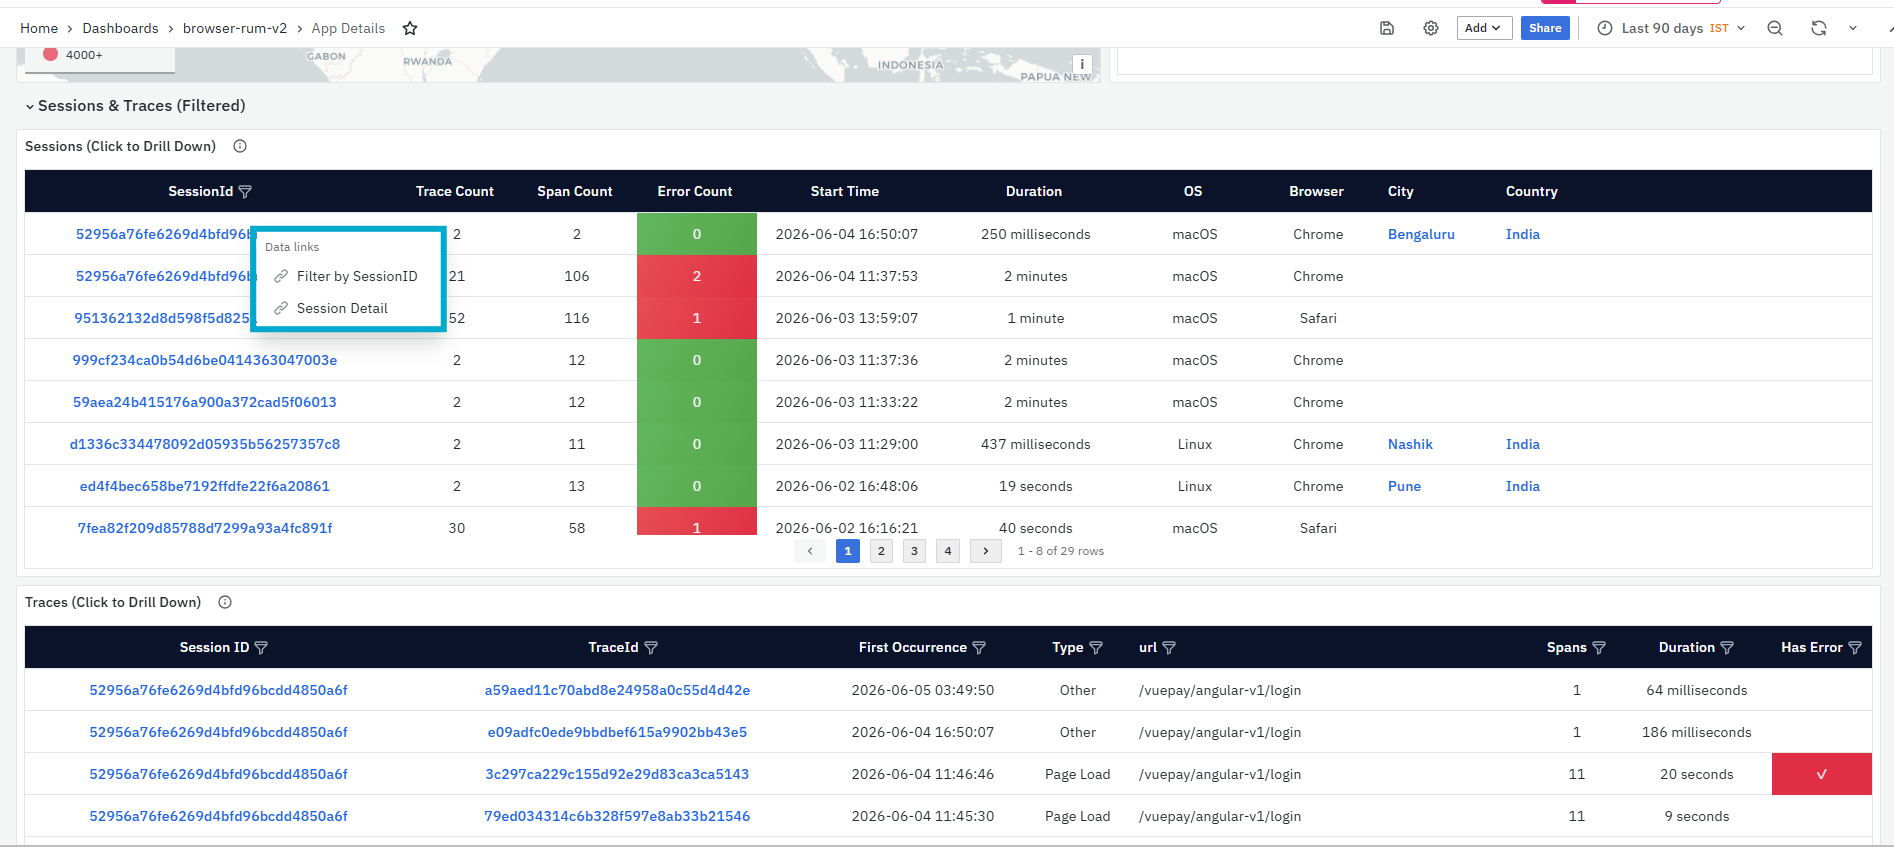
- Session Detail: Opens the Session Details dashboard for the selected session.
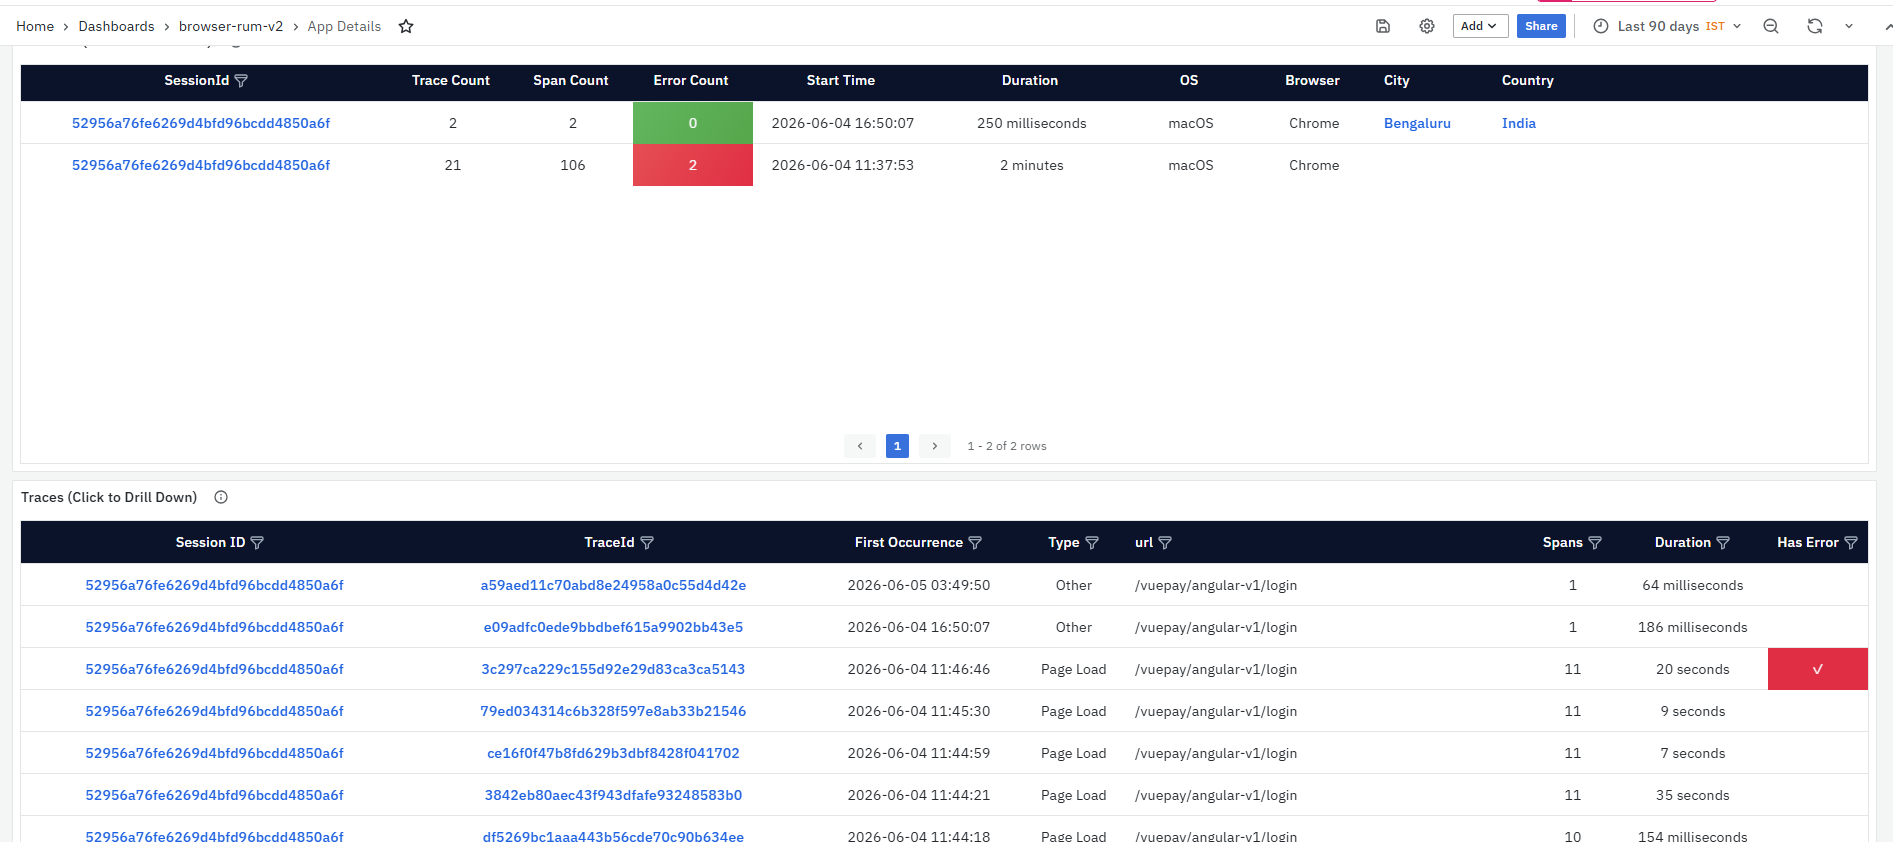
-
The Session Details dashboard provides a detailed view of the selected user session. It includes session header details, activity summary, session timeline, activity timeline, performance overview, page views, HTTP requests, user interactions, route changes, long tasks, errors, network timing, and complete event timeline. To learn more about this page, refer to Session Details.
-
Trace Count: Displays the number of traces captured within the session. A higher trace count indicates that multiple page loads, route changes, or user actions were recorded.
-
Span Count: Displays the total number of spans captured within the session. Spans provide detailed operation-level information within traces.
-
Error Count: Displays the number of errors captured in the session. A value of 0 indicates that no error was captured for that session. A higher value indicates that the user encountered one or more errors.
-
Start Time: Displays the time when the session started.
-
Duration: Displays the total duration of the user session.
-
OS: Displays the operating system used by the user during the session, such as macOS or Linux.
-
Browser: Displays the browser used during the session, such as Chrome.
-
City: Displays the city associated with the session, if available.
-
Country: Displays the country associated with the session, if available.
Traces (Click to Drill Down)
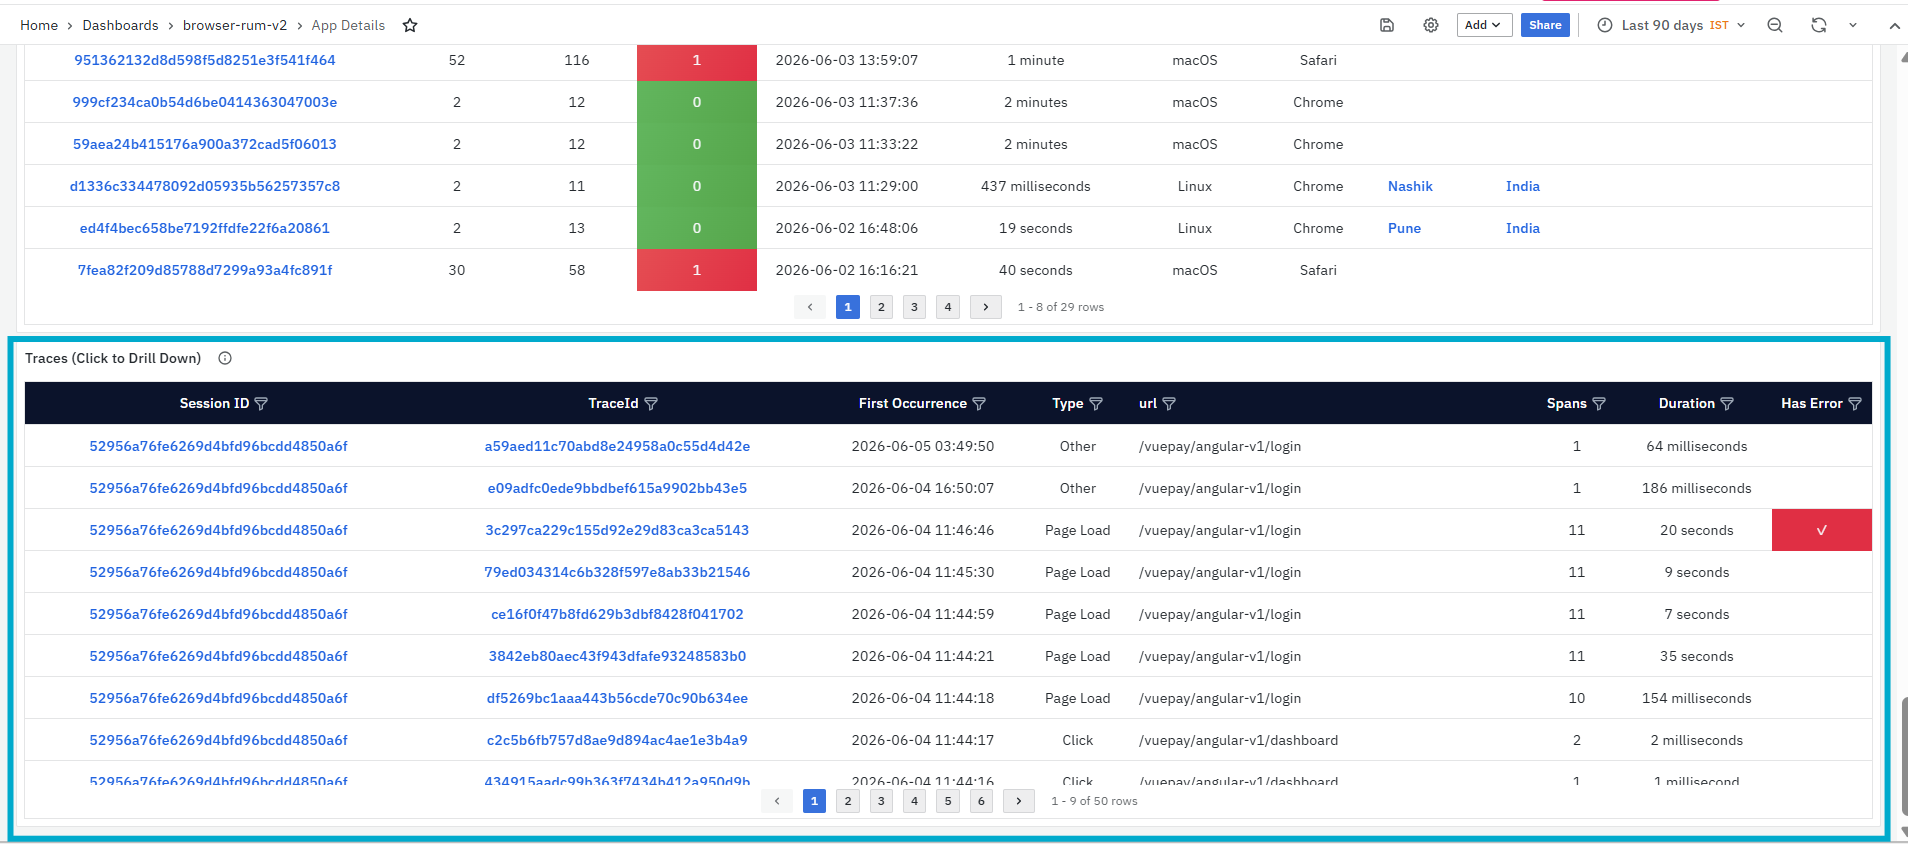
The Traces (Click to Drill Down) panel lists all traces captured within the selected filters. A trace represents a complete browser-side action, such as a page load, route change, or other user action. Each trace helps users understand what happened during that action from start to finish. Users can click a TraceId to open trace-level details and review the span breakdown for deeper troubleshooting.

It helps you identify:
-
Traces linked to specific sessions
-
Page load traces and route change traces
-
Traces with longer duration
-
Traces that contain errors
-
URLs or routes where user actions occurred
-
Trace-level details that require span-level investigation
The panel includes the following columns:
- Session ID: Displays the session associated with the trace. The SessionId value is clickable. When clicked, a context menu is displayed with the following options:
-
Filter by Session ID: Filters all dashboard sections based on the selected session and shows the detailed view for that session across the App Details dashboard.
-
Session Detail: Opens the Session Details dashboard for the selected session.
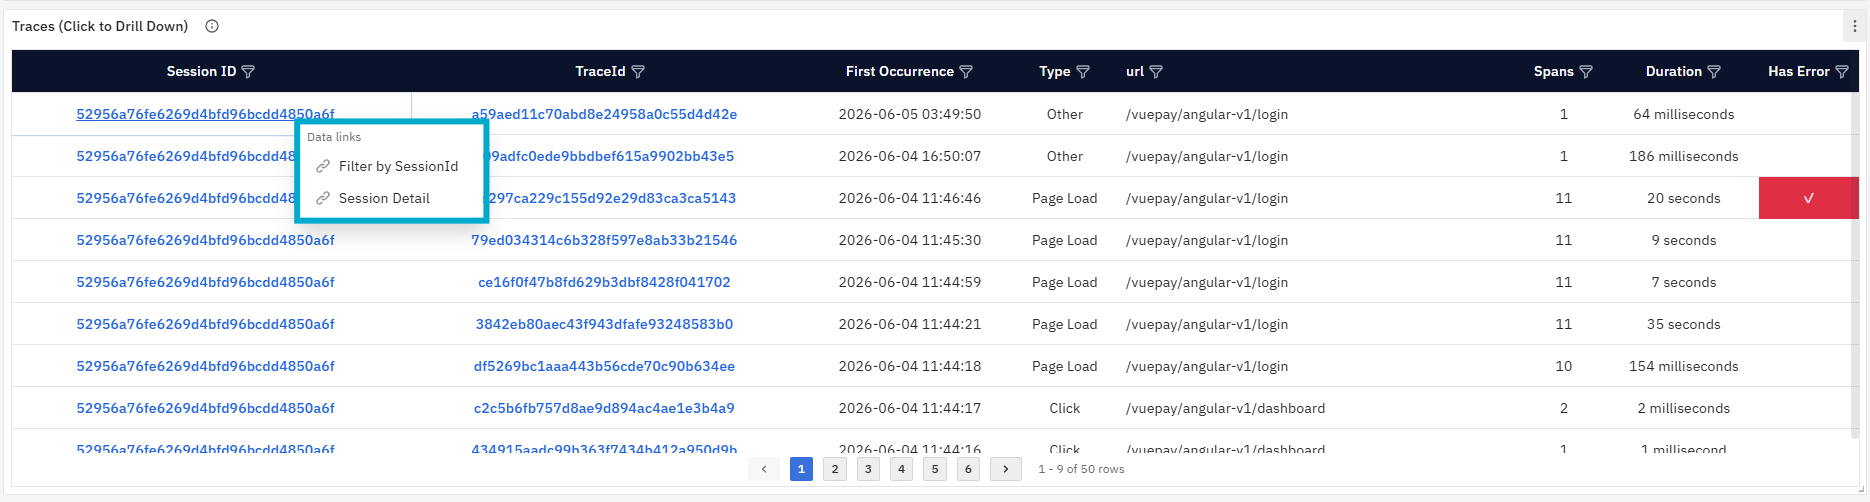
-
The Session Details dashboard provides a detailed view of the selected user session. It includes session header details, activity summary, session timeline, activity timeline, performance overview, page views, HTTP requests, user interactions, route changes, long tasks, errors, network timing, and complete event timeline. To learn more about this page, refer to Session Details.
-
TraceId: Displays the unique trace identifier. The TraceId value is clickable. When clicked, a context menu is displayed with the following options:
-
Filter by Trace ID: Filters all dashboard sections based on the selected trace and shows the detailed view for that trace across the App Details dashboard.
- View TraceMap: Opens the TraceMap Waterfall dashboard for the selected trace.

-
The TraceMap Waterfall dashboard provides a waterfall-style view of the selected trace. It shows trace summary, environment details, service time distribution, span sequence, duration, and timing flow. This helps users understand how the trace was executed from start to finish and identify where time was spent. To learn more about this page, refer to TraceMap Waterfall.
-
First Occurrence: Displays the time when the trace first occurred.
-
Type: Displays the type of trace, such as Page Load, Route Change, or Other.
-
url: Displays the URL or route associated with the trace.
-
Spans: Displays the number of spans captured within the trace. This helps indicate how many operations were part of the trace.
-
Duration: Displays the total time taken by the trace. A higher duration may indicate slow page loading or delayed user action processing.
-
Has Error: Indicates whether the trace contains an error. A marked or highlighted value means the trace has an error and should be reviewed further.
Latency Deep-Dive Dashboard
The Latency Deep-Dive Dashboard is a dashboard in the Browser Real User Monitoring module. It provides a focused view of latency across the selected application. This dashboard helps users understand where delays are coming from. It can be used to analyze latency by category, page load, HTTP request, route change, and user interaction.
The dashboard is divided into the following sections:
- Overall Latency Summary
- Page Load Latency
- HTTP Request Latency
- Route Change Latency
- User Interaction Latency
Related Dashboard
The Latency Deep-Dive dashboard includes related dashboard links at the top-right side of the page. These links help users move from latency analysis to other BRUM dashboards.
-
App Overview - The App Overview dashboard provides a high-level view of all monitored browser applications. It helps users compare applications by environment, average latency, latency trend, throughput, error rate, and error trend. For more details refer to App Overview.
-
App Detail - The App Detail dashboard provides a detailed view of the selected application’s browser-side performance. It includes app health, impact analysis, errors, performance timeline, HTTP requests, page performance, route changes, web vitals, user segments, geography, sessions, and traces. For more details refer to App Detail
-
Throughput - The Throughput Deep-Dive dashboard provides a focused view of application traffic and activity volume. It helps users analyze page load events, HTTP requests, route changes, user interactions, and long tasks. For more details refer to Throughput Deep-Dive.
-
Errors - The Errors Deep-Dive dashboard provides a focused view of application errors. It helps users analyze errors by category, HTTP request errors, page load errors, route change errors, and user interaction errors. For more details refer to Error Deep-Dive.
Overall Latency Summary
The Overall Latency Summary section provides a category-level view of latency across the selected application. It helps users understand whether latency is mainly coming from HTTP requests, page loads, route changes, or user interactions. This section should be used first to identify which area needs deeper latency analysis.

This section includes two panels:
- Avg Latency by Category
- Latency by Category
Avg Latency by Category
The Avg Latency by Category panel displays average latency distribution by category using a donut chart. Categories can include HTTP Request, Page Load, Route Change, and User Interaction.
It helps you identify:
- Which category contributes most to latency
- Whether HTTP requests, page loads, routes, or user interactions are slower
- Which category should be investigated first
- How latency is distributed across browser activities
This panel is useful when users need a quick category-level view before moving into detailed latency analysis.
Latency by Category
The Latency by Category panel displays latency metrics grouped by category. It provides count, trend, average latency, and percentile latency values. The panel includes the following columns:
-
Category: Displays the latency category, such as HTTP Request, Page Load, Route Change, or User Interaction.
-
Count: Displays the number of events recorded for the category.
-
Trend: Displays a sparkline showing latency behavior over time.
-
Avg (ms): Displays the average latency for the category.
-
P50 (ms): Displays the 50th percentile latency.
-
P95 (ms): Displays the 95th percentile latency.
-
P99 (ms): Displays the 99th percentile latency.
Page Load Latency
The Page Load Latency section focuses on latency caused by full page loads. It helps users understand which pages are taking longer to load and when page load latency increased during the selected time range. This section is useful for identifying slow pages that may directly affect the user’s first experience with the application.

This section includes two panels:
- Page Load Latency Trend
- Page Load Latency by Page
Page Load Latency Trend
The Page Load Latency Trend panel shows how page load latency changes over time. It displays average latency and P95 latency trends for page load activity.
It helps you identify:
- Page load latency spikes
- Time periods where pages loaded slowly
- Difference between average and P95 page load latency
- Whether page load delays are temporary or recurring
Page Load Latency by Page
The Page Load Latency by Page panel displays page-level latency metrics. It helps users compare pages and identify which pages are slower.
The panel includes the following columns:
- Page: Displays the page or route name. The Page value is clickable and opens the Page Load Details dashboard for the selected page.

-
The Page Load Details dashboard provides a detailed view of the selected page’s browser-side performance. It shows page views, unique sessions, average and P95 load time, error rate, LCP good rate, core web vitals, error analysis, page loading breakdown, resource loading details, HTTP requests, user segments, recent page loads, trace waterfall, and page-load sessions. For more details refer to Page Load Details.
-
Count: Displays the number of page load events.
-
Avg (ms): Displays the average page load latency.
-
P50 (ms): Displays the 50th percentile latency.
-
P95 (ms): Displays the 95th percentile latency.
-
P99 (ms): Displays the 99th percentile latency.
HTTP Request Latency
The HTTP Request Latency section focuses on latency from HTTP/API requests made by the browser application. It helps users identify slow endpoints, request methods, and APIs that may be delaying page loads or user actions. This section is useful when users need to check whether backend/API response time is contributing to poor browser experience.
This section includes two panels:
-
HTTP Latency by Method
-
HTTP Request Latency Details
HTTP Latency by Method
The HTTP Latency by Method panel shows HTTP request latency trends grouped by method, such as GET or POST.
It helps you identify:
- Which HTTP methods are slower
- Latency spikes for specific request methods
- Whether request latency changed over time
- Method-level patterns that need deeper analysis
HTTP Request Latency Details
The HTTP Request Latency Details panel displays endpoint-level latency metrics for HTTP requests.
The panel includes the following columns:
-
Endpoint: Displays the HTTP/API endpoint.
-
Method: Displays the HTTP method used for the request.
-
Count: Displays the number of requests made to the endpoint.
-
Avg (ms): Displays the average latency for the endpoint.
-
P95 (ms): Displays the 95th percentile latency for the endpoint.
Route Change Latency
The Route Change Latency section shows latency for Single Page Application route changes. It helps users understand whether navigation between pages or views is slow, even when the browser does not perform a full page reload. This section is useful for identifying route-level delays that affect in-app navigation.
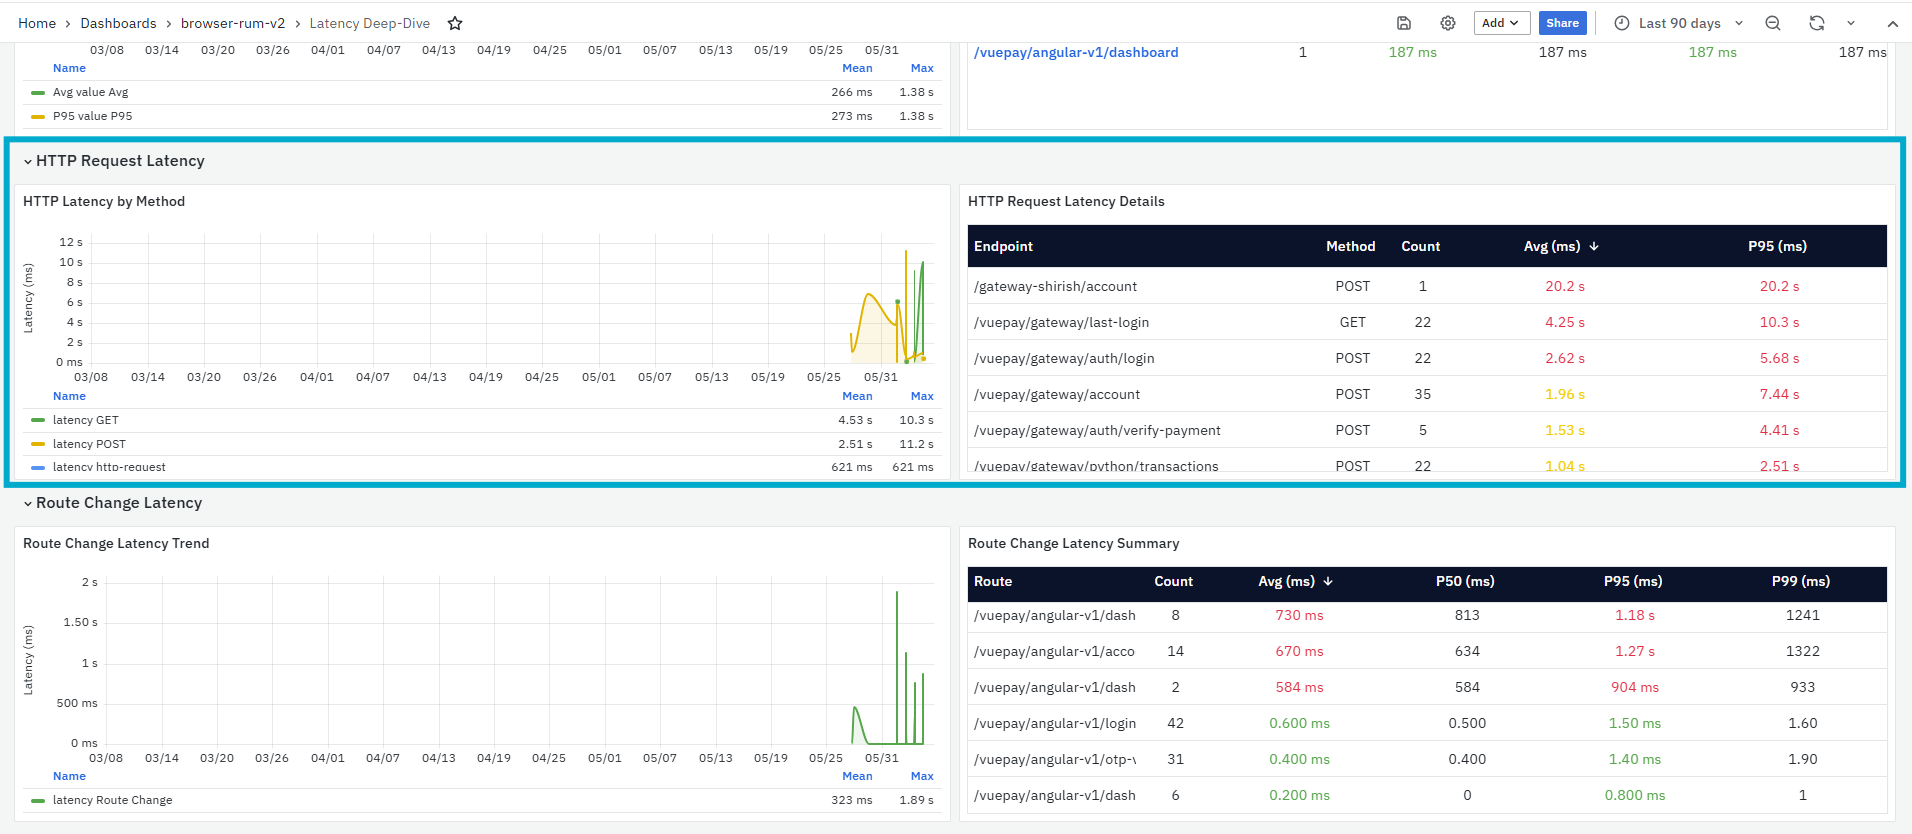
This section includes two panels:
- Route Change Latency Trend
- Route Change Latency Summary
Route Change Latency Trend
The Route Change Latency Trend panel shows route change latency over time. It helps users identify when SPA navigation became slow.
It helps you identify:
-
Route change latency spikes
-
Slow navigation periods
-
Whether route latency is recurring or isolated
-
Navigation performance issues in the selected application
Route Change Latency Summary
The Route Change Latency Summary panel displays route-level latency metrics.
The panel includes the following columns:
-
Route: Displays the SPA route path. The Route value is clickable and opens the Route Change Details dashboard for the selected route.
-
Count: Displays the number of route changes.
-
Avg (ms): Displays the average route change latency.
-
P50 (ms): Displays the 50th percentile latency.
-
P95 (ms): Displays the 95th percentile latency.
-
P99 (ms): Displays the 99th percentile latency.
User Interaction Latency
The User Interaction Latency section displays latency for user actions such as clicks, selections, and other interactions. This section helps users understand whether the application responds quickly to user input.
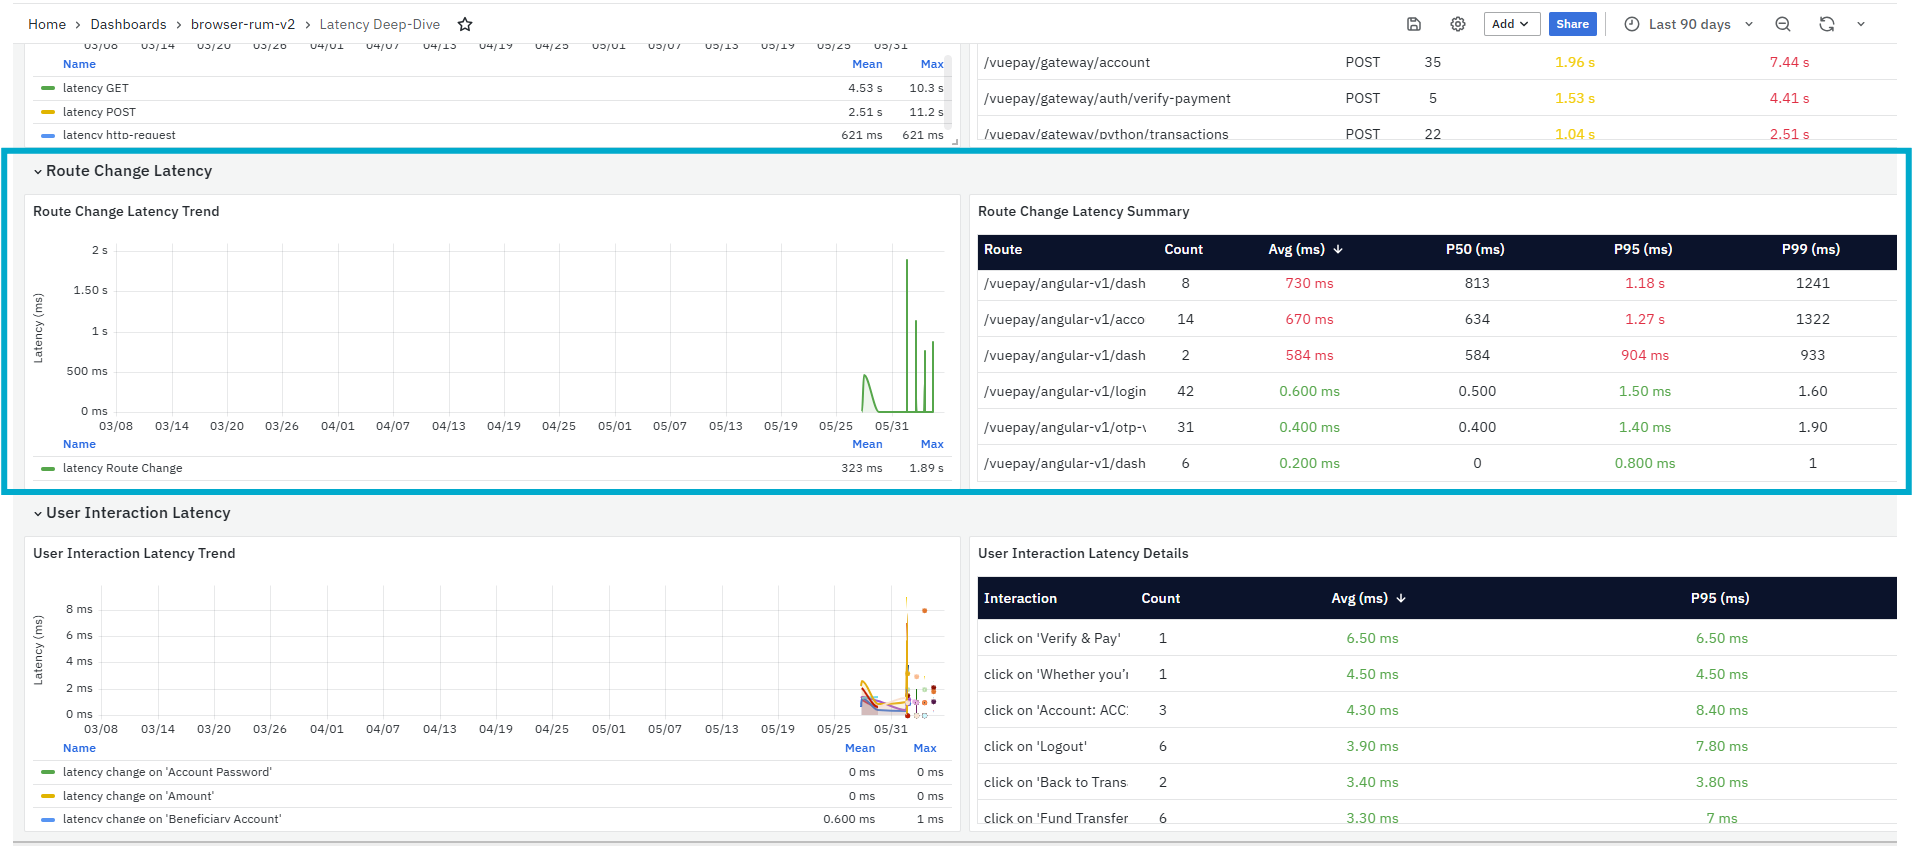
This section includes two panels:
-
User Interaction Latency Trend
-
User Interaction Latency Details
User Interaction Latency Trend
The User Interaction Latency Trend panel shows how interaction latency changes over time. This panel is useful when users need to understand whether user actions were delayed during a specific time range.
It helps you identify:
-
Delays after user actions
-
Interaction latency spikes
-
Time periods where the application felt slow to users
-
User actions that may need further investigation
User Interaction Latency Details
The User Interaction Latency Details panel displays latency metrics for individual user interactions. This panel is useful when users need to identify which user actions are slow. For example, if a frequently used button has high interaction latency, it may directly affect user experience.
The panel includes the following columns:
-
Interaction: Displays the user action, such as a click on a button or link.
-
Count: Displays how many times the interaction occurred.
-
Avg (ms): Displays the average latency for the interaction.
-
P95 (ms): Displays the 95th percentile latency for the interaction.
Throughput Deep Dive Dashboard
The Throughput Deep Dive Dashboard is a dashboard in the Browser Real User Monitoring module. It provides a detailed view of application activity volume across page loads, HTTP requests, route changes, user interactions, and long tasks. This dashboard helps users understand how much activity is happening in the selected application, which event categories are contributing most to traffic, which pages or APIs are used most frequently, and where high activity may require further performance analysis.

The dashboard is divided into the following sections:
- Overall Throughput
- SummaryPage Load Events
- HTTP Requests (API Calls) Route Changes (SPA Navigation)
- User Interactions (Clicks, Submits)
- Long Tasks (Main Thread Blocking)
Related Dashboard
- App Overview: Opens the App Overview dashboard for the selected application. This dashboard provides a high-level view of application performance, including average latency, throughput, error rate, and trend indicators. It is useful when users want to quickly compare overall app health before moving into deeper analysis. For more details refer to App Overview.
- App Detail: Opens the App Details dashboard for deeper application-level analysis. This dashboard provides a consolidated view of app health, impact analysis, performance timeline, HTTP requests, page performance, route changes, web vitals, user segments, sessions, and traces. It is useful when users need to investigate the application from multiple performance and user-experience angles. For more details refer to App Detail.
- Latency: Opens the Latency Deep Dive dashboard. This dashboard helps users analyze latency across page loads, HTTP requests, route changes, and user interactions. It is useful when users need to identify which activity type, page, route, API, or user action is contributing most to response-time delays. For more details refer to Latency Deep Dive.
- Errors: Opens the Error Deep Dive dashboard. This dashboard provides a focused view of errors by category, HTTP status, endpoint, route, and user interaction. It is useful when users need to investigate failed requests, error trends, affected endpoints, and areas where users are facing failures. For more details refer to Error Deep Dive.
Overall Throughput Summary
The Overall Throughput Summary section provides a category-level summary of application activity. It helps users understand which activity types are contributing most to the overall throughput.
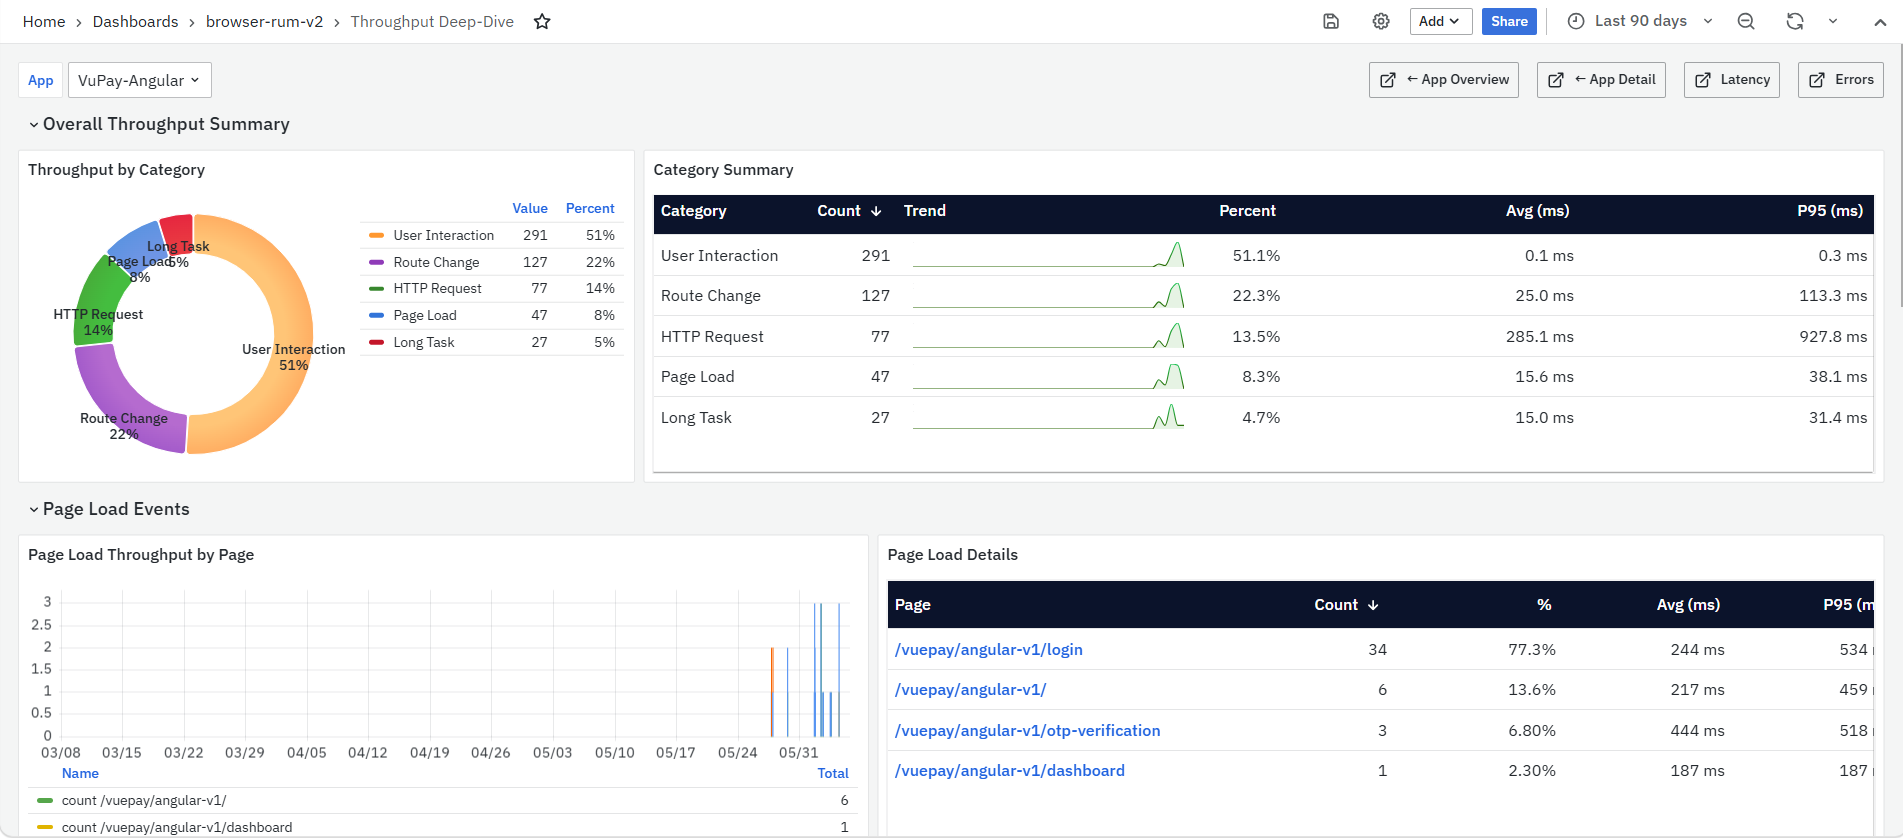
This section includes two panels:
- Throughput by Category
- Category Summary
It helps you identify:
- Which activity category contributes most to overall throughput
- Whether user interactions, route changes, HTTP requests, page loads, or long tasks are driving activity volume
- Categories with high count and high latency
- Activity spikes over the selected time range
- Areas that need further latency or error analysis
Throughput by Category
The Throughput by Category panel shows the distribution of throughput across event categories such as User Interaction, Route Change, HTTP Request, Page Load, and Long Task. This panel helps users quickly understand which activity type contributes the highest volume. For example, a high User Interaction or Route Change percentage indicates that users are actively navigating or interacting with the application.
Category Summary
The Category Summary panel provides a table-level summary of throughput by category. It shows event count, trend, percentage contribution, average time, and P95 time for each category.
The panel includes the following columns:
- Category: Displays the activity category, such as User Interaction, Route Change, HTTP Request, Page Load, or Long Task.
- Count: Displays the number of events recorded for that category.
- Trend: Displays a sparkline showing how the category volume changed over time.
- Percent: Displays the category’s percentage contribution to total throughput.
- Avg (ms): Displays the average duration for events in that category.
- P95 (ms): Displays the 95th percentile duration for events in that category.
This panel is useful when users need to identify high-volume activity categories and check whether those categories also have high latency.
Page Load Events
The Page Load Events section shows page load throughput across the selected application. It helps users identify which pages are loaded most frequently and how page load activity changes over time.

This section includes two panels:
- Page Load Throughput by Page
- Page Load Details
It helps you identify:
- Pages with the highest page load volume
- Page load spikes over time
- Frequently visited pages that may need performance optimization
- Pages with high average or P95 load time
- Pages that should be reviewed in the Page Load Details dashboard
Page Load Throughput by Page
The Page Load Throughput by Page panel shows page load count trends by page over the selected time range. It helps users identify traffic spikes and high-volume pages. This panel is useful when users need to understand which pages are driving browser-side activity. High-throughput pages should be reviewed along with latency, errors, and web vitals.
Page Load Details
The Page Load Details panel lists page-level throughput details. It shows how many times each page was loaded, its percentage contribution, average load time, and P95 load time.
The panel includes the following columns:
- Page: Displays the page or route that was loaded. The Page value is clickable and opens the Page Load Details dashboard for that page.
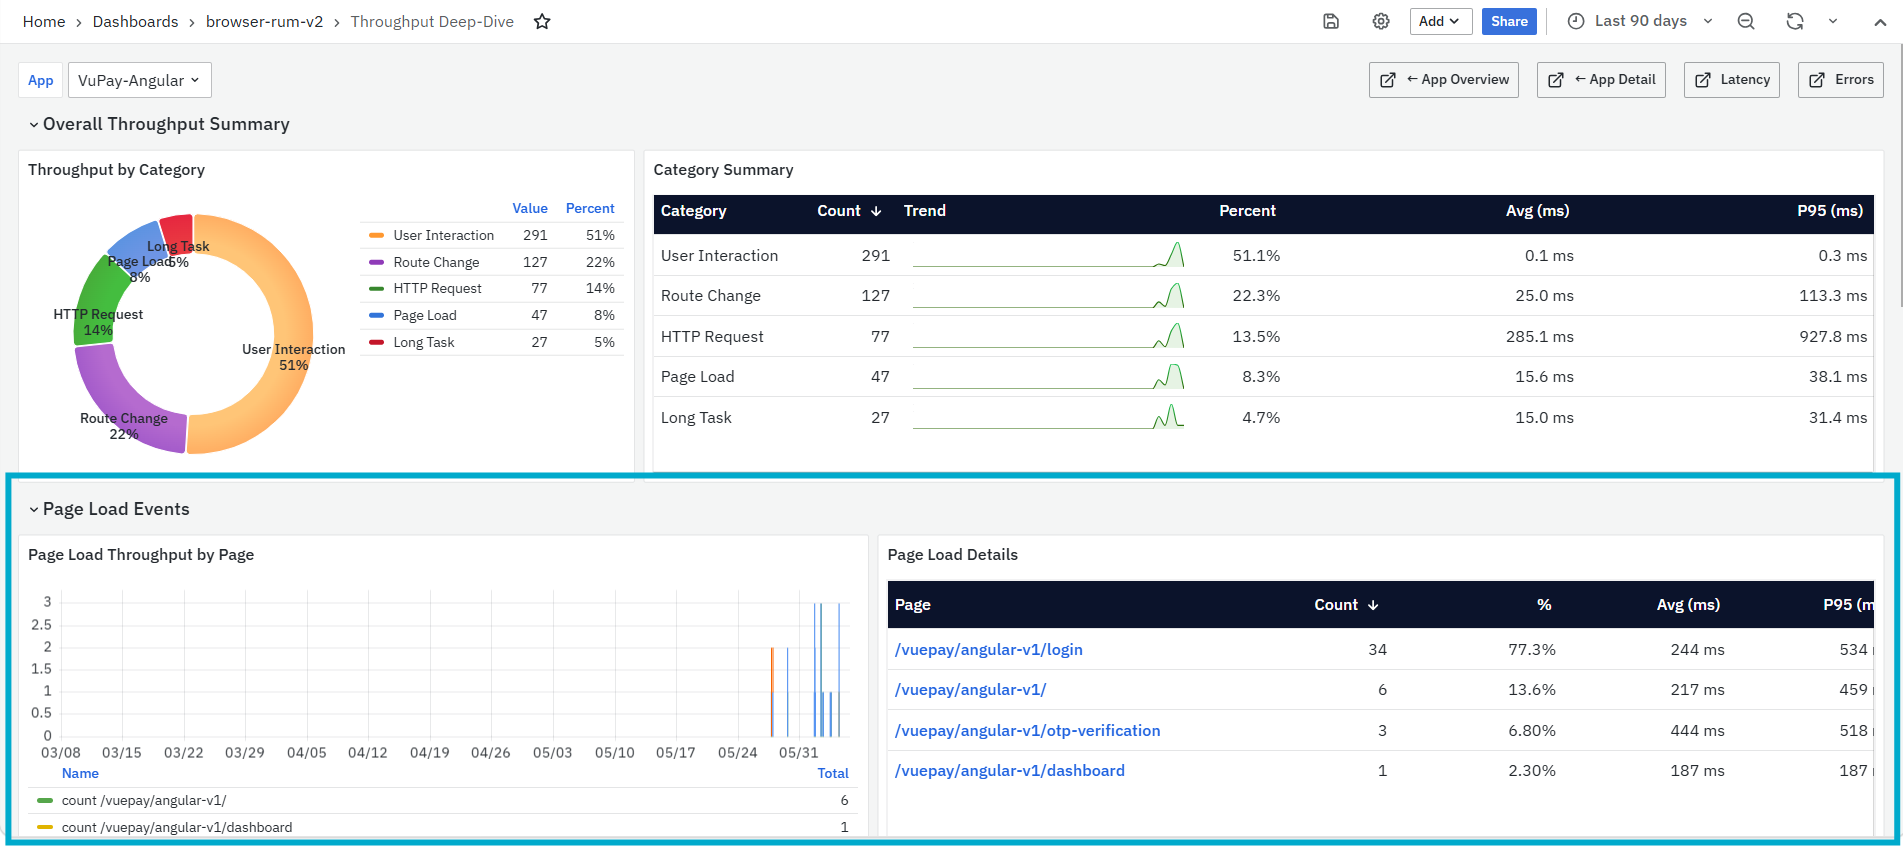
-
The Page Load Details dashboard provides a detailed view of the selected page’s performance. It shows page health, Core Web Vitals, error analysis, page load timing breakdown, resource loading analysis, HTTP requests, page performance, user segments, session drill-down, and trace waterfall. For more details refer to Page load details.
-
Count: Displays the number of page load events.
-
%: Displays the percentage contribution of the page to total page load activity.
-
Avg (ms): Displays the average load time for the page.
-
P95 (ms): Displays the 95th percentile load time for the page.
HTTP Requests (API Calls)
The HTTP Requests (API Calls) section shows API request throughput across the selected application. It helps users understand which HTTP methods and endpoints are generating the highest request volume.
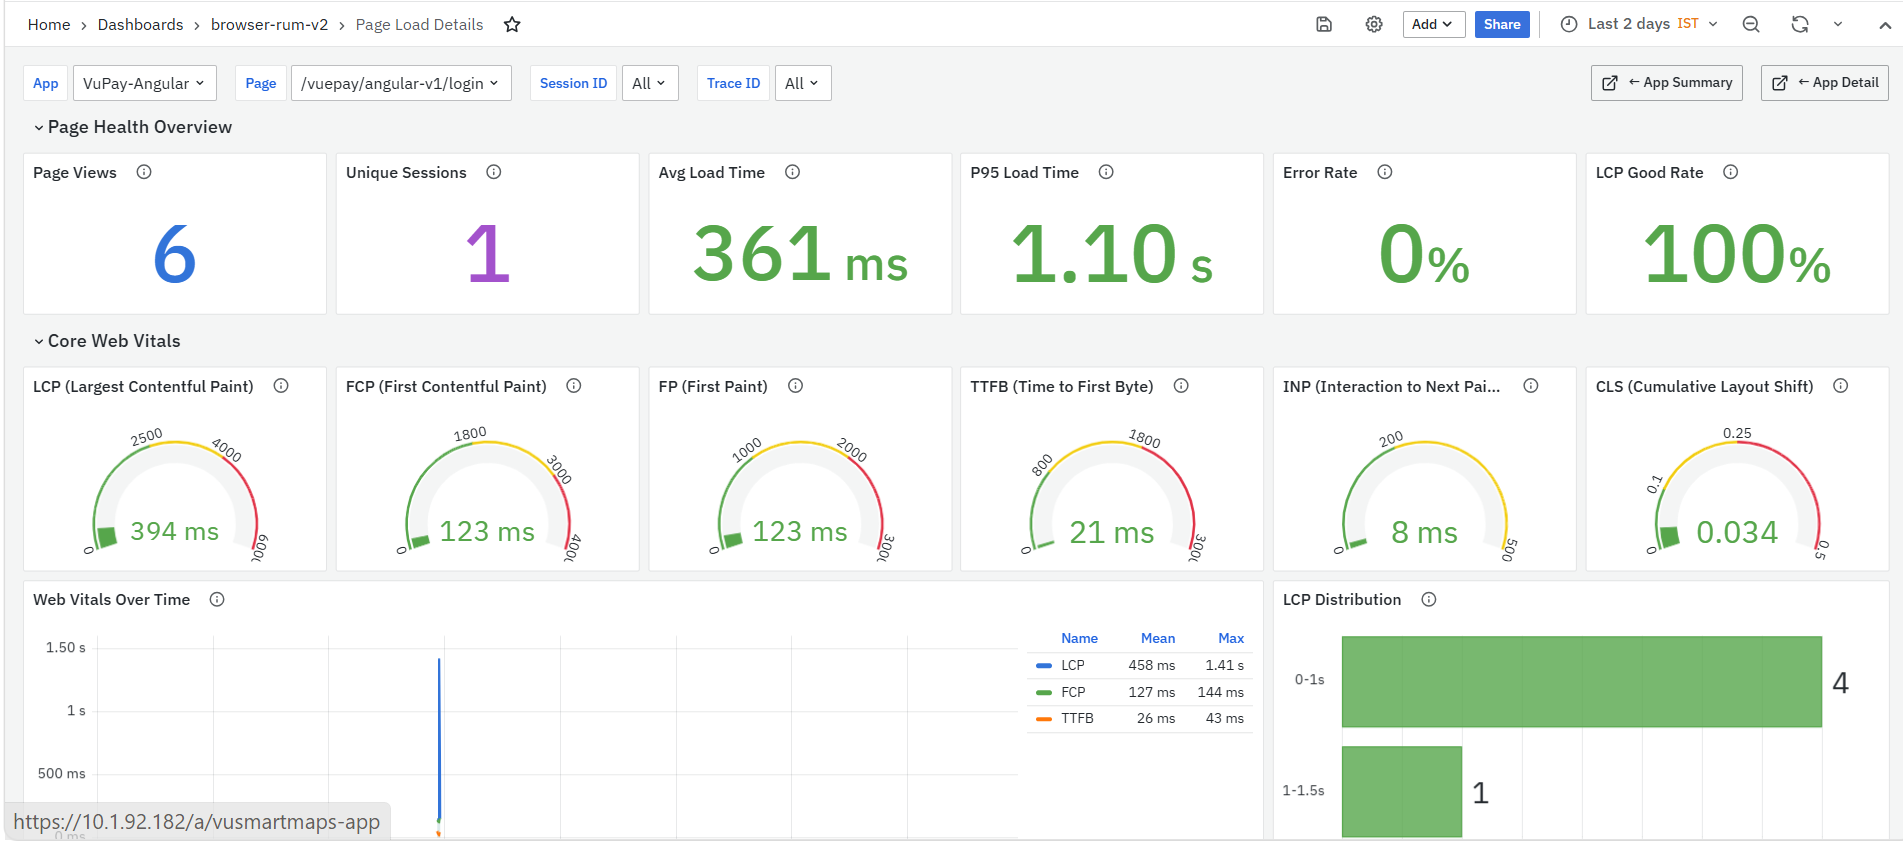
This section includes two panels:
- HTTP Request Throughput by Method
- HTTP Request Details
It helps you identify:
- API endpoints with the highest request volume
- HTTP methods contributing most to request traffic
- Endpoints with high average or P95 latency
- API activity spikes over time
- Endpoints that should be investigated in the HTTP Request Details dashboard
HTTP Request Throughput by Method
The HTTP Request Throughput by Method panel shows HTTP request volume over time, grouped by method such as GET and POST. This panel helps users identify traffic spikes, method-level request patterns, and periods of high API activity. It is useful when users need to correlate API volume with latency or error spikes.
HTTP Request Details
The HTTP Request Details panel lists endpoint-level request throughput. It shows the HTTP method, endpoint URL, request count, average response time, and P95 response time.
The panel includes the following columns:
- Method: Displays the HTTP method used for the request, such as GET or POST.
- URL: Displays the HTTP/API endpoint called by the application. The URL value is clickable and opens the HTTP Request Details dashboard.
- Count: Displays the number of requests made to the endpoint.
- Avg (ms): Displays the average response time for the endpoint.
- P95 (ms): Displays the 95th percentile response time for the endpoint.
Route Changes (SPA Navigation)
The Route Changes (SPA Navigation) section shows throughput for Single Page Application route changes. It helps users understand how often users navigate between routes without a full page reload.
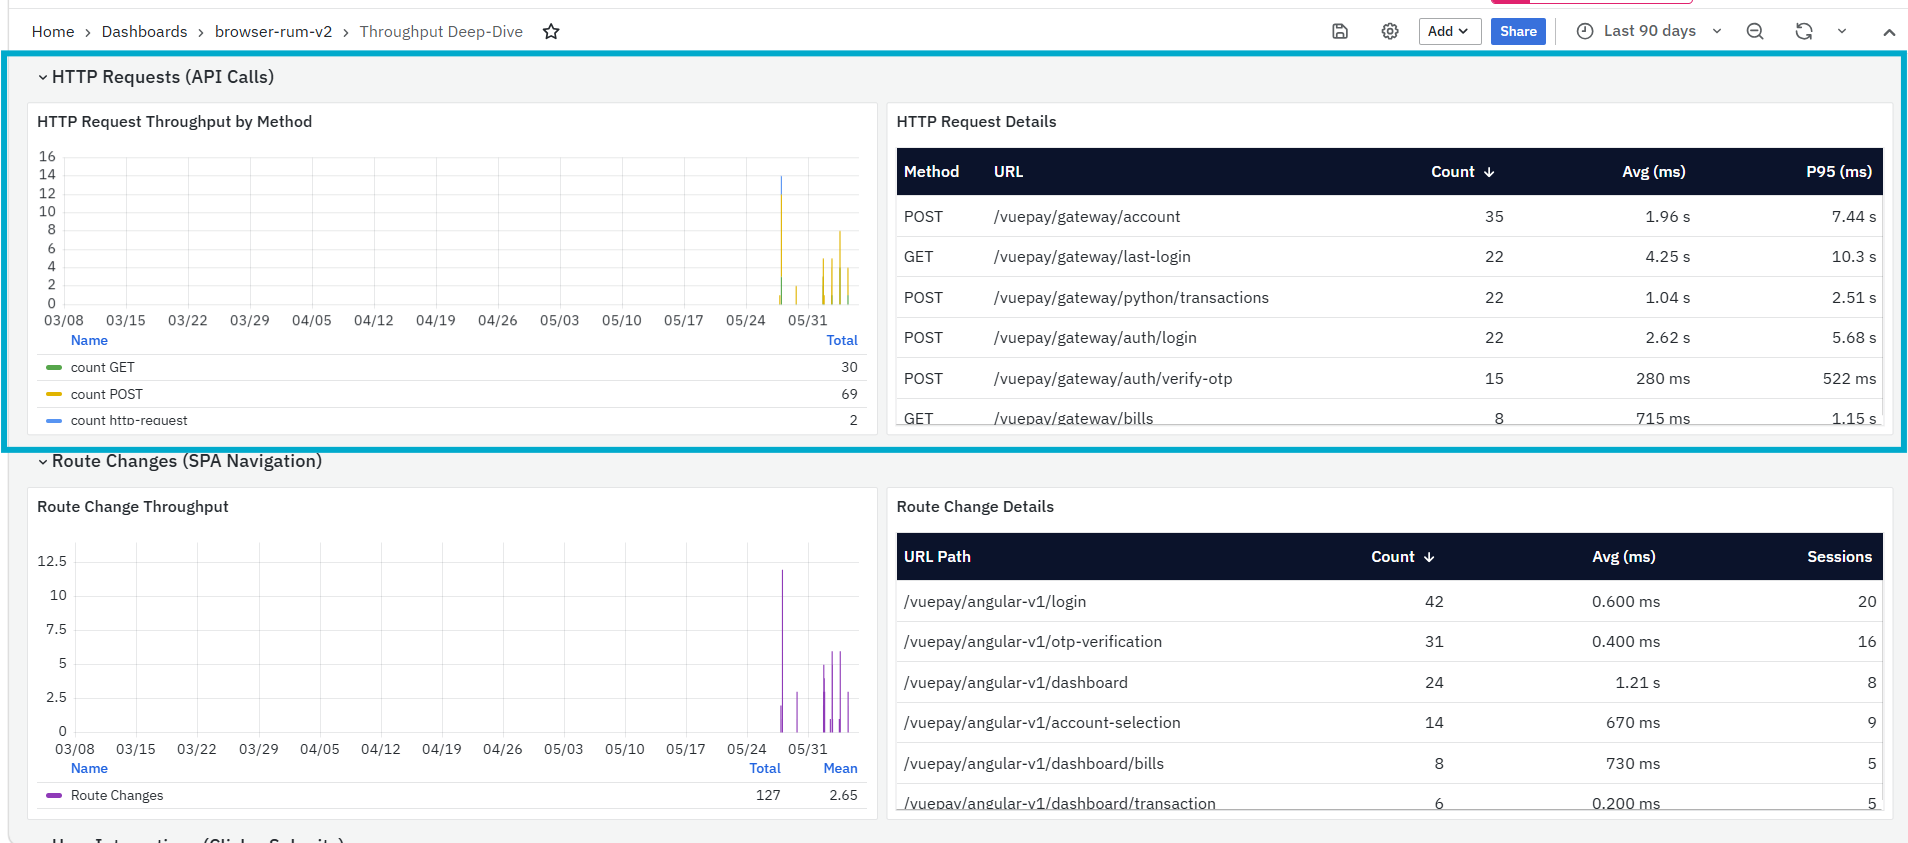
This section includes two panels:
- Route Change Throughput
- Route Change Details
It helps you identify:
- Routes with the highest navigation volume
- Route change spikes over time
- Frequently accessed SPA routes
- Routes with high average navigation duration
- Routes that should be reviewed in the Route Change Details dashboard
Route Change Throughput
The Route Change Throughput panel shows route change volume over time. It helps users identify route navigation spikes and understand when users are actively moving across the application. This panel is useful for analyzing Single Page Application navigation behavior. High route change volume should be reviewed with route latency and route-related HTTP requests.
Route Change Details
The Route Change Details panel lists route-level throughput details. It shows the route path, count, average duration, and number of sessions associated with each route.
The panel includes the following columns:
- URL Path: Displays the SPA route path.
- Count: Displays the number of route changes recorded for the route.
- Avg (ms): Displays the average route change duration.
- Sessions: Displays the number of sessions in which the route was accessed.
User Interactions (Clicks, Submits)
The User Interactions (Clicks, Submits) section shows throughput for user actions captured in the application. It helps users understand which interactions are performed most frequently and how user activity changes over time.
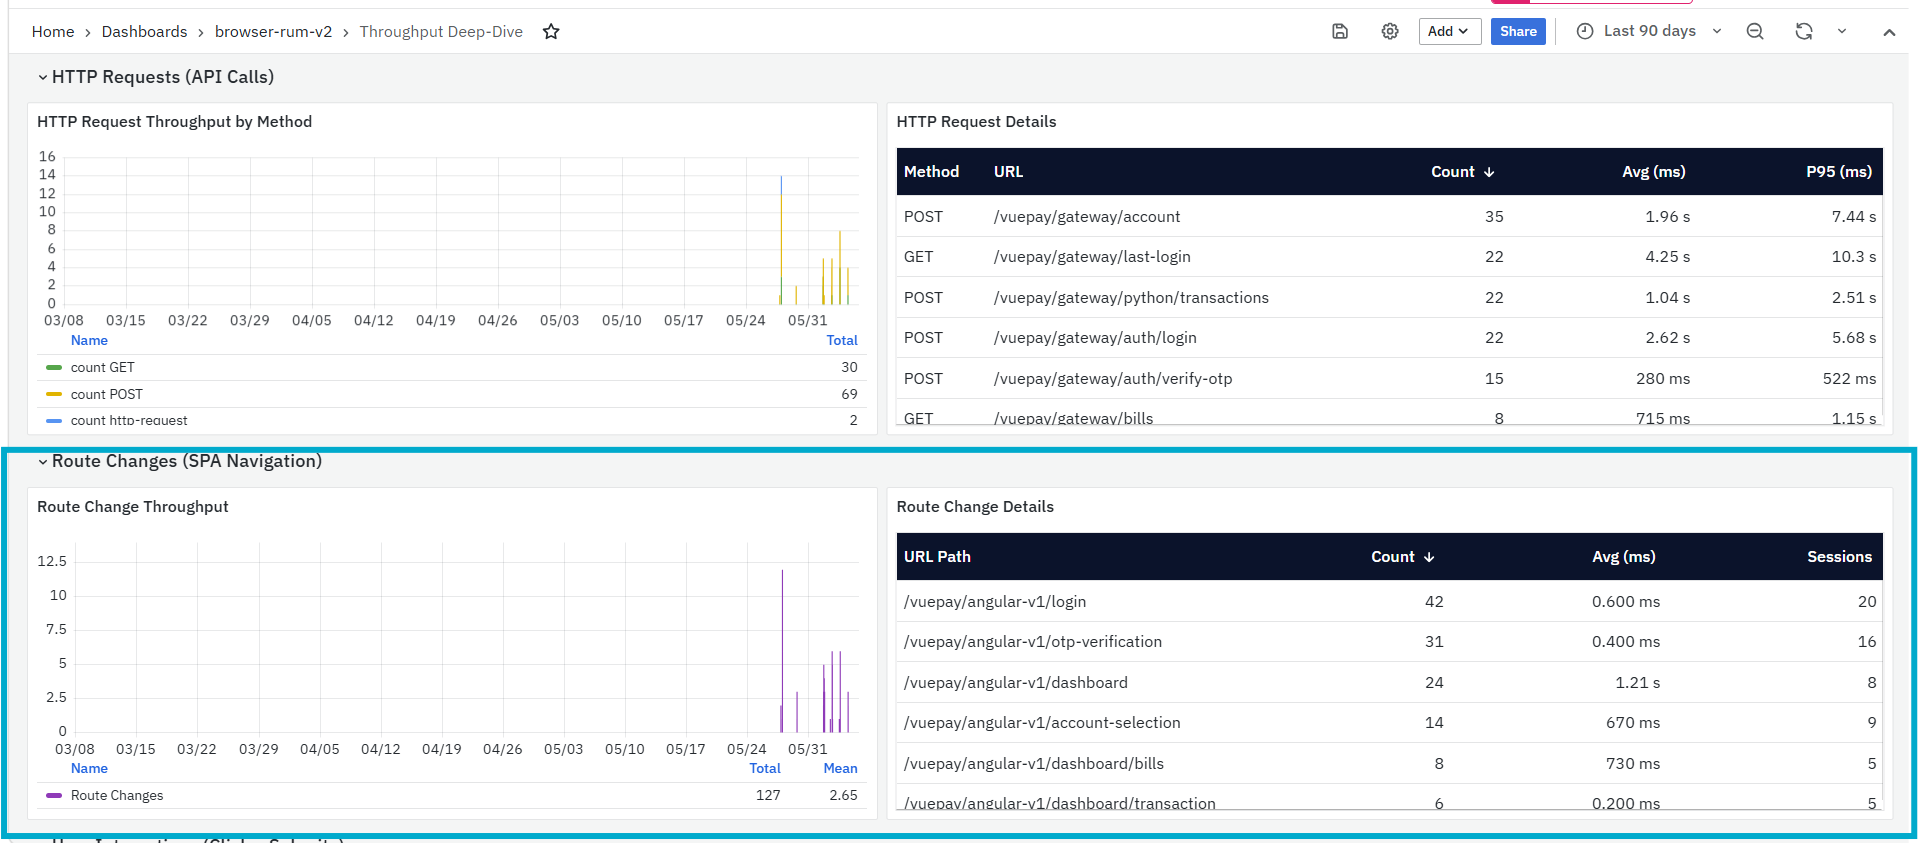
This section includes two panels:
- User Interaction Throughput
- User Interaction Details
It helps you identify:
- User actions performed most frequently
- Pages where users interact the most
- Interaction spikes over time
- Actions with higher average duration
- User behavior patterns that may need further investigation
User Interaction Throughput
The User Interaction Throughput panel shows user action volume over time. It helps users identify spikes in clicks, changes, submits, or other captured user interactions.
This panel is useful when users need to understand user engagement patterns and identify high-activity periods.
User Interaction Details
The User Interaction Details panel lists user interactions by action name. It shows how many times each interaction occurred, the average duration, and the page where it happened.
The panel includes the following columns:
- Interaction: Displays the user action, such as click or change events.
- Count: Displays the number of times the interaction occurred.
- Avg (ms): Displays the average duration of the interaction.
- Page: Displays the page where the interaction occurred.
This panel is useful when users need to identify frequently performed actions and check whether any user interaction is taking longer than expected.
Long Tasks (Main Thread Blocking)
The Long Tasks (Main Thread Blocking) section shows long JavaScript task activity. Long tasks may block the browser main thread and affect responsiveness.
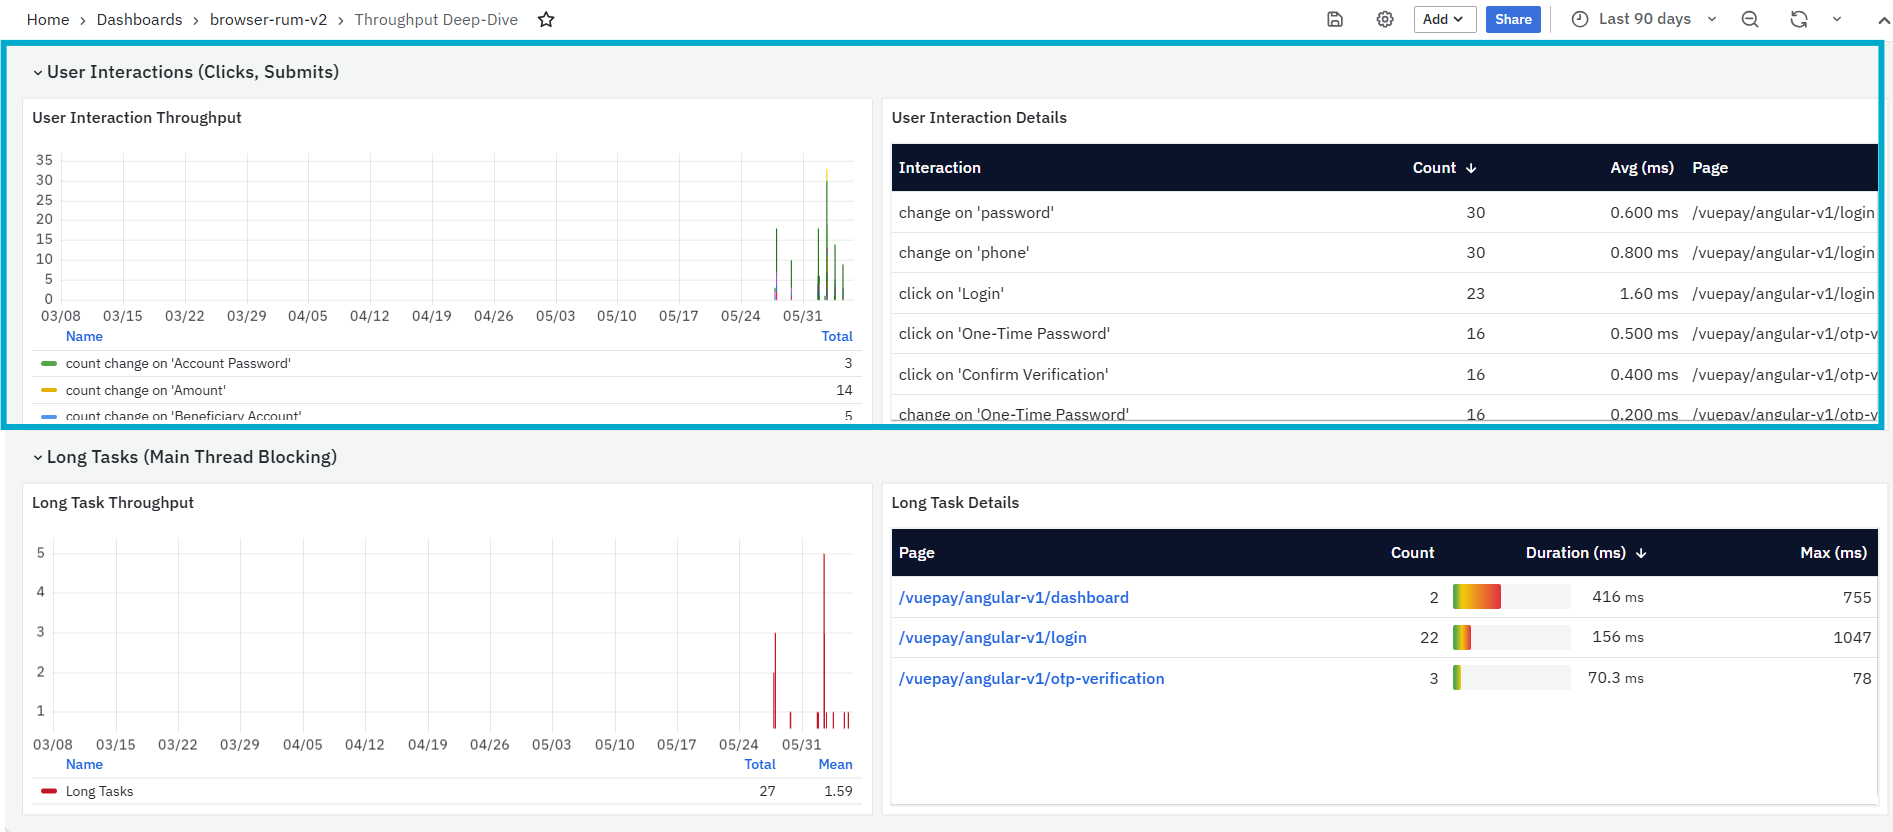
This section includes two panels:
- Long Task Throughput
- Long Task Details
It helps you identify:
- Pages where long tasks are occurring
- Long task spikes over time
- JavaScript activity that may block the browser main thread
- Pages with high long task duration or high long task count
- Frontend areas that may need script optimization or performance tuning
Long Task Throughput
The Long Task Throughput panel shows long task volume over time. It helps users identify periods where blocking JavaScript activity increased.
This panel is useful when users need to detect frontend performance warnings. Spikes in long task throughput may indicate heavy JavaScript execution, rendering delays, or inefficient frontend logic.
Long Task Details
The Long Task Details panel lists pages where long tasks occurred. It shows the number of long tasks, average duration, and maximum duration for each page.
The panel includes the following columns:
- Page: Displays the page where long tasks occurred. The Page value is clickable and can be used to open page-level details.

-
The Page Load Details dashboard provides a detailed view of the selected page’s performance. It shows page health, Core Web Vitals, error analysis, page load timing breakdown, resource loading analysis, HTTP requests, page performance, user segments, session drill-down, and trace waterfall. For more details refer to Page load details.
-
Count: Displays the number of long tasks recorded for the page.
-
Duration (ms): Displays the average long task duration.
-
Max (ms): Displays the maximum long task duration observed for the page.
This panel is useful when users need to identify pages affected by blocking JavaScript. Pages with higher long task count or duration should be reviewed for script optimization, reduced main-thread work, or frontend performance improvements.
Error Deep-Dive Dashboard
The Error Deep-Dive Dashboard is a dashboard in the Browser Real User Monitoring module. It provides a focused view of errors captured for the selected application across page loads, HTTP requests, route changes, and user interactions. This dashboard helps users understand where errors are occurring, which error category contributes the most failures, and which endpoints or user actions need investigation. It is useful when users want to move from a high-level error rate to detailed error analysis.
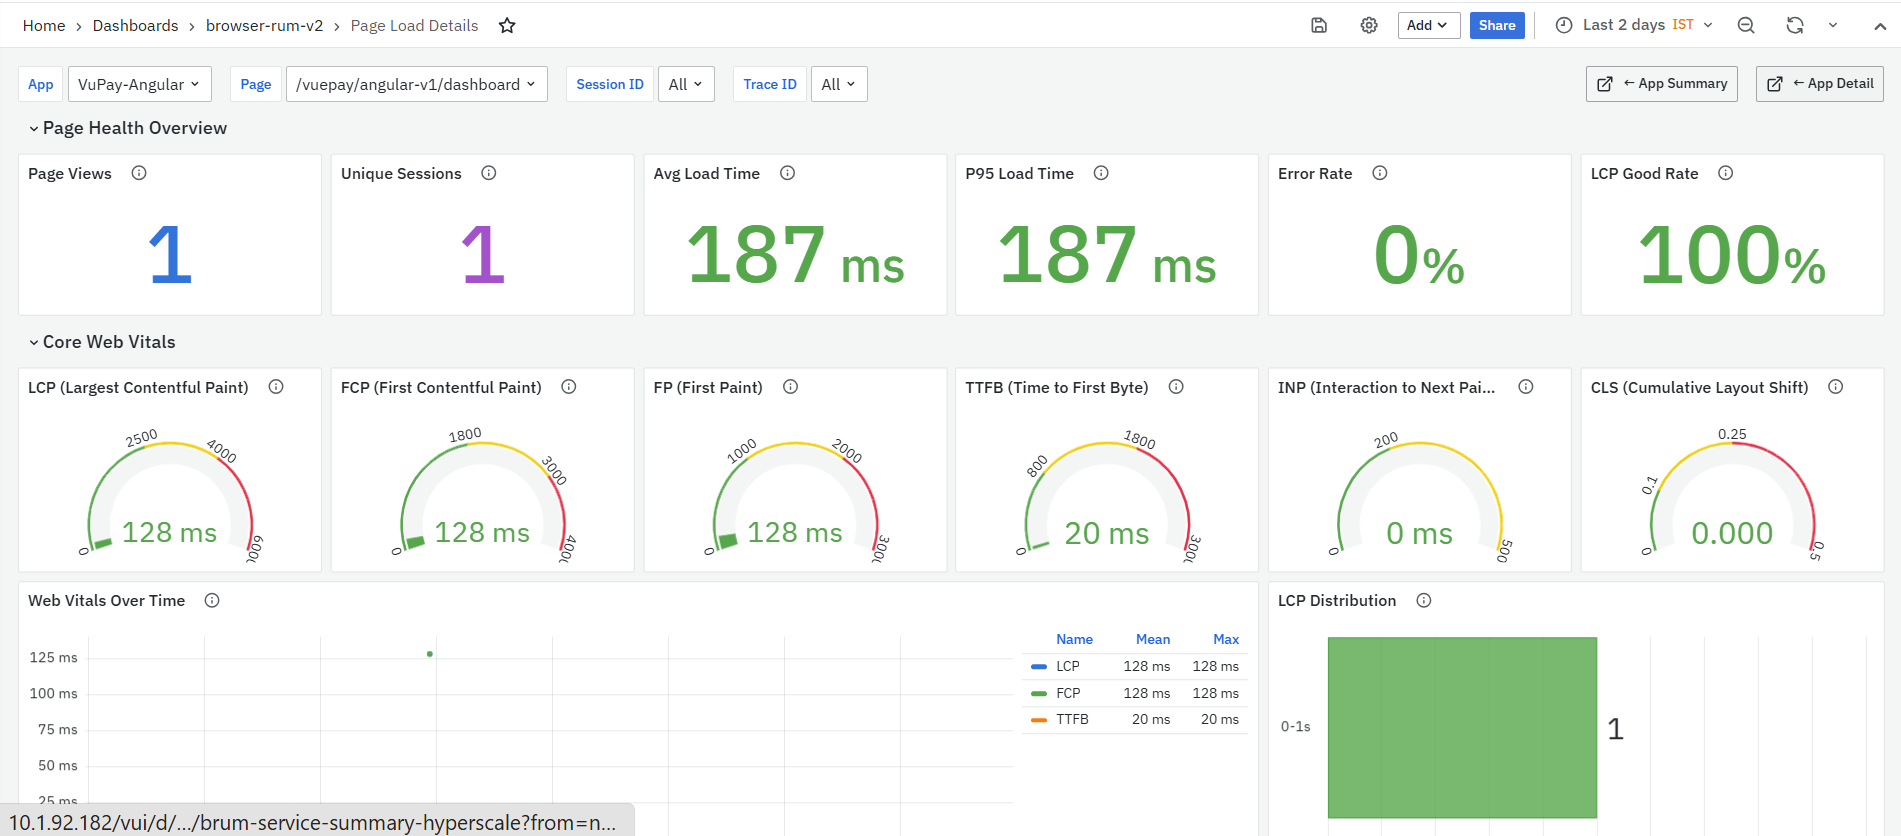
The dashboard is divided into the following sections:
-
Overall Error Summary
-
Page Load Errors
-
HTTP Request Errors
-
Route Change Errors
-
User Interaction Errors
At the top of the dashboard, users can apply the App filter to view error data for a selected application.
Related Dashboard
The Error Deep-Dive dashboard includes related dashboard links at the top-right side of the page. These links help users move from error analysis to other BRUM dashboards.
App Overview - The App Overview dashboard provides a high-level view of all monitored browser applications. It helps users compare applications by average latency, throughput, error rate, and trend. For more details refer to App Overview.
App Detail - The App Detail dashboard provides a detailed view of the selected application’s browser-side performance. It includes app health, errors, latency, HTTP requests, web vitals, sessions, traces, and geography-level details. For more details refer to App Detail.
Latency - The Latency Deep-Dive dashboard provides a focused view of latency across the selected application. It helps users analyze slow pages, HTTP requests, route changes, and user interactions. For more details refer to Latency Deep-Dive .
Throughput Deep-Dive - The Throughput dashboard provides a focused view of application traffic and activity volume. It helps users analyze page load events, HTTP requests, route changes, user interactions, and long tasks. For more details refer to Throughput Deep-Dive .
Overall Error Summary
The Overall Error Summary section provides a high-level summary of errors grouped by category. It helps users quickly understand which type of browser-side activity is contributing to errors.

This section includes two panels:
-
Errors by Category
-
Category Error Summary
Errors by Category
The Errors by Category panel displays the distribution of errors across categories in a donut chart. Categories can include HTTP Request, Route Change, User Interaction, and Page Load.
It helps you identify:
-
Which error category contributes the most errors
-
Whether errors are mainly coming from HTTP requests, page loads, route changes, or user interactions
-
Which category should be investigated first
The chart also shows the value and percentage contribution for each error category.
Category Error Summary
The Category Error Summary panel displays error metrics grouped by category. This panel gives a table-level view of error count, trend, total activity, error percentage, and top error.
It helps you identify:
-
Error count by category
-
Error trend for each category
-
Total events recorded for each category
-
Error percentage by category
-
The most frequent error, where available

The panel includes the following columns:
-
Category: Displays the error category, such as HTTP Request, Route Change, User Interaction, or Page Load.
-
Errors: Displays the number of errors observed in that category.
-
Trend: Displays a sparkline showing how errors changed over time.
-
Total: Displays the total number of events for that category.
-
Error %: Displays the percentage of events that resulted in errors.
-
Top Error: Displays the most common error for the category, where available.
Page Load Errors
The Page Load Errors section displays errors related to full page load activity. This section helps users understand whether page loading is failing or generating errors during browser navigation.
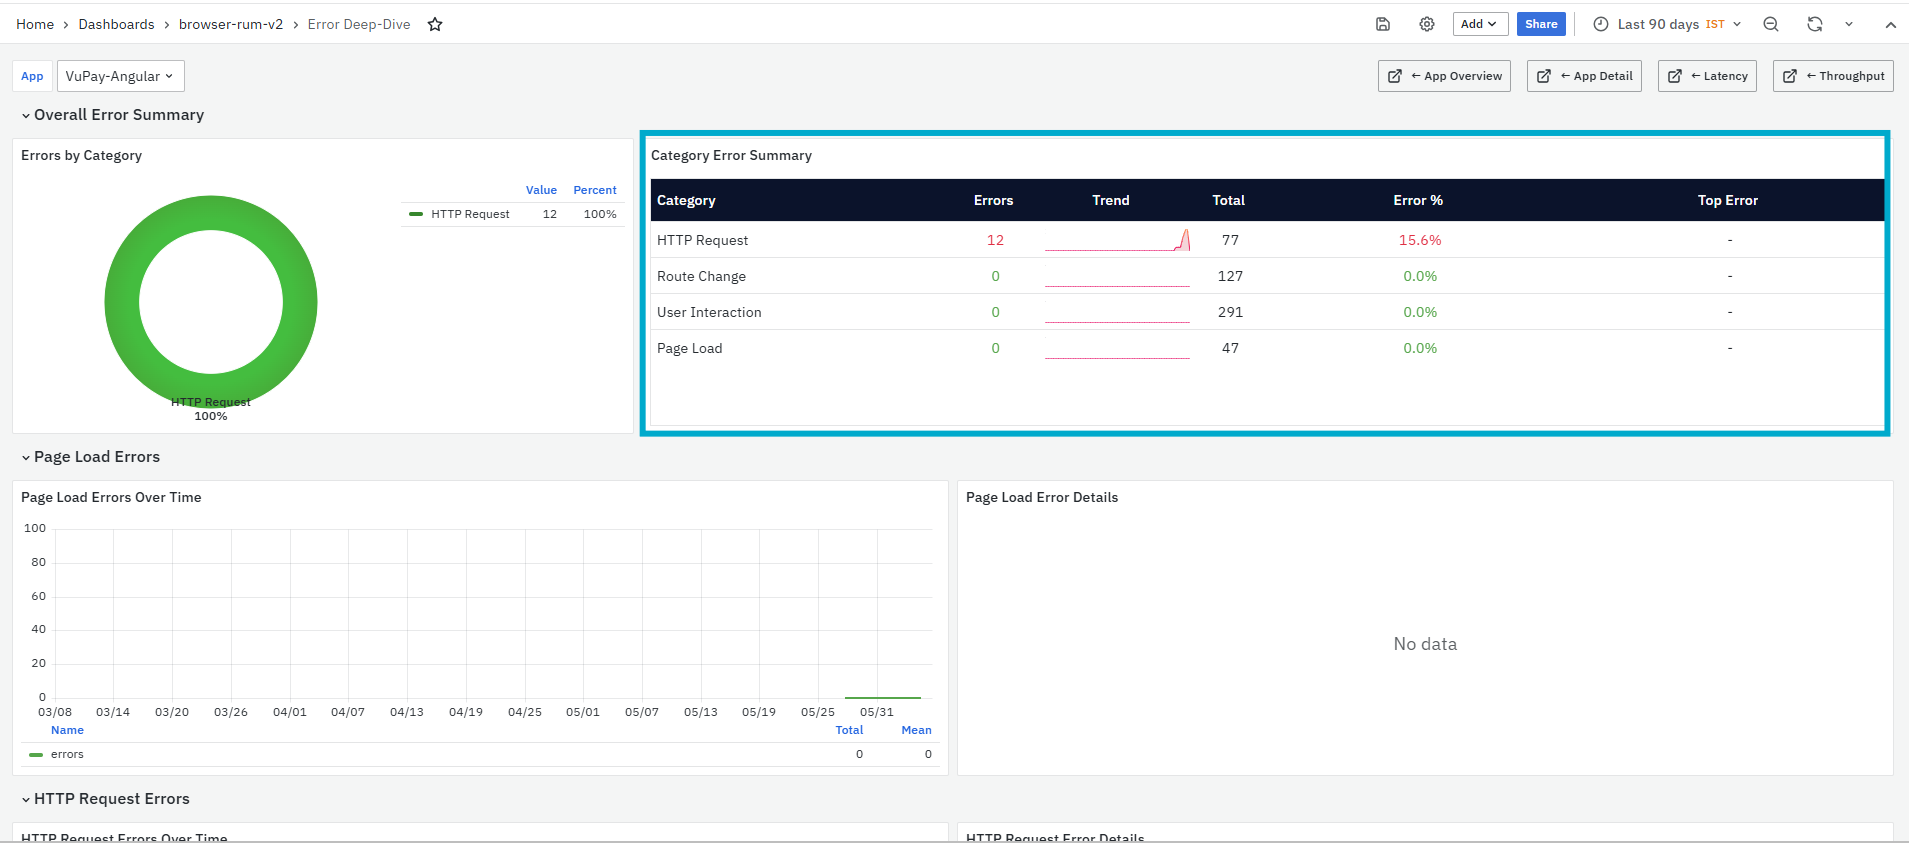
This section includes two panels:
-
Page Load Errors Over Time
-
Page Load Error Details
Page Load Errors Over Time
The Page Load Errors Over Time panel displays page load error count over the selected time range.
It helps you identify:
-
Page load error spikes
-
Time periods where page load failures occurred
-
Whether page load errors are increasing or reducing
-
Specific time windows that need further investigation
Page Load Error Details
The Page Load Error Details panel displays detailed page load error records, where available.
It helps you identify:
-
Pages affected by page load errors
-
Error details related to page load failures
-
Page load issues that require deeper investigation
If there is no matching data for the selected filters or time range, the panel displays No data.
HTTP Request Errors
The HTTP Request Errors section displays errors related to HTTP/API requests made by the browser application. This section is useful for identifying failed API calls and endpoints returning error status codes.
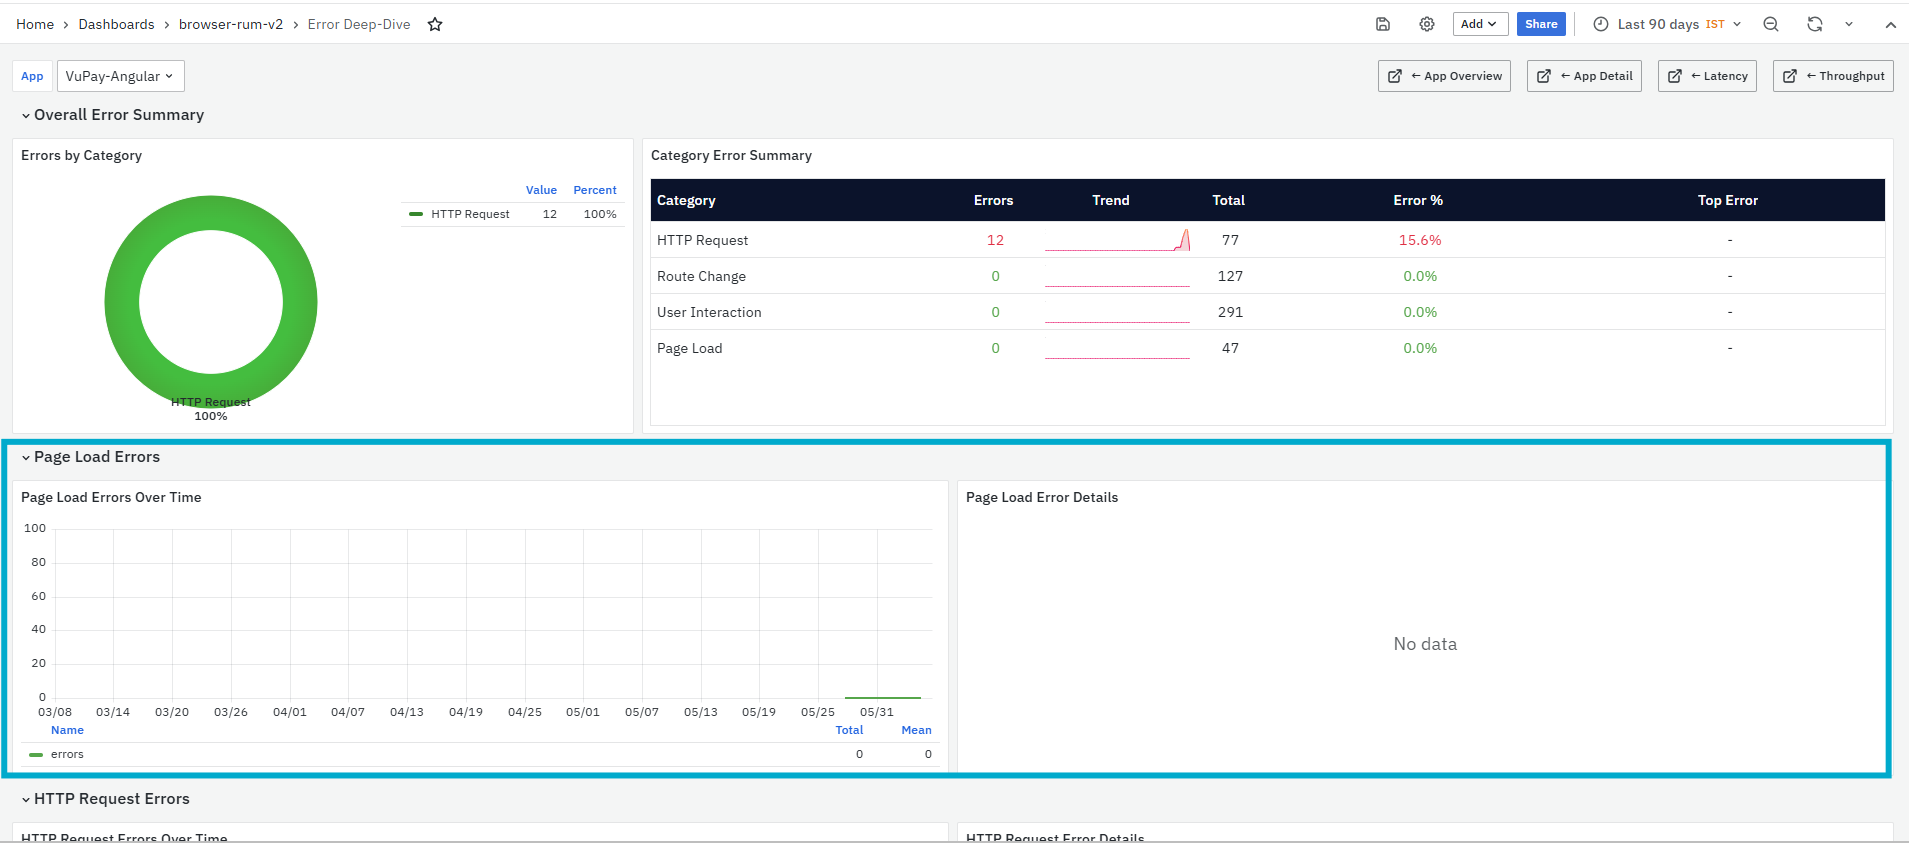
This section includes two panels:
-
HTTP Request Errors Over Time
-
HTTP Request Error Details
HTTP Request Errors Over Time
The HTTP Request Errors Over Time panel displays HTTP request error count over the selected time range.
It helps you identify:
-
HTTP request error spikes
-
Time periods where API failures occurred
-
Whether request errors are increasing or reducing
-
Error behavior during specific traffic periods
HTTP Request Error Details
The HTTP Request Error Details panel lists HTTP request errors grouped by status code and endpoint.
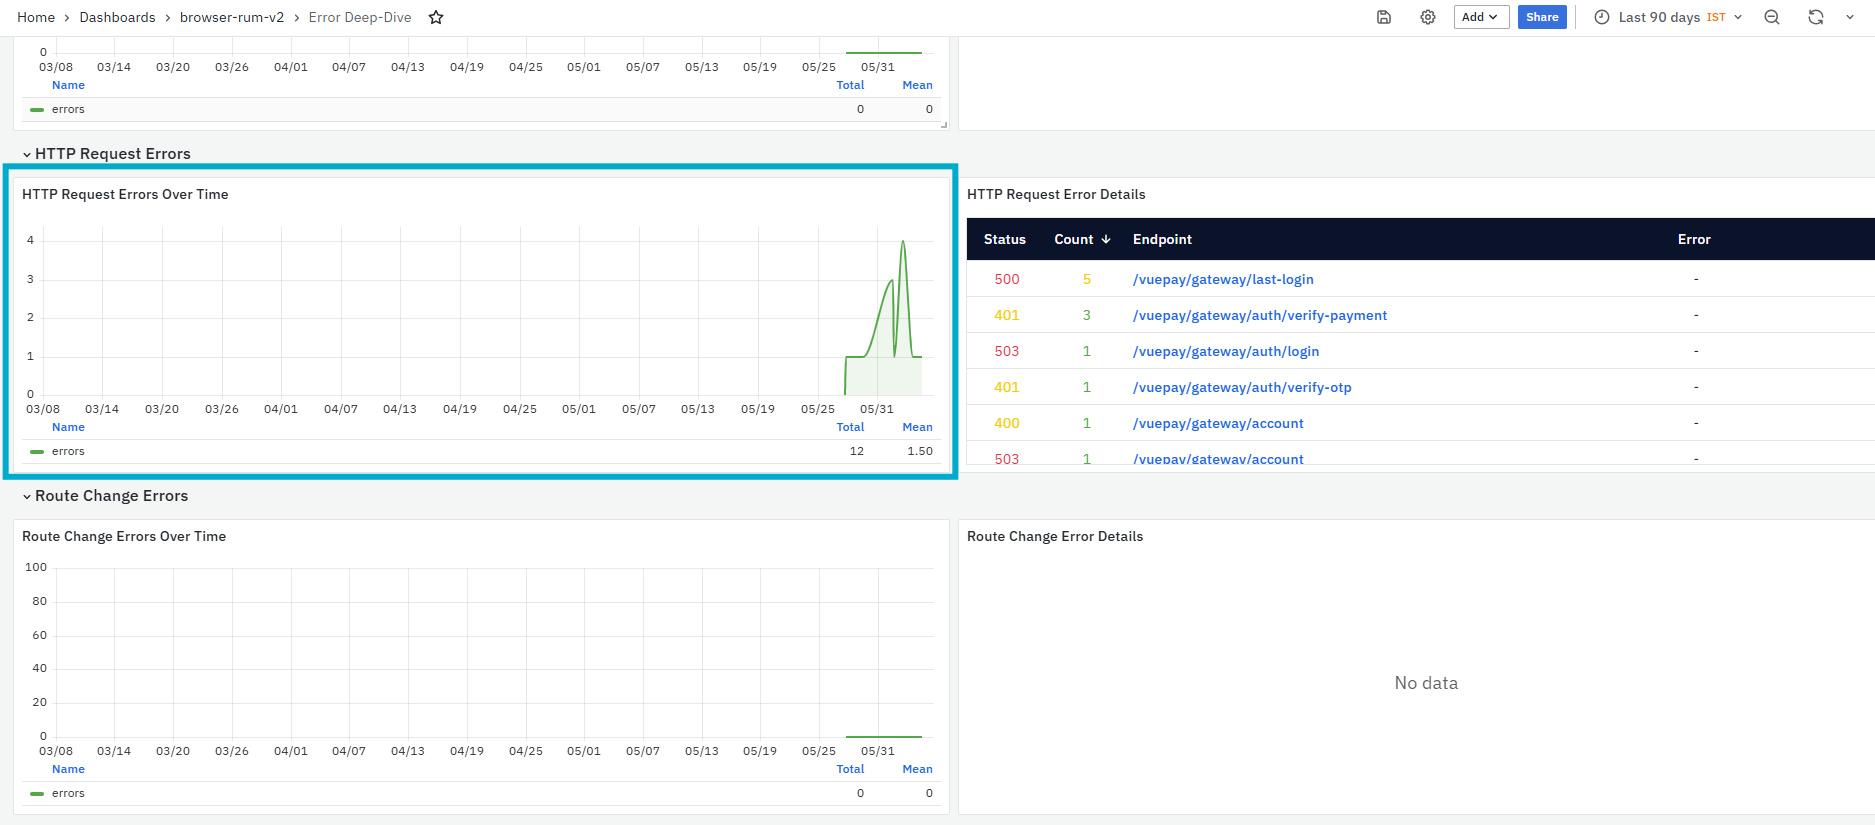
It helps you identify:
-
HTTP status codes causing failures
-
Endpoints with the highest error count
-
APIs that may need immediate investigation
-
Whether errors are caused by client-side or server-side responses
The panel includes the following columns:
-
Status: Displays the HTTP status code, such as 400, 401, 500, or 503.
-
Count: Displays the number of errors for that status and endpoint.
-
Endpoint: Displays the HTTP/API endpoint where the error occurred. The Endpoint value is clickable. When clicked, it opens the HTTP Request Details dashboard for the selected endpoint.
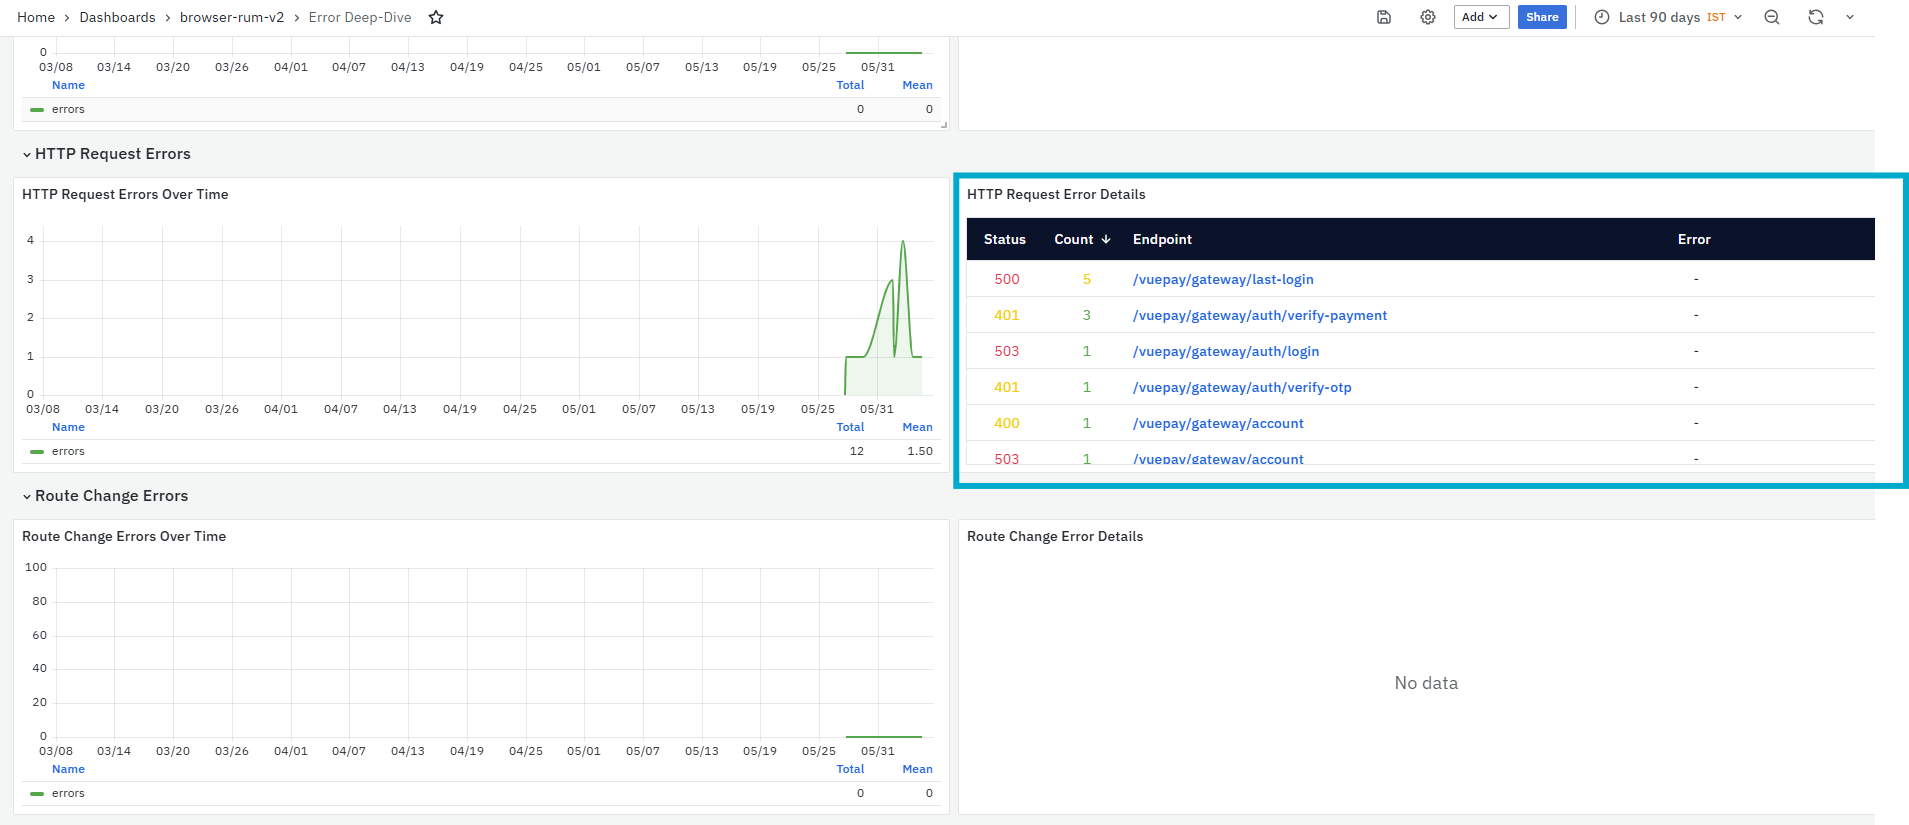
-
The HTTP Request Details Dashboard is a dashboard in the Browser Real User Monitoring module. It provides a focused view of a selected HTTP/API request endpoint, including request volume, latency, error rate, status distribution, timing breakdown, user segments, recent errors, and recent requests.
-
Error: Displays the error message or error detail, where available.
Route Change Errors
The Route Change Errors section displays errors related to Single Page Application route changes. A route change occurs when users move between views or pages without a full browser reload.
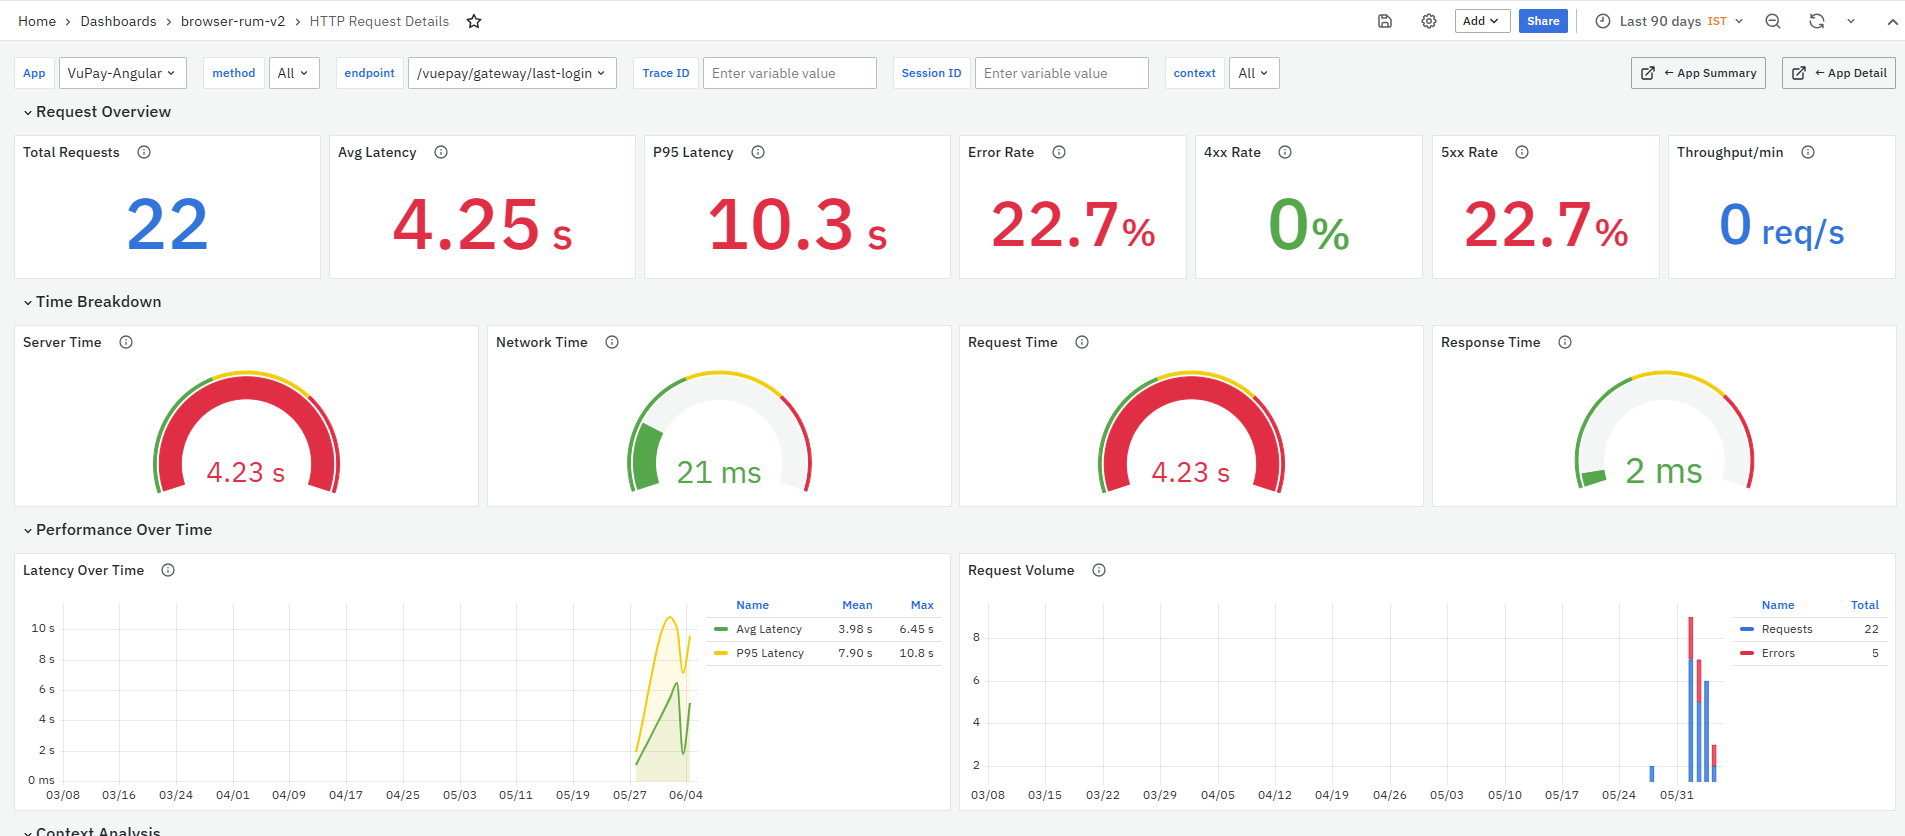
This section includes two panels:
-
Route Change Errors Over Time
-
Route Change Error Details
Route Change Errors Over Time
The Route Change Errors Over Time panel displays route change error count over the selected time range.
It helps you identify:
-
Route navigation error spikes
-
Time periods where SPA navigation failed
-
Whether route change errors are recurring
-
Routes that may need deeper investigation
Route Change Error Details
The Route Change Error Details panel displays detailed route change error records, where available.
It helps you identify:
-
Routes affected by errors
-
Error details related to SPA navigation
-
Route changes that may be impacting user experience
If there is no matching data for the selected filters or time range, the panel displays No data.
User Interaction Errors
The User Interaction Errors section displays errors related to user actions such as clicks, submissions, or other browser interactions.
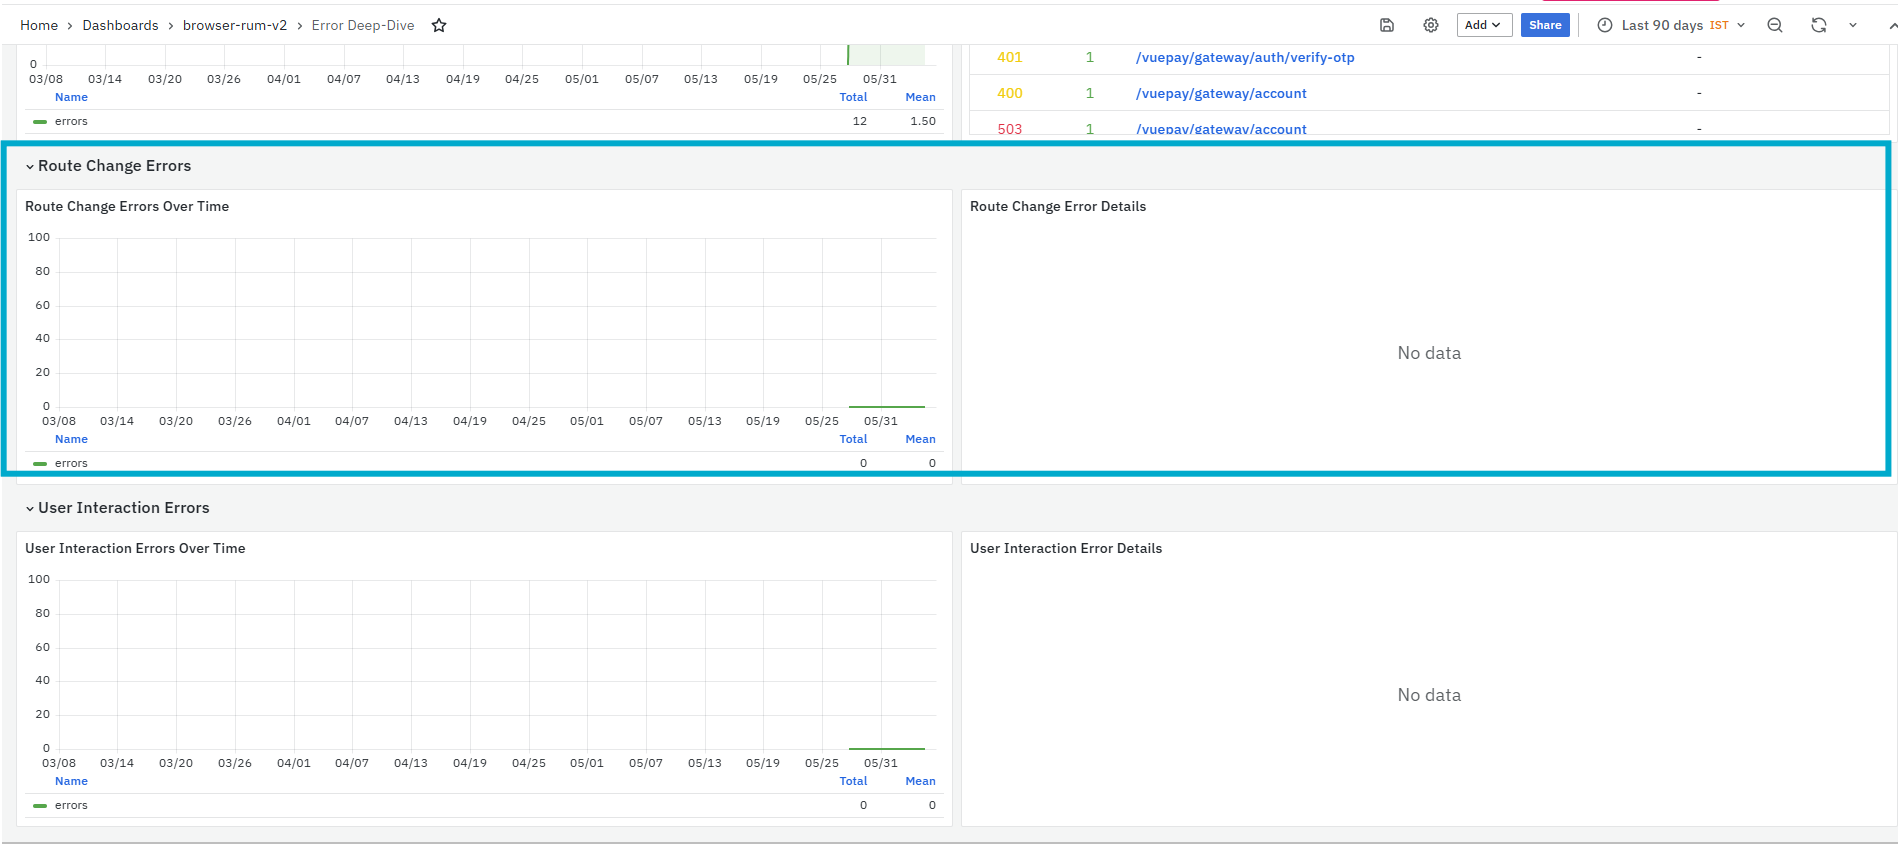
This section includes two panels:
-
User Interaction Errors Over Time
-
User Interaction Error Details
User Interaction Errors Over Time
The User Interaction Errors Over Time panel displays user interaction error count over the selected time range.
It helps you identify:
-
User action error spikes
-
Time periods where interactions failed
-
Whether errors are linked to user actions
-
Interaction-related issues that need investigation
User Interaction Error Details
The User Interaction Error Details panel displays detailed user interaction error records, where available.
It helps you identify:
-
User actions affected by errors
-
Interaction failures that may impact user journeys
-
Error details related to clicks, submissions, or other actions
If there is no matching data for the selected filters or time range, the panel displays No data.
Session Overview Dashboard
The Session Overview Dashboard is a dashboard in the Browser Real User Monitoring module. It provides an application-level view of user sessions, session outcomes, engagement, conversions, journey flow, session performance, long tasks, errors, user segments, and session-level drill-down data. This dashboard helps users understand how users are interacting with the selected application, how long sessions last, where users enter and exit, how many sessions have errors, whether users are converting successfully, and which sessions require deeper investigation.
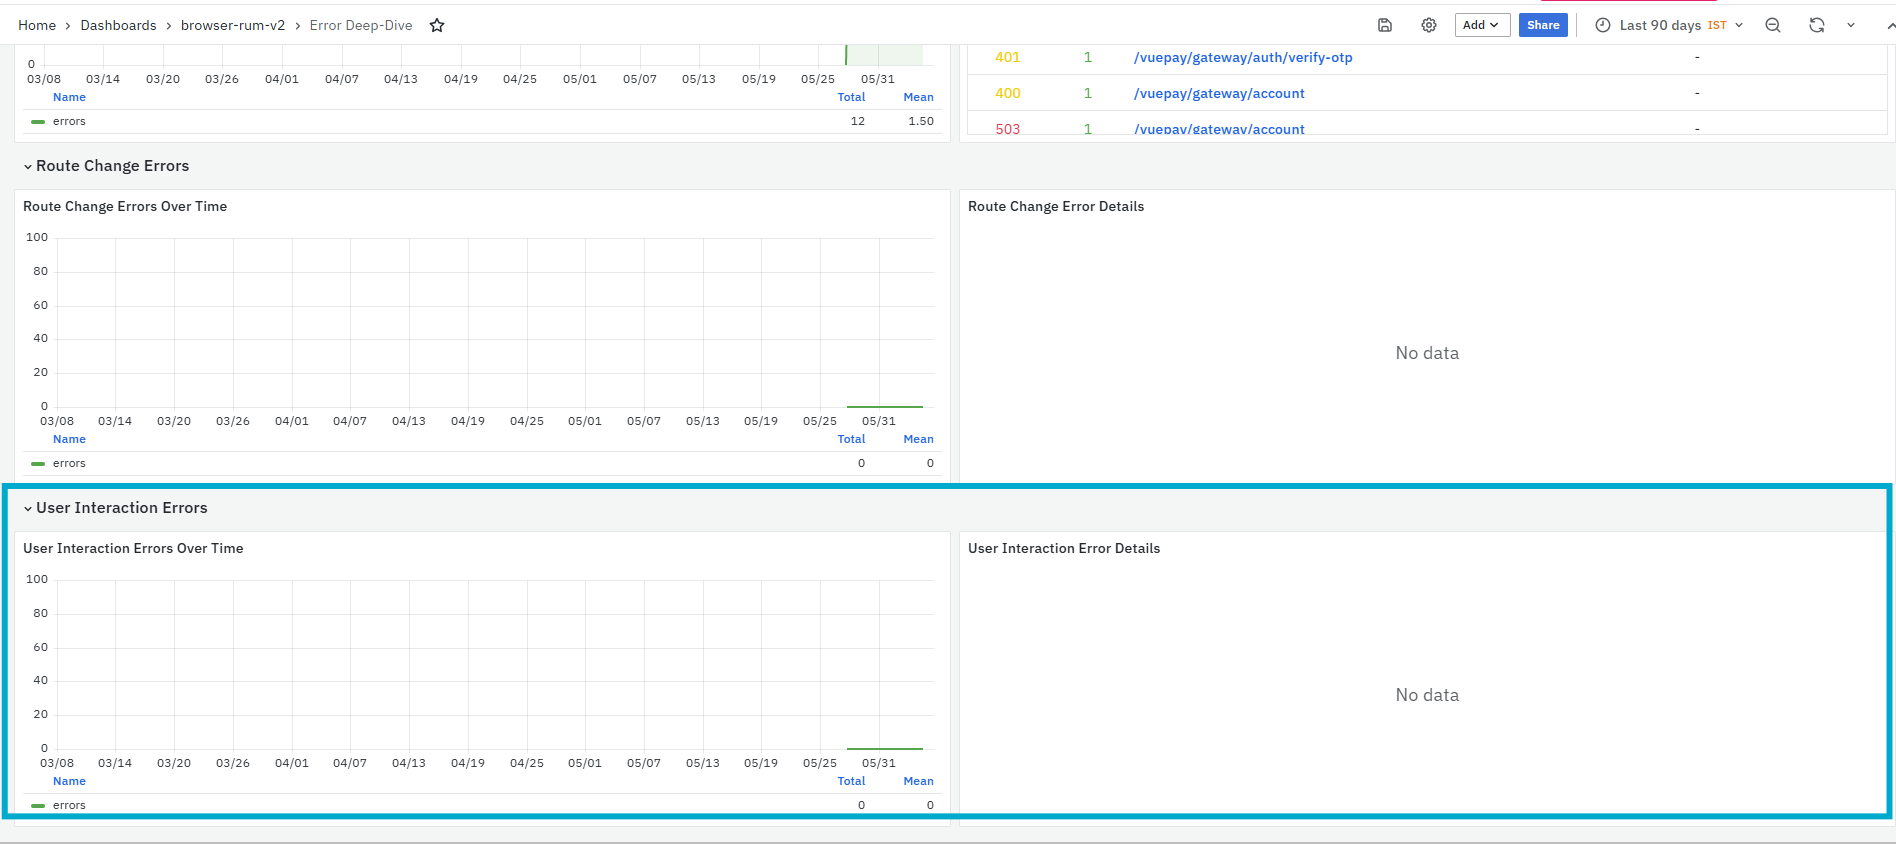
The dashboard is divided into the following sections:
- Session Overview
- Session Outcomes
- Session Trends
- Conversion Tracking
- User Journey
- Page Transitions
- Session Performance
- Long Tasks (Performance Warnings)
- Error Analysis
- User Segments
- Session List
Related Dashboard
The Session Overview dashboard includes related dashboard links at the top-right side of the page.
● App Overview: Opens the App Overview dashboard for the selected application. This helps users review high-level application performance, latency, throughput, and error trends. For more details refer to App Overview.
- App Detail: Opens the App Details dashboard for deeper application-level analysis. This helps users review app health, impact analysis, performance timeline, HTTP requests, page performance, web vitals, user segments, sessions, and traces. For more details refer to App Detail.
- Page Load: Opens the Page Load Details dashboard. This helps users analyze page-level performance, Core Web Vitals, load timing, resource loading, errors, user segments, and trace waterfall details. For more details refer to Page Load.
- HTTP Request: Opens the HTTP Request Details dashboard. This helps users analyze API latency, request volume, error rate, 4xx/5xx rate, endpoint performance, recent requests, and endpoint-level issues. For more details refer to HTTP Request.
- Route Change: Opens the Route Change Details dashboard. This helps users analyze SPA navigation timing, route duration, XHR contribution, route-related HTTP requests, navigation flow, browser performance, and OS performance. For more details refer to Route Change.
Session Overview
The Session Overview section provides key session-level indicators for the selected application. It helps users quickly understand total user activity, error impact, average engagement time, navigation behavior, bounce rate, conversion rate, and overall session error rate.
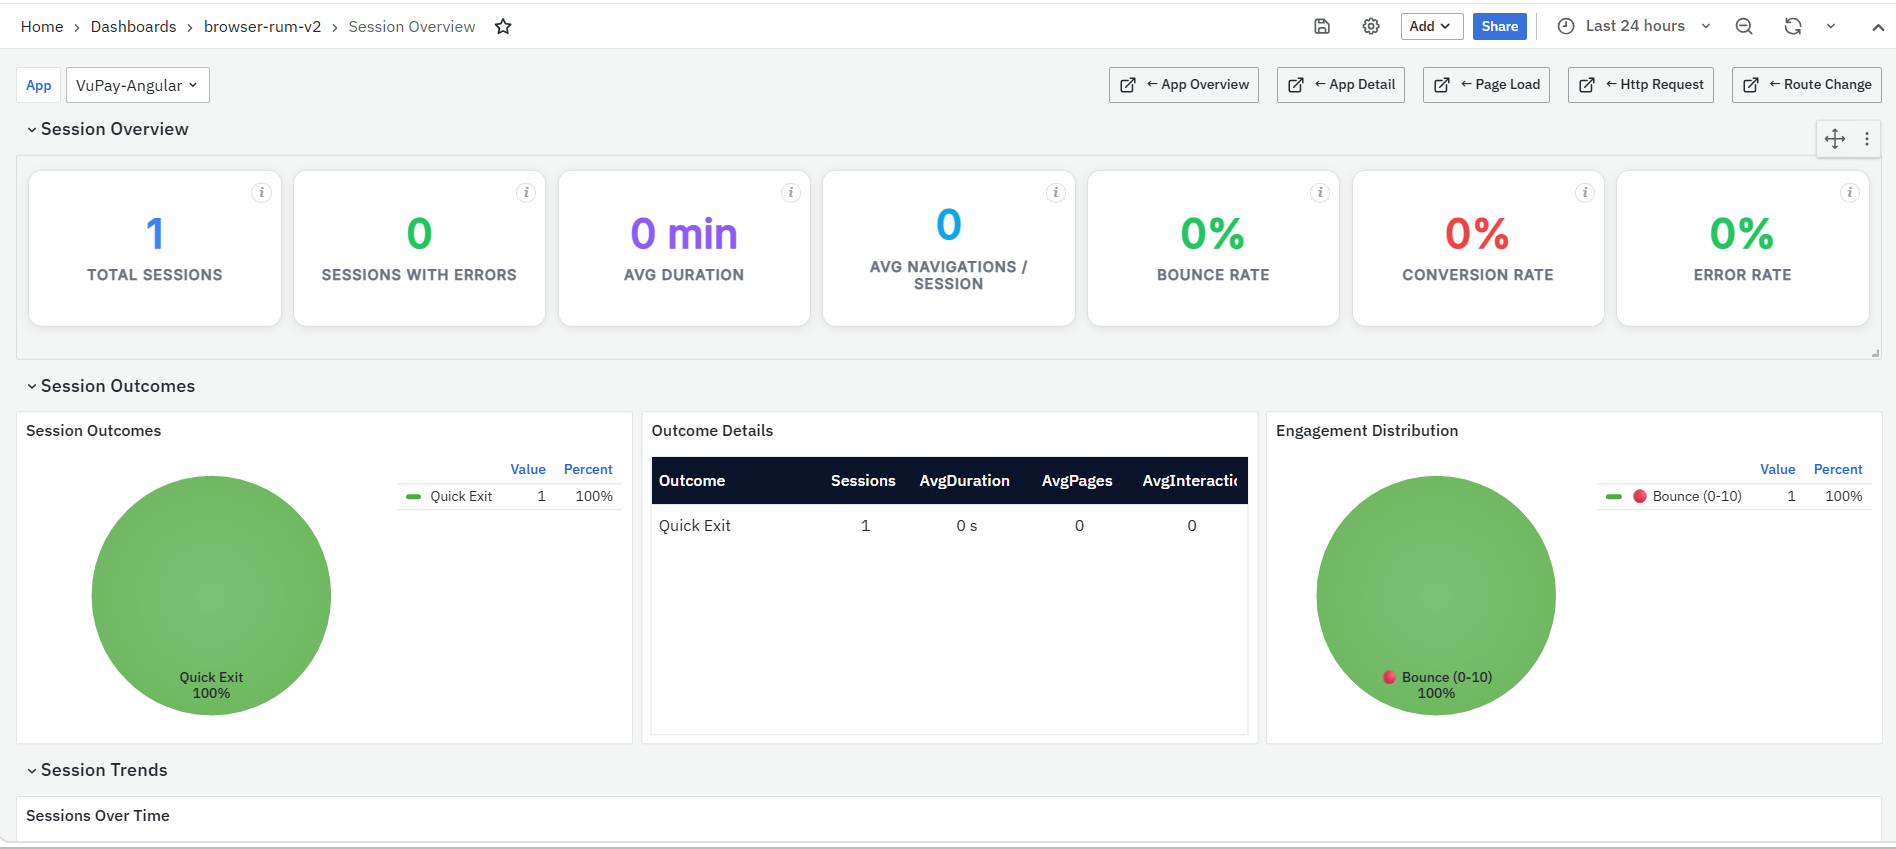
This section includes seven panels:
- Total Sessions
- Sessions with Errors
- Avg Duration
- Avg Navigations / Session
- Bounce Rate
- Conversion Rate
- Error Rate
Total Sessions
The Total Sessions panel displays the count of unique session IDs captured in the selected time range. It represents the total number of user sessions observed for the selected application. This panel helps users understand overall user activity. A higher session count provides more context for evaluating errors, conversions, bounce rate, and performance trends.
Sessions with Errors
The Sessions with Errors panel displays the number of sessions that had at least one error. This can include JavaScript errors, non-empty error values, or sessions where the status indicates an error. This panel helps users understand how many user journeys were affected by failures. A high value indicates that error analysis and affected sessions should be reviewed further.
Avg Duration
The Avg Duration panel displays the average session duration in minutes. It is calculated using the time difference between the first and last span captured in each session. This panel helps users understand how long users typically stay active in the application. Very short sessions may indicate bounce or drop-off, while longer sessions may indicate deeper user engagement.
Avg Navigations / Session
The Avg Navigations / Session panel displays the average number of page loads and route changes per session. It includes both full page loads and Single Page Application route navigations. This panel helps users understand how much users move through the application during each session. A higher value may indicate active user journeys, while a lower value may indicate limited navigation or early drop-off.
Bounce Rate
The Bounce Rate panel displays the percentage of single-page sessions with no route changes and no interactions. A bounced session is counted when there is one page view, zero navigations, and zero interactions. This panel helps users identify whether users are leaving after viewing only one page. A high bounce rate may indicate poor landing page experience, slow load time, irrelevant content, or user drop-off.
Conversion Rate
The Conversion Rate panel displays the percentage of sessions that reached a defined conversion page or status. Conversion detection is based on the page containing terms such as transaction or status, or the HTTP URL containing transaction-status. This panel helps users understand how many sessions reached the intended business outcome. A low conversion rate may indicate drop-offs, errors, poor navigation flow, or page performance issues.
Error Rate
The Error Rate panel displays the percentage of sessions that experienced at least one error. This is calculated at the session level, not the span level. This panel helps users understand the overall failure impact across user journeys. A high error rate indicates that users are encountering issues and that affected sessions should be investigated.
Session Outcomes
The Session Outcomes section classifies sessions based on user behavior and result. It helps users understand whether sessions ended in success, bounce, quick exit, light engagement, or engagement with errors.
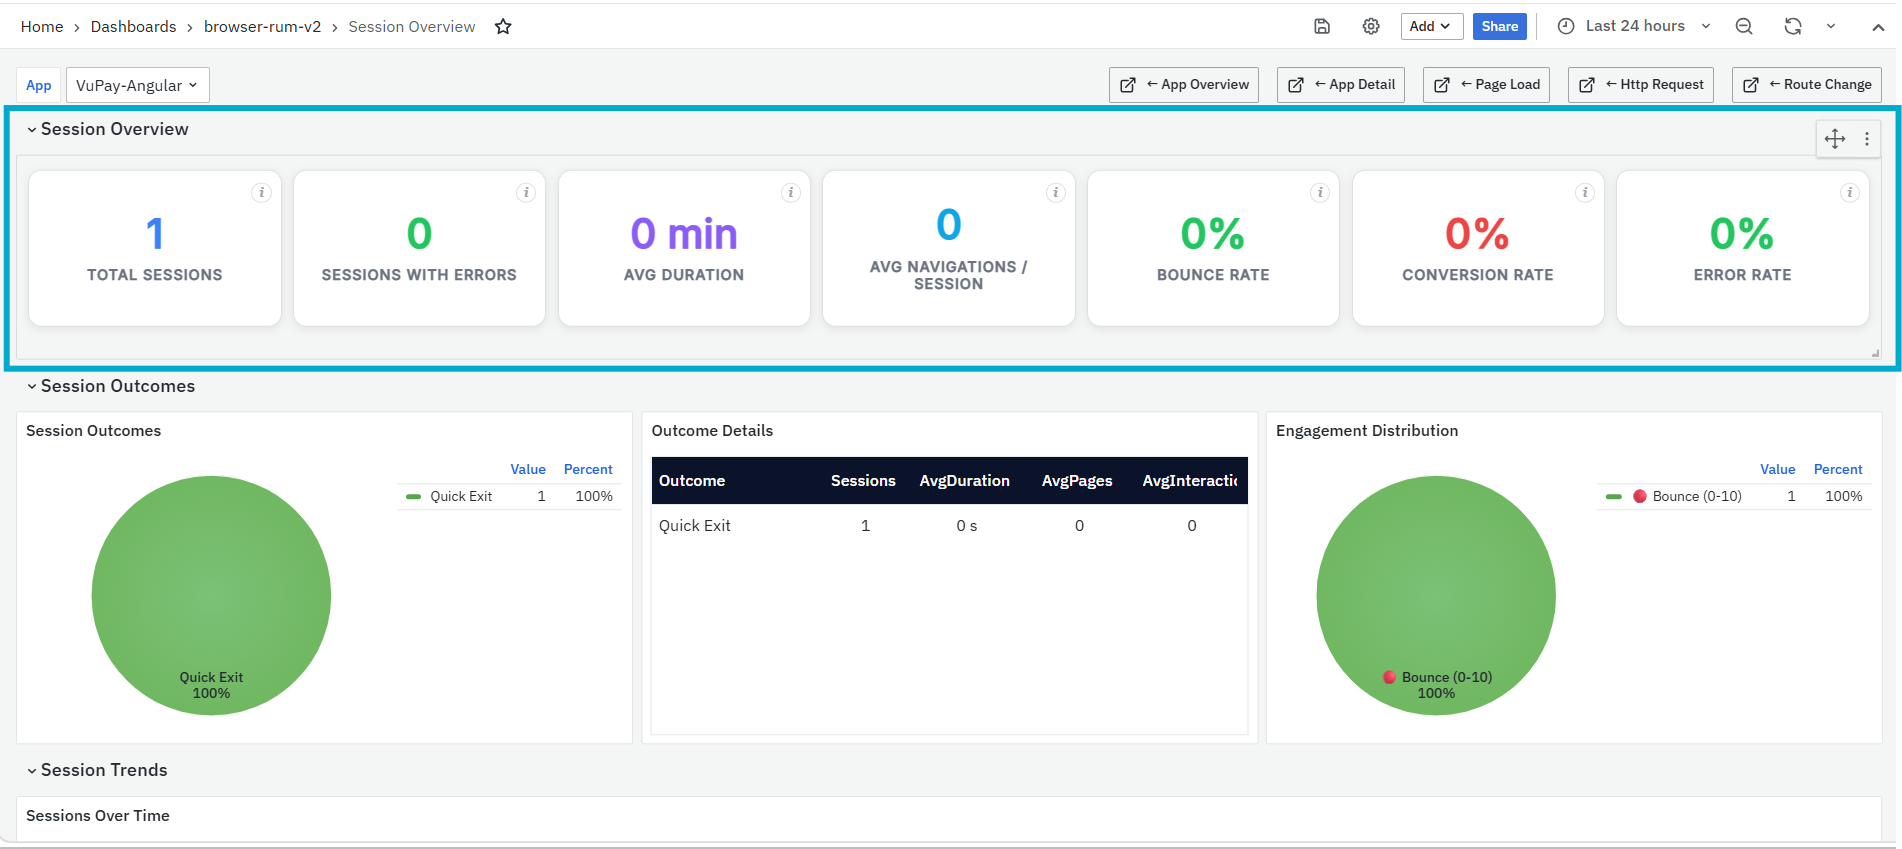
This section includes three panels:
- Session Outcomes
- Outcome Details
- Engagement Distribution
Session Outcomes
The Session Outcomes panel shows the distribution of sessions by outcome category. It helps users quickly identify how many sessions were successful, bounced, exited quickly, lightly engaged, or engaged with errors.
This panel is useful for understanding session quality. If many sessions fall under bounce, quick exit, or engaged with errors, users should review page performance, errors, and journey flow.
Outcome Details
The Outcome Details panel provides a table view of session outcomes with supporting metrics such as session count, average duration, average pages, and average interactions.
The panel includes the following columns:
- Outcome: Displays the session outcome category.
- Sessions: Displays the number of sessions in that outcome.
- Avg Duration: Displays the average duration of sessions in that outcome.
- AvgPages: Displays the average number of pages viewed.
- AvgInteract: Displays the average number of user interactions.
This panel helps users compare outcome categories and understand whether poor outcomes are linked to short duration, fewer pages, or low interaction.
Engagement Distribution
The Engagement Distribution panel shows the distribution of sessions by engagement level, such as power user, bounce, moderate, or light engagement. This panel helps users understand how deeply users interact with the application. It is useful for identifying whether most users are actively engaged or only briefly visiting the application.
Session Trends
The Session Trends section shows how sessions changed over time. It helps users identify session spikes, drops, and usage patterns across the selected time range.
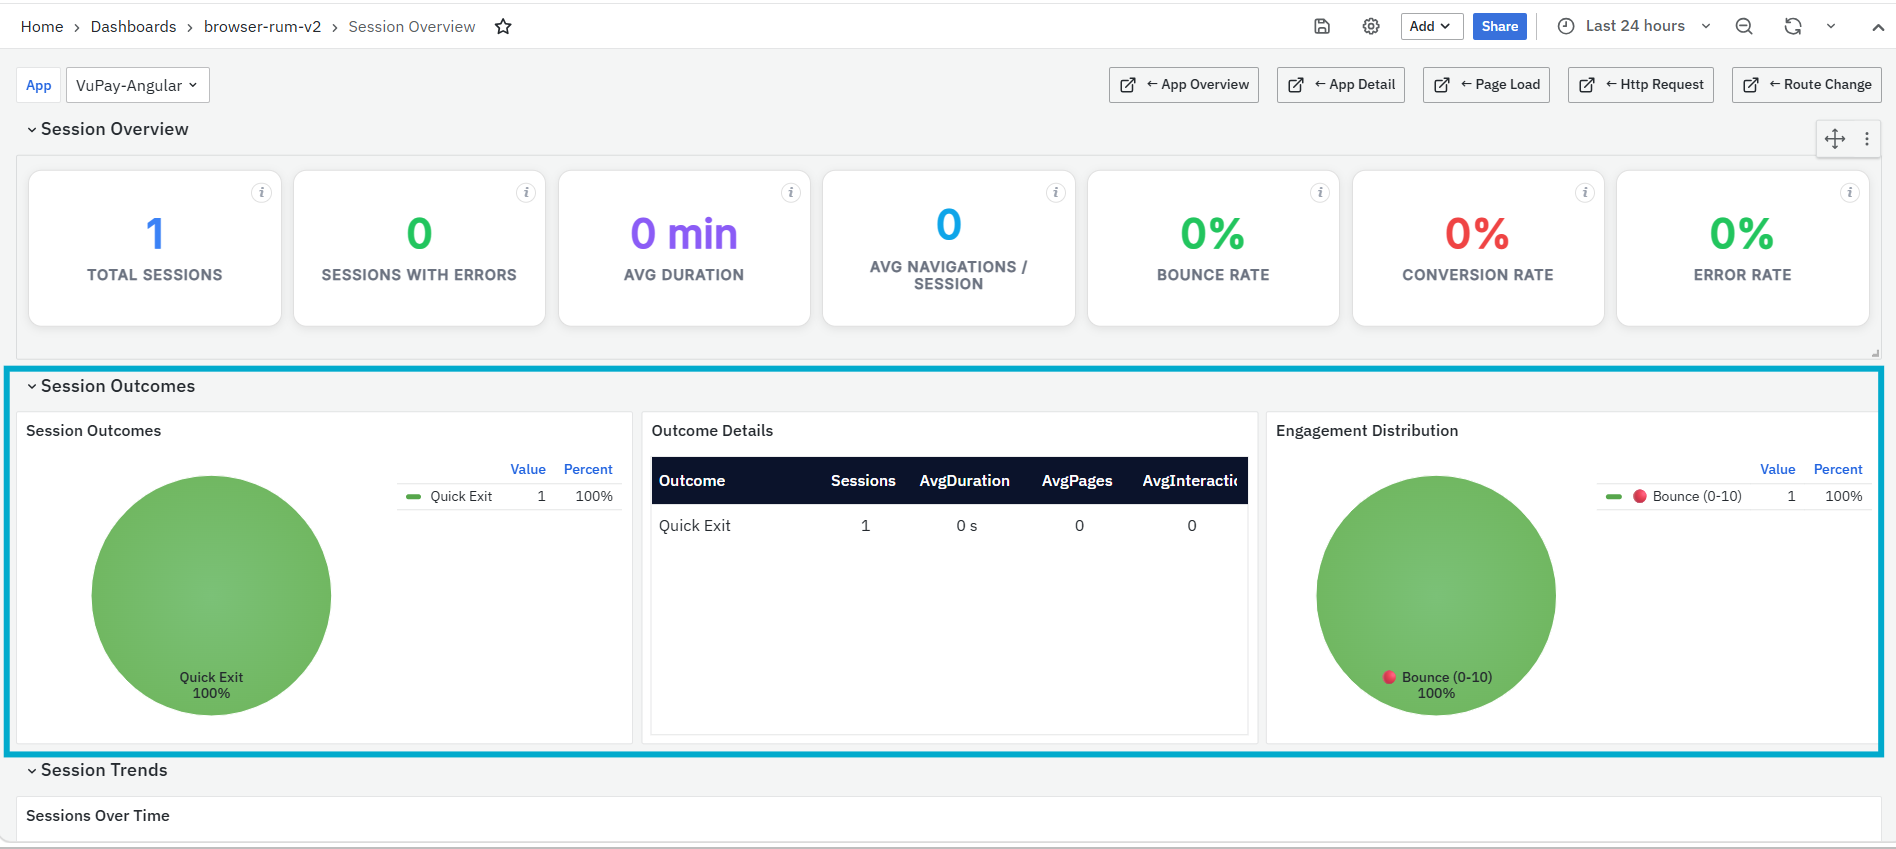
This section includes one panel:
- Sessions Over Time
Sessions Over Time
The Sessions Over Time panel displays session volume across the selected time range. It helps users understand when user activity increased or decreased. This panel is useful for correlating session trends with deployments, campaigns, traffic spikes, incidents, or user-reported issues.
Conversion Tracking
The Conversion Tracking section helps users analyze successful conversions and non-converted sessions. It shows converted session count, pages linked to conversion, and pages where users dropped off.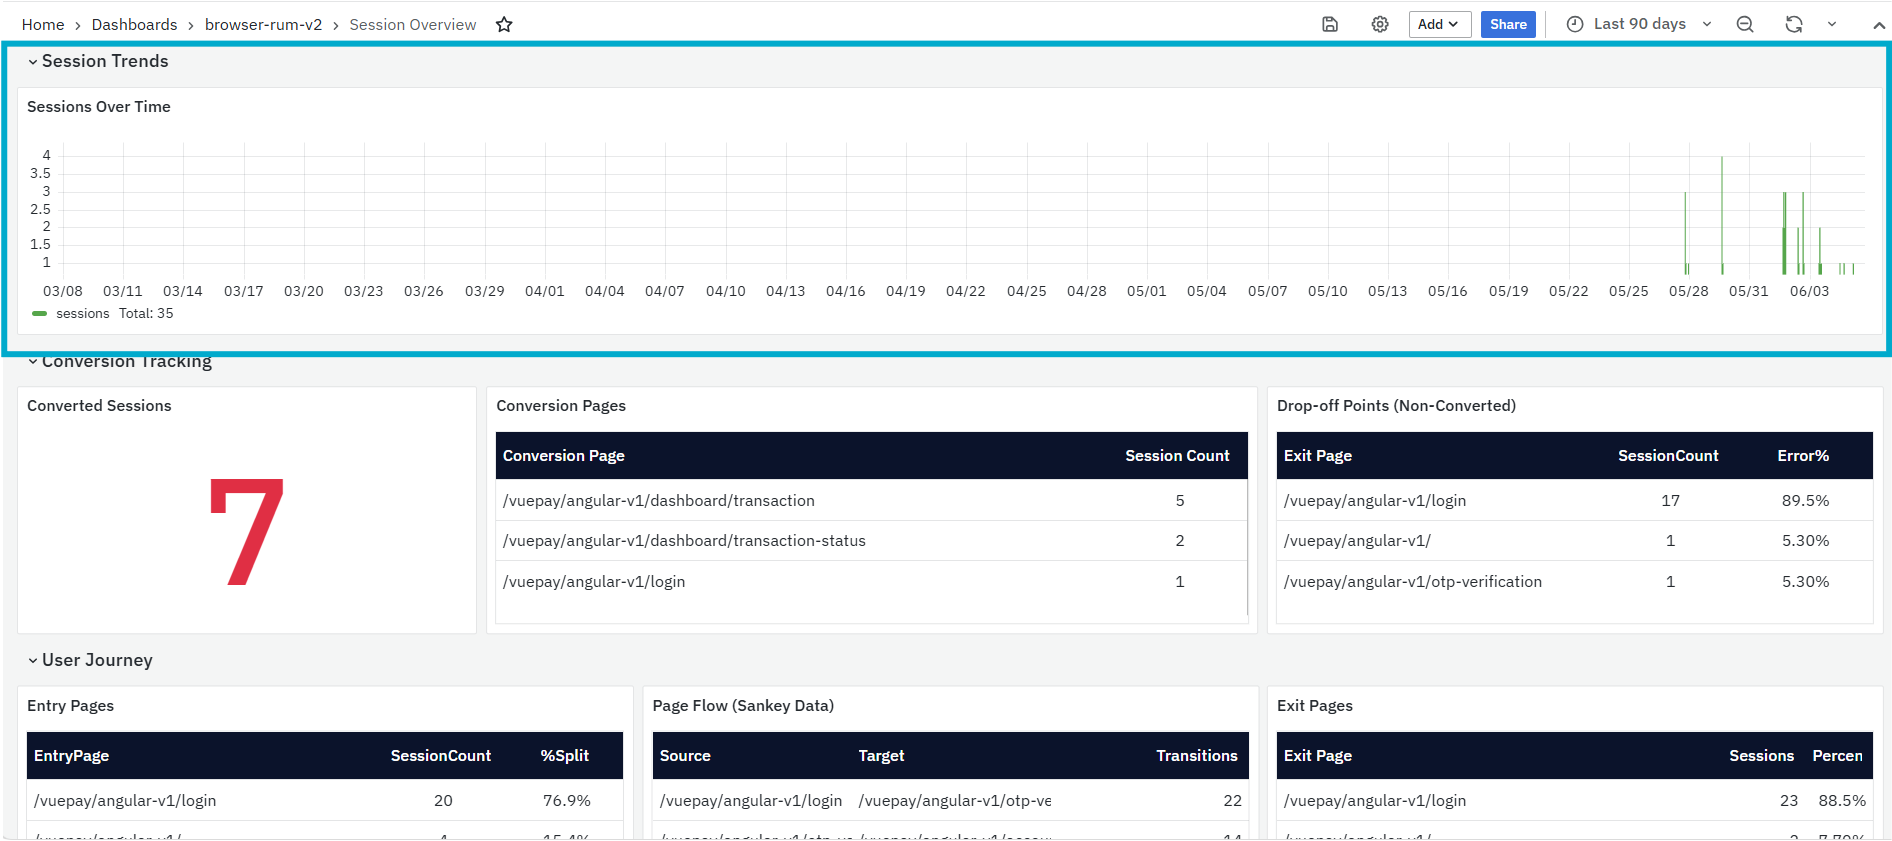
This section includes three panels:
- Converted Sessions
- Conversion Pages
- Drop-off Points (Non-Converted)
Converted Sessions
The Converted Sessions panel displays the number of sessions that reached the defined conversion condition. It provides a quick view of how many sessions completed the expected journey. This panel helps users track business journey completion. A lower number may indicate issues in page flow, failed requests, or users dropping off before conversion.
Conversion Pages
The Conversion Pages panel lists pages that contributed to converted sessions. It helps users identify which pages are associated with successful user outcomes.
The panel includes the following columns:
- Conversion Page: Displays the page associated with conversion.
- Session Count: Displays the number of sessions that reached the conversion page.
This panel is useful for validating whether the expected conversion pages are being reached by users.
Drop-off Points (Non-Converted)
The Drop-off Points (Non-Converted) panel lists exit pages for sessions that did not convert. It helps users identify where users are dropping off before completing the expected journey.
The panel includes the following columns:
- Exit Page: Displays the page where users exited.
- SessionCount: Displays the number of non-converted sessions ending on that page.
- Error%: Displays the error percentage associated with that exit page.
This panel is useful for identifying pages that may need performance, usability, or error investigation.
User Journey
The User Journey section shows how users enter, move through, and exit the application. It helps users understand common journey paths and identify where users may be dropping off.
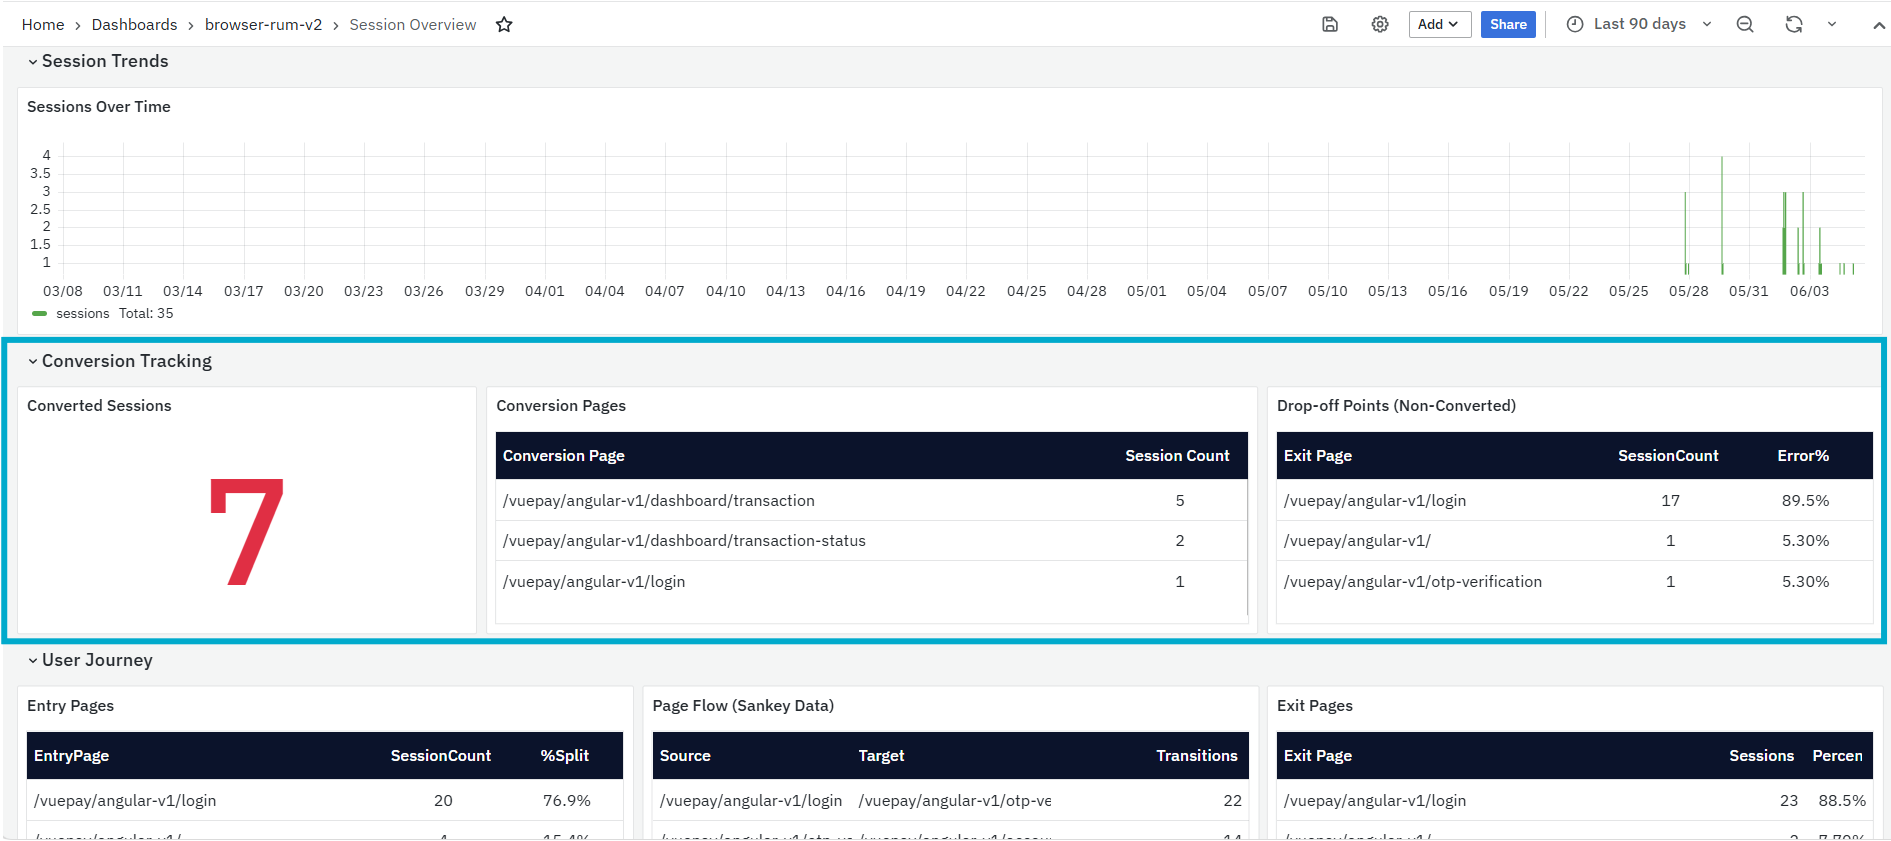
This section includes three panels:
- Entry Pages
- Page Flow (Sankey Data)
- Exit Pages
Entry Pages
The Entry Pages panel lists the pages where sessions started. It helps users identify the most common entry points into the application.
The panel includes the following columns:
- EntryPage: Displays the first page accessed in the session.
- SessionCount: Displays the number of sessions that started on that page.
- %Split: Displays the percentage contribution of that entry page.
This panel is useful for understanding landing page behavior and prioritizing performance optimization for high-entry pages.
Page Flow (Sankey Data)
The Page Flow (Sankey Data) panel shows source-to-target page transitions and transition counts. It provides the data used to understand how users move from one page to another.
The panel includes the following columns:
- Source: Displays the starting page of the transition.
- Target: Displays the next page in the transition.
- Transitions: Displays how many times users moved from the source page to the target page.
This panel helps users identify common navigation paths and pages that act as major transition points.
Exit Pages
The Exit Pages panel lists the pages where sessions ended. It helps users identify where users commonly leave the application.
The panel includes the following columns:
- Exit Page: Displays the last page visited in the session.
- Sessions: Displays the number of sessions that ended on that page.
- Percent: Displays the percentage contribution of that exit page.
This panel is useful for identifying exit-heavy pages that may need review for performance, errors, or user experience issues.
Page Transitions
The Page Transitions section visualizes the user journey across multiple steps. It helps users understand how sessions flow from one page to another over the journey.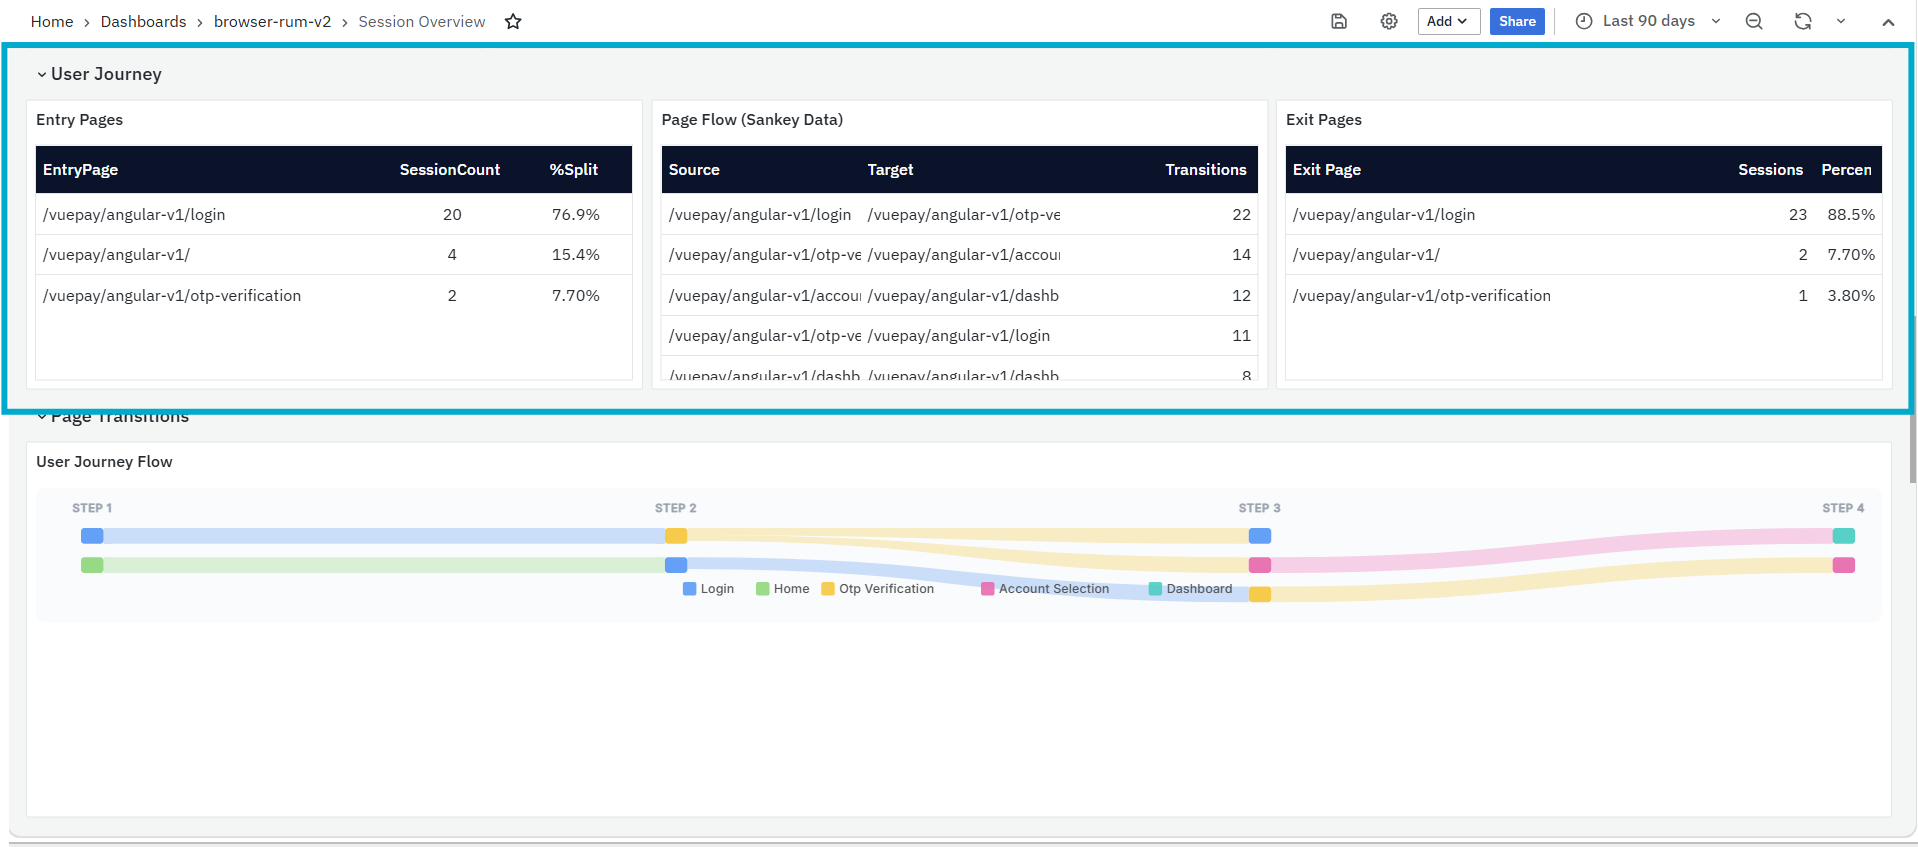
This section includes one panel:
- User Journey Flow
User Journey Flow
The User Journey Flow panel shows a visual flow of user transitions across session steps. It helps users understand how users move from entry pages to later pages in the journey. This panel is useful for identifying common paths, drop-off points, and journey deviations. It provides a visual way to understand page transitions across the selected sessions.
Session Performance
The Session Performance section provides key performance metrics across sessions. It helps users understand average page load time, web vitals, server response timing, and HTTP request latency.
This section includes five panels:
- Avg Page Load
- Avg LCP
- Avg FCP
- Avg TTFB
- Avg HTTP Time
Avg Page Load
The Avg Page Load panel displays the average page load duration from document load spans. It excludes web vitals and resource fetch spans. This panel helps users understand how quickly pages loaded across sessions. Higher values may indicate slow page rendering, delayed resources, or frontend performance issues.
Avg LCP
The Avg LCP panel displays the average Largest Contentful Paint value. LCP measures the time until the largest visible element on the page is rendered. This panel helps users understand how quickly main page content becomes visible to users. Lower values are better, while higher values may indicate slow rendering or heavy content.
Avg FCP
The Avg FCP panel displays the average First Contentful Paint value. FCP measures the time until the first text or image appears on the page. This panel helps users understand perceived page speed. A high FCP means users may wait longer before seeing any visible page content.
Avg TTFB
The Avg TTFB panel displays the average Time to First Byte. TTFB measures server response time before the browser receives the first byte of data. This panel helps users identify server-side or network response delays. Higher TTFB may indicate backend latency, network issues, or infrastructure delays.
Avg HTTP Time
The Avg HTTP Time panel displays the average duration of HTTP requests, including GET and POST spans. It measures API call latency across sessions. This panel helps users understand whether API calls are contributing to poor session performance. Higher values indicate that backend/API response time should be reviewed.
Long Tasks (Performance Warnings)
The Long Tasks (Performance Warnings) section highlights JavaScript tasks that may block the browser main thread. It helps users identify frontend responsiveness issues that can cause jank, delay, or poor user interaction experience.
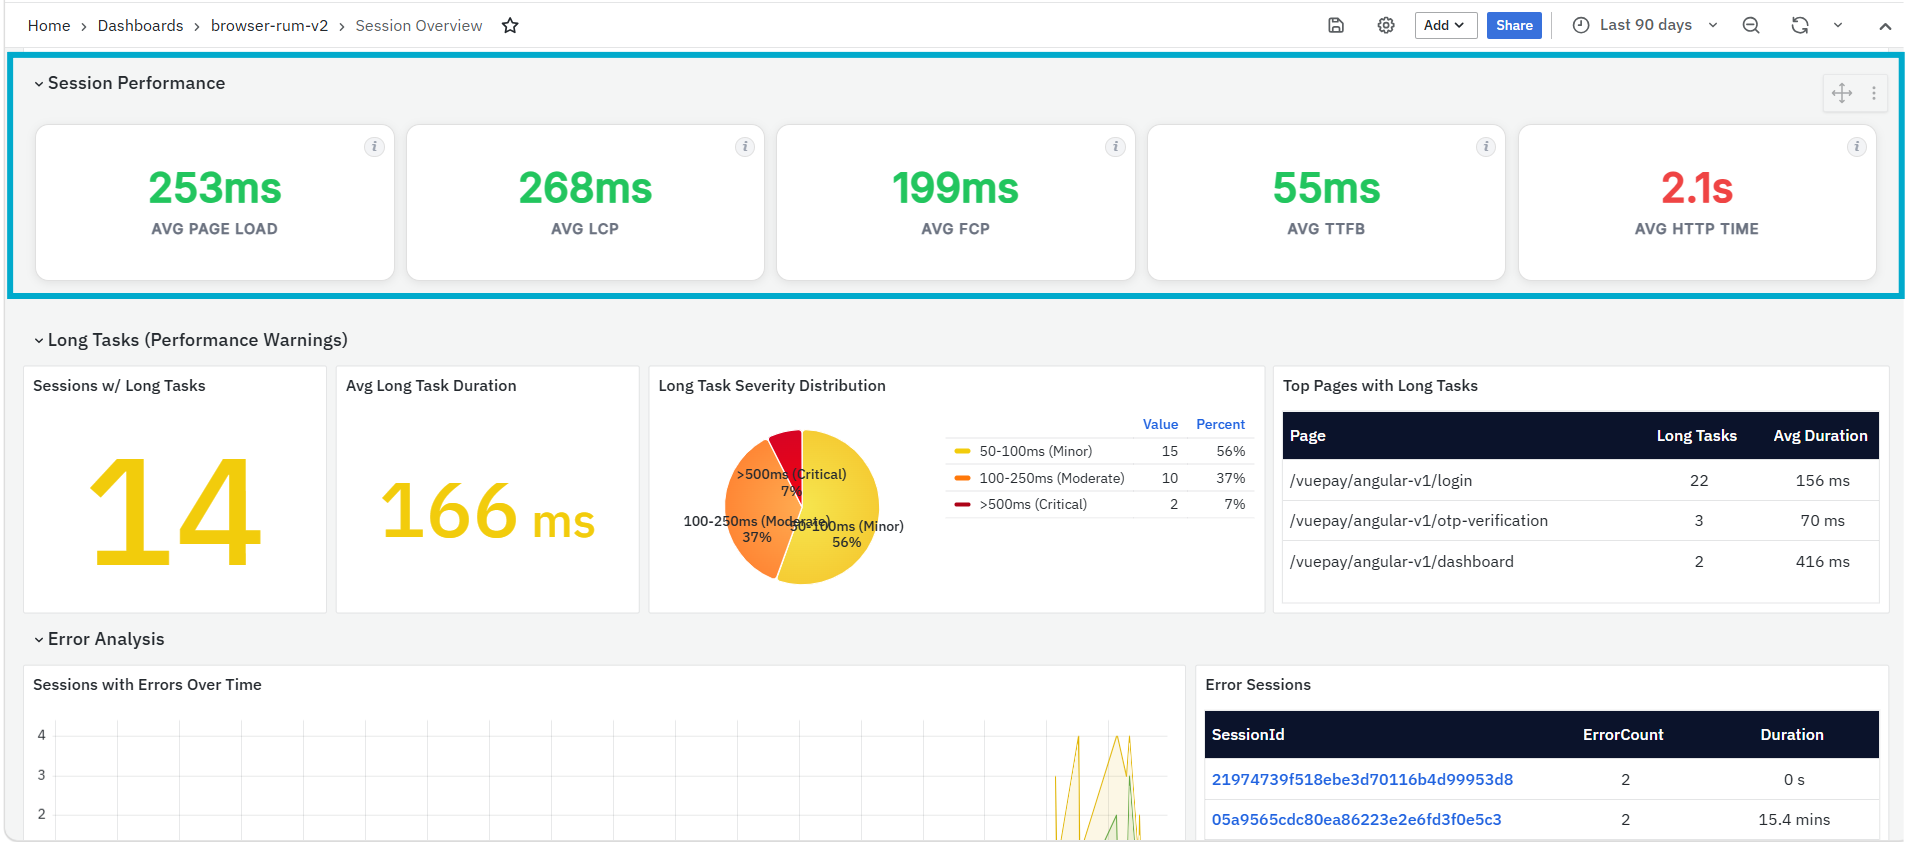
This section includes four panels:
- Sessions w/ Long Tasks
- Avg Long Task Duration
- Long Task Severity Distribution
- Top Pages with Long Tasks
Sessions w/ Long Tasks
The Sessions w/ Long Tasks panel displays the number of sessions where long tasks were detected. Long tasks usually indicate blocking JavaScript execution. This panel helps users understand how many user sessions may have experienced responsiveness issues.
Avg Long Task Duration
The Avg Long Task Duration panel displays the average duration of long tasks. Higher values indicate that JavaScript execution may be blocking the browser for longer periods. This panel is useful for understanding how severe long task impact is across sessions.
Long Task Severity Distribution
The Long Task Severity Distribution panel categorizes long tasks by severity, such as minor, moderate, and critical.
This panel helps users understand whether long tasks are mostly small warnings or serious performance issues that require immediate optimization.
Top Pages with Long Tasks
The Top Pages with Long Tasks panel lists pages where long tasks occurred most frequently. It helps users identify which pages may have blocking JavaScript.
The panel includes the following columns:
- Page: Displays the page where long tasks occurred.
- Long Tasks: Displays the number of long tasks
- Avg Duration: Displays the average long task duration for that page.
This panel is useful for prioritizing frontend optimization on pages with frequent or long-running JavaScript tasks.
Error Analysis
The Error Analysis section shows sessions affected by errors over time and lists sessions where errors occurred. It helps users identify error trends and drill down into impacted sessions.

This section includes two panels:
- Sessions with Errors Over Time
- Error Sessions
Sessions with Errors Over Time
The Sessions with Errors Over Time panel displays the trend of sessions with errors across the selected time range. It helps users identify when error-affected sessions increased. This panel is useful for correlating error spikes with deployments, traffic changes, backend issues, or frontend releases.
Error Sessions
The Error Sessions panel lists sessions where errors were captured. It helps users identify specific sessions that should be investigated further.
The panel includes the following columns:
- SessionId: Displays the session associated with errors. The SessionId value is clickable and opens the Session Details dashboard for the selected session.
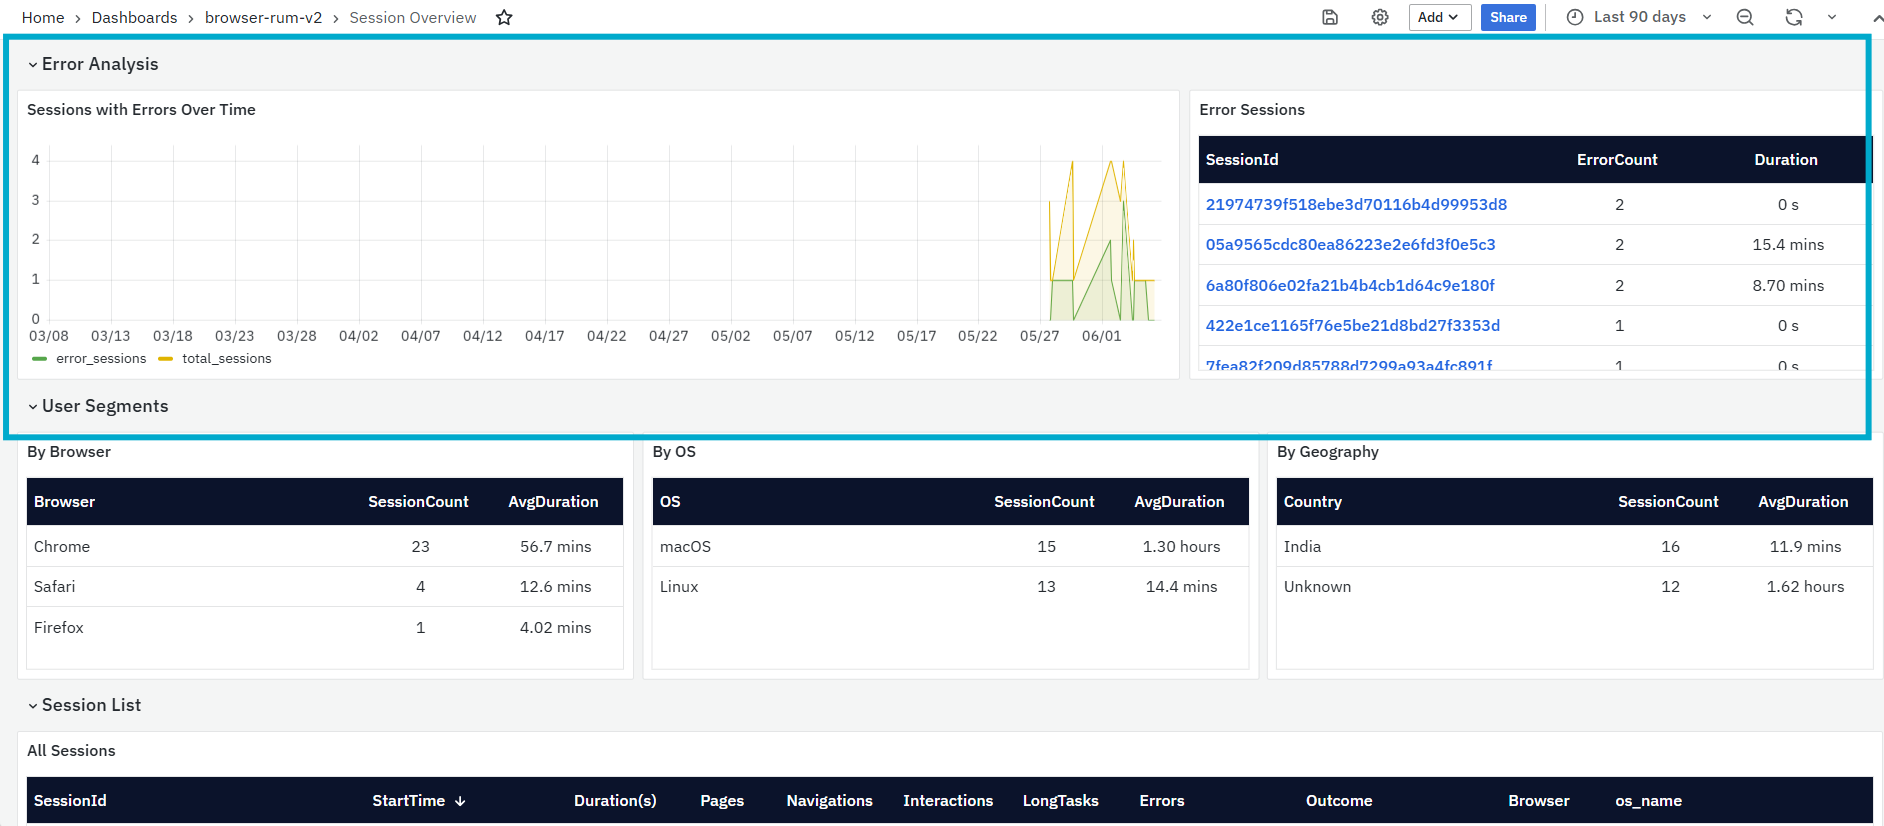
-
The Session Details dashboard provides a full view of the user journey, including session summary, page views, HTTP requests, user interactions, route changes, long tasks, errors, network timing, and complete event timeline. For more details refer to Session Details.
-
ErrorCount: Displays the number of errors in the session.
-
Duration: Displays the session duration.
User Segments
The User Segments section groups sessions by browser, operating system, and geography. It helps users identify whether session behavior or duration differs across user environments.
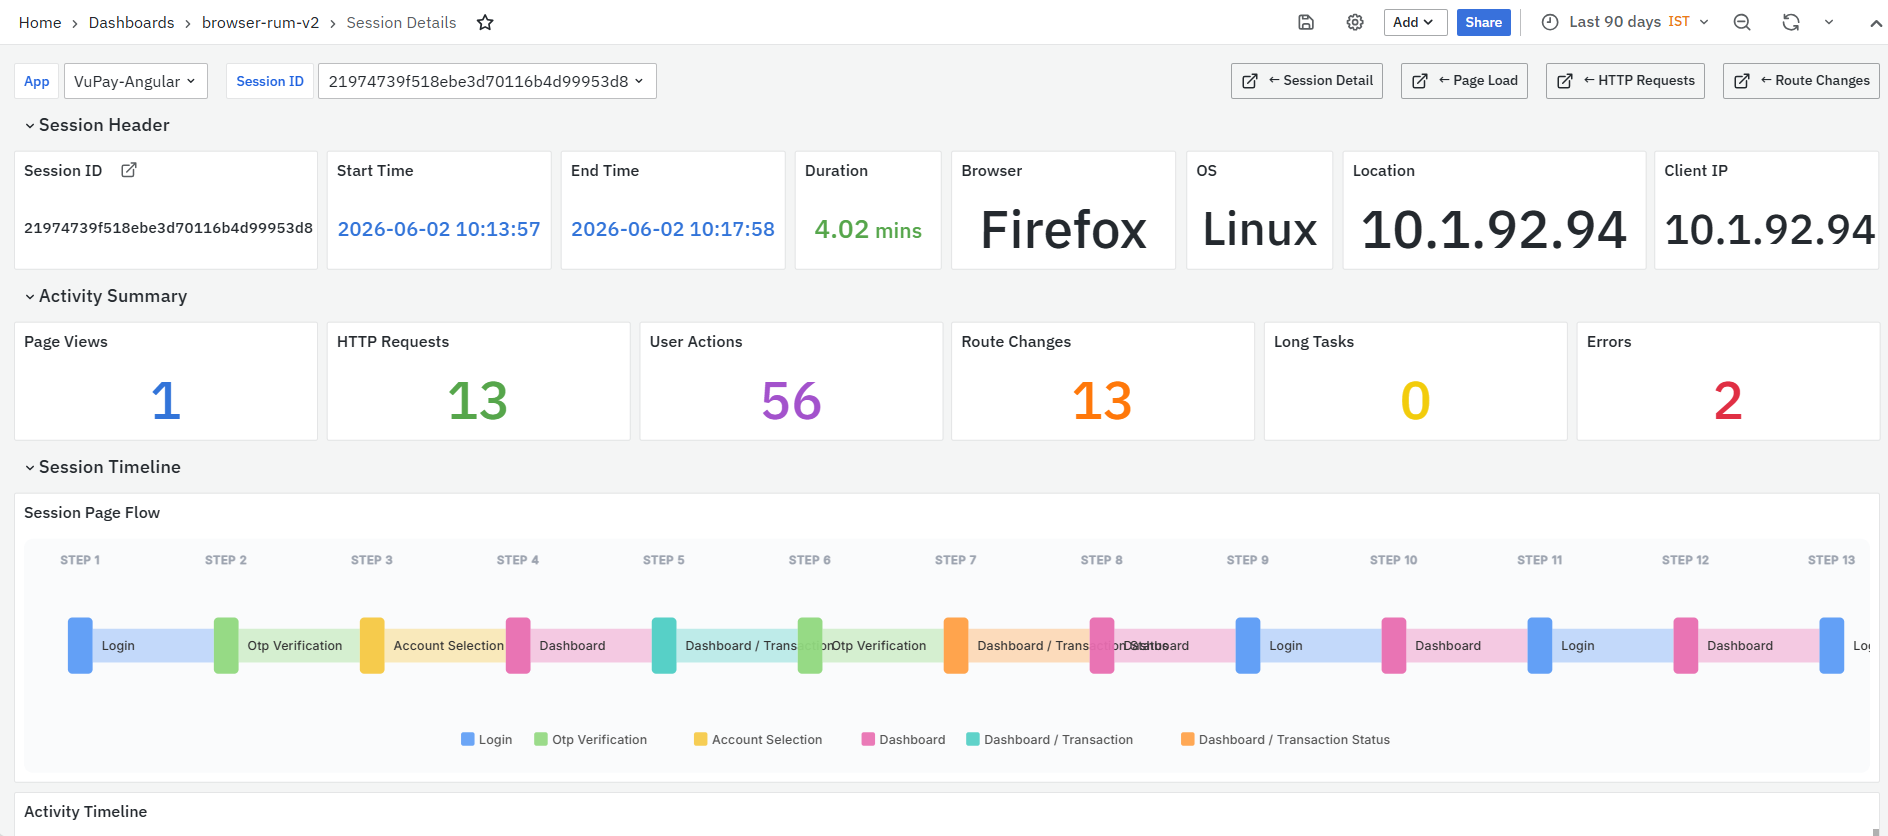
This section includes three panels:
- By Browser
- By OS
- By Geography
By Browser
The By Browser panel displays session count and average duration by browser. It helps users understand whether users on a specific browser are spending more or less time in the application.
The panel includes the following columns:
- Browser: Displays the browser used by users.
- SessionCount: Displays the number of sessions for the browser.
- AvgDuration: Displays the average duration of sessions for the browser.
This panel is useful for identifying browser-specific session behavior or possible browser-related performance issues.
By OS
The By OS panel displays session count and average duration by operating system. It helps users compare session behavior across OS types such as macOS and Linux.
The panel includes the following columns:
- OS: Displays the operating system.
- SessionCount: Displays the number of sessions for the OS.
- AvgDuration: Displays the average duration of sessions for the OS.
This panel is useful for identifying OS-specific session behavior or environment-specific performance issues.
By Geography
The By Geography panel displays session count and average duration by country or region. It helps users understand where users are accessing the application from and how session duration differs by geography.
The panel includes the following columns:
- Country: Displays the country or location.
- SessionCount: Displays the number of sessions from that geography.
- AvgDuration: Displays the average session duration.
This panel is useful for identifying geography-specific engagement or availability issues.
Session List
The Session List section provides a detailed list of all sessions matching the selected filters. It helps users drill down into individual sessions and analyze their journey in detail.

This section includes one panel:
- All Sessions
All Sessions
The All Sessions panel lists individual sessions with session-level activity, performance, outcome, browser, and OS details. It is used to identify sessions that need deeper investigation.
The panel includes the following columns:
- SessionId: Displays the unique session identifier. The SessionId value is clickable and opens the Session Details dashboard for that session.
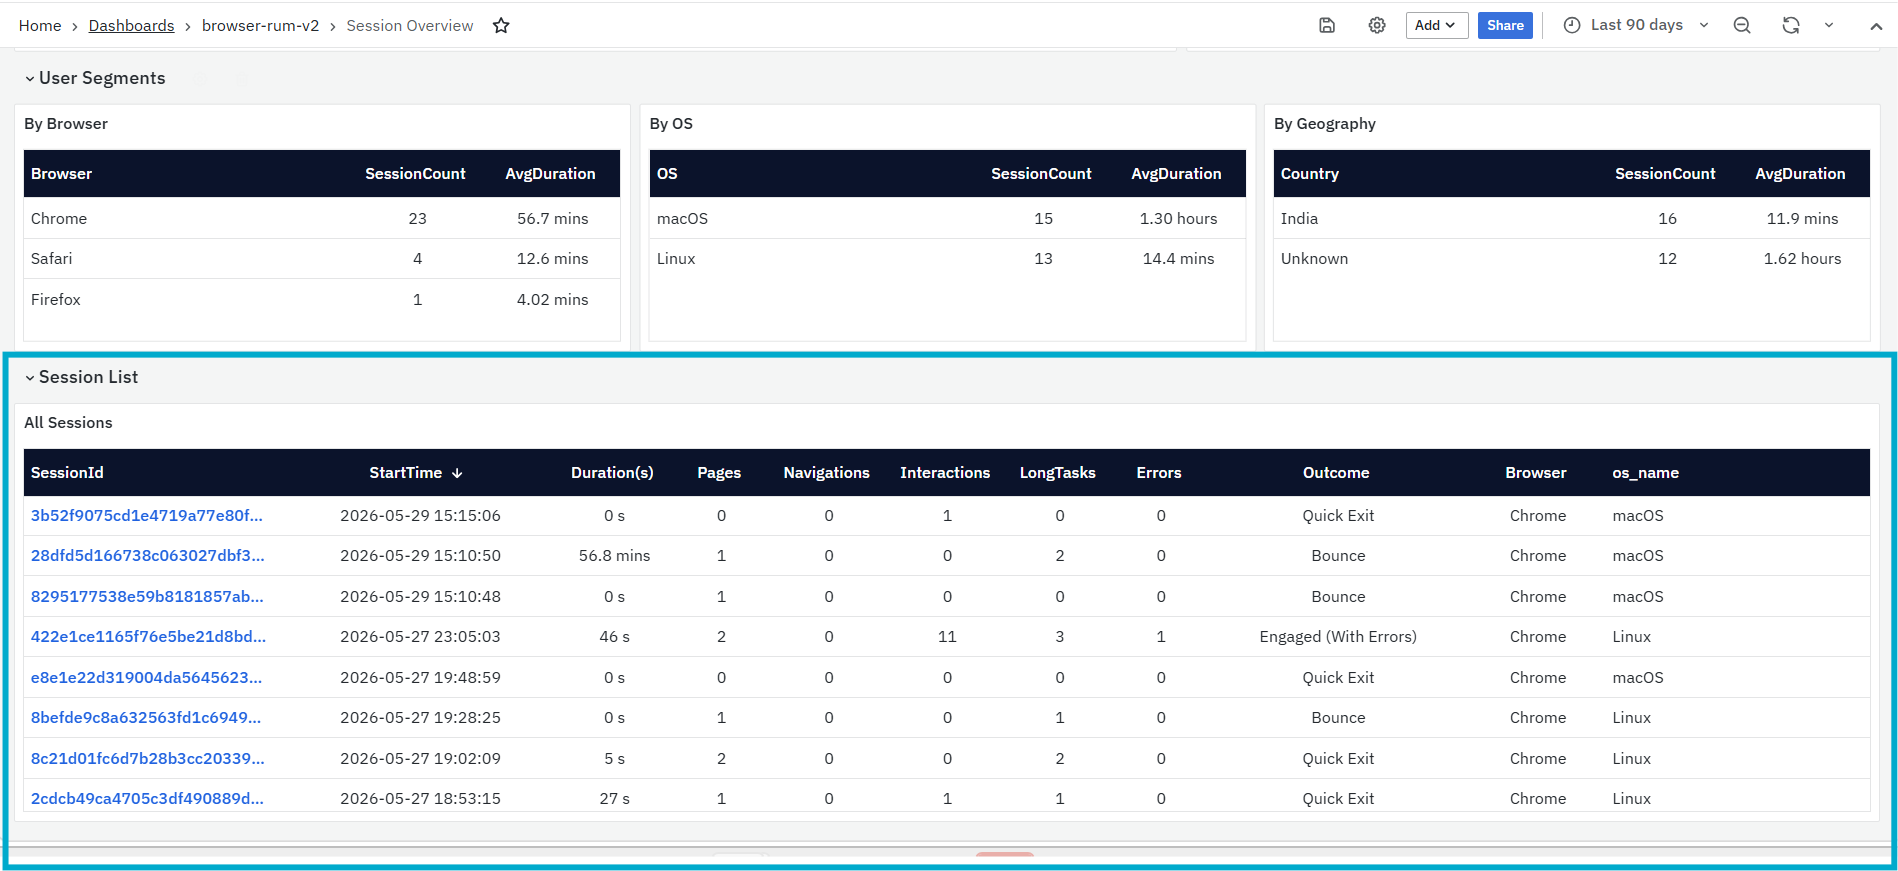
- The Session Details dashboard provides a detailed view of the selected user session. It shows session summary, activity timeline, page views, HTTP requests, user interactions, route changes, long tasks, errors, network timing, and complete event timeline. For more details refer to Session Details.
StartTime: Displays when the session started.
- Duration(s): Displays the total duration of the session.
- Pages: Displays the number of pages viewed in the sessions
- Navigations: Displays the number of route changes or navigations.
- Interactions: Displays the number of user interactions.
- LongTasks: Displays the number of long tasks captured in the session.
- Errors: Displays the number of errors captured in the session.
- Outcome: Displays the outcome category of the session.
- Browser: Displays the browser used in the session.
- os_name: Displays the operating system used in the session.
Session Details Dashboard
The Session Details Dashboard is a dashboard in the Browser Real User Monitoring module. It provides a complete view of a selected user session, including session metadata, user activity, page views, HTTP requests, user interactions, route changes, long tasks, errors, network timing, and the full event timeline. This dashboard helps users understand what happened during a specific user journey. It is useful when investigating user-reported issues, slow page loads, failed requests, frontend errors, route navigation delays, or browser-side performance problems within a single session.

The dashboard is divided into the following sections:
- Session Header
- Activity Summary
- Session Timeline
- Activity Timeline
- Performance Overview
- Page Views
- HTTP Request
- User Interactions
- Route Changes
- Long Tasks
- Errors
- Network Timing
At the top of the dashboard, users can apply filters to focus the data.
Related Dashboard
The Session Details dashboard includes related dashboard links at the top-right side of the page. These links help users move from the selected session to focused dashboards for deeper analysis.
- Session Detail: Opens the Session Details dashboard for the selected session. This view helps users review the full user journey, including session summary, activity timeline, page views, HTTP requests, user actions, route changes, long tasks, errors, network timing, and complete event timeline. For more details refer to Session Detail.
- Page Load: Opens the Page Load Details dashboard for the selected session or selected page load context. This dashboard helps users analyze page-level performance, Core Web Vitals, load timing, resource loading, errors, user segments, and trace waterfall details. For more details refer to Page Load.
- HTTP Requests: Opens the HTTP Request Details dashboard for HTTP/API request analysis. This dashboard helps users review request volume, latency, P95 latency, error rate, 4xx/5xx rate, throughput, endpoint performance, user segments, recent requests, and endpoint-level issues. For more details refer to HTTP Requests.
- Route Changes: Opens the Route Change Details dashboard for SPA navigation analysis. This dashboard helps users review route navigation count, average duration, P95 duration, XHR/API timing, route-related HTTP requests, navigation flow, browser performance, and OS performance. For more details refer to Route Change Details.
Session Header
The Session Header section provides the basic context of the selected user session. It helps users confirm which session is being analyzed and understand when the session happened, how long it lasted, and what browser, OS, location, and client IP were associated with the user journey.
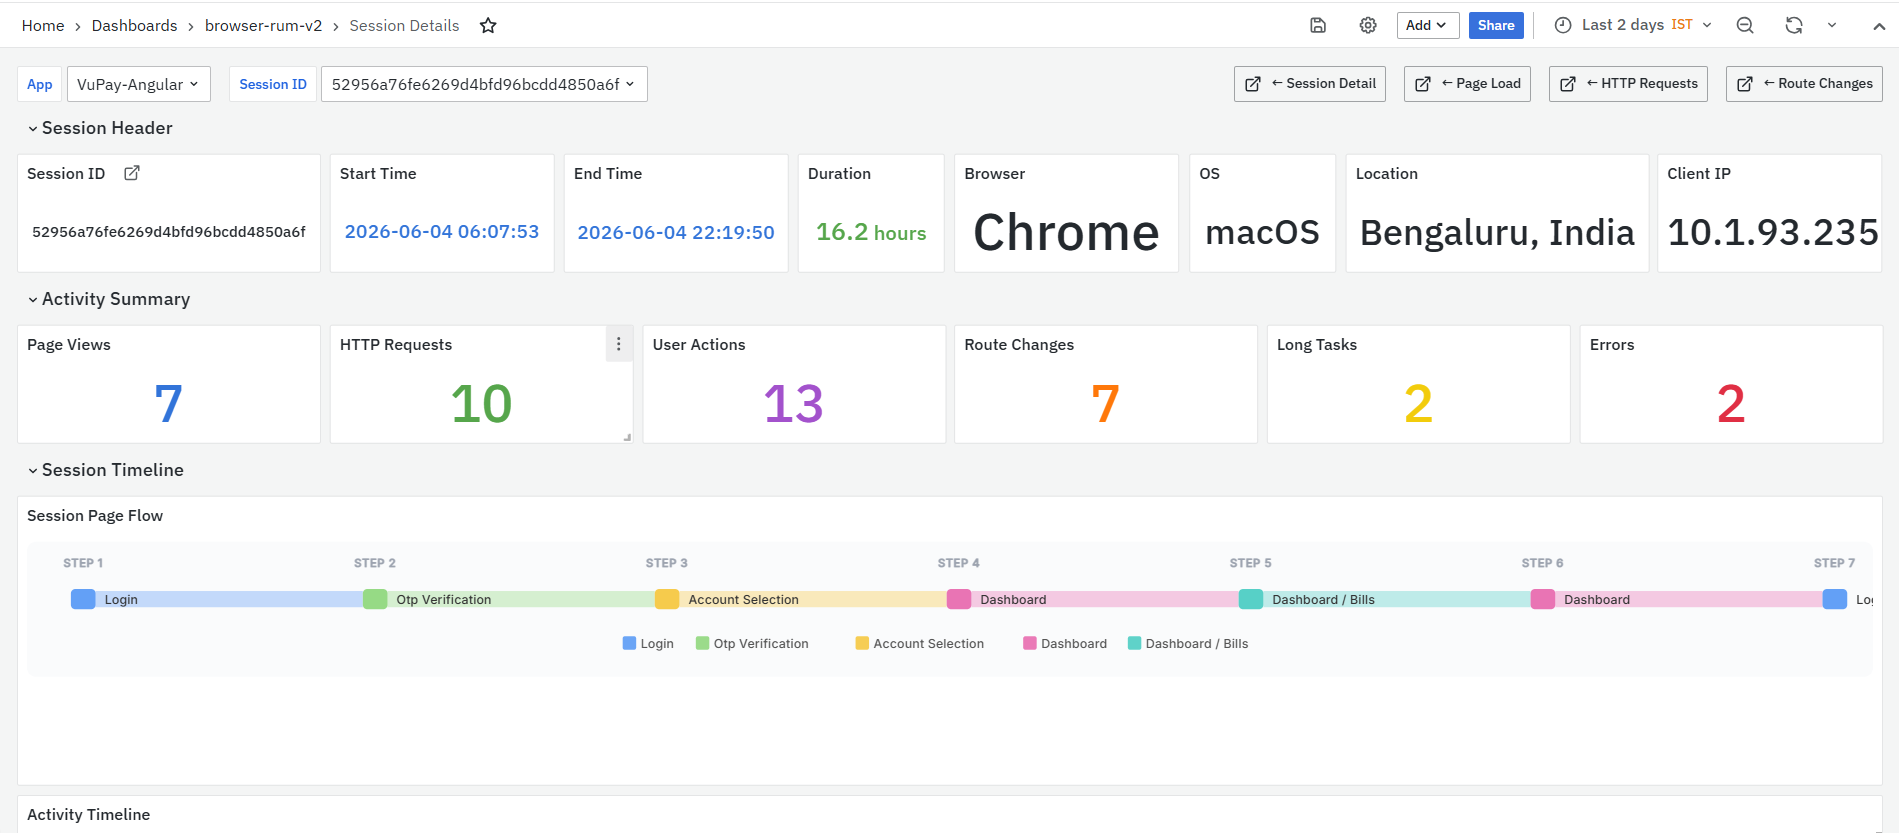
This section includes the following panels:
- Session ID
- Start Time
- End Time
- Duration
- Browser
- OS
- Location
- Client IP
Session ID
The Session ID panel displays the unique identifier of the selected session. This value helps users confirm that they are analyzing the correct user journey. It is useful when the session was opened from another dashboard, such as App Details, Recent Errors, Page Load Details, or HTTP Request Details.
Start Time
The Start Time panel displays when the user session started. This helps users correlate the session with alerts, user reports, deployments, or traffic changes.
End Time
The End Time panel displays when the user session ended. This helps users understand the session window and review the full activity period.
Duration
The Duration panel displays the total length of the user session. A long session may indicate extended user activity, while a very short session may indicate quick exits, failed attempts, or incomplete journeys.
Browser
The Browser panel displays the browser used during the session, such as Chrome. This helps users identify browser-specific behavior or compatibility issues.
OS
The OS panel displays the operating system used during the session, such as macOS. This helps users identify OS-specific performance or rendering issues.
Location
The Location panel displays the user location associated with the session, where available. This helps users understand geography-related context for the session.
Client IP
The Client IP panel displays the client IP address captured for the session. This helps users correlate the session with network, user, or access-related troubleshooting.
Activity Summary
Shows a quick count of the main activities captured in the session, such as page views, HTTP requests, user actions, route changes, long tasks, and errors. This helps users quickly identify what happened during the session and which activity area needs deeper review.

This section includes six panels:
- Page Views
- HTTP Requests
- User Actions
- Route Changes
- Long Tasks
- Errors
Page Views
The Page Views panel displays the number of pages viewed during the session. This helps users understand how many page load events occurred in the user journey.
HTTP Requests
The HTTP Requests panel displays the number of HTTP/API requests captured during the session. A high value indicates more backend or API activity during the session.
User Actions
The User Actions panel displays the number of user interactions captured during the session, such as clicks or input changes. This helps users understand how the user interacted with the application.
Route Changes
The Route Changes panel displays the number of Single Page Application route changes captured during the session. This helps users understand how the user navigated across application routes.
Long Tasks
The Long Tasks panel displays the number of long JavaScript tasks captured during the session. Long tasks may indicate blocking JavaScript that can affect responsiveness.
Errors
The Errors panel displays the number of errors captured during the session. A value greater than 0 indicates that the session should be reviewed further.
Session Timeline
Displays the user’s page flow across the session in sequence. This helps users understand the journey followed by the user and identify where the user moved during the session. 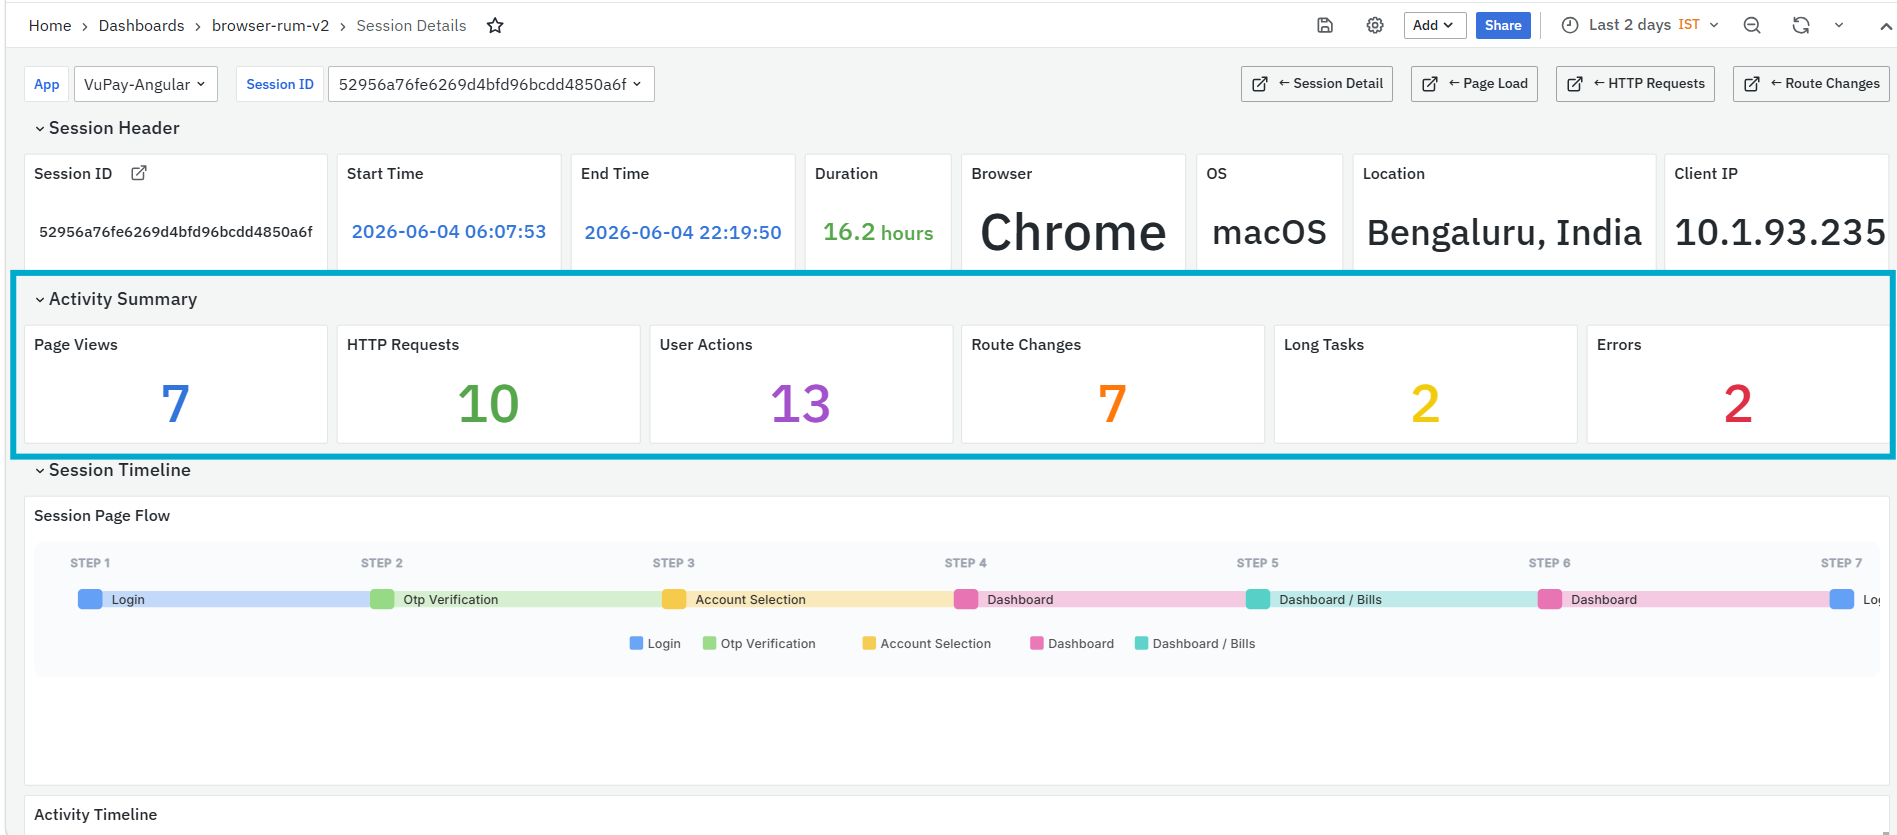
This section includes one panel:
- Session Page Flow
Session Page Flow
The Session Page Flow panel displays the ordered journey of the user across pages or application steps. It helps users understand how the user moved through the application during the session. This panel is useful when users need to identify where the user started, which pages were visited, and where the journey ended. It helps in troubleshooting incomplete journeys, unexpected navigation, or user drop-off points.
Activity Timeline
Shows the timing of different activities such as page loads, HTTP requests, route changes, user actions, long tasks, errors, and idle time. This helps users understand when each activity occurred and how different events overlapped during the session.
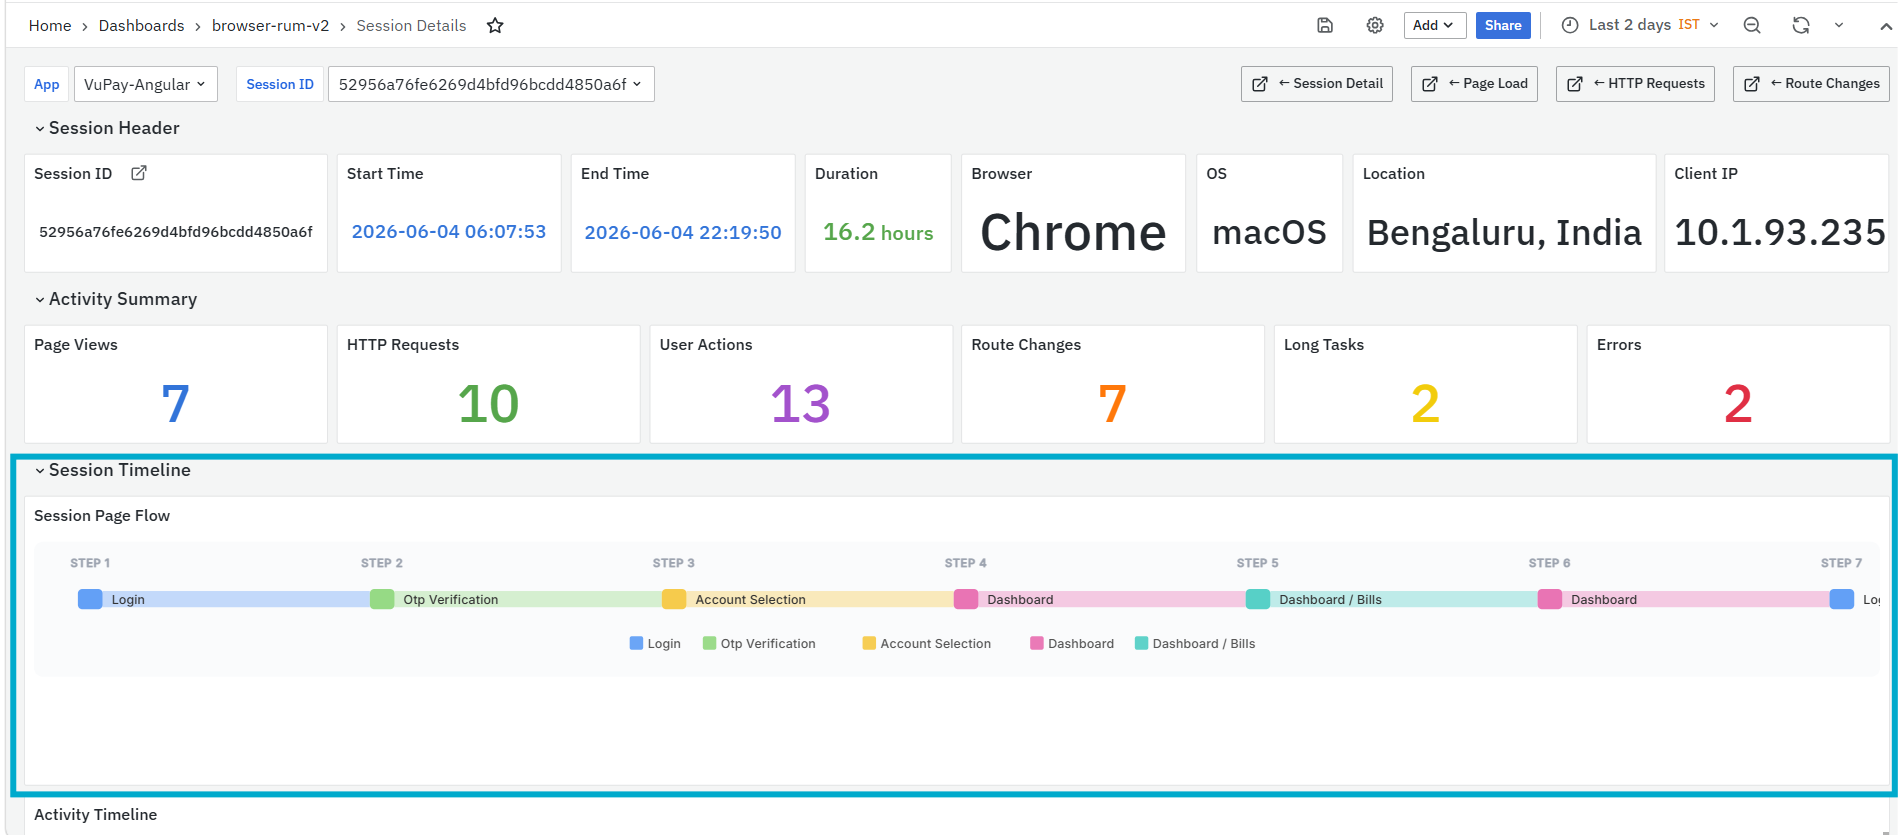
This section includes one panel:
- Activity Timeline
Activity Timeline
The Activity Timeline panel displays activities such as page loads, HTTP requests, route changes, user actions, long tasks, web vitals, other events, and idle time across the session duration.
This panel is useful when users need to understand the order and timing of activities. It helps identify whether slow performance happened during page load, API activity, user interaction, route navigation, or JavaScript execution.
Performance Overview
Provides key performance indicators for the selected session, including page load time, HTTP latency, web vitals, long tasks, resources, and route change duration. This helps users quickly assess the overall performance quality of the session.
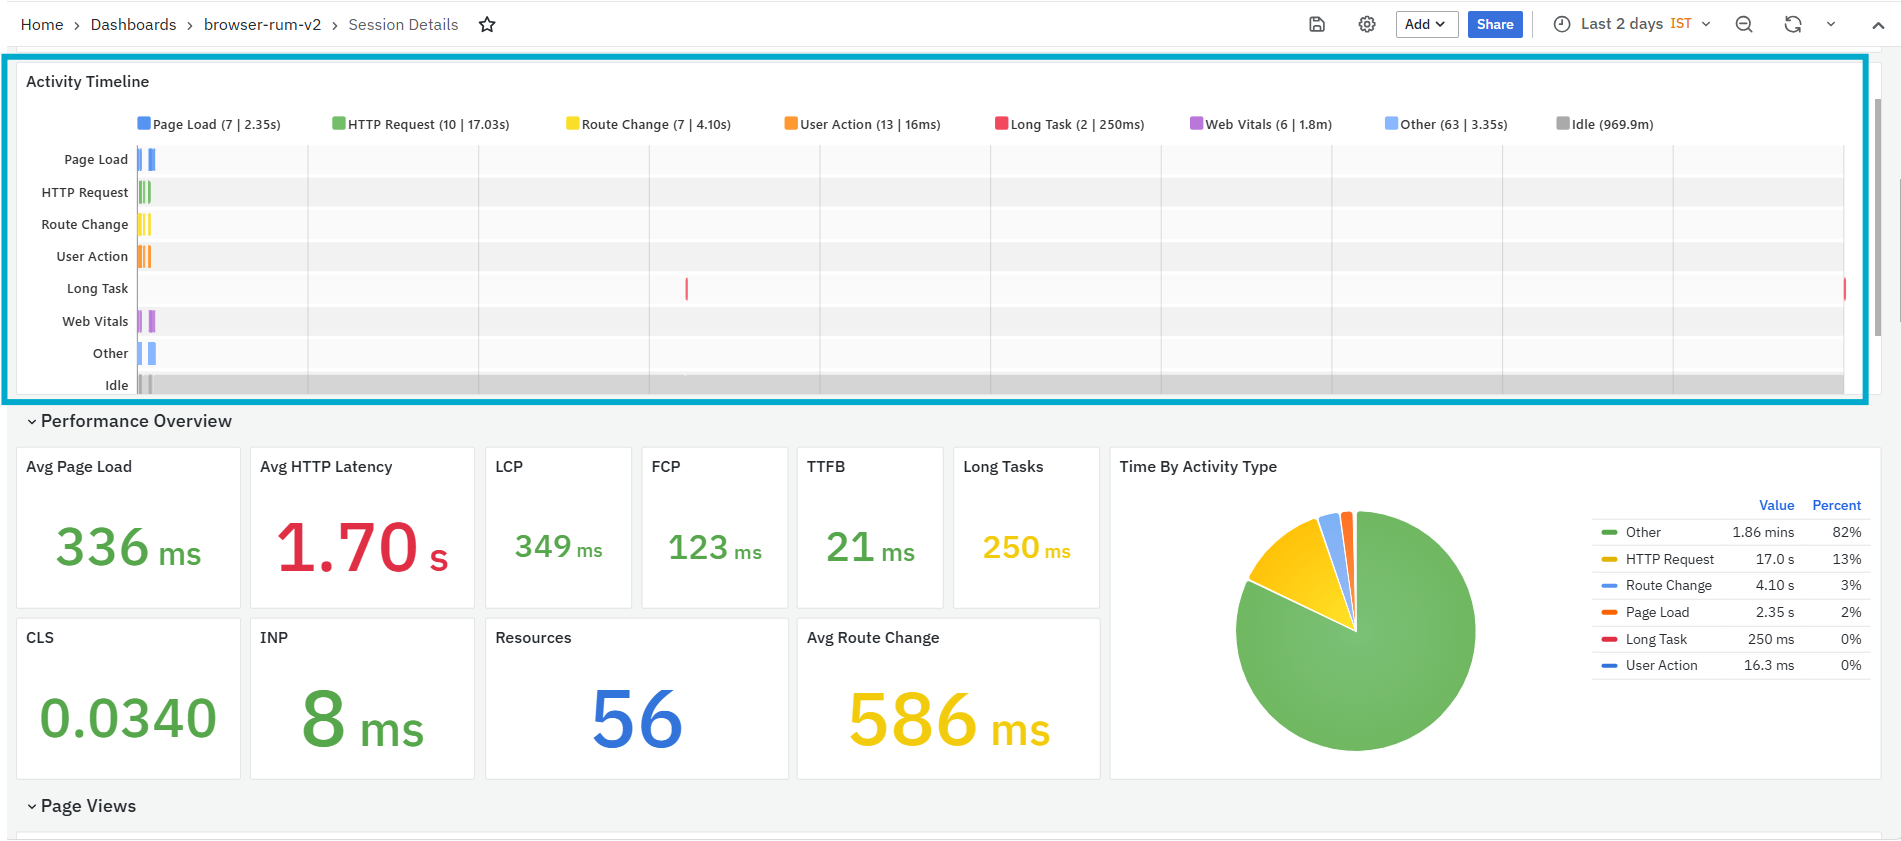
This section includes the following panels:
- Avg Page Load
- Avg HTTP Latency
- LCP
- FCP
- TTFB
- Long Tasks
- CLS
- INP
- Resources
- Avg Route Change
- Time by Activity Type
Avg Page Load
The Avg Page Load panel displays the average page load time during the session. It helps users understand whether pages loaded quickly or slowly for the selected user.
Avg HTTP Latency
The Avg HTTP Latency panel displays the average latency of HTTP/API requests captured during the session. A higher value may indicate slow API response or backend delay.
LCP
The LCP panel displays the Largest Contentful Paint value observed during the session. This helps users understand how quickly the main visible content appeared.
FCP
The FCP panel displays the First Contentful Paint value observed during the session. This helps users understand when the first visible content appeared on the page.
TTFB
The TTFB panel displays the Time to First Byte value for the session. This helps identify server-side or network response delays.
Long Tasks
The Long Tasks panel displays the long task duration or count observed during the session. This helps users identify JavaScript blocking that may affect responsiveness.
CLS
The CLS panel displays the Cumulative Layout Shift value for the session. A higher value indicates visual instability during page loading or interaction.
INP
The INP panel displays the Interaction to Next Paint value. This helps users understand how responsive the page was after user interaction.
Resources
The Resources panel displays the number of resources loaded during the session. This helps users understand how many scripts, images, styles, fonts, or other resources were involved.
Avg Route Change
The Avg Route Change panel displays the average route change duration during the session. This helps users understand whether SPA navigation was slow for the selected user.
Time by Activity Type
The Time by Activity Type panel shows the distribution of session time across activity types. It helps users understand which activity type consumed the most time during the session.
Page Views
Lists the pages viewed during the session with page-level performance metrics. This helps users identify which page loads were slow or had poor web vital values.

This section includes one panel:
- Page Views Detail
Page Views Detail
The Page Views Detail panel displays page load details for each page visited during the session. It shows when the page was loaded, which page was accessed, and the key page load metrics. This panel is useful when users need to identify which page load was slow or which page should be investigated further.
The panel includes the following columns:
- Timestamp: Displays when the page view occurred.
- Page: Displays the page or route that was loaded. The Page value is clickable. When clicked, it opens the Page Load Details dashboard for the selected page.
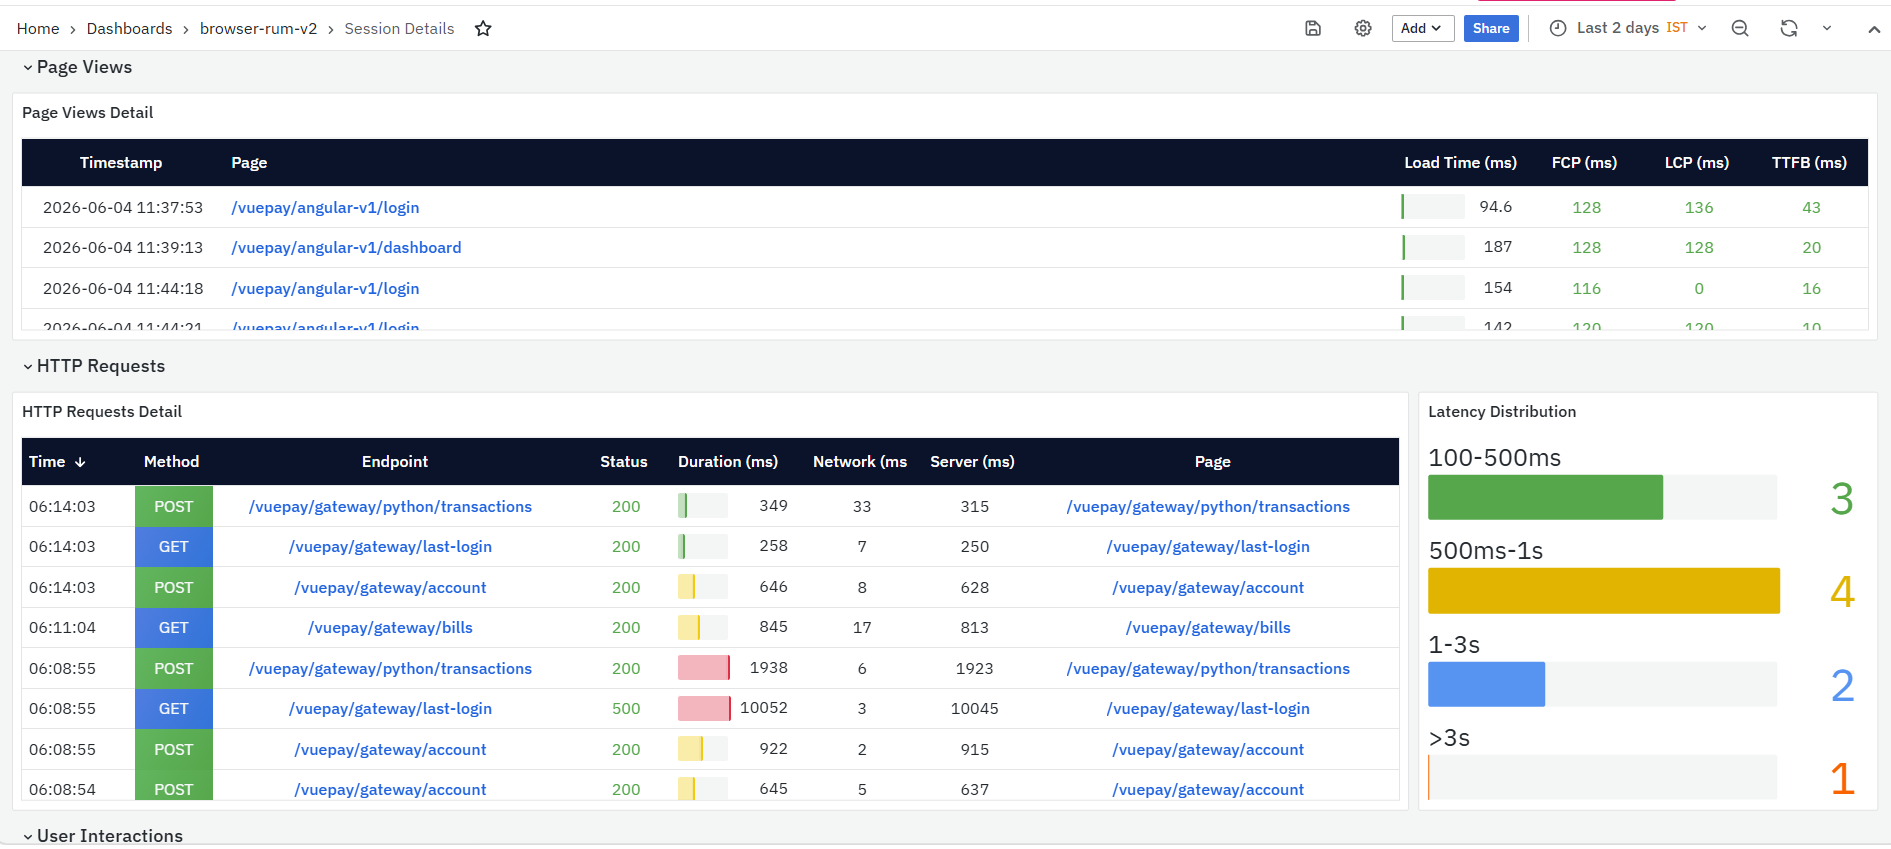
- The Page Load Details dashboard provides a detailed view of the selected page’s performance. It shows page health, Core Web Vitals, error analysis, page load timing breakdown, resource loading analysis, HTTP requests, page performance, user segments, session drill-down, and trace waterfall. For more details refer to Page Load Details.
- Load Time (ms): Displays the total time taken to load the page.
- FCP (ms): Displays the First Contentful Paint value for the page load.
- LCP (ms): Displays the Largest Contentful Paint value for the page load.
- TTFB (ms): Displays the Time to First Byte value for the page load.
HTTP Request
The HTTP Request section displays HTTP/API requests captured during the selected session. This section helps users understand which APIs were called, how long they took, and whether they succeeded or failed.

This section includes two panels:
- HTTP Request Detail
- Latency Distribution
HTTP Request Detail
The HTTP Request Detail panel lists the HTTP/API requests made during the session. It helps users identify slow requests, failed requests, and requests linked to specific pages.
The panel includes the following columns:
- Time: Displays when the HTTP request occurred.
- Method: Displays the HTTP method, such as GET or POST.
- Endpoint: Displays the HTTP/API endpoint called during the session. The endpoint value is clickable and opens the HTTP Request Details dashboard.

- The HTTP Request Details dashboard provides a detailed view of the selected HTTP/API endpoint. It shows request volume, average latency, P95 latency, error rate, 4xx/5xx rate, throughput, time breakdown, endpoint performance, error analysis, user segments, recent requests, and endpoint deep-dive details. For mpre details refer to HTTP Request Details .
- Status: Displays the HTTP status code returned by the endpoint.
- Duration (ms): Displays the total time taken by the request.
- Network (ms): Displays the network time for the request.
- Server (ms): Displays the server response time for the request.
- Page: Displays the page associated with the request. The Page value is clickable. When clicked, it opens the Page Load Details dashboard for the selected page.
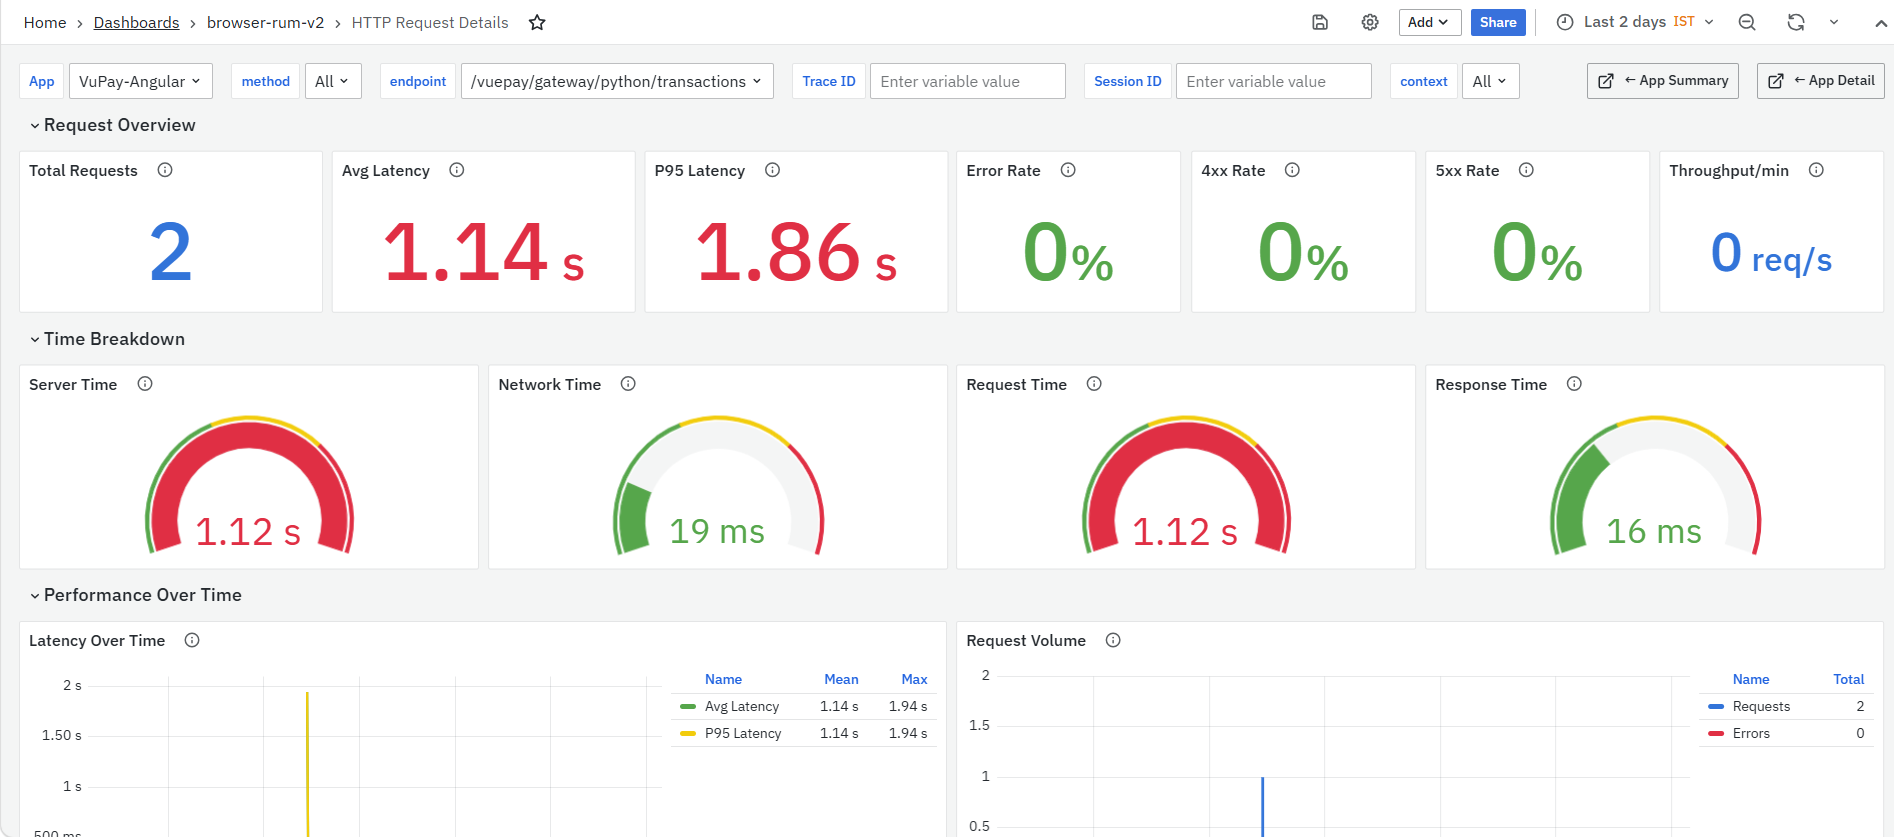
- The Page Load Details dashboard provides a detailed view of the selected page’s performance. It shows page health, Core Web Vitals, error analysis, page load timing breakdown, resource loading analysis, HTTP requests, page performance, user segments, session drill-down, and trace waterfall. For more details refer to Page Load Details.
Latency Distribution
The Latency Distribution panel shows how HTTP request latency is distributed across time buckets, such as 100–500 ms, 500 ms–1 s, 1–3 s, and more than 3 seconds. This panel helps users understand whether most HTTP requests were fast or whether some requests took longer. It is useful for identifying slow API behavior within the selected session.
User Interactions
The User Interactions section displays user actions captured during the selected session. This section helps users understand how the user interacted with the application and whether specific actions were slow.
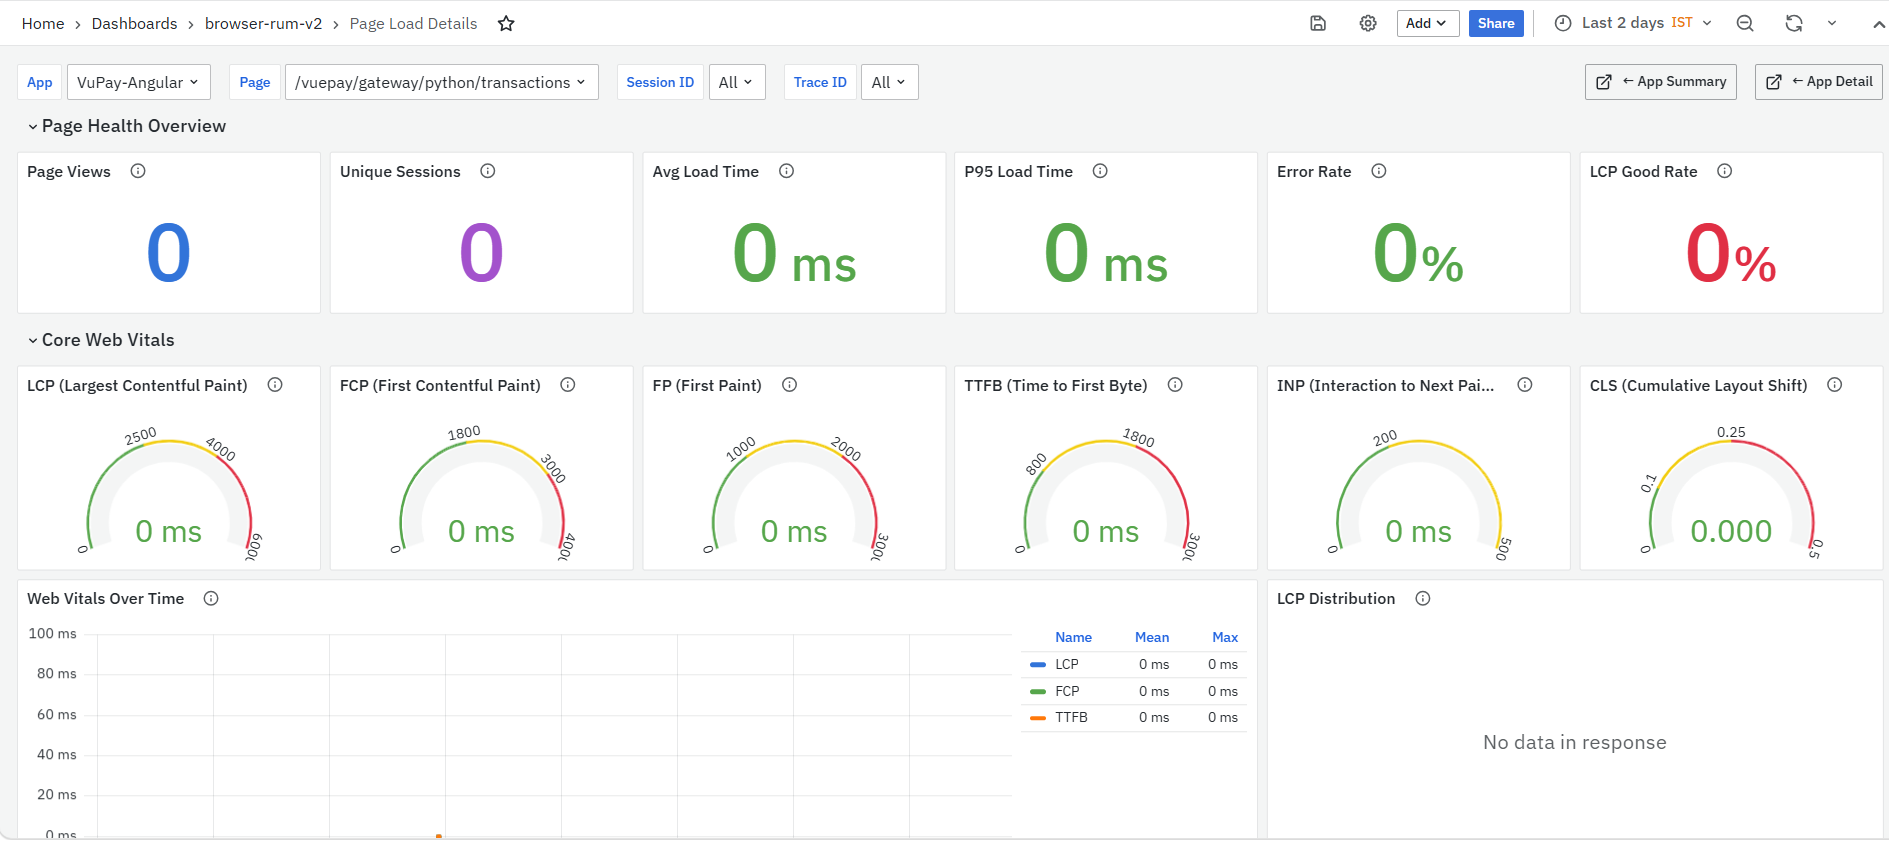
This section includes two panels:
- User Interactions
- Action Types
User Interactions
The User Interactions panel lists user actions captured during the session. It helps users review what the user clicked, changed, or interacted with.
The panel includes the following columns:
- Time: Displays when the user interaction occurred.
- Action: Displays the action performed by the user.
- Page: Displays the page where the action occurred. The Page value is clickable. When clicked, it opens the Page Load Details dashboard for the selected page.
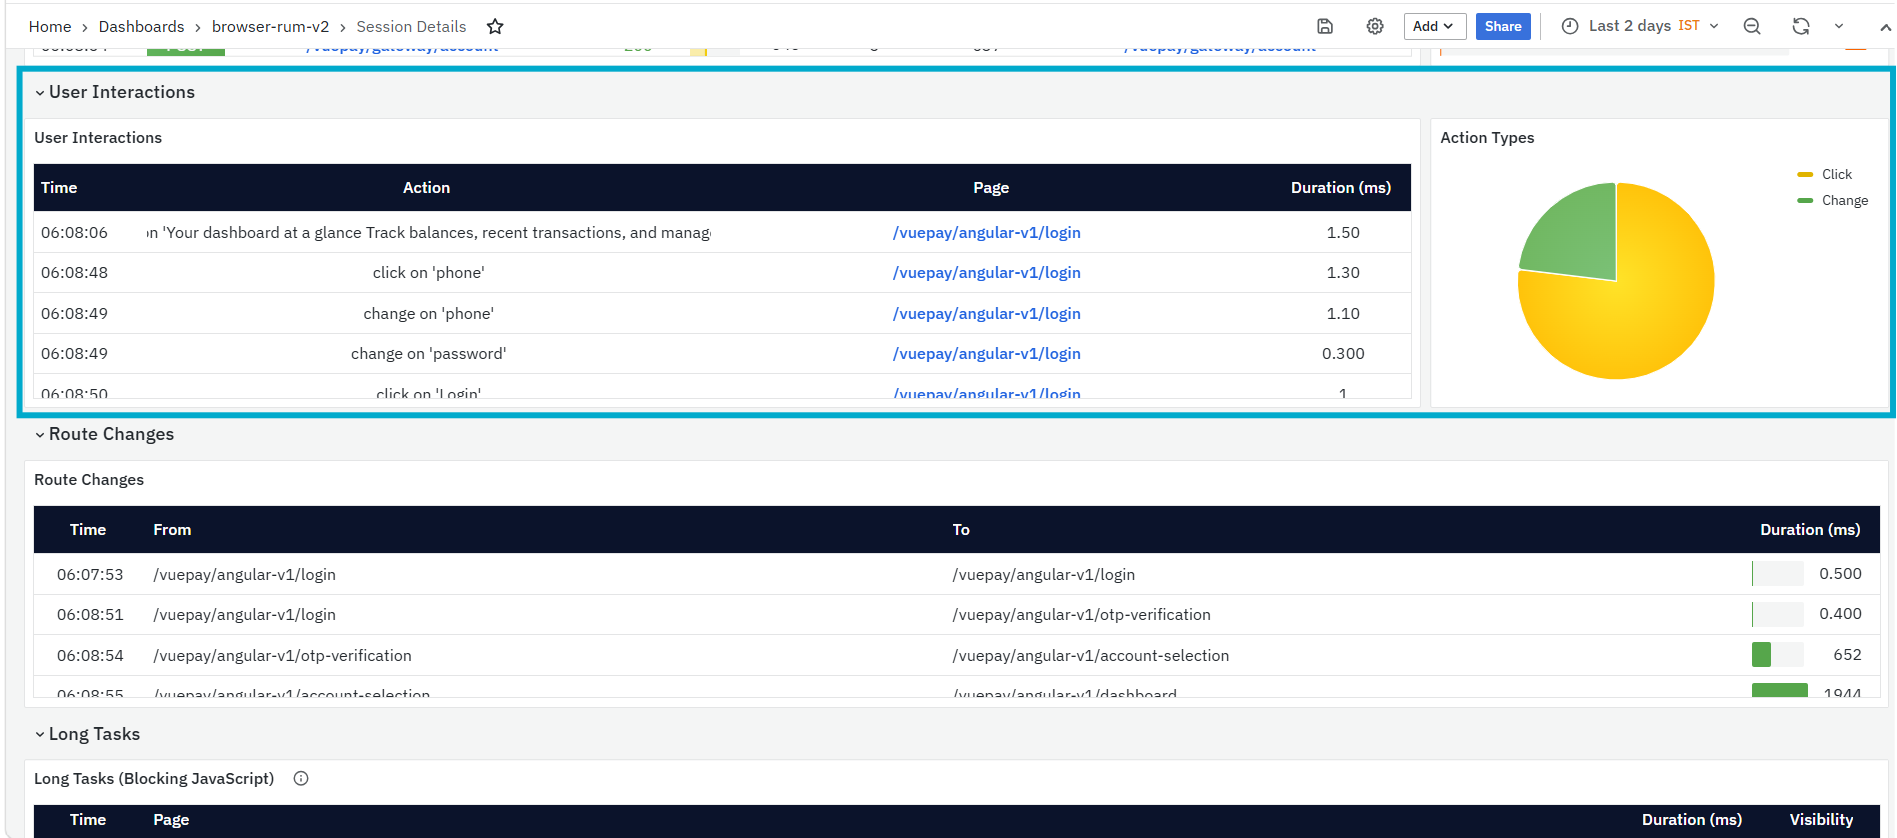
-
The Page Load Details dashboard provides a detailed view of the selected page’s performance. It shows page health, Core Web Vitals, error analysis, page load timing breakdown, resource loading analysis, HTTP requests, page performance, user segments, session drill-down, and trace waterfall. For more details refer to Page Load Details.
-
Duration (ms): Displays the time taken for the action.
This panel is useful when users need to investigate user behavior or identify slow interactions.
Action Types
The Action Types panel displays the distribution of user actions by type, such as click or change. It helps users understand what kind of interactions occurred most frequently during the session.
Route Changes
The Route Changes section displays Single Page Application route changes captured during the selected session. This section helps users understand how the user navigated between routes without full page reloads.
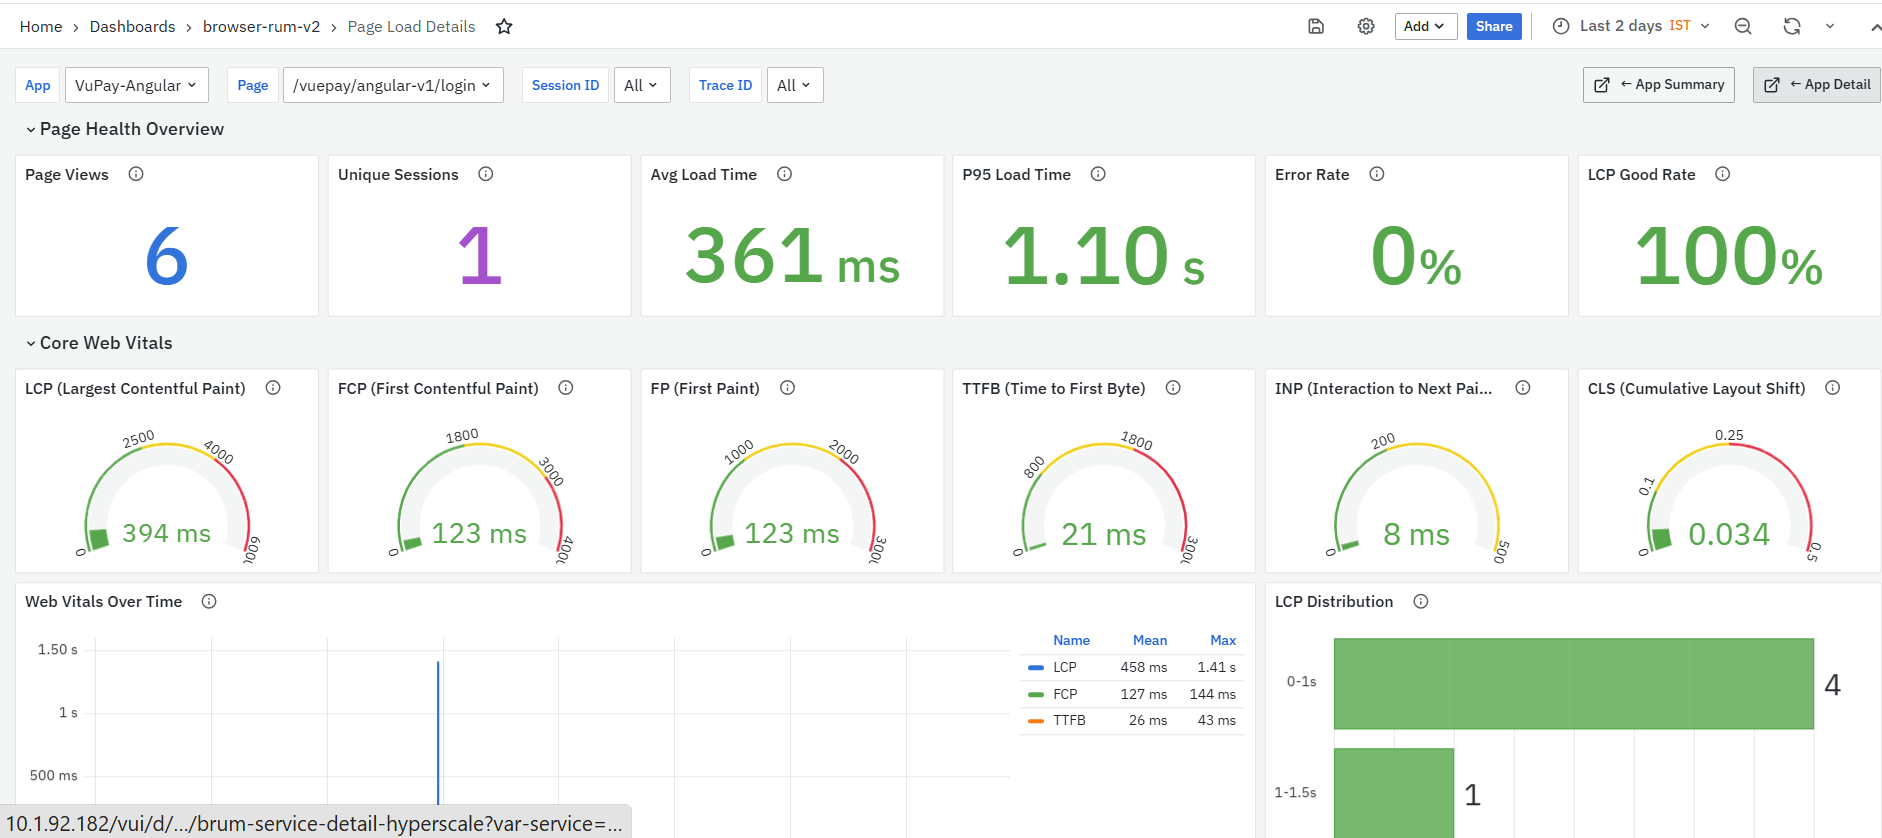
This section includes one panel:
- Route Changes
Route Changes
The Route Changes panel lists route navigation events captured during the session. It shows where the user navigated from, where the user navigated to, and how long the route change took.
The panel includes the following columns:
- Time: Displays when the route change occurred.
- From: Displays the source route.
- To: Displays the destination route.
- Duration (ms): Displays the time taken to complete the route change.
This panel is useful when users need to identify slow SPA navigation or understand how the user moved through the application.
Long Tasks
The Long Tasks section displays JavaScript long tasks captured during the selected session. Long tasks greater than 50 ms may block the browser main thread and cause jank or unresponsiveness.

This section includes one panel:
- Long Tasks (Blocking JavaScript)
Long Tasks (Blocking JavaScript)
The Long Tasks (Blocking JavaScript) panel lists long JavaScript tasks captured during the selected session. These tasks may delay user interactions or make the page feel unresponsive.
The panel includes the following columns, where available:
- Time: Displays when the long task occurred.
- Page: Displays the page where the long task occurred.
- Duration (ms): Displays how long the long task ran.
- Visibility: Displays the page visibility state when the long task occurred.
Errors
The Errors section lists errors encountered during the selected session. This section helps users identify failed requests, browser-side errors, affected pages, and trace IDs for deeper debugging.
This section includes one panel:
- Errors
Errors
The Errors panel displays errors captured during the selected session. It helps users understand when the error occurred, which page was affected, and which trace can be used for deeper investigation.
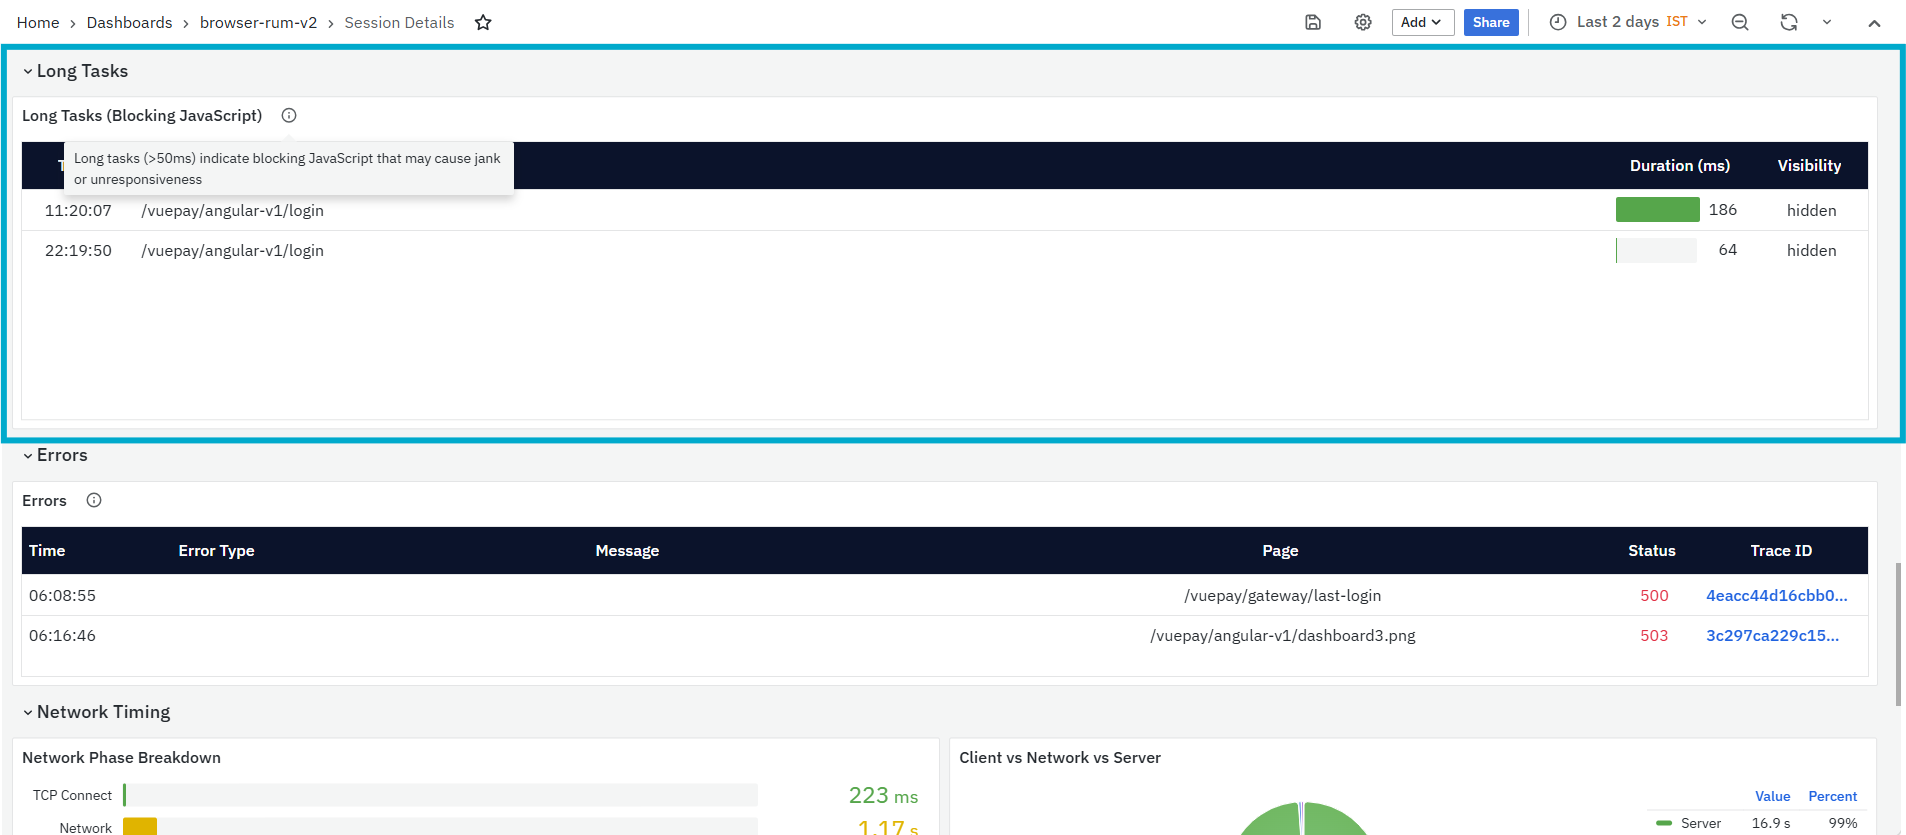
The panel includes the following columns:
- Time: Displays when the error occurred.
- Error Type: Displays the type or category of error.
- Message: Displays the error message, where available.
- Page: Displays the page where the error occurred.
- Status: Displays the HTTP status code or error status, where available.
- Trace ID: Displays the trace associated with the error. The Trace ID value is clickable and opens the TraceMap Waterfall dashboard for detailed trace analysis.
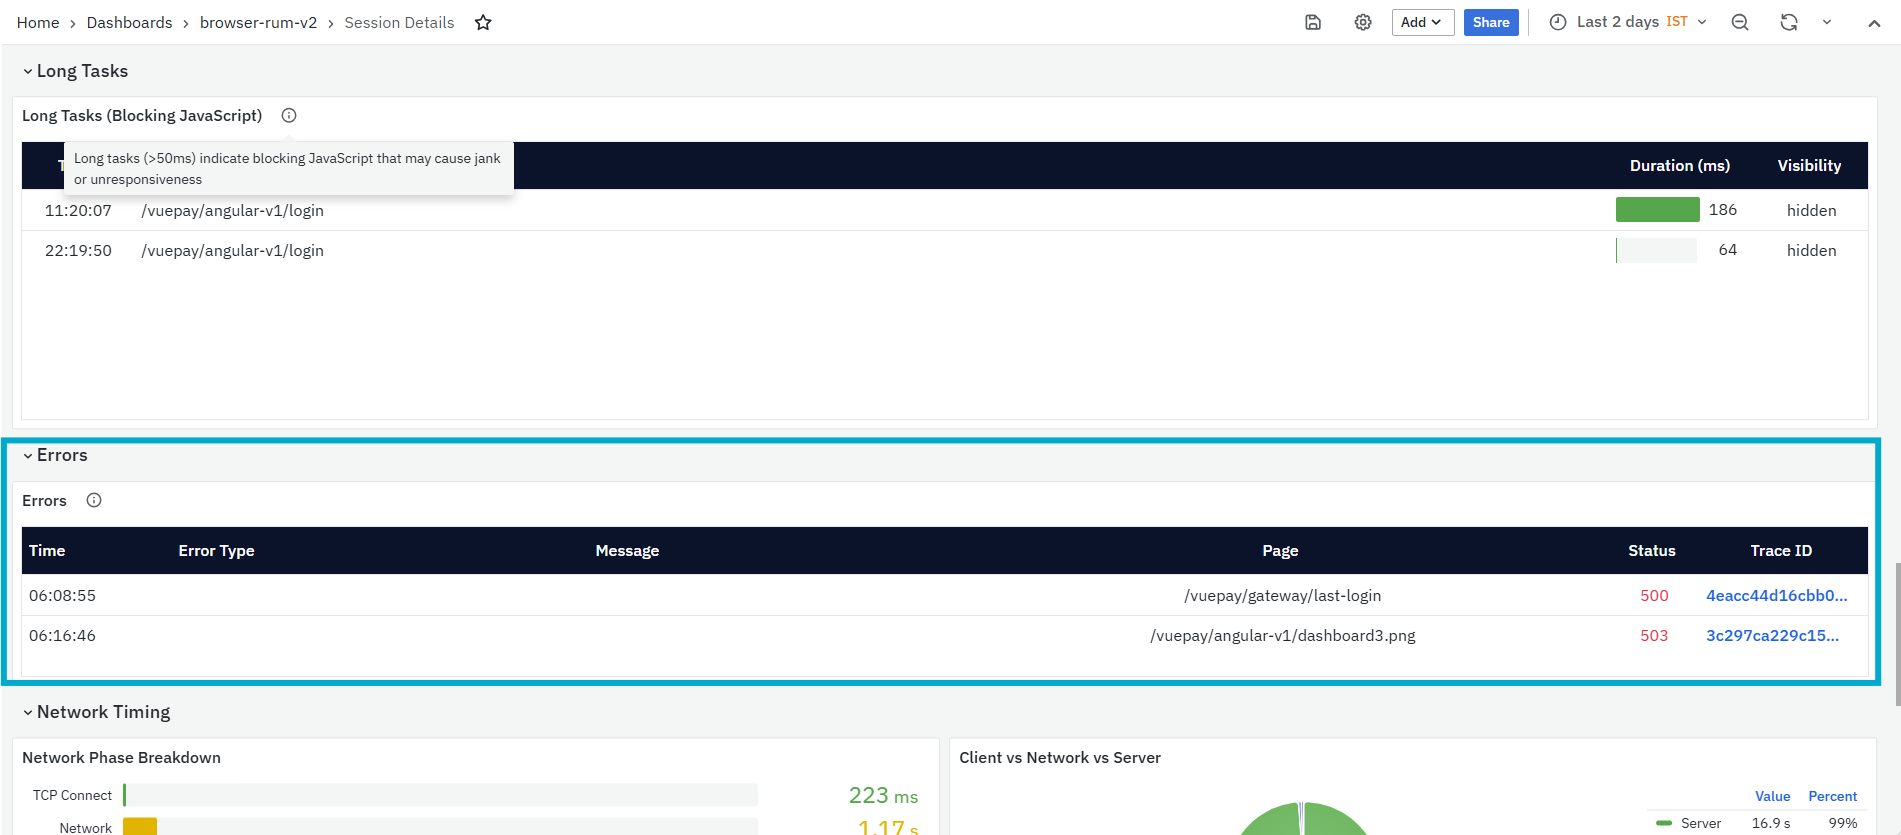
- The TraceMap Waterfall dashboard provides a detailed waterfall view of the selected trace. It shows trace summary, environment details, service time distribution, span sequence, span duration, and timing flow. For more details refer to TraceMap Waterfall.
Network Timing
The Network Timing section displays network and processing time for the selected session. This section helps users understand whether time was spent on DNS lookup, TCP connection, request, server processing, response, or client-side activity.
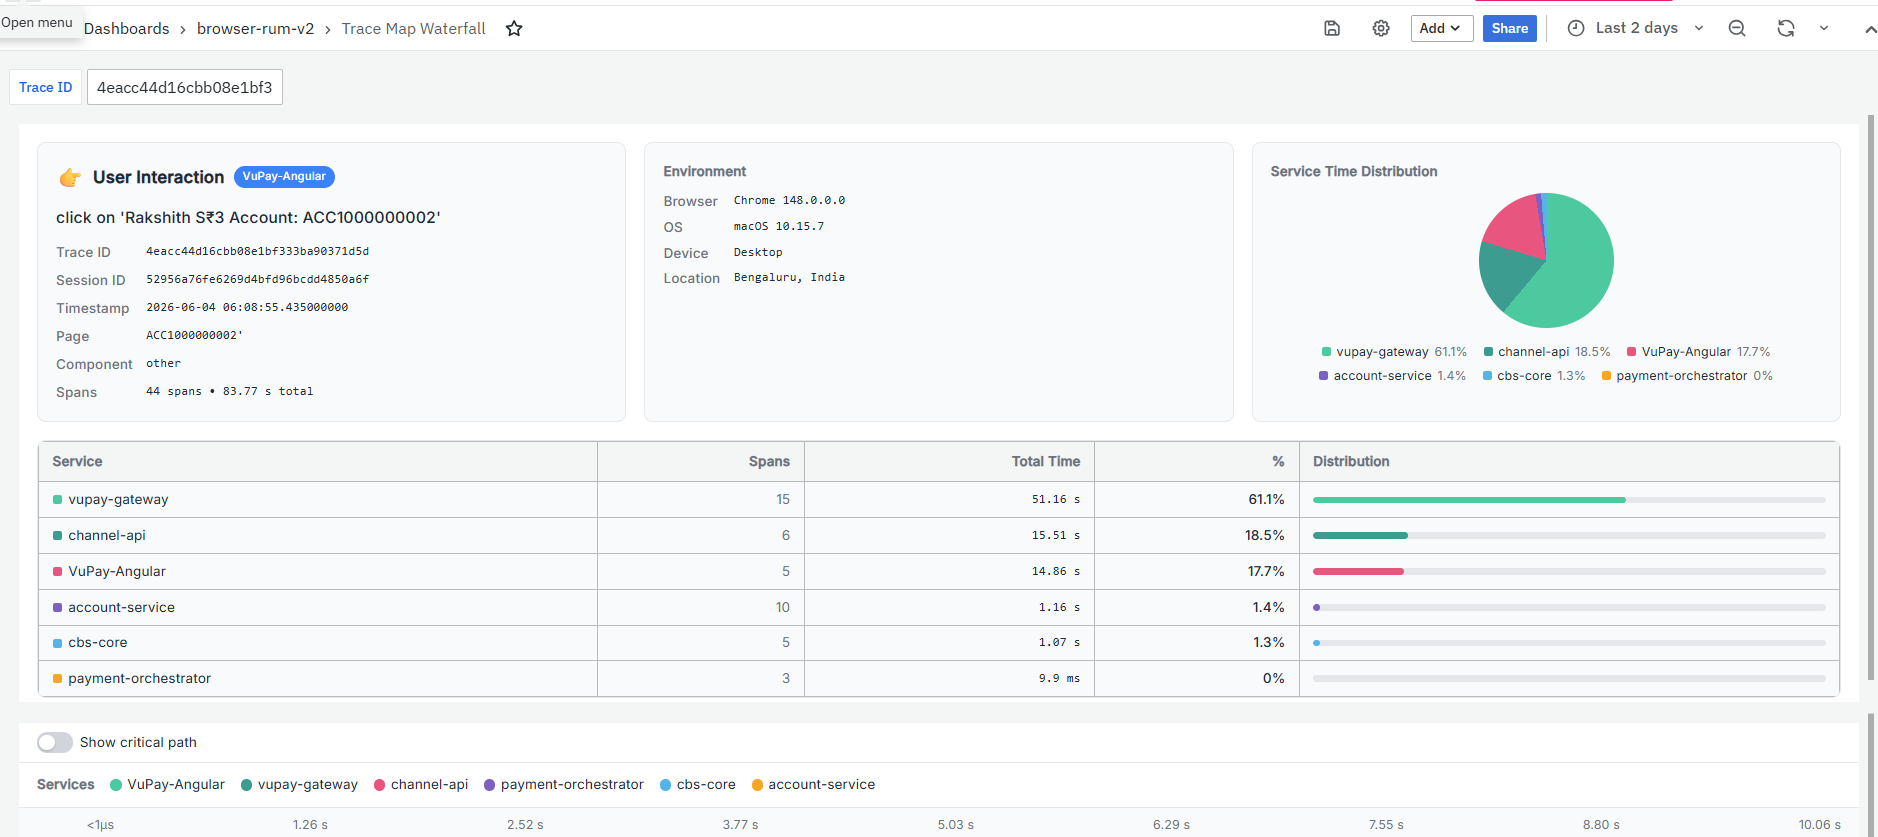
This section includes two panels:
- Network Phase Breakdown
- Client vs Network vs Server
Network Phase Breakdown
The Network Phase Breakdown panel shows how network time is distributed across different request phases, such as DNS lookup, request, TCP connect, server, and response.This panel is useful when users need to identify whether delay is caused by connection setup, server response, or response download.
Client vs Network vs Server
The Client vs Network vs Server panel shows the distribution of time across client, network, and server areas. It helps users understand whether the session delay is more related to browser-side processing, network behavior, or backend response. This panel is useful when users need to decide where to investigate first.
Complete Event Timeline
The Complete Event Timeline section lists the detailed sequence of events captured during the selected session. This section helps users review the full timeline of user activity, page loads, HTTP requests, route changes, web vitals, errors, and other events.
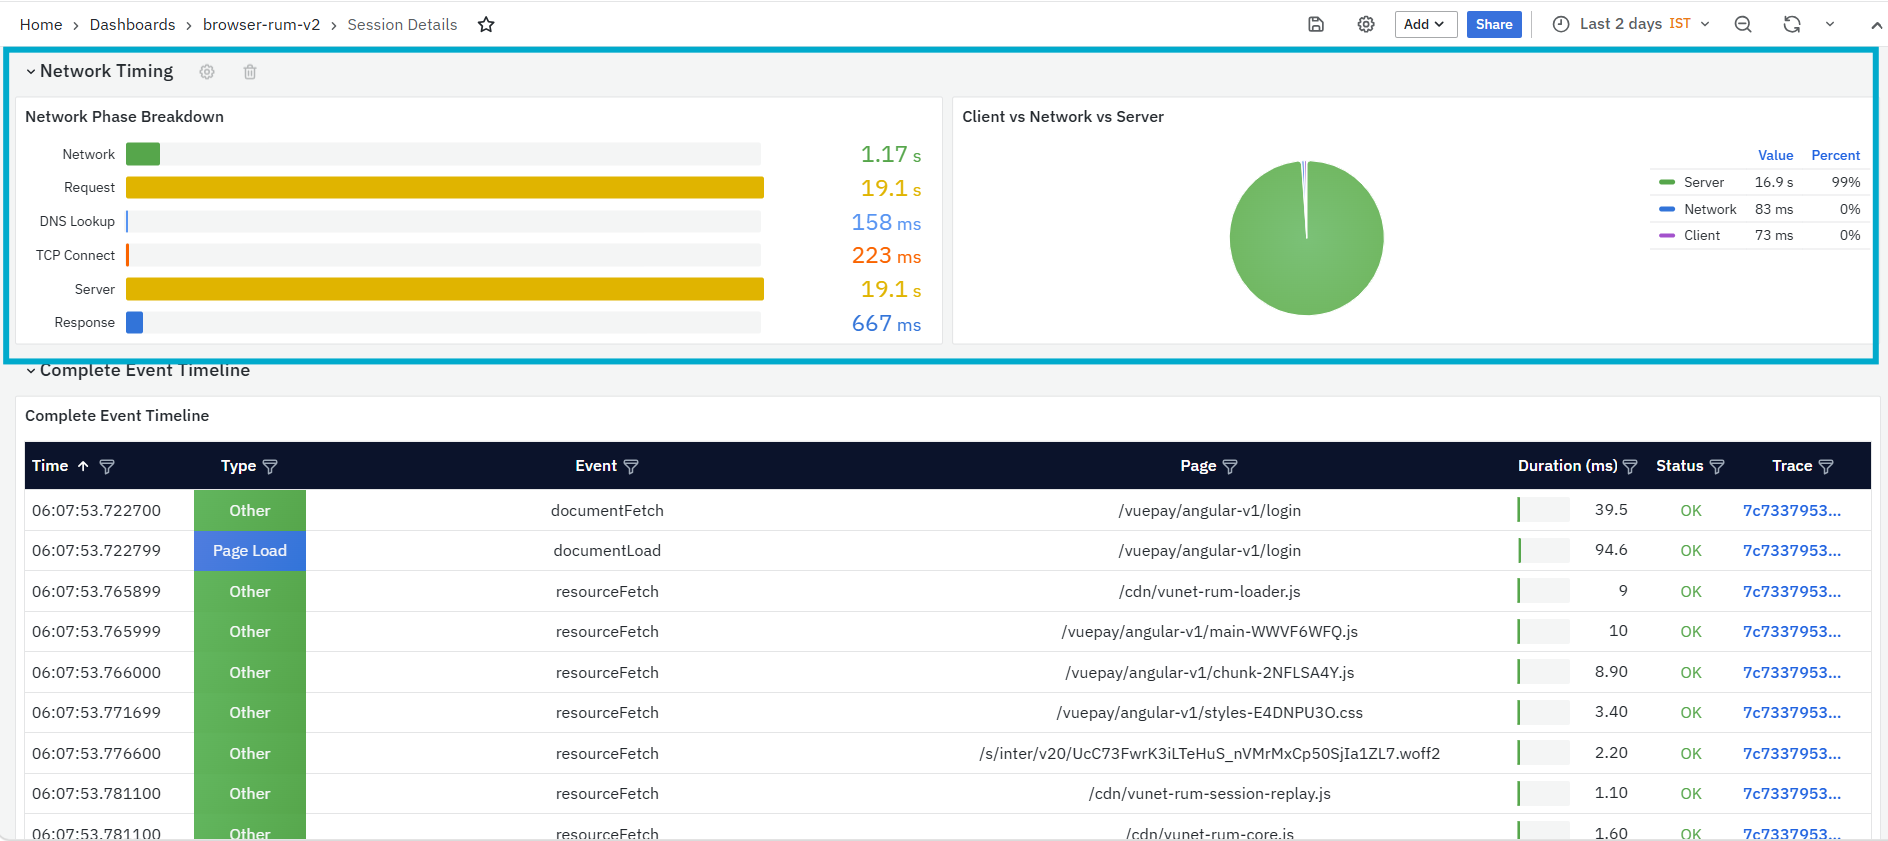
This section includes one panel:
- Complete Event Timeline
Complete Event Timeline
The Complete Event Timeline panel displays all captured session events in chronological order. It provides a detailed event-by-event view of what happened during the session.
The panel includes the following columns:
- Time: Displays when the event occurred.
- Type: Displays the event type, such as HTTP, Route, User Action, Web Vitals, Error, or Other.
- Event: Displays the event name or description.
- Page: Displays the page associated with the event.
- Duration (ms): Displays how long the event took, where applicable.
- Status: Displays the event status, such as OK or error status.
- Trace: Displays the trace associated with the event, where available. The Trace ID value is clickable and opens the TraceMap Waterfall dashboard for detailed trace analysis.

- The TraceMap Waterfall dashboard provides a detailed waterfall view of the selected trace. It shows trace summary, environment details, service time distribution, span sequence, span duration, and timing flow. For more details refer to TraceMap Waterfall.
This panel is useful when users need to reconstruct the full user journey. It helps identify what happened before an error, which actions led to a slow request, and how page loads, route changes, and user interactions occurred within the session.
HTTP Request Details Dashboard
The HTTP Request Details Dashboard is a dashboard in the Browser Real User Monitoring module. It provides a focused view of a selected HTTP/API request endpoint, including request volume, latency, error rate, status distribution, timing breakdown, user segments, recent errors, and recent requests. This dashboard helps users understand how a specific API endpoint is performing from the browser side. It can be used to identify slow response times, high error rates, failed status codes, affected sessions, trace-level issues, and user segments impacted by the endpoint.

The dashboard is divided into the following sections:
- Request Overview
- Time Breakdown
- Performance Over Time
- Context Analysis
- Endpoint Analysis
- Error Analysis
- User Segments
- Recent Requests
- Endpoint Deep Dive
Related Dashboard
The HTTP Request Details dashboard includes related dashboard links at the top-right side of the page.
-
App Summary: Opens the App Summary dashboard for the selected application. This dashboard gives a consolidated view of application health, error rate, sessions, page loads, route changes, HTTP requests, core web vitals, activity trends, slowest pages, top endpoints, prioritized issues, user agent, and geography details. For more details refer to App Summary.
-
App Detail: Opens the App Details dashboard for deeper application-level analysis. This dashboard provides detailed views of app health, impact analysis, error distribution, recent errors, HTTP requests, page performance, route changes, web vitals, user segments, geographic performance, sessions, and traces. For more details refer to App Details.
Request Overview
The Request Overview section provides a high-level summary of the selected HTTP request endpoint. It helps users quickly understand request volume, latency, error rate, client-side errors, server-side errors, and throughput.
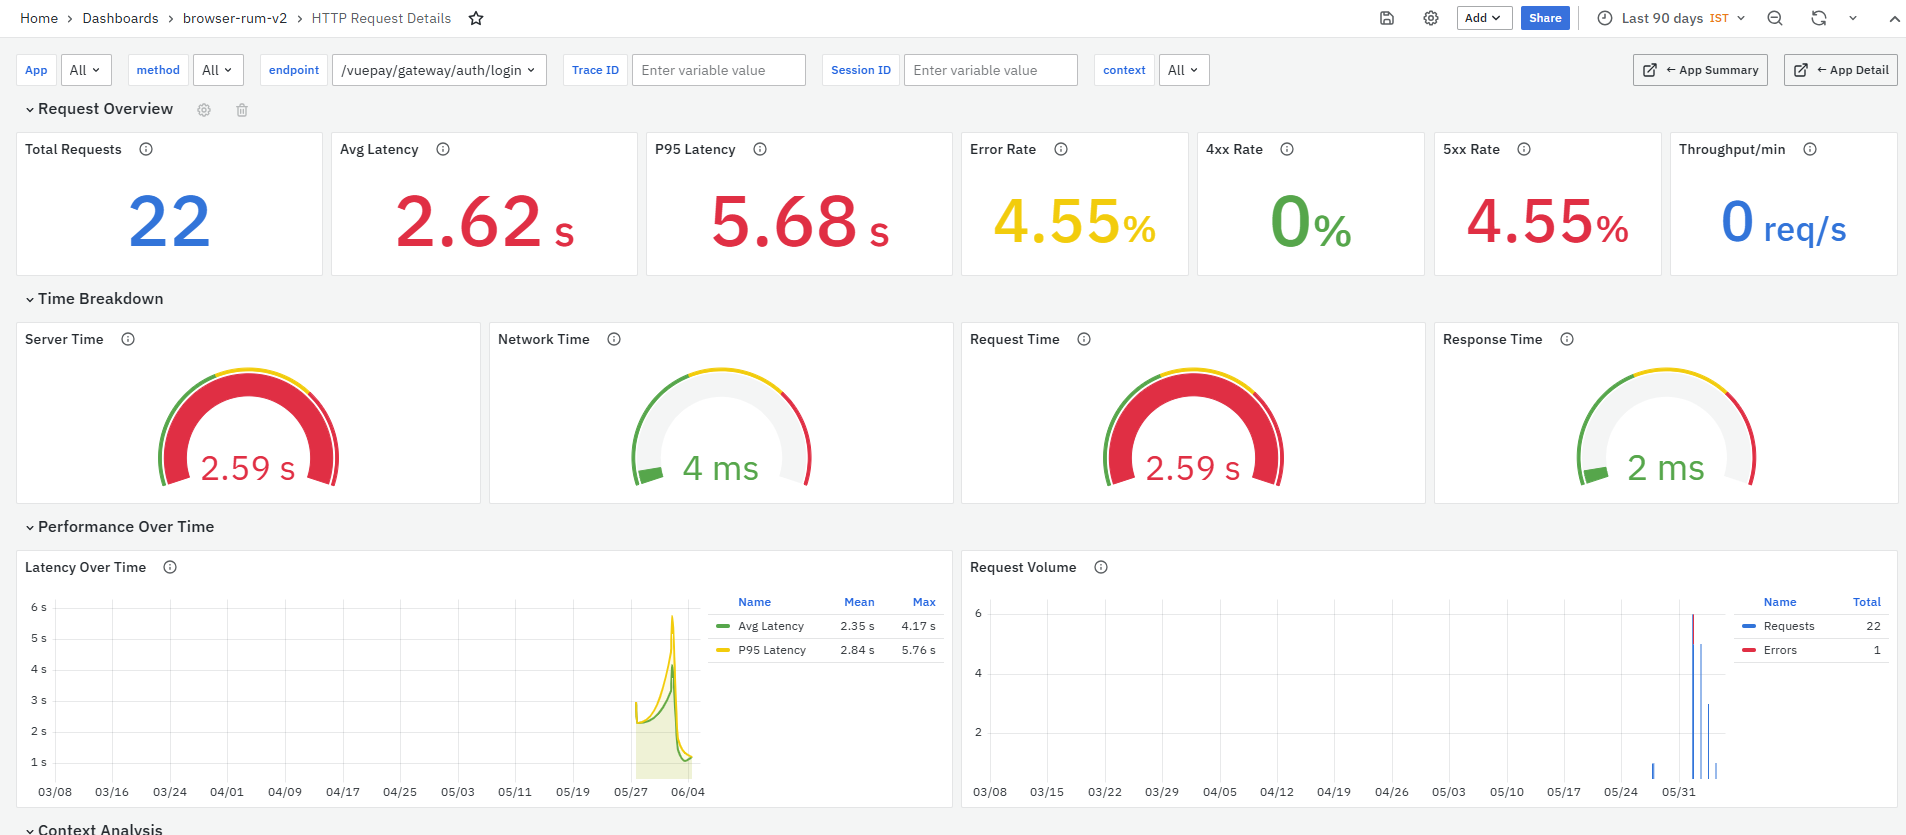
This section includes the following panels:
-
Total Requests - displays the total number of HTTP requests captured for the selected endpoint and time range. Higher values indicate more API activity for the selected endpoint.
-
Avg Latency - displays the average response time for the selected HTTP request endpoint. Values under 200 ms are considered good, while values over 1 second indicate poor performance and may require investigation.
-
P95 Latency - displays the 95th percentile response time. This means 95% of requests completed faster than this value. It helps identify worst-case performance for users.
-
Error Rate - displays the percentage of requests that failed with 4xx or 5xx status codes. A healthy service should generally keep this value under 1%.
-
4xx Rate - displays the percentage of requests returning client-side errors. These errors can include bad requests, unauthorized access, or not found responses. A high value may indicate API misuse or incorrect request handling.
-
5xx Rate - displays the percentage of requests returning server-side errors. Any value above 0% should be investigated because it may indicate service failure or backend issues.
-
Throughput/min -displays the average number of HTTP requests per minute. This panel is useful for capacity planning and anomaly detection.
Time Breakdown
The Time Breakdown section displays how the selected HTTP request time is divided across server processing, network, request, and response phases. This section helps users understand where the request is spending the most time and whether the delay is caused by the server, network, request handling, or response download.
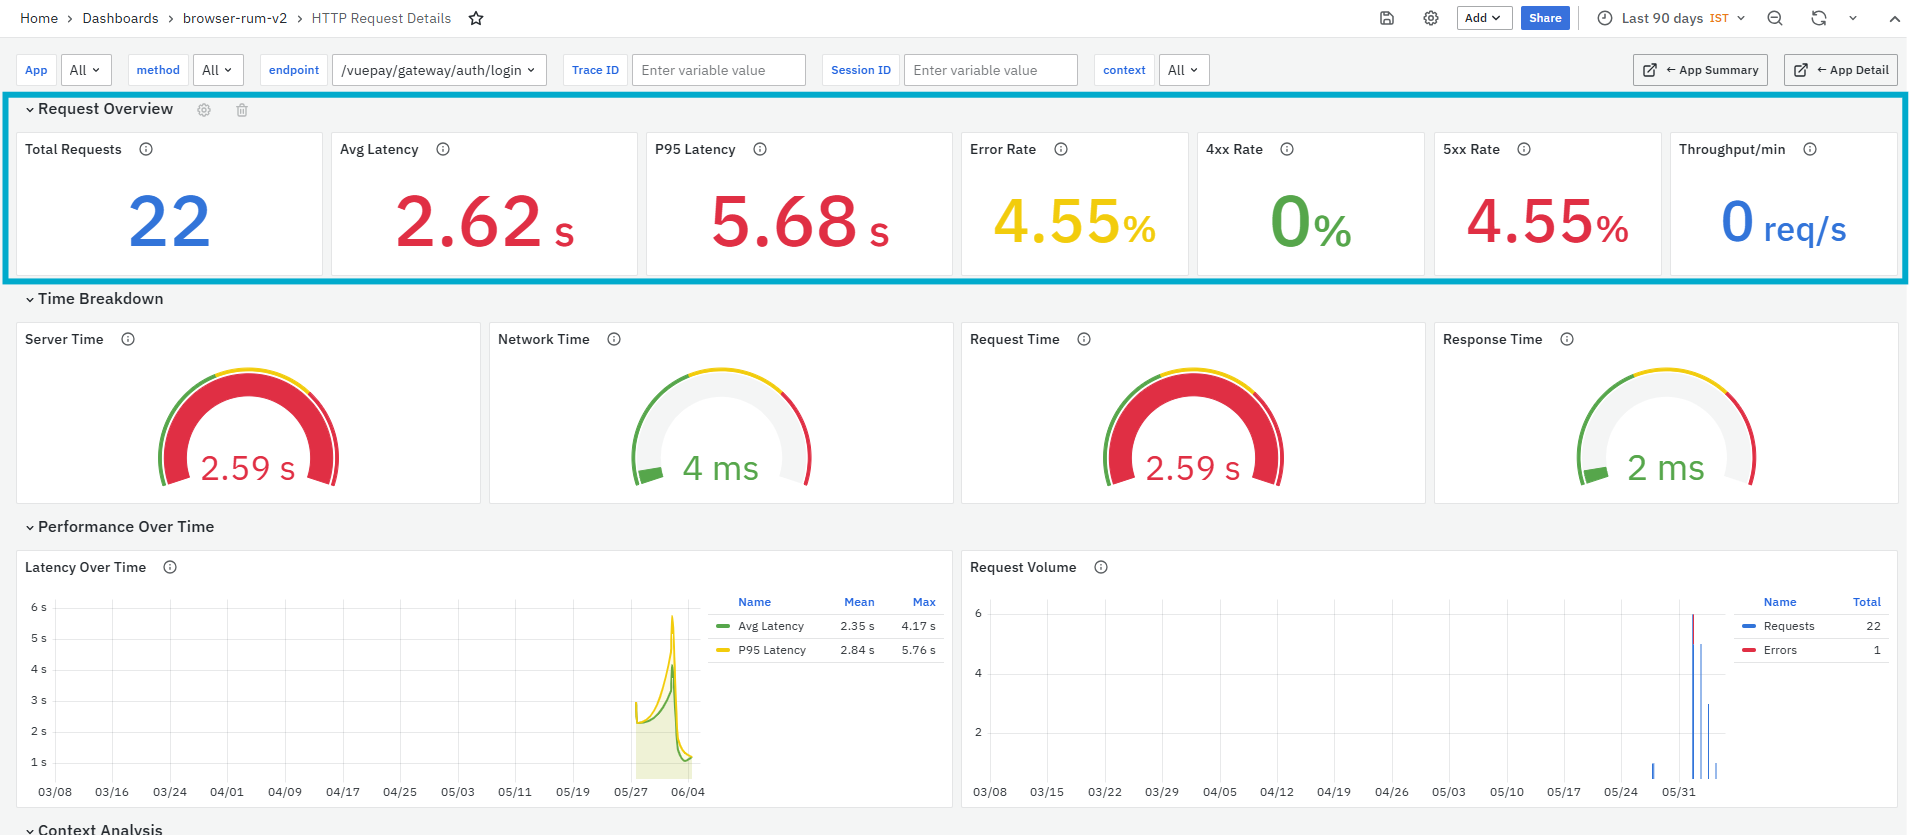
This section includes four panels:
-
Server Time - The Server Time panel displays the time spent by the server processing the request. This helps users understand whether the delay is coming from backend processing, application logic, database calls, or service-side execution. A high server time indicates that the backend service may need further investigation.
-
Network Time - The Network Time panel displays the network round-trip time between the browser and the server. This helps users identify whether latency is caused by network delay, routing, connectivity, or user location. A high network time means the request may be slow even if the server processing time is normal.
-
Request Time - The Request Time panel displays the time from when the request is sent until the first byte of the response is received. This helps users understand how long the browser waits before the server starts sending the response. A high request time may indicate backend delay, network delay, or slow request handling.
-
Response Time - The Response Time panel displays the time taken to read the full response body after the response starts. This helps users identify whether the response download or response size is affecting performance. A high response time may indicate large payloads, slow transfer, or browser-side delay while receiving the full response.
Performance Over Time
The Performance Over Time section displays latency and request volume trends for the selected HTTP request endpoint. This section helps users understand whether endpoint performance is stable or whether latency, traffic, or errors changed during the selected time range.
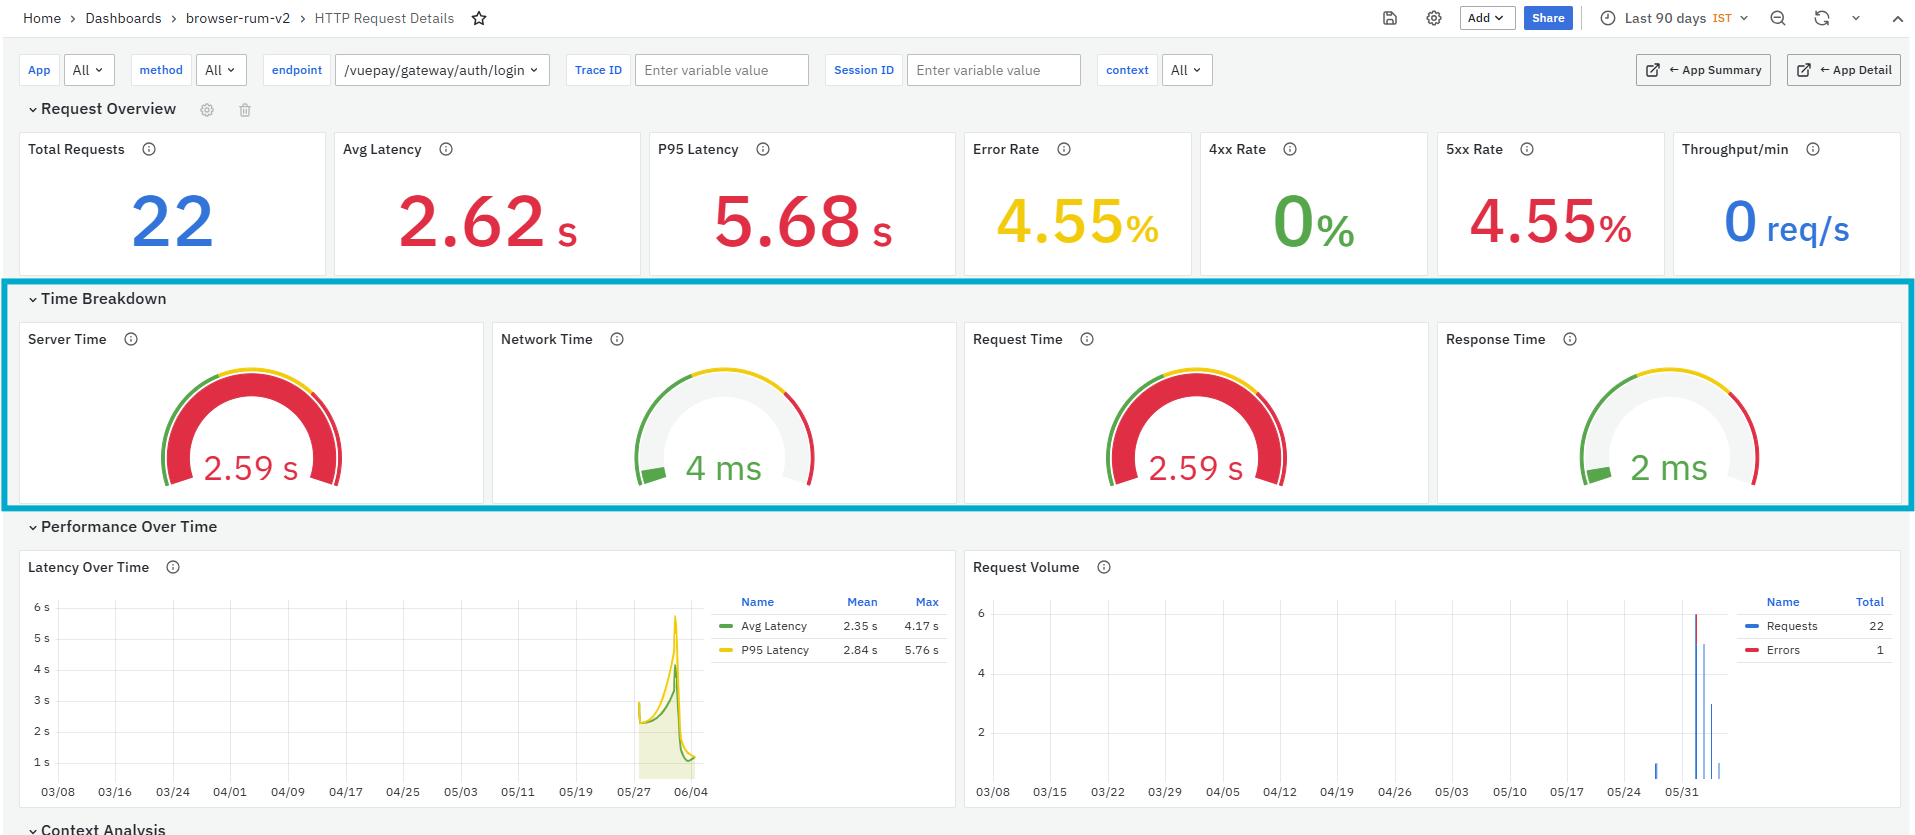
This section includes two panels:
- Latency Over Time
- Request Volume
Latency Over Time
The Latency Over Time panel shows how the selected endpoint’s latency changes over time. It displays both Avg Latency and P95 Latency, helping users compare normal response behavior with slower responses experienced by some users.
It helps you identify:
- Latency spikes for the selected endpoint
- Time periods where the endpoint became slow
- Difference between average latency and P95 latency
- Whether high latency is temporary or recurring
- Worst-case performance patterns affecting users
Request Volume
The Request Volume panel shows request count and error count over time for the selected endpoint. It helps users understand how many requests were made and whether errors occurred during the same time period.
It helps you identify:
- Request spikes for the selected endpoint
- Error spikes during specific time windows
- Whether errors increased with request volume
- Low-traffic or high-traffic periods
- Time windows that need deeper request-level investigation
Context Analysis
The Context Analysis section displays how HTTP requests are distributed by context, such as asynchronous calls or user interaction-based requests. This section helps users understand whether the selected endpoint is mostly triggered in the background or through user actions.
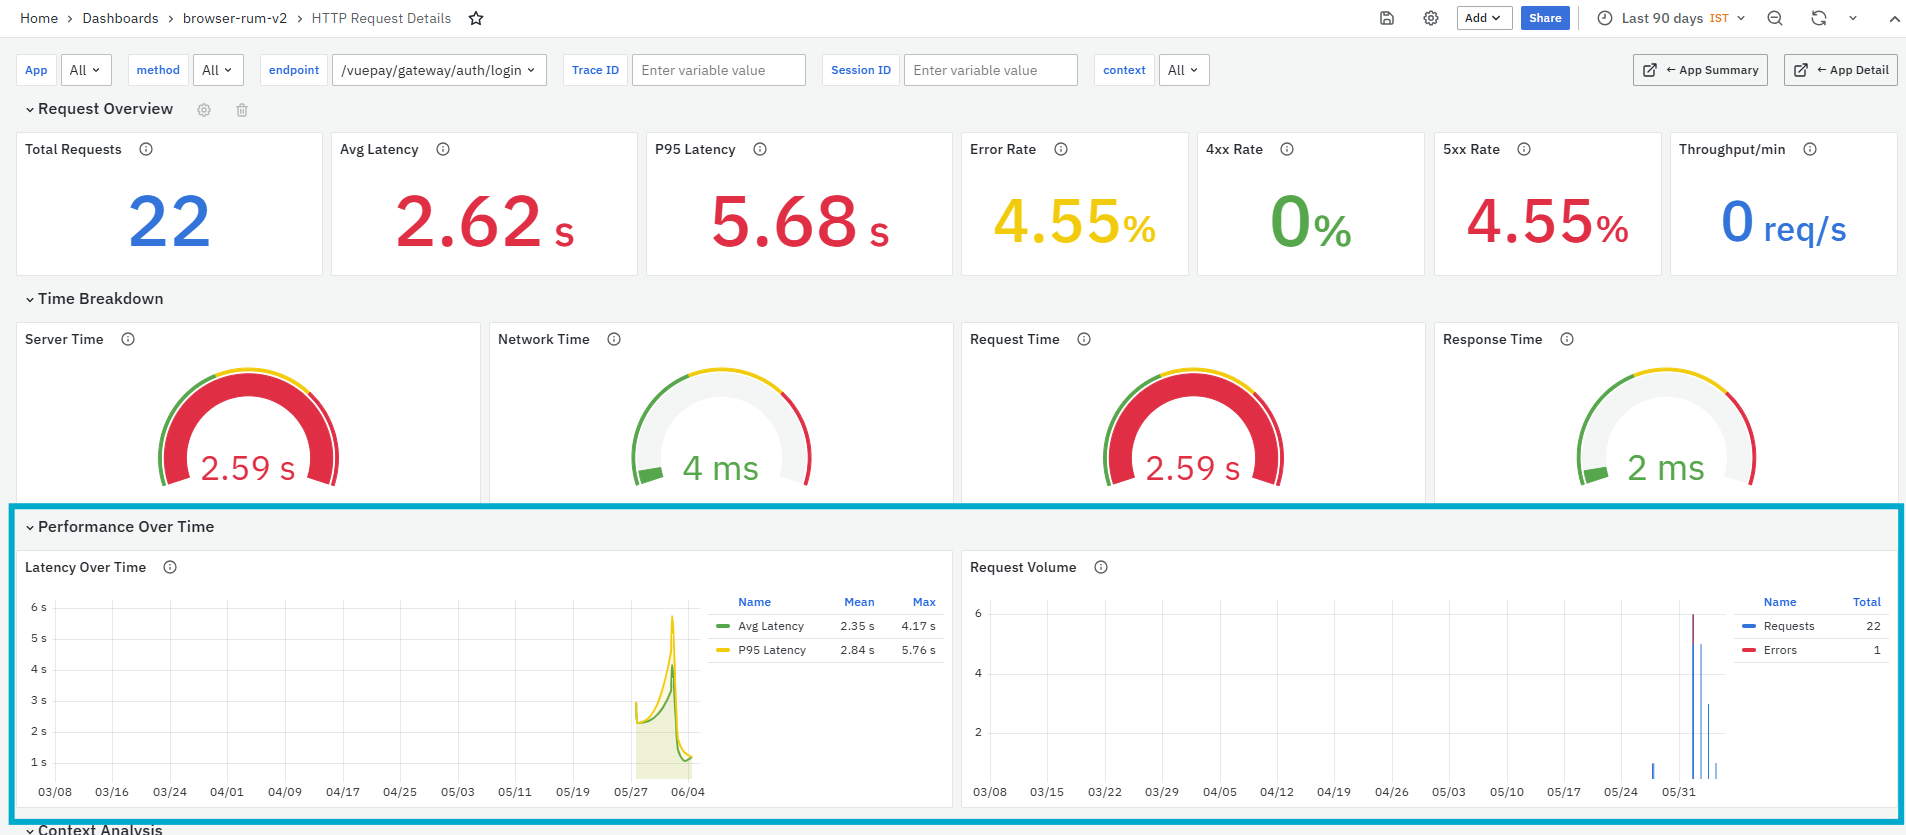
This section includes one panel:
● Request Context Breakdown
Request Context Breakdown
The Request Context Breakdown panel breaks down HTTP requests by context. It shows request count, average response time, error percentage, and contribution percentage for each context. This panel is primarily used to understand request patterns and identify whether errors or latency are linked to a specific request context.
It helps you identify:
-
Whether the endpoint is called mostly through async requests or user interactions
-
Which context has higher request volume
-
Which context has higher average latency
-
Which context has a higher error percentage
-
Whether background calls or user-triggered actions need investigation
The panel includes the following columns:
-
Context: Displays the request context, such as Async or User Interaction.
-
Requests: Displays the number of requests captured for that context.
-
Avg (ms): Displays the average response time for requests in that context.
-
Error %: Displays the percentage of requests that failed for that context.
-
% of Total: Displays how much the context contributes to the total request volume.
Endpoint Analysis
The Endpoint Analysis section provides endpoint-level performance details for the selected HTTP request. This section helps users understand how the endpoint is performing in terms of request count, latency, server time, network time, response size, and errors.
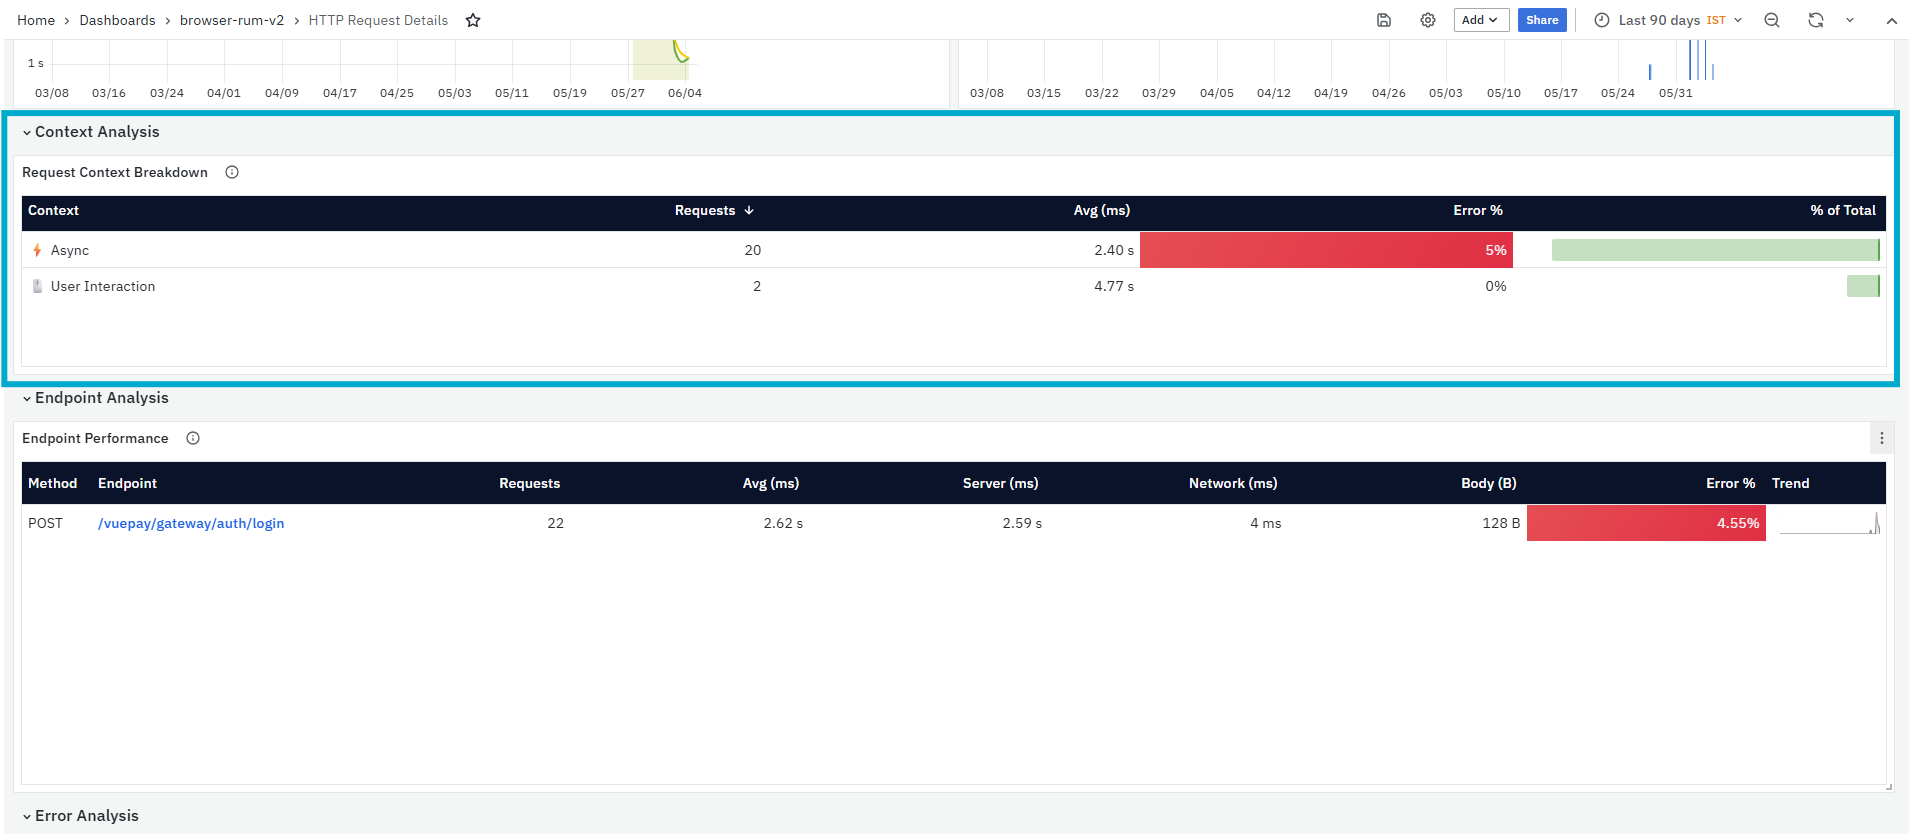
This section includes one panel:
- Endpoint Performance
Endpoint Performance
The Endpoint Performance panel displays a detailed performance breakdown for the selected endpoint. It helps users identify whether the endpoint delay is caused by server processing, network time, response body size, or error behavior.
It helps you identify:
-
Total request volume for the selected endpoint
-
Average latency for the endpoint
-
Server-side processing time
-
Network time taken by the request
-
Response body size
-
Error percentage and trend
The panel includes the following columns:
-
Method: Displays the HTTP method used for the request, such as GET or POST.
-
Endpoint: Displays the selected HTTP/API endpoint.
-
Requests: Displays the total number of requests made to the endpoint.
-
Avg (ms): Displays the average response time for the endpoint.
-
Server (ms): Displays the time spent on server-side processing.
-
Network (ms): Displays the time spent in network communication.
-
Body (B): Displays the response body size in bytes.
-
Error %: Displays the percentage of failed requests for the endpoint.
-
Trend: Displays the endpoint performance trend over the selected time range.
Error Analysis
The Error Analysis section displays error-related details for the selected HTTP request endpoint. This section helps users understand when errors occurred, which status codes were returned, how errors are distributed, and which recent failed requests need further debugging.
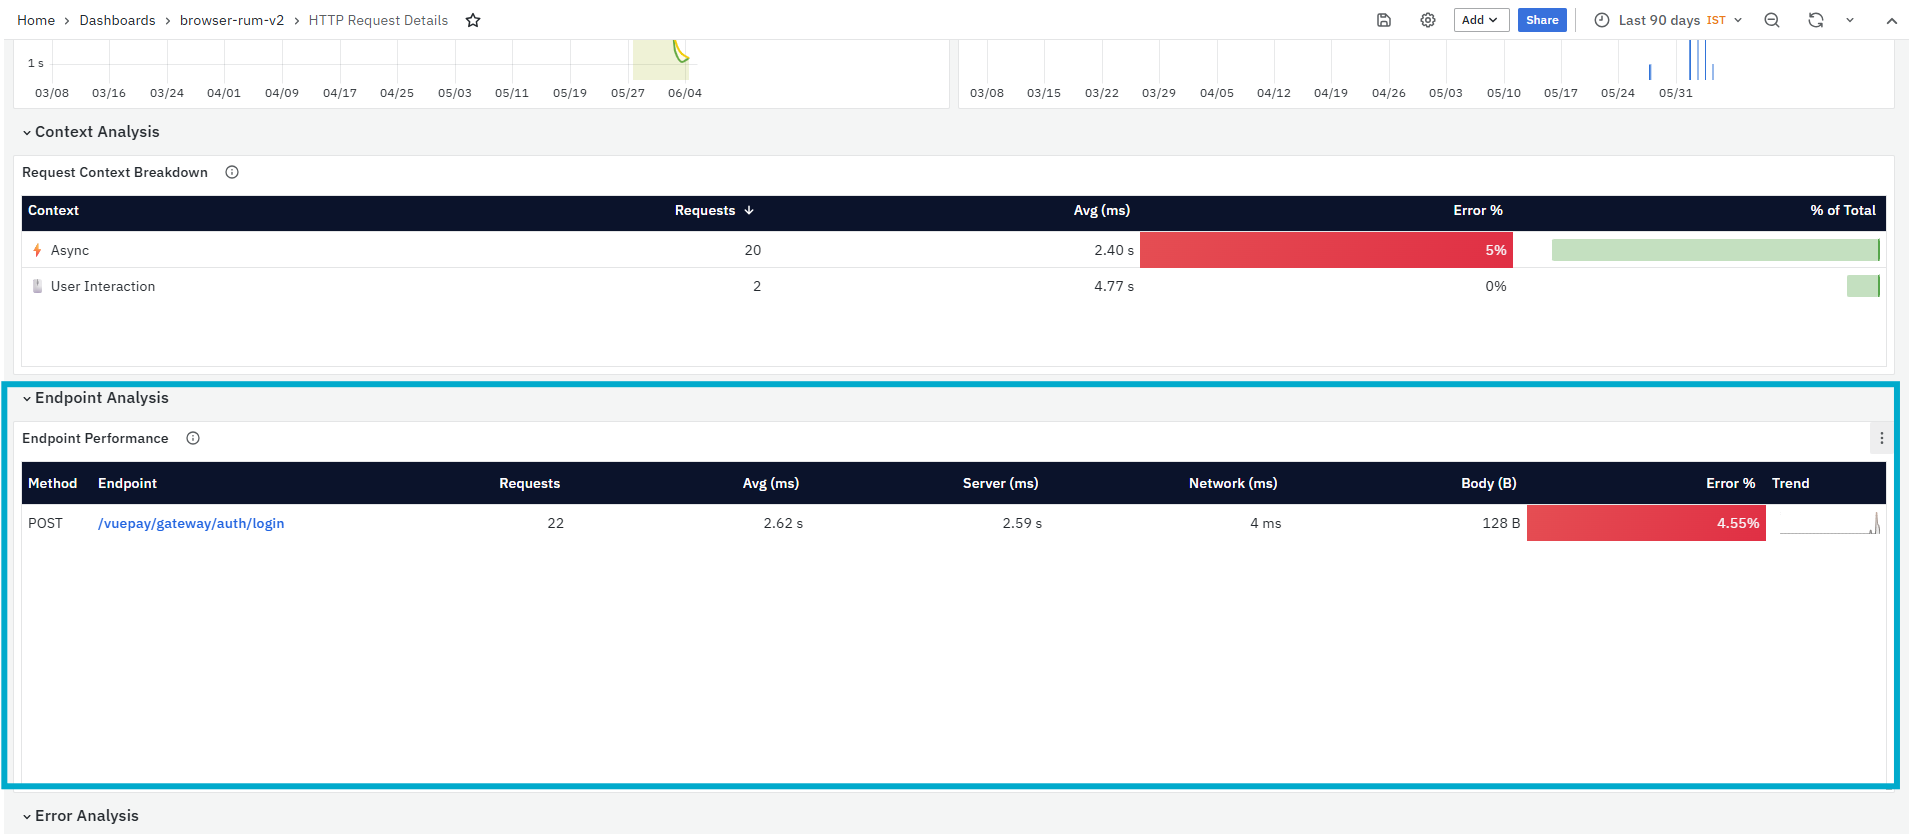 This section includes five panels:
- Error Timeline
- Failed Requests by Status
- HTTP Status Distribution
- Errors by Endpoint
- Recent Errors
Error Timeline
The Error Timeline panel displays error counts over time by status code category, such as 4xx errors and 5xx errors. This panel helps users identify when failures occurred for the selected endpoint.
It helps you identify:
- Time periods where endpoint errors occurred
- Whether errors were 4xx client errors or 5xx server errors
- Error spikes during the selected time range
- Specific time windows that need deeper debugging
Failed Requests by Status
The Failed Requests by Status panel provides a detailed breakdown of failed requests by HTTP status code. It helps users understand which error status is contributing to failures and how much impact it has on the selected endpoint.
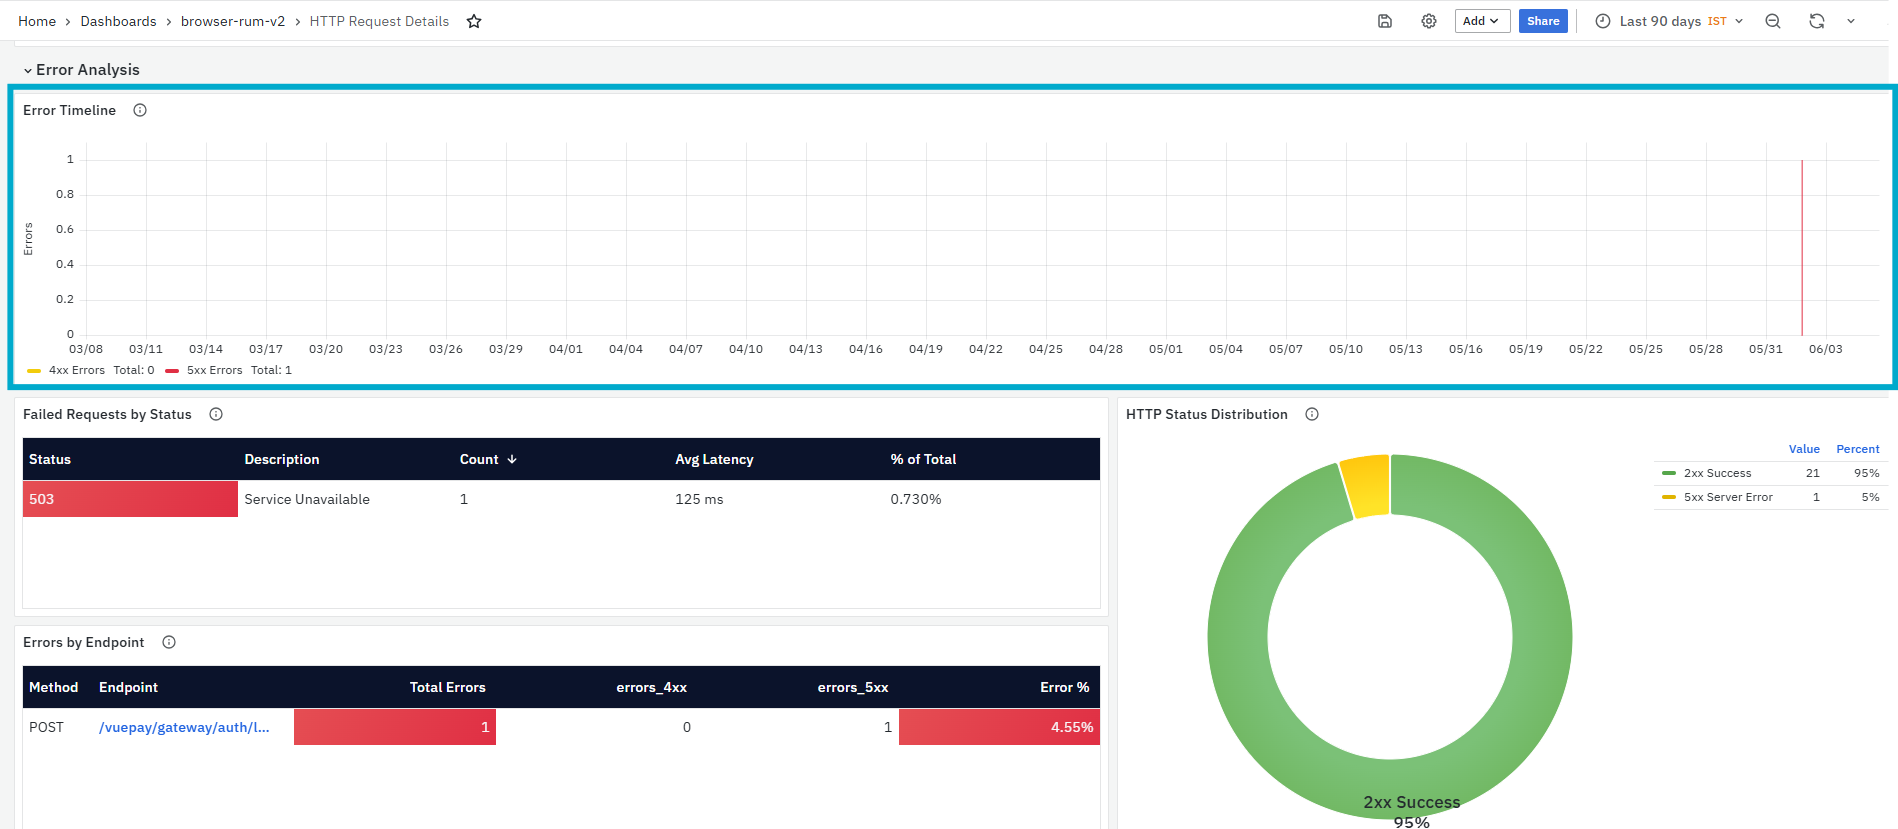
The panel includes the following columns:
-
Status: Displays the HTTP status code, such as 503.
-
Description: Displays the meaning of the status code, such as Service Unavailable.
-
Count: Displays the number of failed requests for that status.
-
Avg Latency: Displays the average latency for requests with that status.
-
% of Total: Displays how much this status contributes to the total request volume.
HTTP Status Distribution
The HTTP Status Distribution panel displays the distribution of HTTP responses by status category. It shows successful and failed responses, such as 2xx Success and 5xx Server Error, with their value and percentage.

It helps you identify:
- Percentage of successful requests
- Percentage of failed requests
- Whether failures are a small or significant part of total traffic
- Which status category contributes to endpoint errors
Errors by Endpoint
The Errors by Endpoint panel displays error details for the selected endpoint. It shows the total number of errors and separates them into 4xx and 5xx error counts.
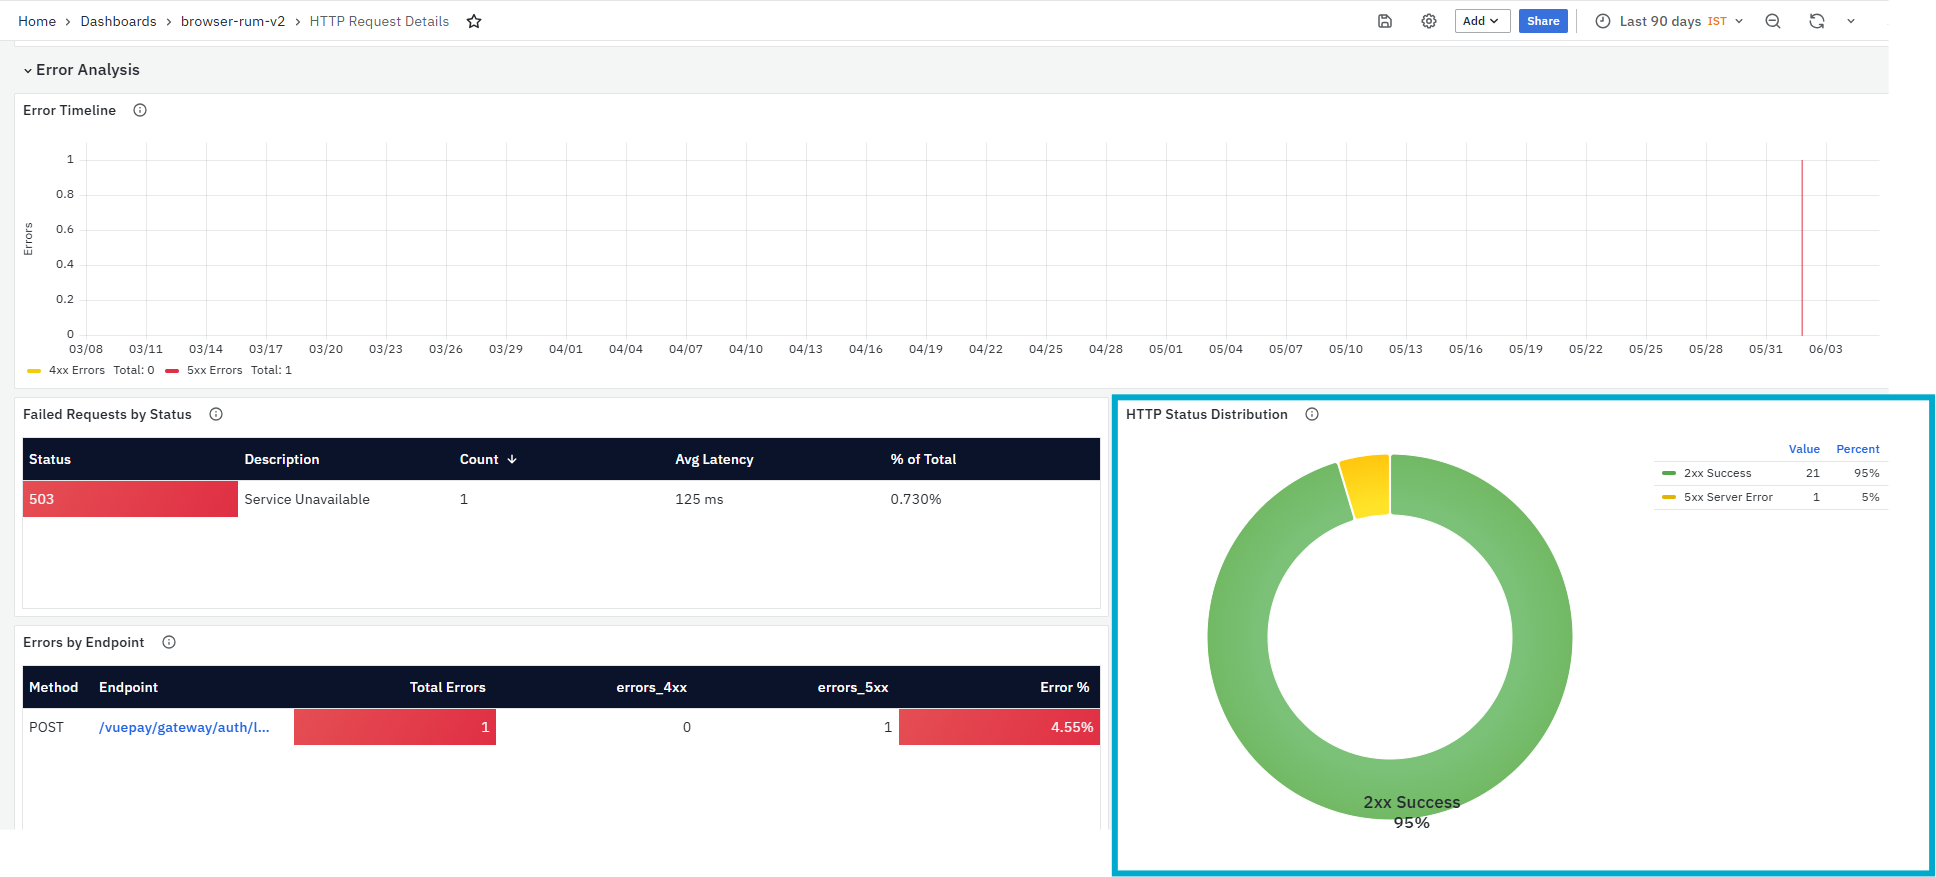
The panel includes the following columns:
- Method: Displays the HTTP method used for the request, such as POST.
- Endpoint: Displays the HTTP/API endpoint where the error occurred. The Endpoint value is clickable and opens the HTTP Request Details dashboard for that endpoint.
- Total Errors: Displays the total number of errors for the endpoint.
- errors_4xx: Displays the number of client-side errors.
- errors_5xx: Displays the number of server-side errors.
- Error %: Displays the percentage of requests that resulted in errors.
Recent Errors
The Recent Errors panel lists the latest failed requests for the selected endpoint. This panel is useful for debugging because it shows the exact failed request, status code, latency, session, and trace details.
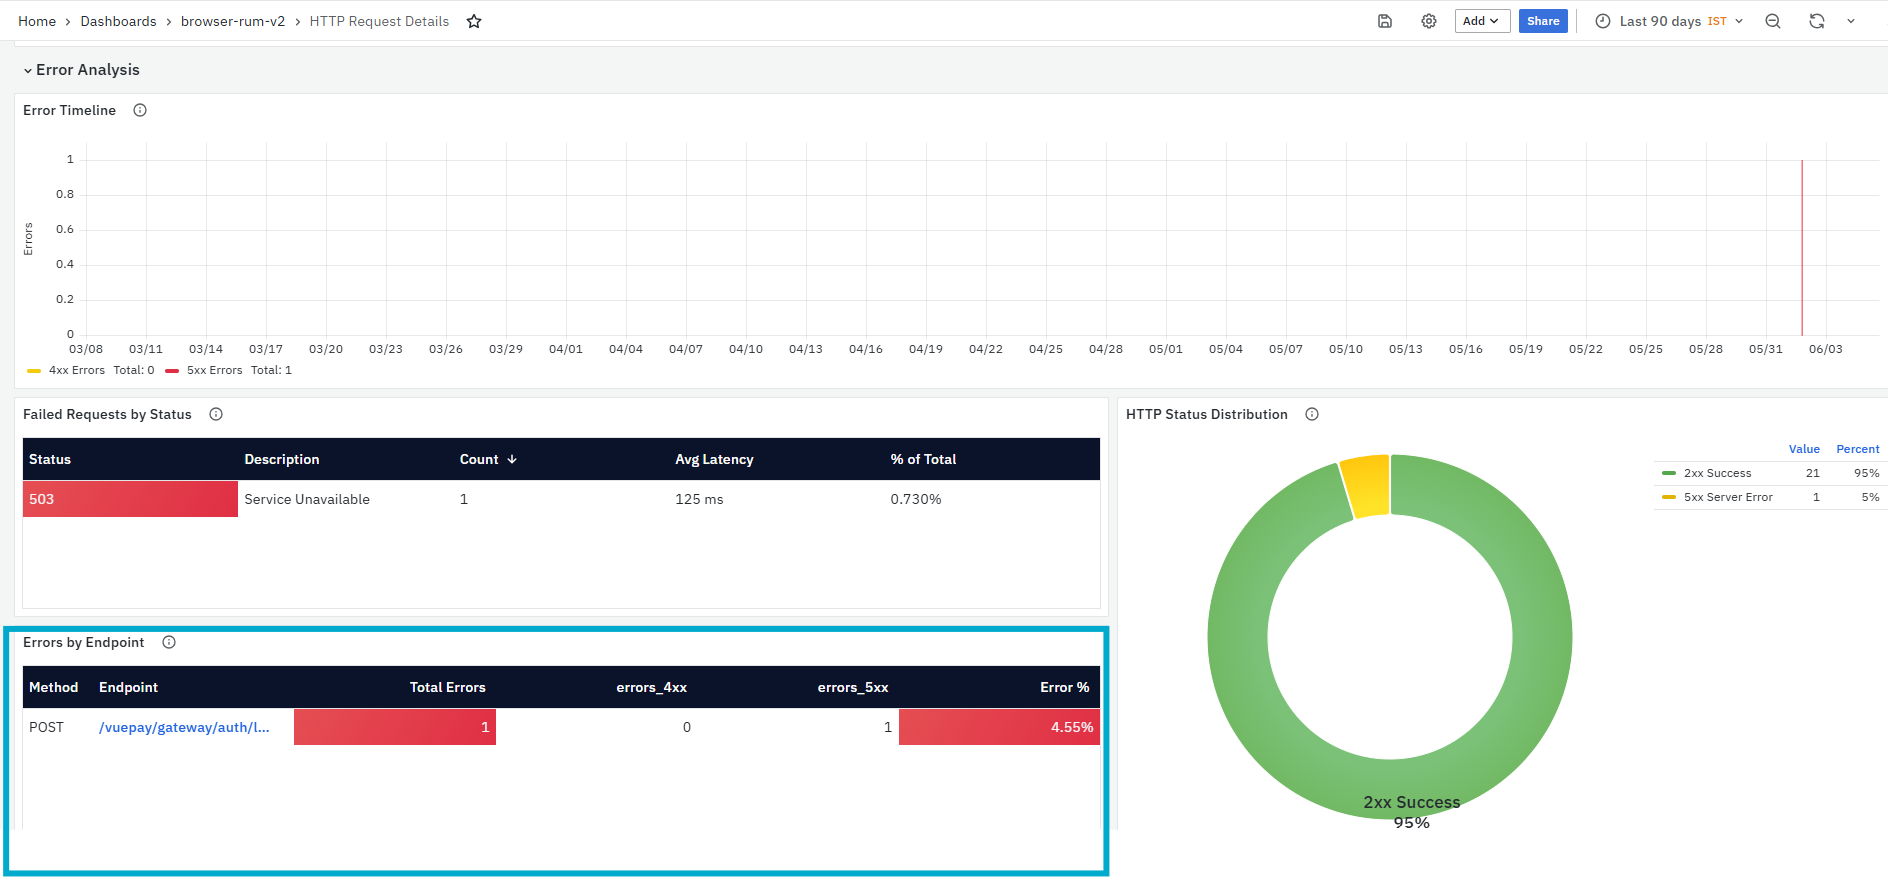
The panel includes the following columns:
- Time: Displays when the error occurred.
- Method: Displays the HTTP method used for the request.
- Endpoint: Displays the endpoint where the error occurred.
- Status: Displays the HTTP status code returned by the endpoint.
- Latency: Displays the response time for the failed request.
- Session ID: Displays the session associated with the failed request. The Session ID value is clickable. When clicked, a context menu is displayed with the following options:
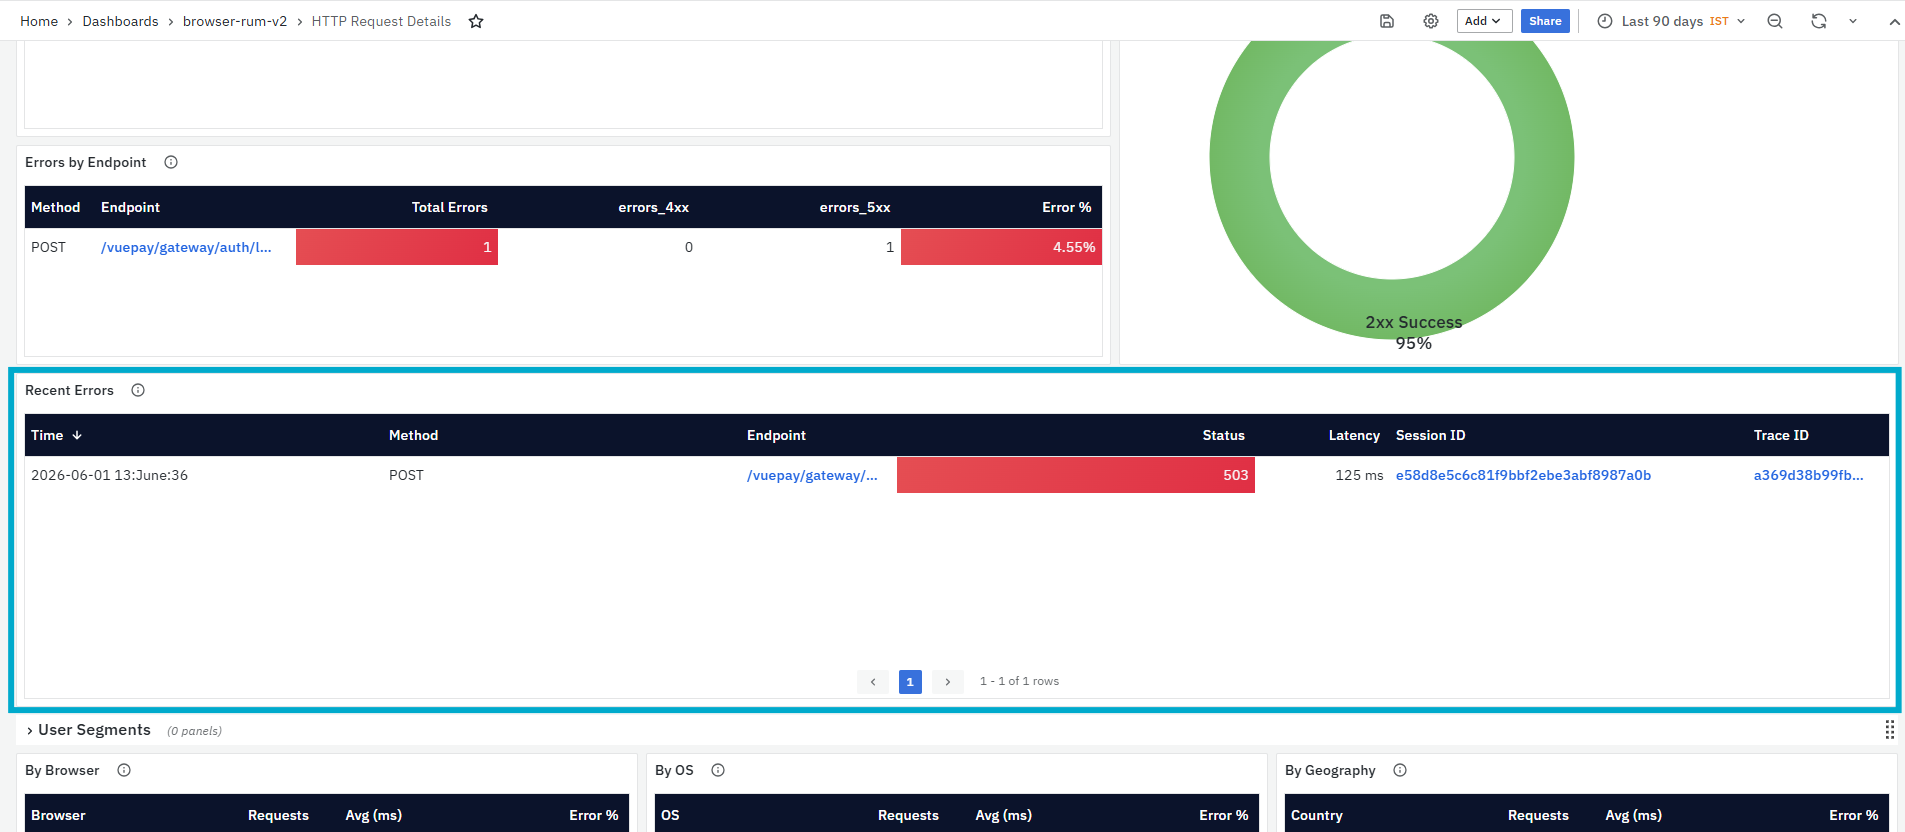
- Filter by Session: Filters all dashboard sections based on the selected session and shows the detailed view for that session.
- Session Detail: Opens the Session Details dashboard for the selected session.
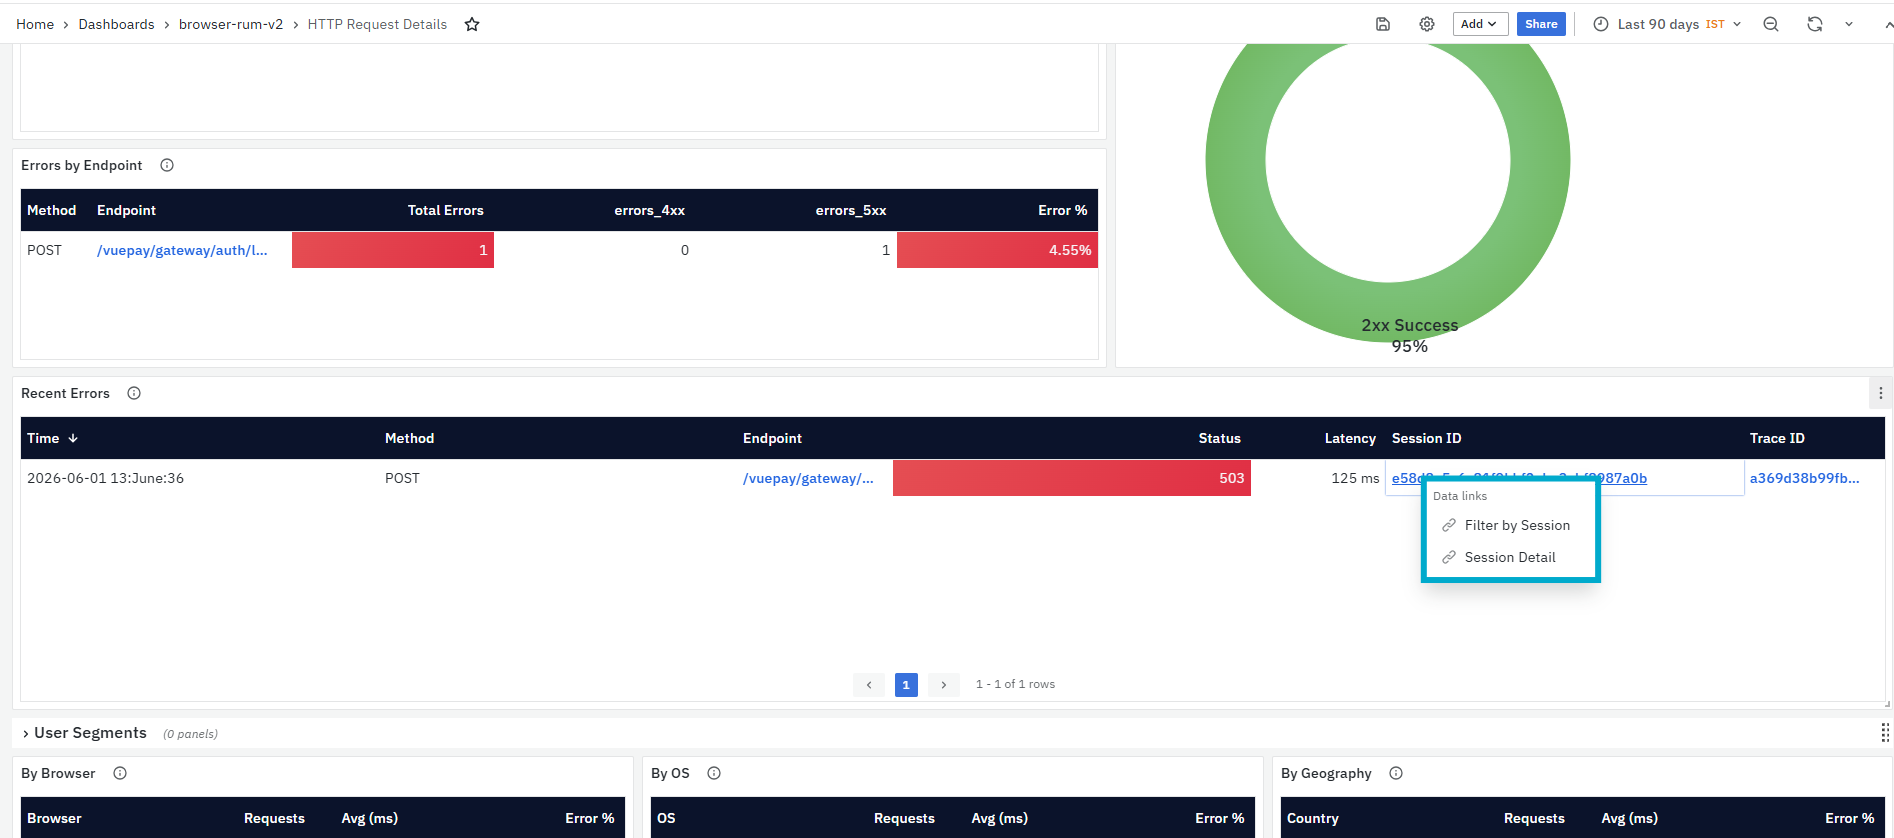
- The Session Details dashboard provides a detailed view of the selected user session. It shows session header details, activity summary, session timeline, activity timeline, performance overview, page views, HTTP requests, user interactions, route changes, long tasks, errors, network timing, and complete event timeline. For more details refer to session details.
- Trace ID: Displays the trace associated with the failed request. The Trace ID value is clickable. When clicked, a context menu is displayed with the following options:

- Filter by Trace: Filters all dashboard sections based on the selected trace and shows the detailed view for that trace.
- View Trace Map: Opens the TraceMap Waterfall dashboard for the selected trace.

- The TraceMap Waterfall dashboard provides a waterfall-style view of the selected trace. It shows trace summary, environment details, service time distribution, span sequence, duration, and timing flow. For more details refer to TraceMap Waterfall.
User Segments
The User Segments section displays HTTP request performance grouped by browser, operating system, and geography. This section helps users understand whether the selected endpoint behaves differently for specific browsers, OS types, or locations.
![][image179]
This section includes three panels:
- By Browser
- By OS
- By Geography
By Browser
The By Browser panel displays endpoint performance grouped by browser. It helps users check whether a specific browser is seeing higher latency or more errors for the selected HTTP request.
The panel includes the following columns:
-
Browser: Displays the browser name, such as Chrome, Safari, or Firefox.
-
Requests: Displays the number of requests made from that browser.
-
Avg (ms): Displays the average latency for requests from that browser.
-
Error %: Displays the percentage of failed requests from that browser.
By OS
The By OS panel displays endpoint performance grouped by operating system. It helps users check whether users on a specific operating system are experiencing slower responses or higher errors.
The panel includes the following columns:
-
OS: Displays the operating system, such as Linux or macOS.
-
Requests: Displays the number of requests made from that operating system.
-
Avg (ms): Displays the average latency for requests from that operating system.
-
Error %: Displays the percentage of failed requests from that operating system.
By Geography
The By Geography panel displays endpoint performance grouped by location. It helps users check whether users from specific countries are facing higher latency or more request failures.
The panel includes the following columns:
- Country: Displays the country from where the request was made.
- Requests: Displays the number of requests from that country.
- Avg (ms): Displays the average latency for requests from that country.
- Error %: Displays the percentage of failed requests from that country.
This panel is useful when users need to identify location-specific endpoint performance or availability issues.
Recent Requests
The Recent Requests panel displays recent HTTP request records for debugging. It helps users inspect individual requests and understand whether the endpoint is returning successful responses, errors, or slow responses.
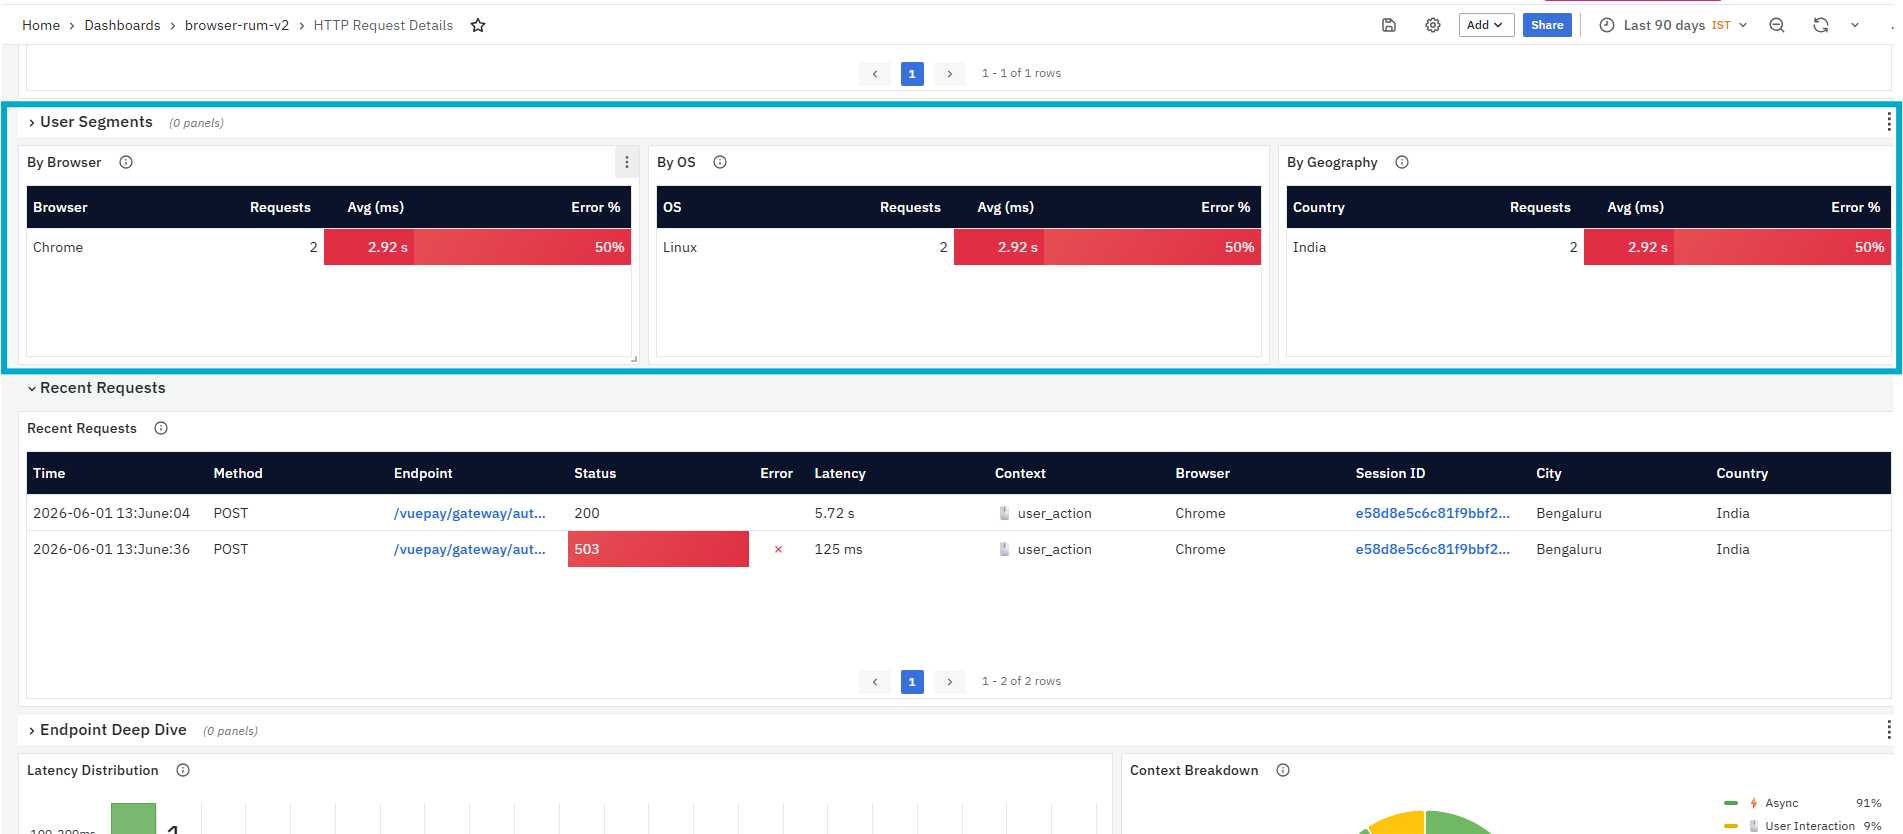
It helps you identify:
-
Recent requests made to the selected endpoint
-
HTTP method and status returned by the endpoint
-
Request latency for each record
-
Request context, such as user action
-
Browser, session, city, and country details linked to the request
The panel includes the following columns:
-
Time: Displays when the request occurred.
-
Method: Displays the HTTP method used for the request, such as POST.
-
Endpoint: Displays the HTTP/API endpoint that was called.
-
Status: Displays the HTTP response status code.
-
Error: Displays error information, if available.
-
Latency: Displays the response time for the request.
-
Context: Displays the context in which the request was made, such as user action.
-
Browser: Displays the browser used for the request.
-
Session ID: Displays the session associated with the request. The Session ID value is clickable. When clicked, a context menu is displayed with the following options:
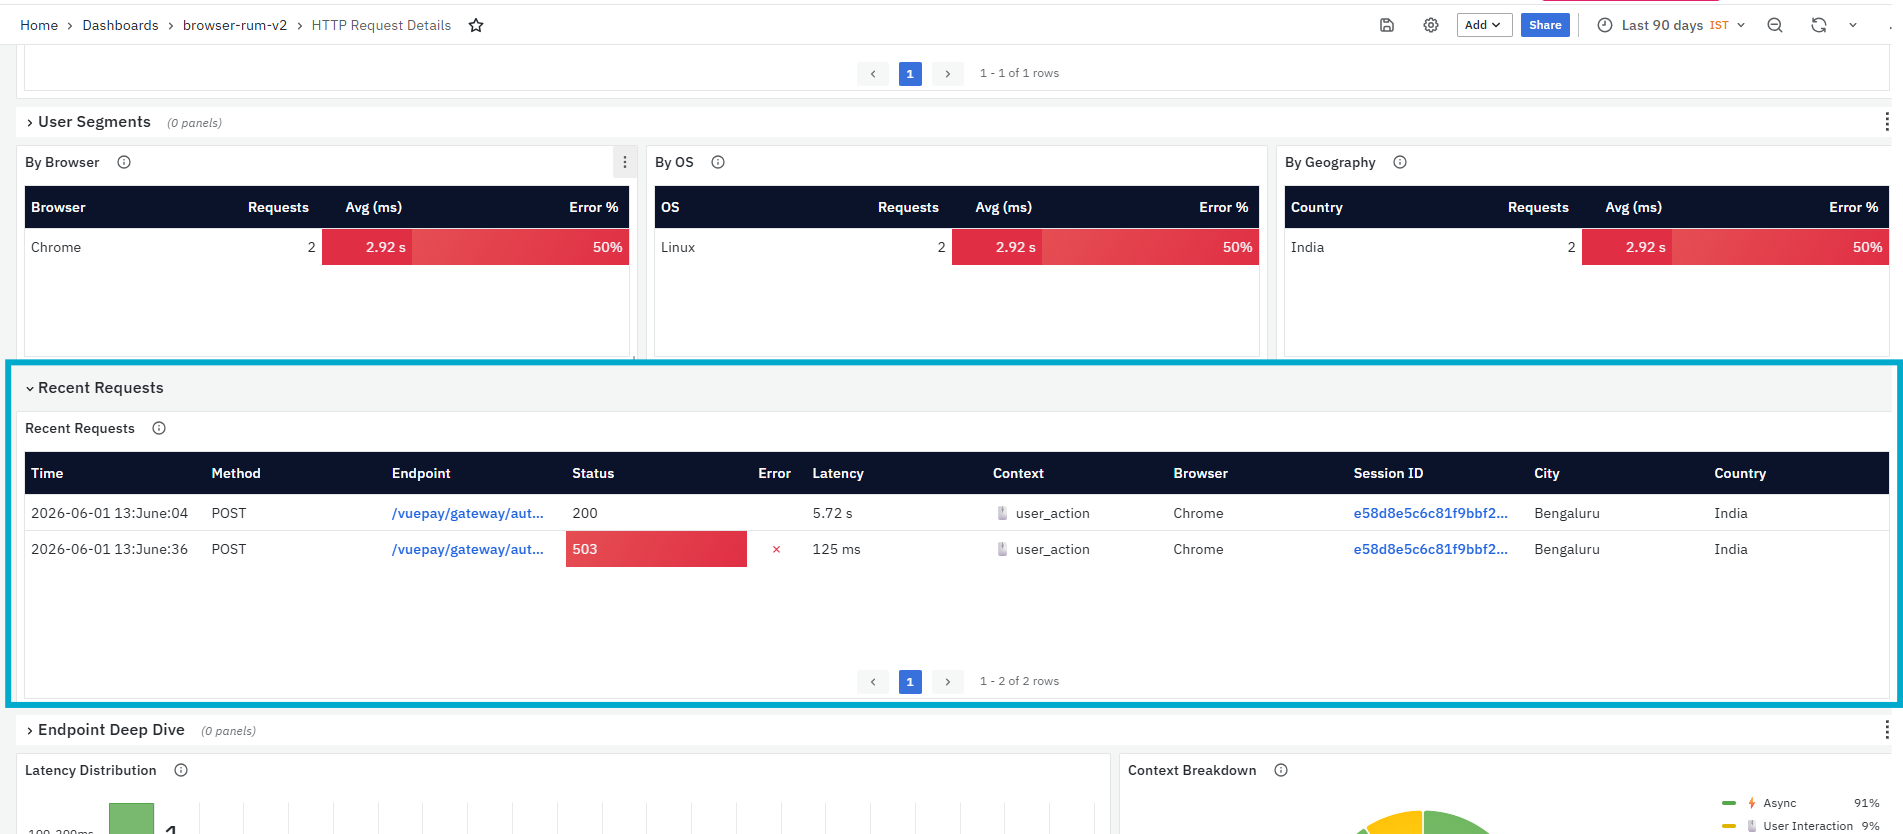
-
Filter by Session: Filters all dashboard sections based on the selected session and shows the detailed view for that session.
-
Session Detail: Opens the Session Details dashboard for the selected session.
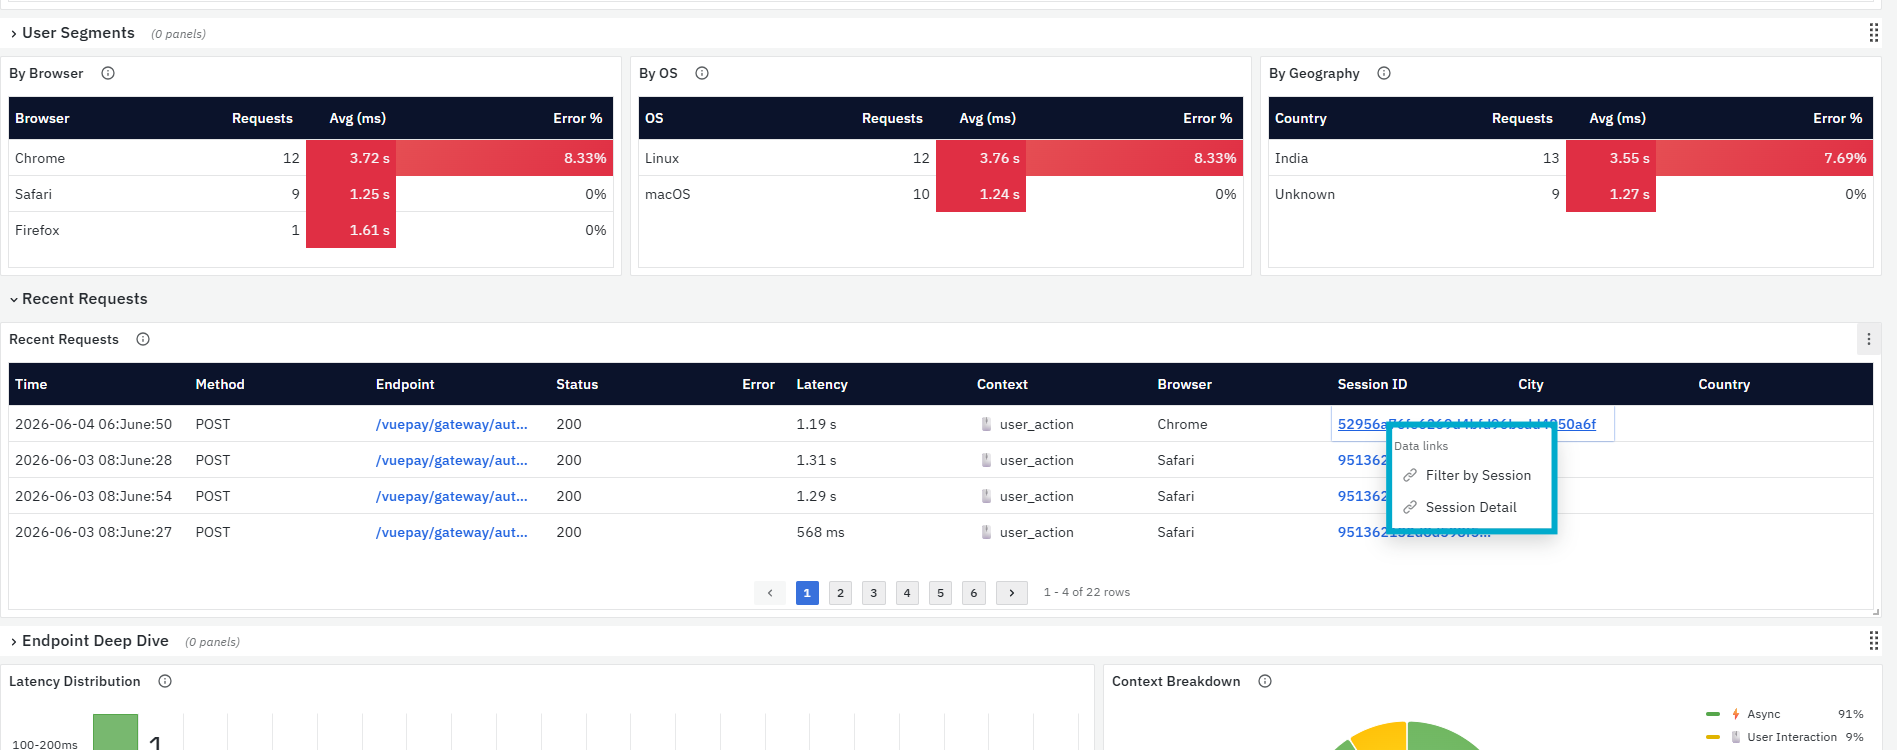
-
The Session Details dashboard provides a detailed view of the selected user session. It shows session header details, activity summary, session timeline, activity timeline, performance overview, page views, HTTP requests, user interactions, route changes, long tasks, errors, network timing, and complete event timeline. For more details refer to session details.
-
City: Displays the city associated with the request, if available.
-
Country: Displays the country associated with the request, if available.
Endpoint Deep Dive
The Endpoint Deep Dive section provides additional distribution-level details for the selected HTTP request endpoint. This section helps users understand how request latency is spread across different latency buckets and which request contexts contribute to the endpoint activity.
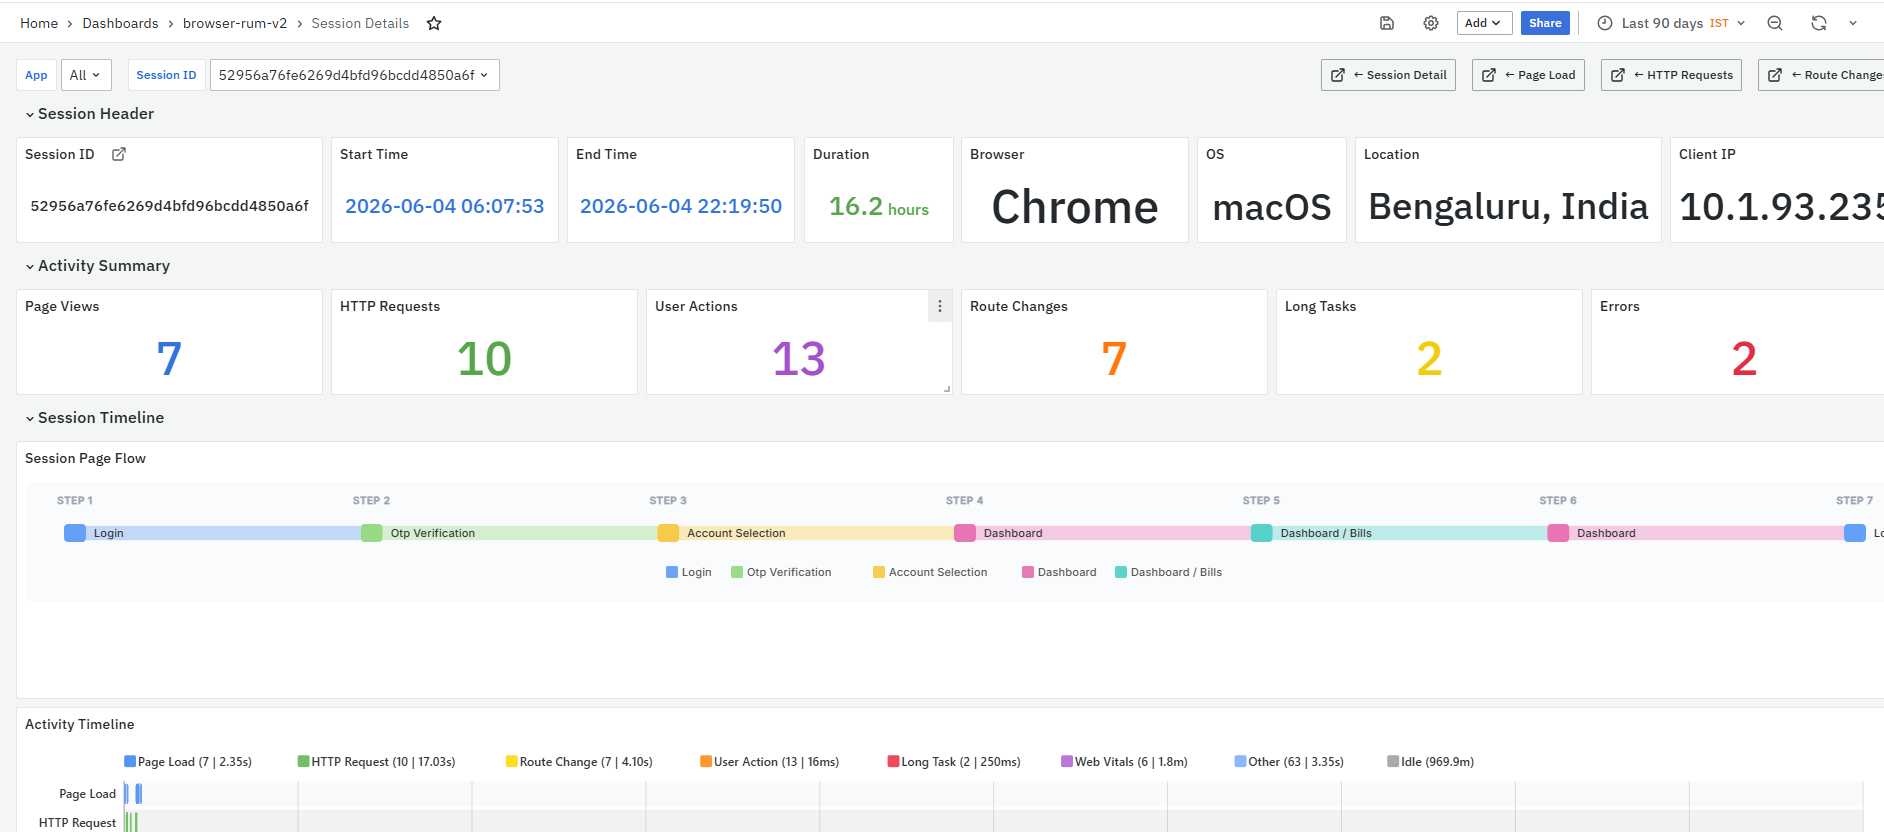
This section includes two panels:
- Latency Distribution
- Context Breakdown
Latency Distribution
The Latency Distribution panel shows how requests are distributed across latency buckets, such as 100–200 ms, 500 ms–1 s, and >1 s. This helps users understand whether most requests are fast or whether many requests are taking longer than expected.
It helps you identify:
-
Number of requests in each latency range
-
Whether most requests are completing quickly or slowly
-
High-latency request groups that need investigation
-
Whether endpoint performance issues affect many requests or only a few outliers
Context Breakdown
The Context Breakdown panel displays the request context distribution for the selected endpoint. It shows whether requests are coming from contexts such as Async or User Interaction.
It helps you identify:
-
Which context contributes most to endpoint usage
-
Whether the endpoint is mostly called in the background
-
Whether the endpoint is triggered during user actions
-
Request behavior across page load, user action, and async contexts
Page Load Details Dashboard
The Page Load Details Dashboard is a dashboard in the Browser Real User Monitoring module. It provides a focused view of a selected page’s browser-side performance, page load behavior, web vitals, errors, resources, HTTP requests, user segments, and related sessions or traces. This dashboard helps users understand why a specific page is slow or degraded. It can be used to analyze page load time, LCP, FCP, TTFB, resource loading, HTTP calls during page load, user environment impact, and session-level page load details.
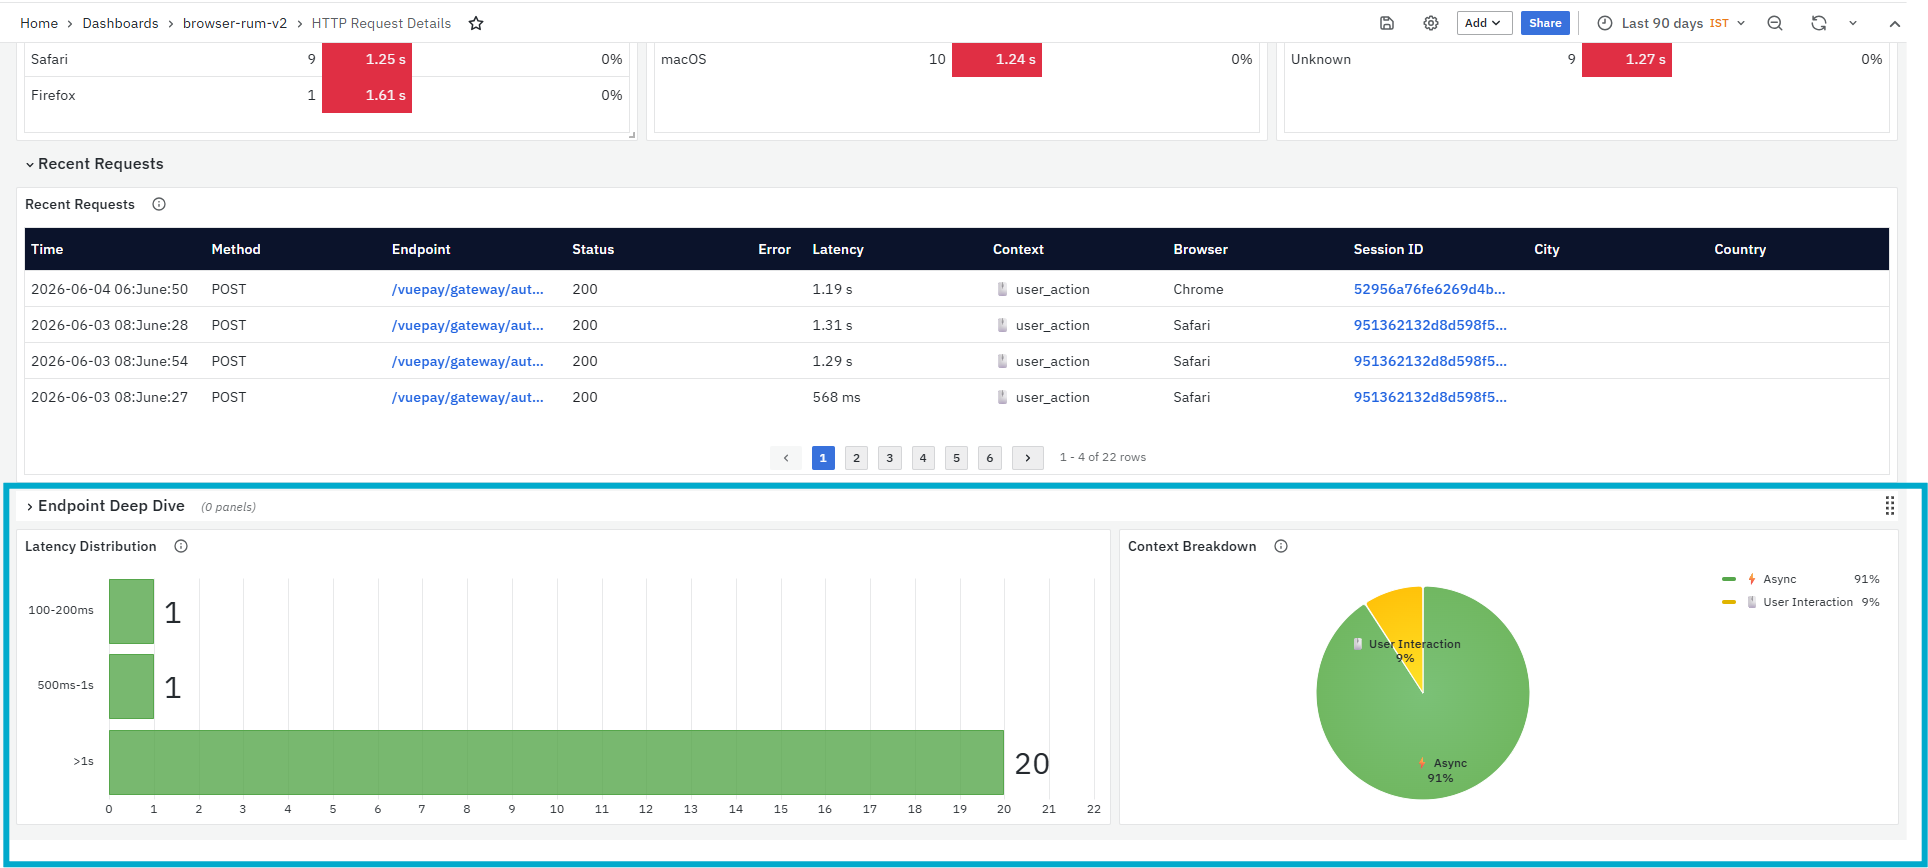
The dashboard is divided into the following sections:
- Page Health Overview
- Core Web Vitals
- Error Analysis
- Page Loading Breakdown
- Resource Loading Analysis
- HTTP Requests
- Page Performance
- User Segments
- Session Drill-Down
Related Dashboards
The Page Load Details dashboard includes related dashboard links at the top-right side of the page.
- App Summary: Opens the App Summary dashboard for the selected application. This dashboard provides a consolidated view of application health, error rate, sessions, page loads, route changes, HTTP requests, core web vitals, activity trends, slowest pages, top endpoints, user agent, and geography details.
- App Detail: Opens the App Details dashboard for deeper application-level analysis. This dashboard helps users investigate app health, impact analysis, errors, performance timeline, HTTP requests, page performance, route changes, web vitals, user segments, geography, sessions, and traces.
Page Health Overview
The Page Health Overview section provides a high-level summary of the selected page’s usage, load performance, error rate, and LCP quality. This section helps users quickly understand whether the page is frequently accessed, whether it loads within the expected time, and whether users are facing errors while loading the page.
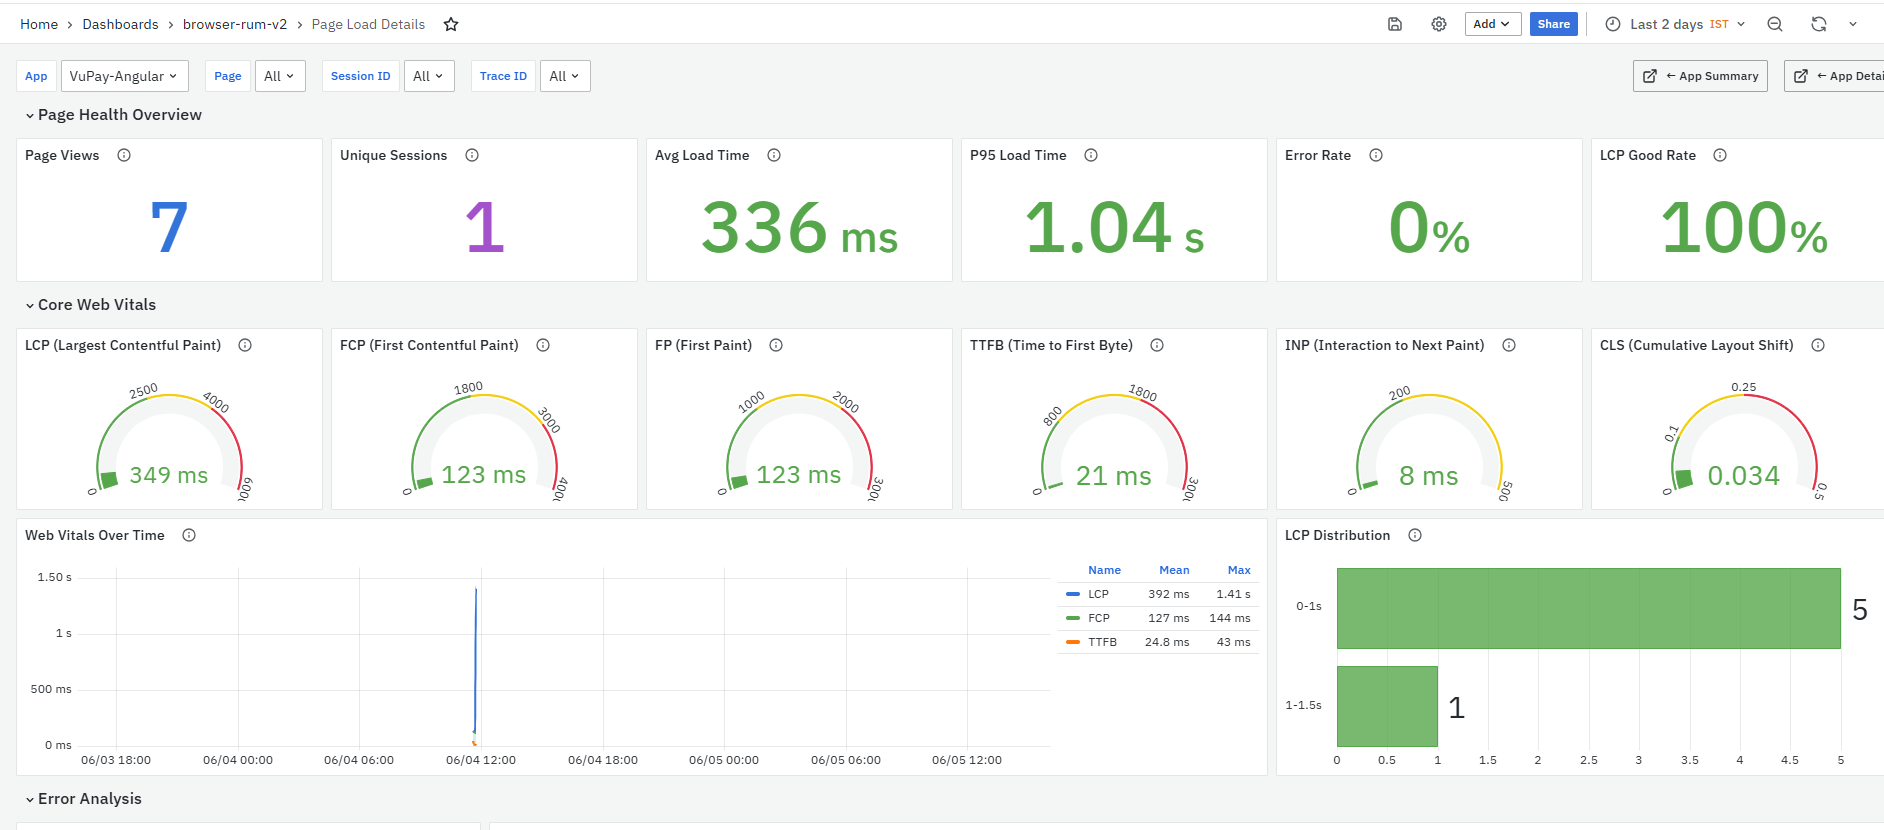
This section includes six panels:
-
Page Views
-
Unique Sessions
-
Avg Load Time
-
P95 Load Time
-
Error Rate
-
LCP Good Rate
Page Views
The Page Views panel displays the total number of page load events for the selected page. A higher value indicates that the page is accessed more frequently by users. This panel is useful when users need to identify popular pages and prioritize optimization based on usage. Page views should be reviewed along with error rate and load time to understand whether a frequently used page is affecting user experience.
Unique Sessions
The Unique Sessions panel displays the number of unique user sessions that visited the selected page. One user may load the same page multiple times in a single session. This panel helps users understand how many distinct sessions were affected by the selected page. Comparing Unique Sessions with Page Views helps identify whether users are repeatedly visiting or reloading the page.
Avg Load Time
The Avg Load Time panel displays the average time taken for the selected page to fully load. Lower values indicate better page load performance. As per the dashboard guidance, load time under 2 seconds is good, 2–4 seconds is acceptable, and above 4 seconds is poor. Pages exceeding 4 seconds should be investigated for backend delays, network issues, heavy resources, or frontend rendering problems.
P95 Load Time
The P95 Load Time panel displays the 95th percentile page load time. This means 95% of page loads completed faster than this value, while the slowest 5% of page loads took longer. This panel helps users identify inconsistent or worst-case page load performance. A target under 4 seconds is preferred, and a high P95 value indicates that some users may be experiencing slower page loads even when the average load time looks acceptable.
Error Rate
The Error Rate panel displays the percentage of page load traces that had errors. This helps users understand whether users are facing failures while loading or using the selected page. As per the dashboard guidance, an error rate under 1% is good, 1–5% is acceptable, and above 5% is poor. Errors above 5% require immediate attention because they may directly affect page availability or user experience.
LCP Good Rate
The LCP Good Rate panel displays the percentage of page loads where LCP is under 2.5 seconds, which is considered Google’s good threshold for Largest Contentful Paint. This panel helps users understand how often the main visible content loads quickly for users. A higher LCP Good Rate indicates better Core Web Vitals compliance and a better page loading experience.
Core Web Vitals
The Core Web Vitals section displays key browser experience metrics for the selected page. This section helps users understand how quickly the page loads, when visual content appears, how fast the server responds, how responsive the page is, and whether the layout remains stable during page load.

This section includes six panels:
- LCP (Largest Contentful Paint)
- FCP (First Contentful Paint)
- FP (First Paint)
- TTFB (Time to First Byte)
- INP (Interaction to Next Paint)
- CLS (Cumulative Layout Shift)
LCP (Largest Contentful Paint)
The LCP panel shows the time taken for the main visible content of the page to become visible. This is an important Core Web Vital because it directly impacts how quickly users feel the page has loaded. As per the dashboard guidance, LCP under 2.5 seconds is good, 2.5–4 seconds needs improvement, and above 4 seconds is poor. A high LCP value indicates that the main content is taking longer to appear and may affect SEO and user experience.
FCP (First Contentful Paint)
The FCP panel shows the time taken for the first text or image to appear on the page. This helps users understand how quickly the browser starts showing meaningful content after page load begins. As per the dashboard guidance, FCP under 1.8 seconds is good, 1.8–3 seconds needs improvement, and above 3 seconds is poor. A high FCP value may indicate slow rendering, delayed resources, or frontend loading issues.
FP (First Paint)
The FP panel shows when the browser first renders any visual change on the screen. This may happen before meaningful content appears and usually comes before FCP. This metric helps users understand when the page first starts giving visual feedback. Lower FP values indicate that users see the page begin loading sooner, improving perceived performance.
TTFB (Time to First Byte)
The TTFB panel shows the time taken by the server to send the first byte of the response. This helps users identify backend, server, or network delays before the page starts loading. As per the dashboard guidance, TTFB under 800 ms is good, 800 ms–1.8 seconds needs improvement, and above 1.8 seconds is poor. A high TTFB value may indicate slow backend response, network delay, or server-side processing issues.
INP (Interaction to Next Paint)
The INP panel shows how quickly the page responds after user interaction. It measures responsiveness for actions such as clicks, taps, or keyboard input. As per the dashboard guidance, INP under 200 ms is good, 200–500 ms needs improvement, and above 500 ms is poor. A high INP value means users may feel that the page is slow or delayed after performing an action.
CLS (Cumulative Layout Shift)
The CLS panel shows how much the page layout shifts during loading or usage. It helps users identify visual instability where page elements move unexpectedly. As per the dashboard guidance, CLS under 0.1 is good, 0.1–0.25 needs improvement, and above 0.25 is poor. A high CLS value can frustrate users because they may accidentally click the wrong element when the layout shifts.
Web Vitals Over Time
The Web Vitals Over Time panel shows the trend of Core Web Vitals across the selected time range. It helps users identify when performance degraded and whether changes in LCP, FCP, or TTFB are related to deployments, traffic spikes, or other events.
LCP Distribution
The LCP Distribution panel shows how page loads are distributed across LCP buckets. It helps users understand whether most page loads are within the good range or whether users are experiencing slower main-content load times.
The distribution follows LCP performance ranges:
- Good: Less than 2.5 seconds
- Needs Improvement: 2.5–4 seconds
- Poor: More than 4 seconds
Error Analysis
The Error Analysis section displays error-related information for the selected page. This section helps users understand whether the page has errors, what type of errors are affecting the page load, and when error spikes occurred during the selected time range.
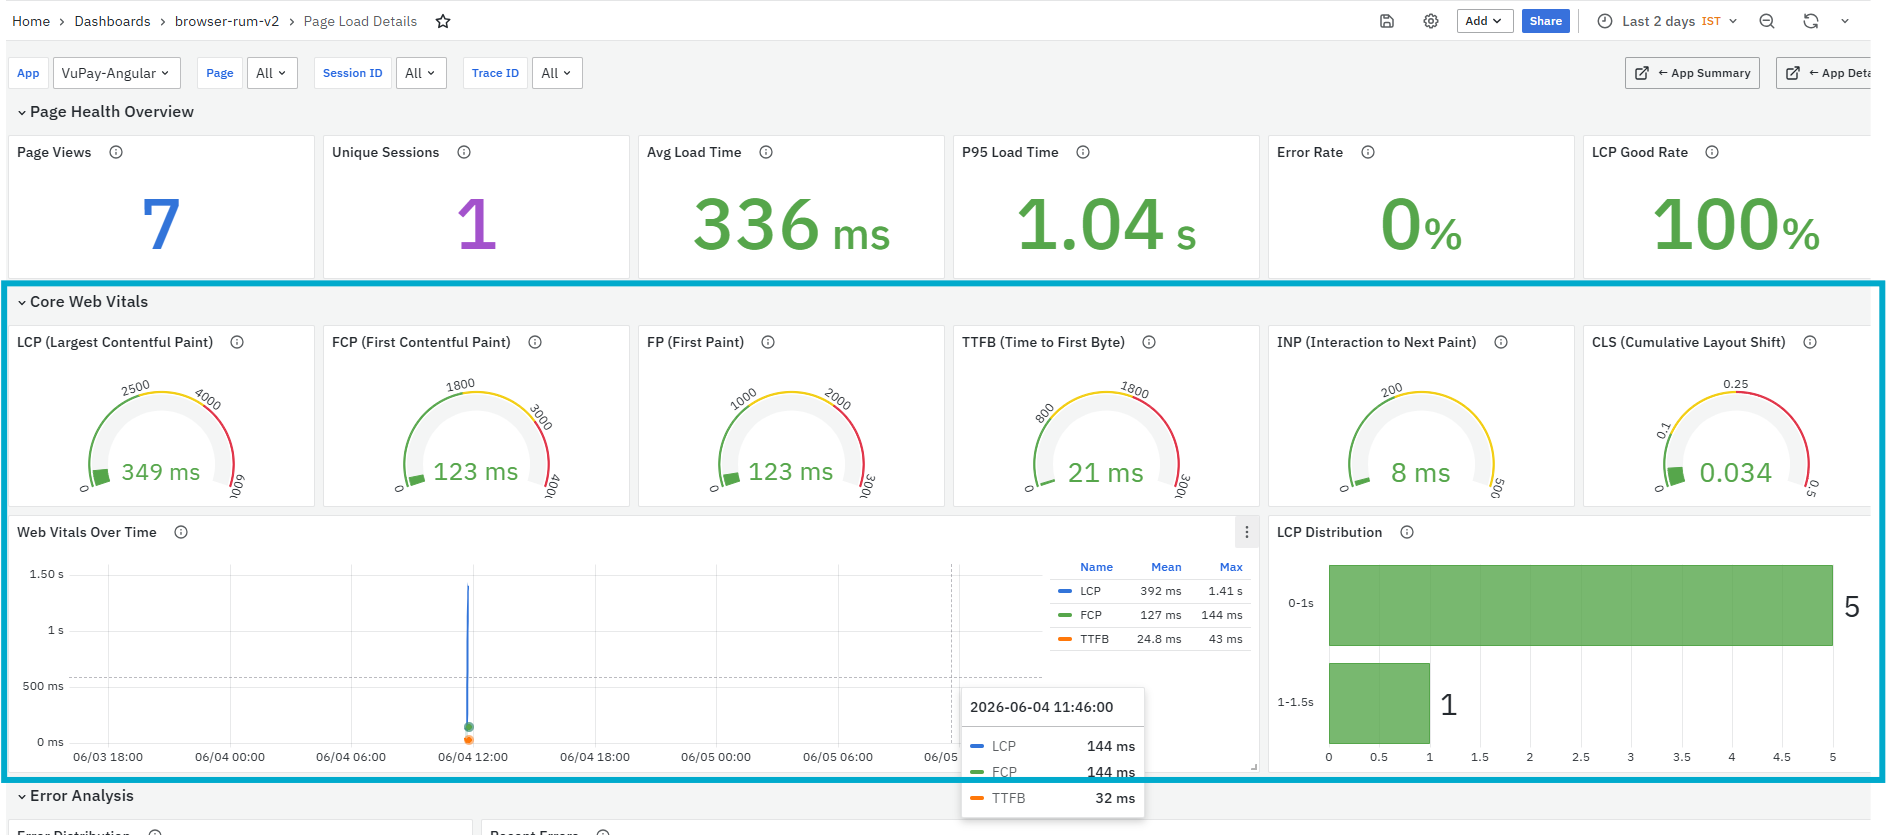
This section includes three panels:
- Error Distribution
- Recent Errors
- Error Rate Over Time
Error Distribution
The Error Distribution panel shows the distribution of errors by category for the selected page. It helps users identify the most common error types affecting the page load experience. This panel is useful when users need to understand whether the page is affected by HTTP errors, JavaScript errors, resource errors, or other browser-side issues. If no matching error data is available for the selected page and time range, the panel displays No data.
Recent Errors
The Recent Errors panel lists the most recent errors captured for the selected page. It shows error messages, trace information, and browser or location context where available. This panel is useful for debugging page-level issues because it helps users move from a general error summary to specific failed events. Users can use the trace information to continue detailed analysis in trace-level views.
Error Rate Over Time
The Error Rate Over Time panel shows how the page error rate changed during the selected time range. It helps users identify error spikes and correlate them with deployments, traffic changes, or external factors. As per the dashboard guidance, sustained error rates above 5% need investigation. This panel is useful when users need to check whether errors are isolated to a short period or consistently affecting the selected page.
Page Load Timing Breakdown
The Page Load Timing Breakdown section shows how the selected page load time is divided across different loading phases. This section helps users understand whether the page delay is caused by network activity, server response, content download, or browser-side processing.
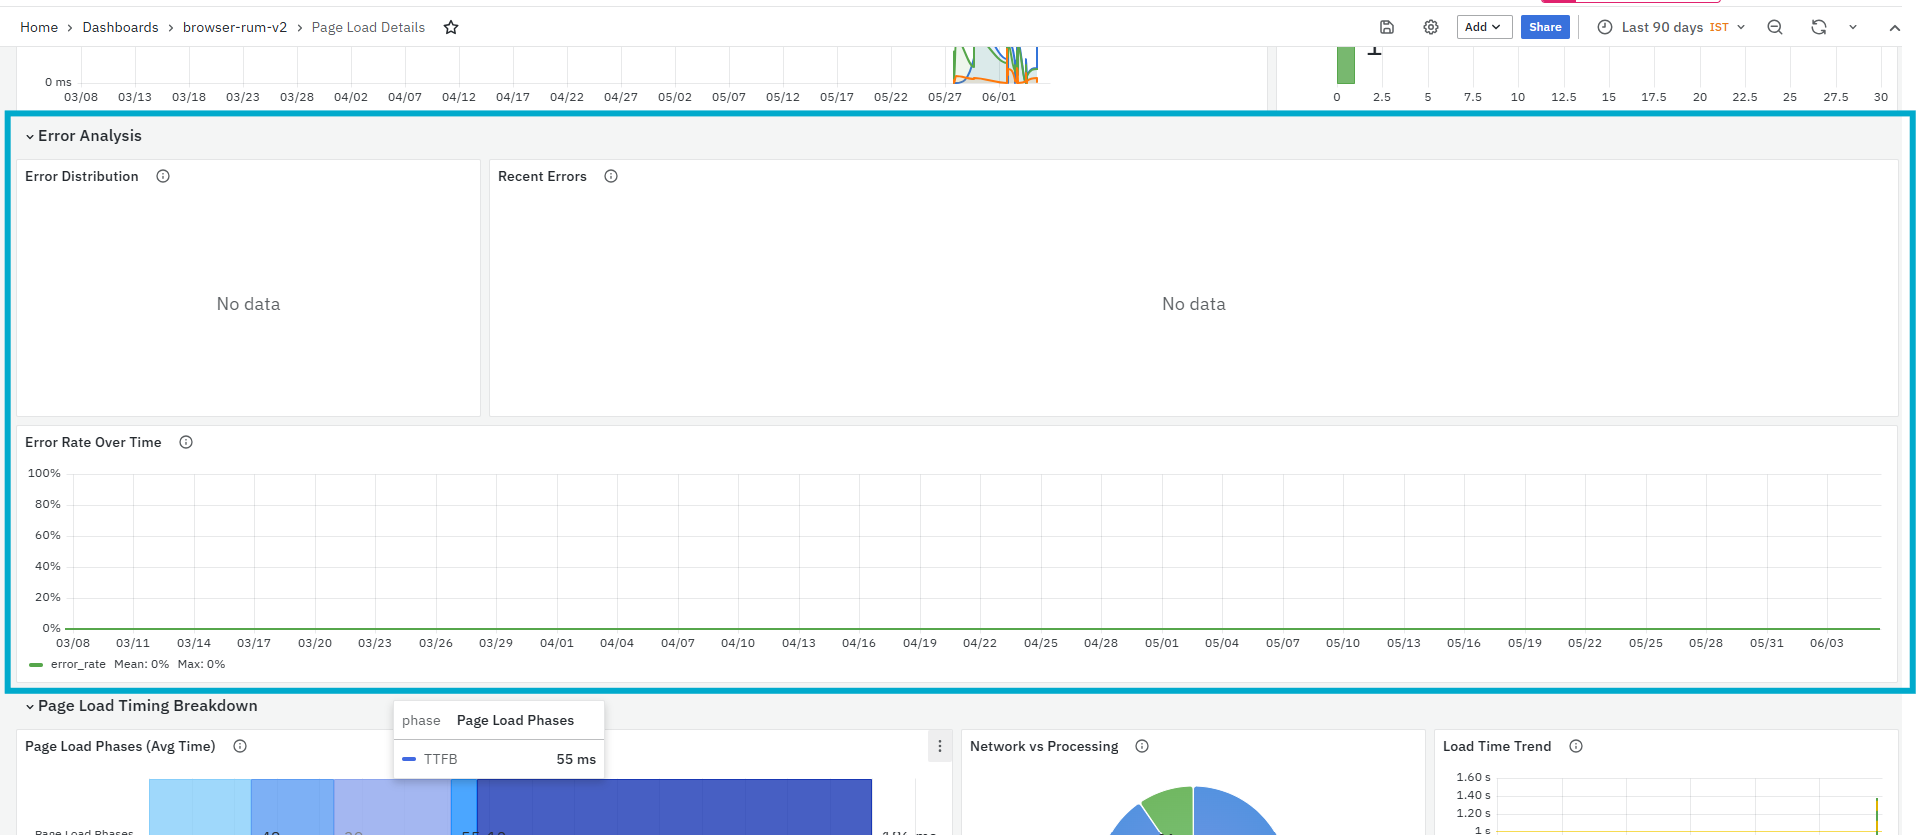
This section includes three panels:
- Page Load Phases (Avg Time)
- Network vs Processing
- Load Time Trend
Page Load Phases (Avg Time)
The Page Load Phases (Avg Time) panel shows the average time spent in each phase of the page load. It breaks the total page load time into phases such as DNS Lookup, TCP Connect, TTFB, Content Download, and DOM Processing.
It helps you identify:
-
Which page load phase is taking the most time
-
Whether delay is caused by DNS, connection, server response, download, or browser processing
-
The longest phase that should be prioritized for optimization
-
Page load bottlenecks affecting the selected page
Network vs Processing
The Network vs Processing panel shows the distribution of time between network-related activity and client-side processing. Network time includes activities such as DNS, TCP, request, and response, while processing time includes browser parsing and rendering.
It helps you identify:
-
Whether the page delay is mainly caused by network time or browser processing
-
Whether CDN, backend, or connectivity issues may be contributing to slow loading
-
Whether frontend rendering or client-side processing needs optimization
-
Which area should be investigated first
Load Time Trend
The Load Time Trend panel shows how page load time changes over the selected time range. It displays average and P95 load time trends, helping users identify spikes or repeated slow periods.
It helps you identify:
-
Page load spikes over time
-
Whether slow loading is temporary or recurring
-
Time periods where page performance degraded
-
Possible correlation with deployments, traffic surges, or infrastructure issues
Resource Loading Analysis
The Resource Loading Analysis section displays how page resources are loaded for the selected page. This section helps users understand whether images, JavaScript, fonts, CSS, documents, or other resources are contributing to page load delay.

This section includes two panels:
- Resource Category Breakdown
- Top 10 Slowest Resources
Resource Category Breakdown
The Resource Category Breakdown panel shows resource loading details grouped by category. It displays the number of resources, average load time, maximum load time, and percentage contribution to the total resource load time. This panel is primarily used to identify which resource type has the highest impact on page load performance.
It helps you identify:
-
Resource categories with high load count
-
Categories with high average load time
-
Categories with high maximum load time
-
Resource types contributing most to total page load time
-
Areas where optimization should be prioritized
The panel includes the following columns:
-
Category: Displays the resource category, such as Images, Document, Fonts, CSS, Long Tasks, or Other.
-
Count: Displays the number of resources loaded under that category.
-
Avg: Displays the average load time for resources in that category.
-
Max: Displays the maximum load time recorded for that category.
-
% of Total: Displays the category’s contribution to the total resource load time.
Top 10 Slowest Resources
The Top 10 Slowest Resources panel lists the individual resources with the highest average load time. It helps users identify specific files or resources that may be delaying the selected page load. This panel is primarily used to find exact resources that need optimization.
It helps you identify:
- Slow JavaScript files
- Slow image resources
- Slow font files
- Resources with high average load time
- Resources with high maximum load time
- Files that may need lazy loading, compression, caching, or CDN optimization
The panel includes the following columns:
- Resource: Displays the resource path or file name.
- Type: Displays the resource type, such as JS, Font, Img, or Other.
- Loads: Displays how many times the resource was loaded.
- Avg: Displays the average load time for the resource.
- Max: Displays the maximum load time recorded for the resource.
HTTP Requests
The HTTP Requests section displays the HTTP/API requests made during the selected page load. This section helps users understand whether API calls triggered during page loading are contributing to slow page performance, failed requests, or delayed user experience.
This section includes one panel:
- HTTP Requests During Page Load
HTTP Requests During Page Load
The HTTP Requests During Page Load panel lists the HTTP requests captured during the selected page load. It shows request timing, response status, and parent context, where data is available.
This panel is primarily used to identify API calls that occur while the page is loading and understand whether any request is slow or failing.
It helps you identify:
-
HTTP/API requests made during page load
-
Request timing and response behavior
-
Failed or slow requests affecting page load
-
Parent context associated with the request
-
APIs that need endpoint-level investigation
Page Performance
The Page Performance section compares the selected page’s performance against service-wide averages, other pages, percentile load times, and the previous equivalent time period. This section helps users understand whether the selected page is performing normally, slower than expected, or showing signs of degradation.

This section includes four panels:
- This Page vs Service Average
- Page Performance Ranking (Fastest to Slowest)
- Load Time Percentiles
- Performance vs Last Period
This Page vs Service Average
The This Page vs Service Average panel compares the selected page’s metrics with the overall service average. It helps users understand whether the page is performing better, worse, or the same compared to the application average.
This panel is useful when users need to prioritize pages that are performing worse than the service average.
The panel includes the following columns:
● Metric: Displays the metric being compared, such as Error Rate, LCP, FCP, or Load Time.
● This Page: Displays the metric value for the selected page.
● Service Avg: Displays the average value for the service.
● Delta: Displays the difference between this page and the service average.
● Status: Displays whether the page is better, worse, or the same compared to the service average.
Page Performance Ranking (Fastest to Slowest)
The Page Performance Ranking (Fastest to Slowest) panel ranks all pages based on average load time. It helps users identify which pages are consistently fast and which pages are slow. This panel is useful when users need to compare the selected page with other pages and decide whether it should be prioritized for optimization.
The panel includes the following columns:
- #: Displays the rank of the page.
- Page: Displays the page or route name.
- Views: Displays the number of times the page was viewed.
- Load: Displays the average load time for the page.
Load Time Percentiles
The Load Time Percentiles panel displays page load time distribution across percentile values such as P50, P75, P90, and P95. This helps users understand whether page performance is consistent or whether some users are facing slower load times.
This panel is useful when users need to identify inconsistent user experience. A large gap between lower and higher percentiles indicates that some page loads are significantly slower than others.
Performance vs Last Period
The Performance vs Last Period panel compares the selected page’s current performance with the previous equivalent period. It helps users identify whether page performance has improved, degraded, or remained the same. This panel is useful when users need to detect performance regressions after deployments, traffic changes, or infrastructure updates.
The panel includes the following columns:
- metric: Displays the metric being compared, such as LCP, TTFB, Load Time, FCP, or Error Rate.
- current: Displays the value for the selected time range.
- previous: Displays the value from the previous equivalent period.
- Change %: Displays the percentage change between current and previous values.
- status: Displays whether the metric is better, worse, or the same.
User Segments
The User Segments section displays page performance grouped by browser, operating system, geography, and device type. This section helps users identify whether the selected page performs differently for specific browsers, OS types, locations, or devices.

This section includes five panels:
- By Browser
- By Operating System
- By Geography
- User Location Map
- By Device Type
By Browser
The By Browser panel shows page performance grouped by browser. It helps users identify browser-specific performance issues and compare page load behavior across browsers such as Chrome, Safari, and Firefox. This panel is useful when users need to focus on browsers with high sessions but poor performance.
The panel includes the following columns:
- Browser: Displays the browser used by users.
- n_sessions: Displays the number of sessions recorded for that browser.
- %: Displays the percentage contribution of that browser to total sessions.
- m_avg_ms: Displays the average page load time for that browser.
- m_lcp_ms: Displays the LCP value for that browser.
By Operating System
The By Operating System panel shows page performance grouped by operating system. It helps users understand whether the selected page behaves differently on operating systems such as macOS or Linux. This panel is useful when users need to identify OS-specific performance patterns. Desktop and mobile operating systems may have different performance profiles, so OS groups with high sessions and poor metrics should be reviewed first.
The panel includes the following columns:
- OS: Displays the operating system used by users.
- n_sessions: Displays the number of sessions recorded for that OS.
- %: Displays the percentage contribution of that OS to total sessions.
- m_avg_ms: Displays the average page load time for that OS.
- m_lcp_ms: Displays the LCP value for that OS.
By Geography
The By Geography panel shows page performance by user location. It helps users identify whether users from specific cities or regions are experiencing slower page loads. This panel is useful when users need to check location-based performance issues. High-latency regions may require CDN optimization, network review, or backend routing analysis.
The panel includes the following columns:
● location: Displays the user location, such as city and country.
● n_sessions: Displays the number of sessions from that location.
● pct: Displays the percentage contribution of that location to total sessions.
● m_avg_ms: Displays the average page load time for that location.
User Location Map
The User Location Map panel displays the geographic distribution of page loads on a map. Larger circles indicate more sessions from a location, and the color indicates average load time. This panel helps users visually identify where page traffic is coming from and whether any location shows slower performance. Green indicates faster load time, while red indicates slower load time. This panel is useful when users need a quick geographic view of page performance and session concentration.
By Device Type
The By Device Type panel shows page performance grouped by device type, such as Desktop, Mobile, or Tablet. It helps users understand whether the selected page performs differently across device categories. This panel is useful when users need to identify device-specific performance issues. Mobile devices may show different performance characteristics due to network and processing constraints.
The panel includes the following columns:
- device: Displays the device type.
- sessions: Displays the number of sessions from that device type.
- % Sessions: Displays the percentage contribution of that device type to total sessions.
- Avg Load (ms): Displays the average page load time for the device type.
- LCP (ms): Displays the LCP value for the device type.
Session Drill-Down
The Session Drill-Down section lists individual page load records for the selected page. This section helps users move from page-level performance metrics to specific sessions and traces where the page was loaded.

This section includes one panel:
- Recent Page Loads
Recent Page Loads
The Recent Page Loads panel displays individual page load instances with key performance metrics. It shows the actual load time, LCP, FCP, error count, browser, location, session, and trace associated with each page load. This panel is primarily used to investigate specific page load events and identify which session or trace should be reviewed further.
It helps you identify:
- Recent page load events for the selected page
- Page loads with high load time
- Page loads with poor LCP or FCP values
- Page loads where errors occurred
- Browser and location context for each page load
- Sessions and traces linked to individual page load events
The panel includes the following columns:
- Time: Displays when the page load occurred.
- Session: Displays the session associated with the page load. The Session value is clickable. When clicked, it opens the Session Details dashboard for the selected session.

- The Session Details dashboard provides a detailed view of the selected user session. It shows session summary, activity timeline, page views, HTTP requests, user interactions, route changes, long tasks, errors, network timing, and complete event timeline. For more details refer to Session Details.
- Load: Displays the total page load time for that page load instance.
- LCP: Displays the Largest Contentful Paint value for the page load.
- FCP: Displays the First Contentful Paint value for the page load.
- Err: Displays the number of errors captured during the page load. A value of 0 means no error was captured for that page load.
- Browser: Displays the browser used during the page load, such as Chrome.
- Location: Displays the user location associated with the page load, where available.
- Trace ID: Displays the trace associated with the page load.When clicked, it opens the TraceMap Waterfall dashboard for the selected trace.

- The TraceMap Waterfall dashboard provides a detailed waterfall view of the selected trace. It shows trace summary, environment details, service time distribution, span sequence, duration, and resource timing. For more details refer to Tracemap Waterfall.
Trace Waterfall
The Trace Waterfall section displays the resource-level execution flow for the selected page load. This section helps users understand the order in which resources were loaded, how long each resource took, and which session or trace should be reviewed for deeper page-load analysis.
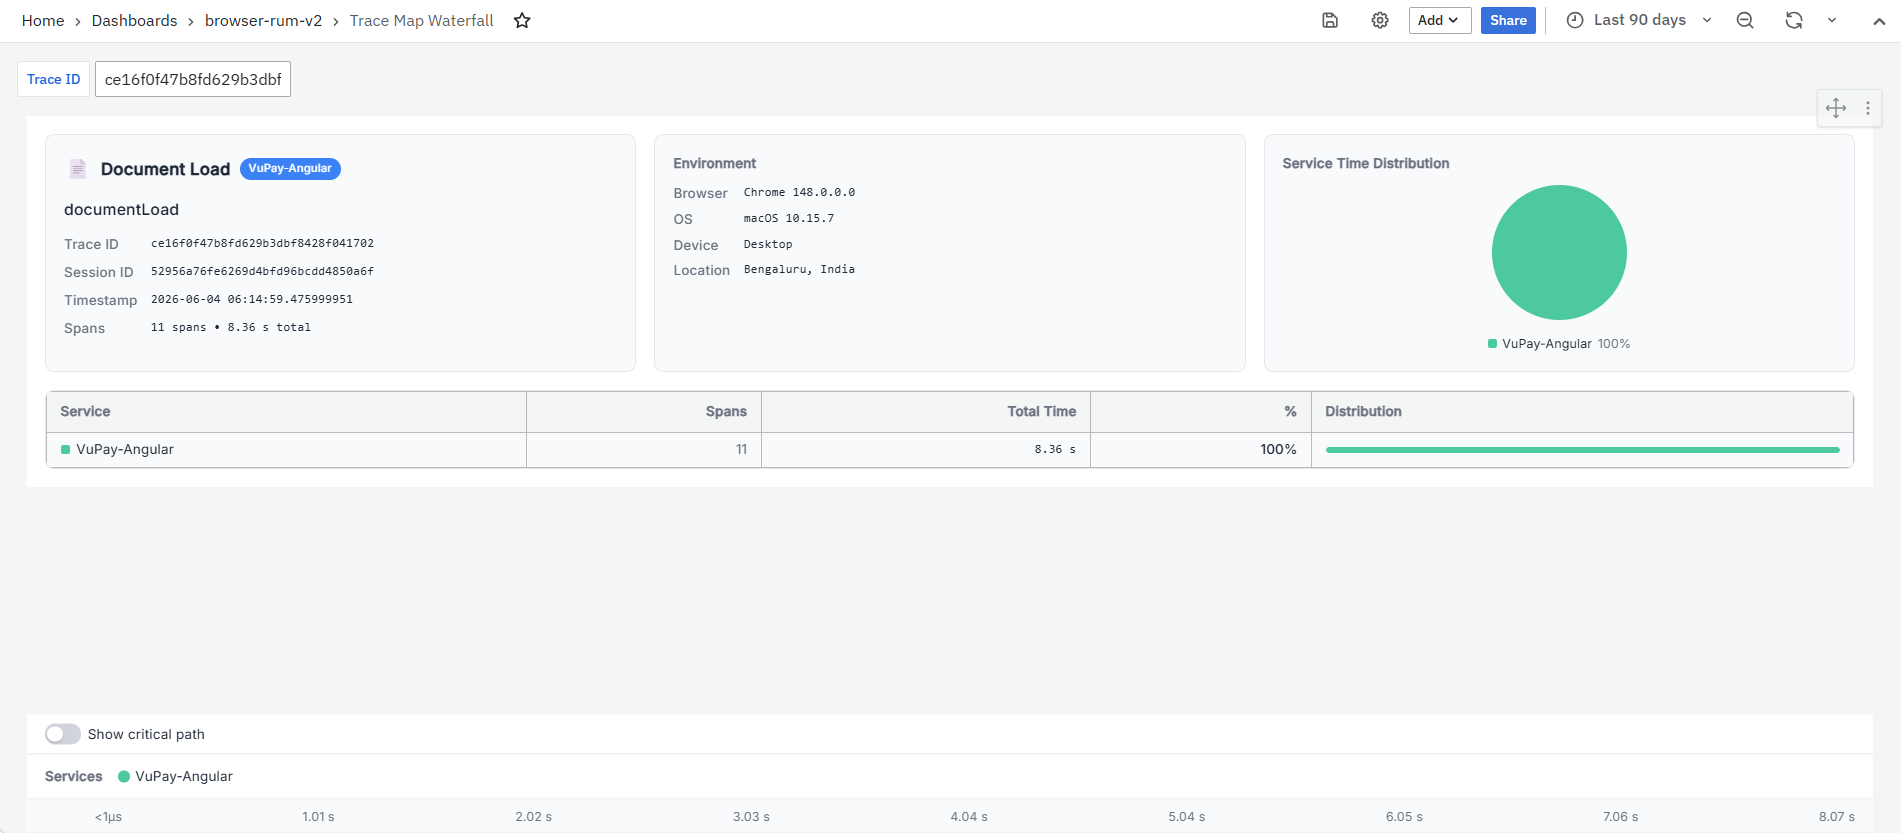
This section includes two panels:
- Trace Waterfall (Most Recent Successful Page Load)
- Page Load Sessions & Traces
Trace Waterfall (Most Recent Successful Page Load)
The Trace Waterfall panel shows the resource waterfall for the most recent successful page load. It displays the timing sequence of documents, scripts, styles, fonts, images, and other resources loaded during the page load. This panel is useful when users need to identify which resource or operation consumed the most time during page loading.
It helps you identify:
- Resource loading sequence during the page load
- Slow JavaScript, CSS, font, image, or document resources
- Resource start time and duration
- Resources contributing to page load delay
- Optimization areas such as caching, compression, CDN, or lazy loading
The panel includes the following columns:
- Start (HH:MM:SS.ns): Displays the timestamp when the resource or span started.
- Span: Displays the span or operation name, such as resourceFetch or documentLoad.
- Type: Displays the resource type, such as JS, Font, CSS, Fetch, or Document.
- Start: Displays the relative start time of the resource within the page load timeline.
- Duration: Displays how long the resource or span took to complete.
- Timeline: Displays a visual bar showing when the resource started and how long it took.
- Resource URL: Displays the resource path or URL loaded during the page load.
Page Load Sessions & Traces
The Page Load Sessions & Traces panel provides a detailed list of page load records with their associated session and trace IDs. This panel helps users move from page-level analysis to a specific user journey or trace-level investigation.

It helps you identify:
- Page load records linked to specific sessions
- Trace IDs associated with each page load instance
- Load time, LCP, FCP, and TTFB for each page load
- Errors captured during the page load
- Browser and location context for each record
The panel includes the following columns:
- time: Displays when the page load occurred.
- session_id: Displays the session associated with the page load. The session_id value is clickable. When clicked, a context menu is displayed with the following options:
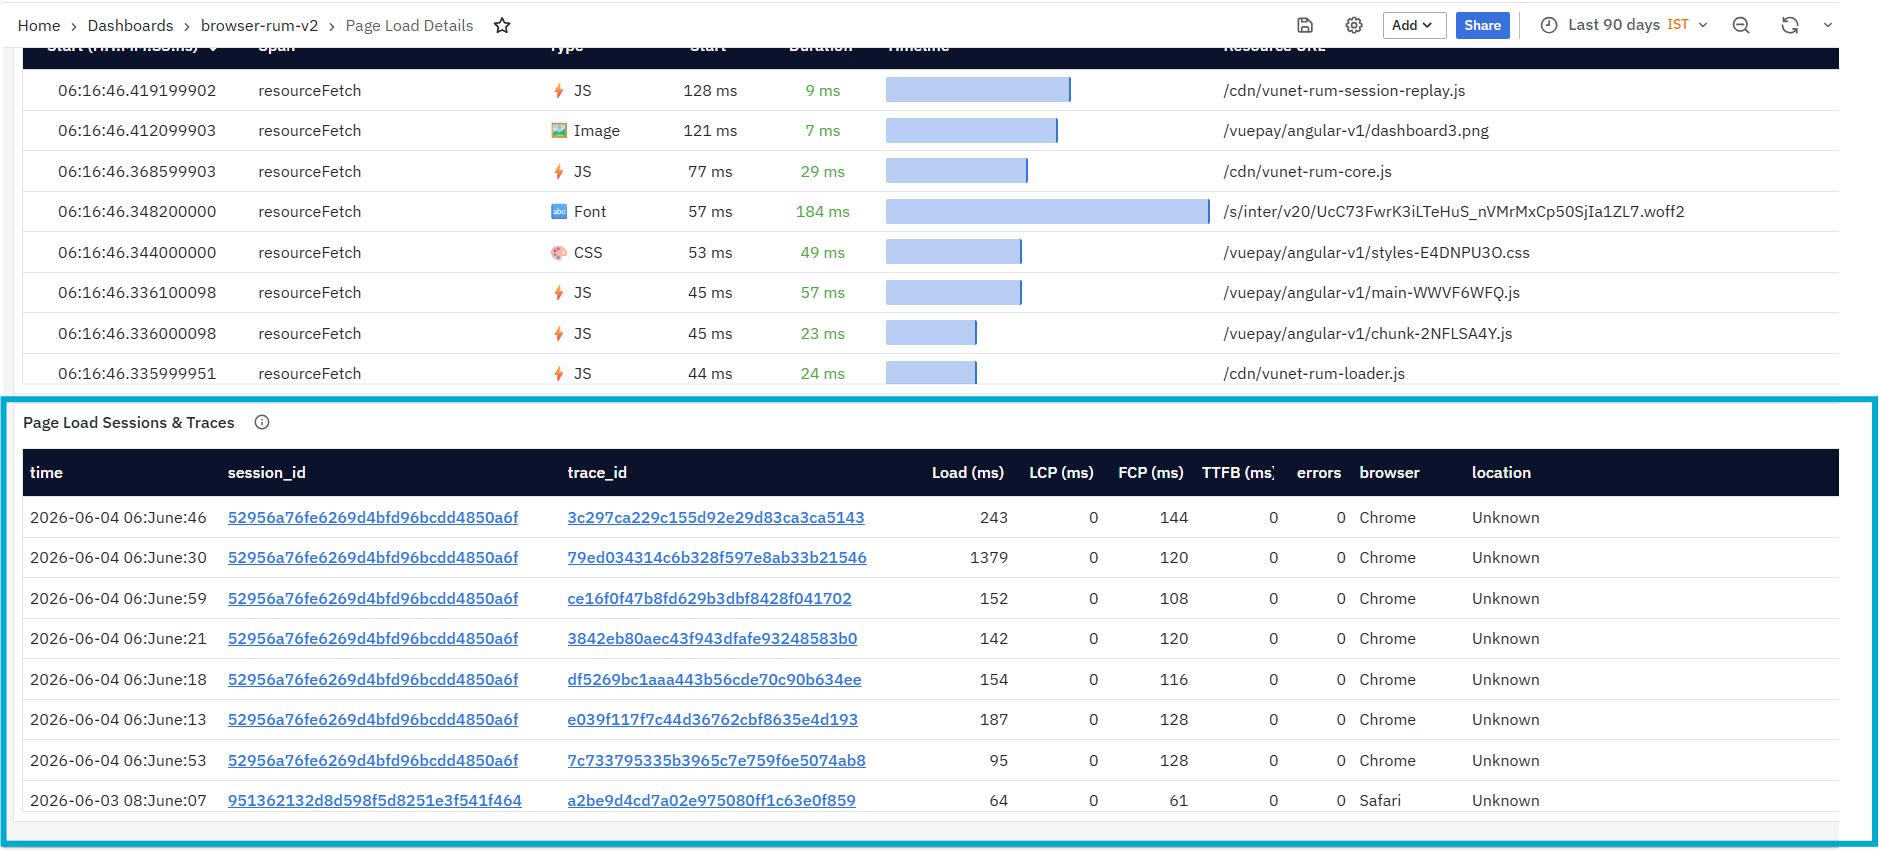
- Filter by Session: Filters the dashboard data based on the selected session and shows the related page load details for that session.
- Session Detail: Opens the Session Details dashboard for the selected session.

-
The Session Details dashboard provides a detailed view of the selected user session. It shows session summary, activity timeline, page views, HTTP requests, user interactions, route changes, long tasks, errors, network timing, and complete event timeline. This helps users understand the full user journey and investigate what happened during that session. For more details, refer to Session Details.
-
trace_id: Displays the trace associated with the page load. The trace_id value is clickable. When clicked, a context menu is displayed with the following options:
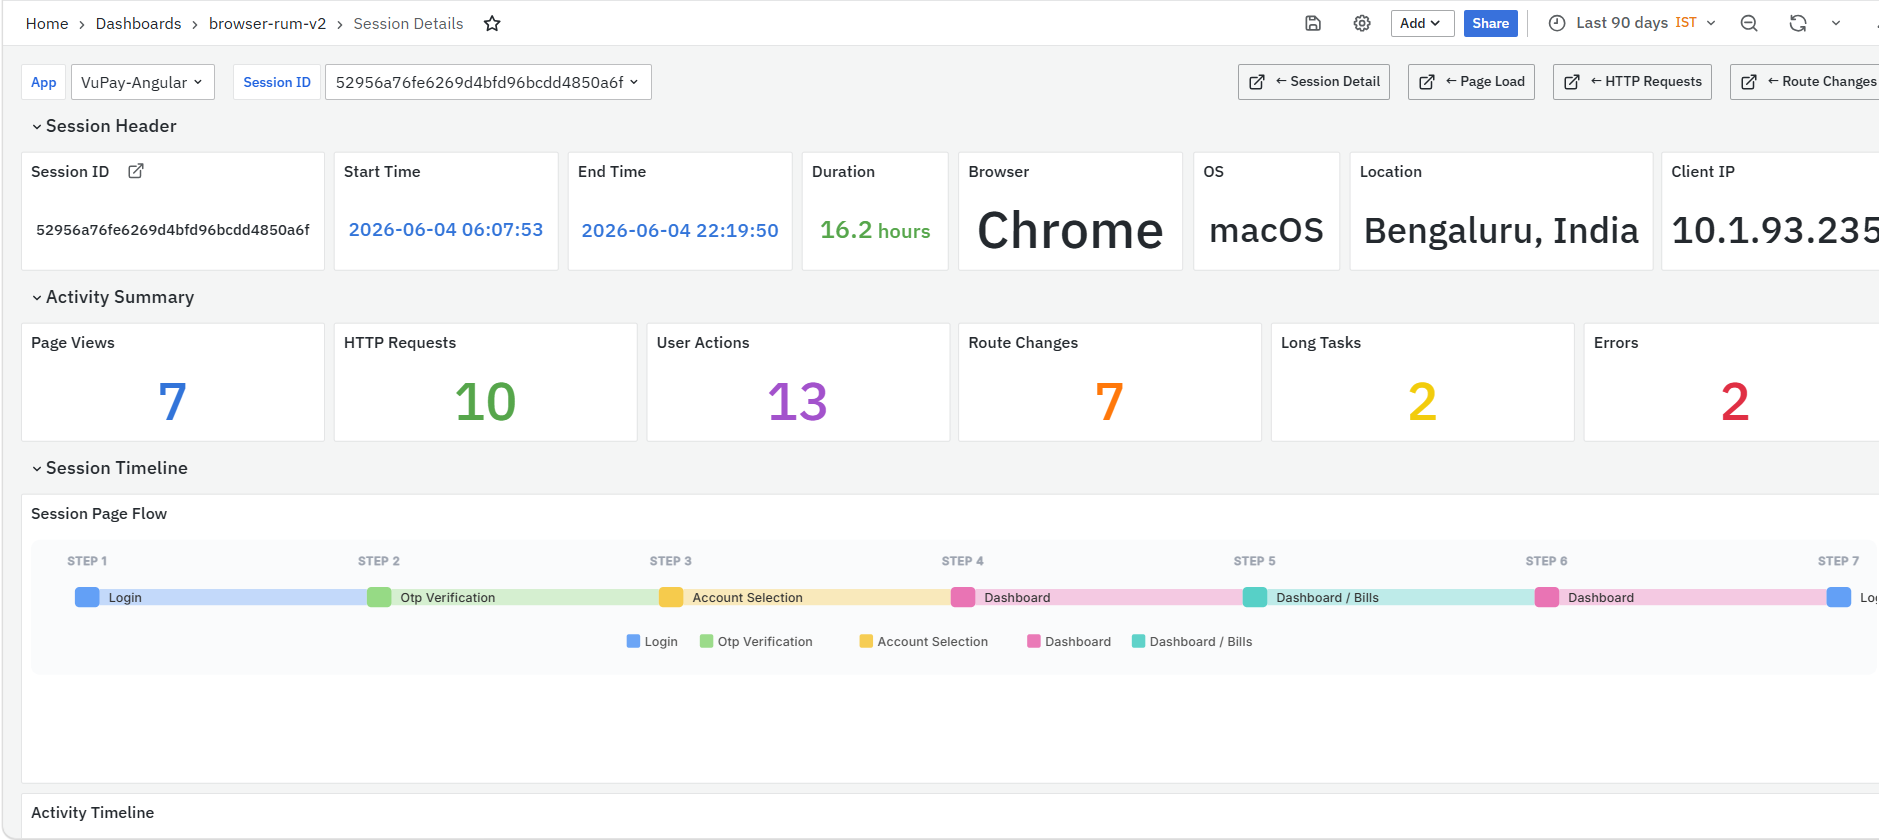
- Filter by Trace: Filters the dashboard data based on the selected trace and shows the related page load details for that trace.
- View Trace Map: Opens the TraceMap Waterfall dashboard for the selected trace.
-
The TraceMap Waterfall dashboard provides a detailed waterfall view of the selected trace. It shows trace summary, environment details, service time distribution, span sequence, span duration, and timing flow. For more details, refer to TraceMap Waterfall.
-
Load (ms): Displays the total page load time.
-
LCP (ms): Displays the Largest Contentful Paint value.
-
FCP (ms): Displays the First Contentful Paint value.
-
TTFB (ms): Displays the Time to First Byte value.
-
errors: Displays the number of errors captured during the page load.
-
browser: Displays the browser used during the page load.
-
location: Displays the user location, where available.
Route Change Details Dashboard
The Route Change Details Dashboard is a dashboard in the Browser Real User Monitoring module. It provides a detailed view of a selected Single Page Application route change. This dashboard helps users understand how a route is performing, how frequently users navigate to it, how long the navigation takes, whether XHR/API calls are contributing to delay, and whether any errors are occurring during route changes.

The dashboard is divided into the following sections:
- Key Metrics
- Timing Breakdown
- Performance Trends
- HTTP Requests
- Navigation Flow
- User Segments
At the top of the dashboard, users can apply filters to narrow down the displayed data.
Related Dashboard
The Route Change Details dashboard includes related dashboard links at the top-right side of the page.
- App Summary: Opens the App Summary dashboard for the selected application. This helps users return to the overall application-level summary and review health, traffic, errors, web vitals, top routes, top endpoints, and user segments.
- App Detail: Opens the App Details dashboard for deeper application-level analysis. This helps users review route performance along with app health, impact analysis, performance timeline, HTTP requests, page performance, sessions, and traces.
Key Metrics
The Key Metrics section provides a quick summary of route navigation volume, average duration, P95 duration, and error rate. This section helps users understand whether the selected route is frequently used, whether navigation is slow, and whether users are facing errors.
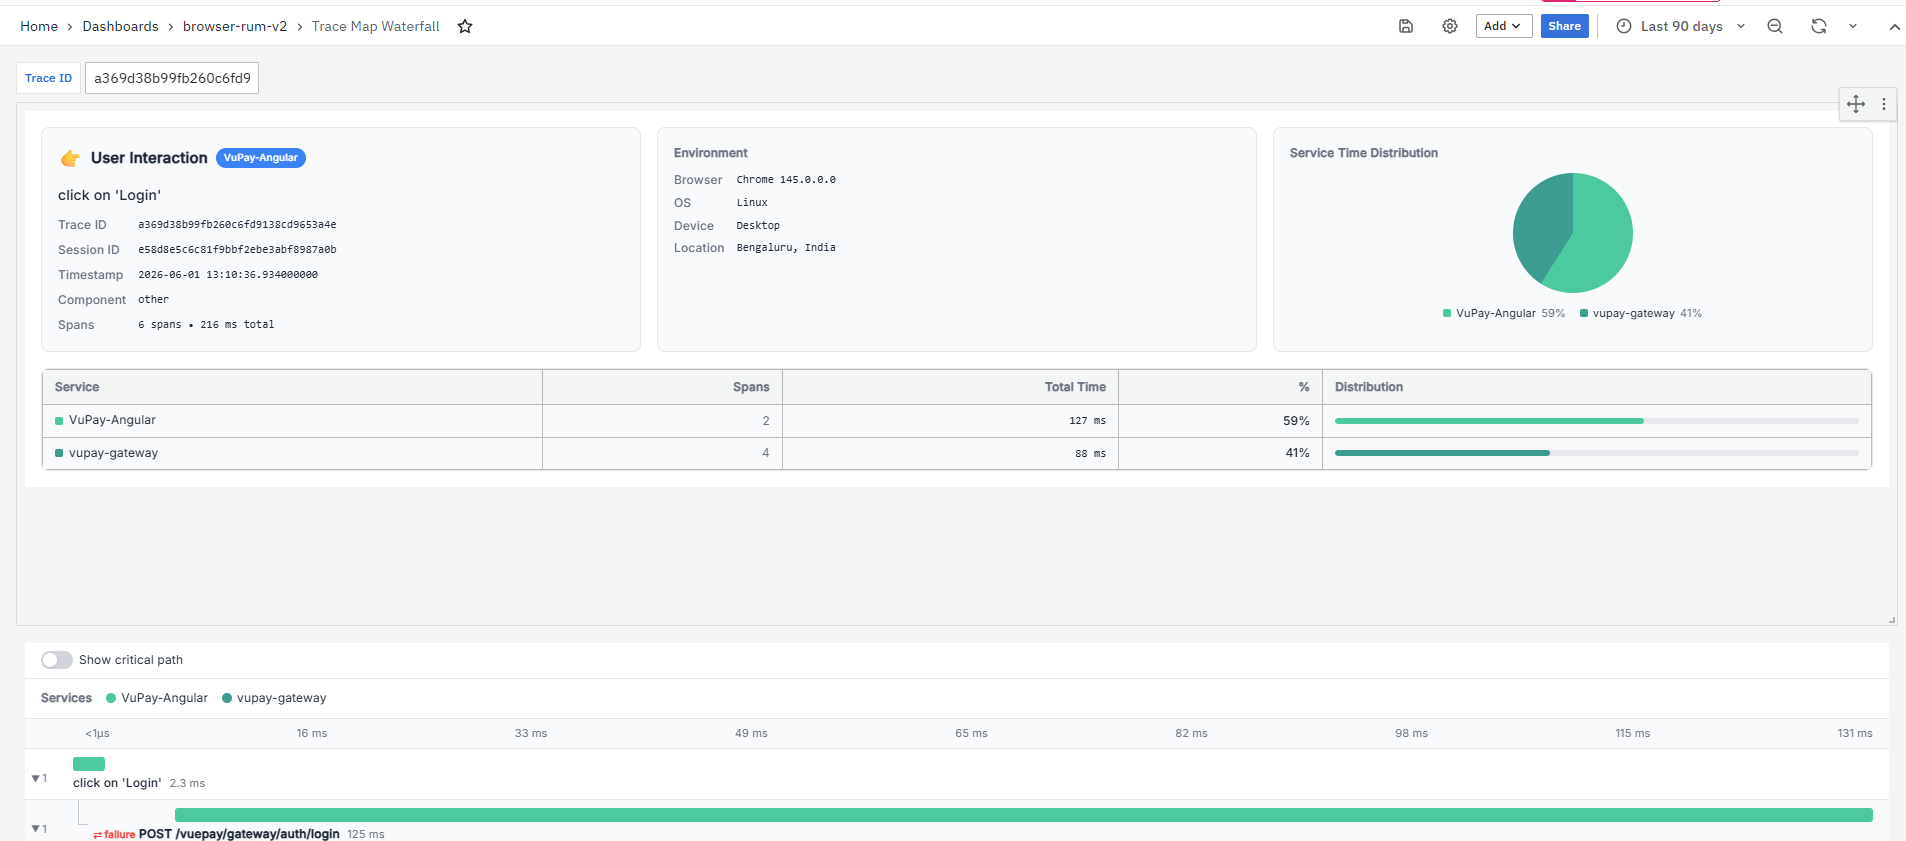
This section includes four panels:
- Total Navigations
- Avg Duration
- P95 Duration
- Error Rate
Total Navigations
The Total Navigations panel displays the total number of route changes recorded for the selected route during the selected time range. A higher value indicates that the route is frequently accessed by users.
This panel is useful when users need to understand how important the route is based on usage volume. Frequently accessed routes with high latency or errors should be prioritized for investigation.
Avg Duration
The Avg Duration panel displays the average time taken to complete the selected route change. Lower values indicate faster navigation, while higher values indicate that users may be waiting longer while moving to this route.
This panel helps users identify whether the route change is performing within acceptable limits. High average duration may indicate slow frontend processing, delayed route rendering, or API/XHR delays.
P95 Duration
The P95 Duration panel displays the 95th percentile route change duration. This means 95% of route changes completed faster than this value, while the slowest 5% took longer.
This panel is useful for identifying worst-case navigation performance. A high P95 duration may indicate that some users are experiencing slower route transitions even when the average duration looks acceptable.
Error Rate
The Error Rate panel displays the percentage of route changes that resulted in errors. A value of 0% indicates that no route change errors were observed for the selected route and time range.
This panel helps users understand whether users are facing failures during route navigation. A higher error rate indicates that route-level failures should be investigated immediately.
Timing Breakdown
The Timing Breakdown section shows how the selected route change time is distributed across navigation execution and XHR/API activity. This section helps users understand whether route delay is caused by JavaScript execution, delayed API calls, or time spent waiting for XHR/API responses.
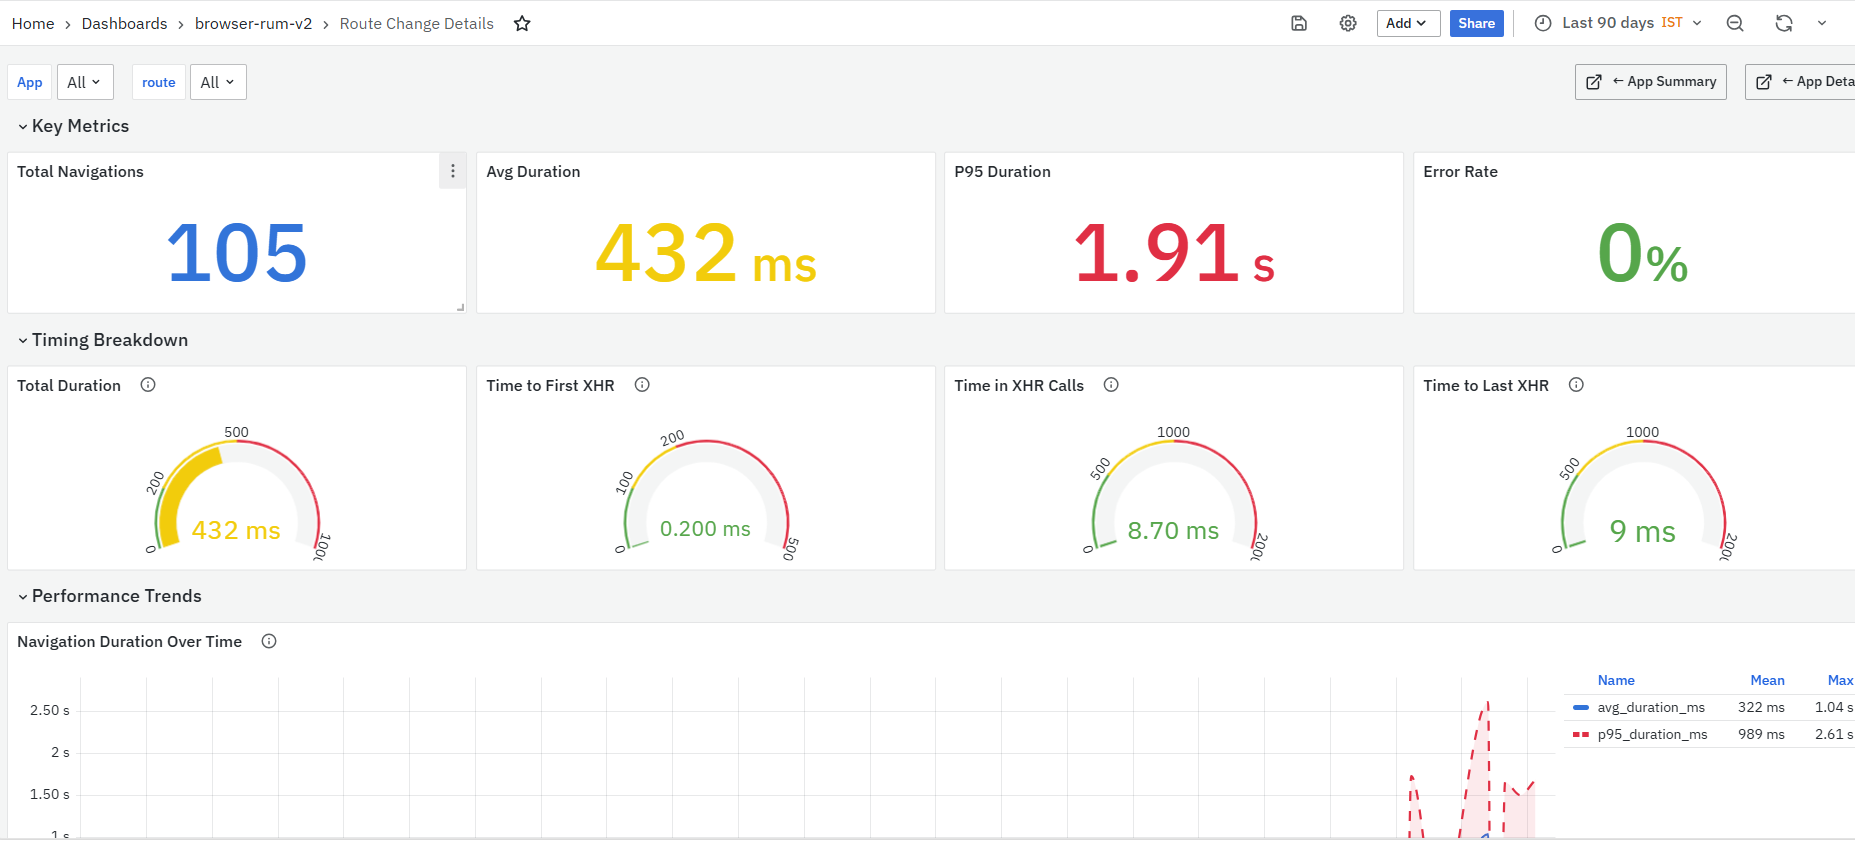
This section includes four panels:
- Total Duration
- Time to First XHR
- Time in XHR Calls
- Time to Last XHR
Total Duration
The Total Duration panel displays the total time taken for the navigation to complete. This includes the JavaScript execution time required to complete the route change.
This panel helps users understand the overall route transition duration. If this value is high, users should review XHR timing, route rendering logic, and related HTTP requests to identify the delay.
Time to First XHR
The Time to First XHR panel displays the time taken until the first XHR/API call starts after the route change begins. This panel helps users understand how quickly the application starts fetching data for the selected route. A high value may indicate delay in route initialization, JavaScript execution, or frontend logic before API calls are triggered.
Time in XHR Calls
The Time in XHR Calls panel displays the total time spent waiting for XHR/API calls during the route change. This includes network and server response time. This panel helps users identify whether backend/API calls are contributing to route delay. If this value is high, users should review the HTTP Requests section to identify slow or failing endpoints.
Time to Last XHR
The Time to Last XHR panel displays the time taken until the last XHR/API call completes during the route change. This panel helps users understand how long API activity continues after navigation starts. A high value may indicate that the route depends on delayed API responses or that background API calls are extending the route completion time.
Performance Trends
The Performance Trends section shows how route navigation duration changes over time. This section helps users identify route performance spikes, recurring slowdowns, and periods where route navigation degraded.
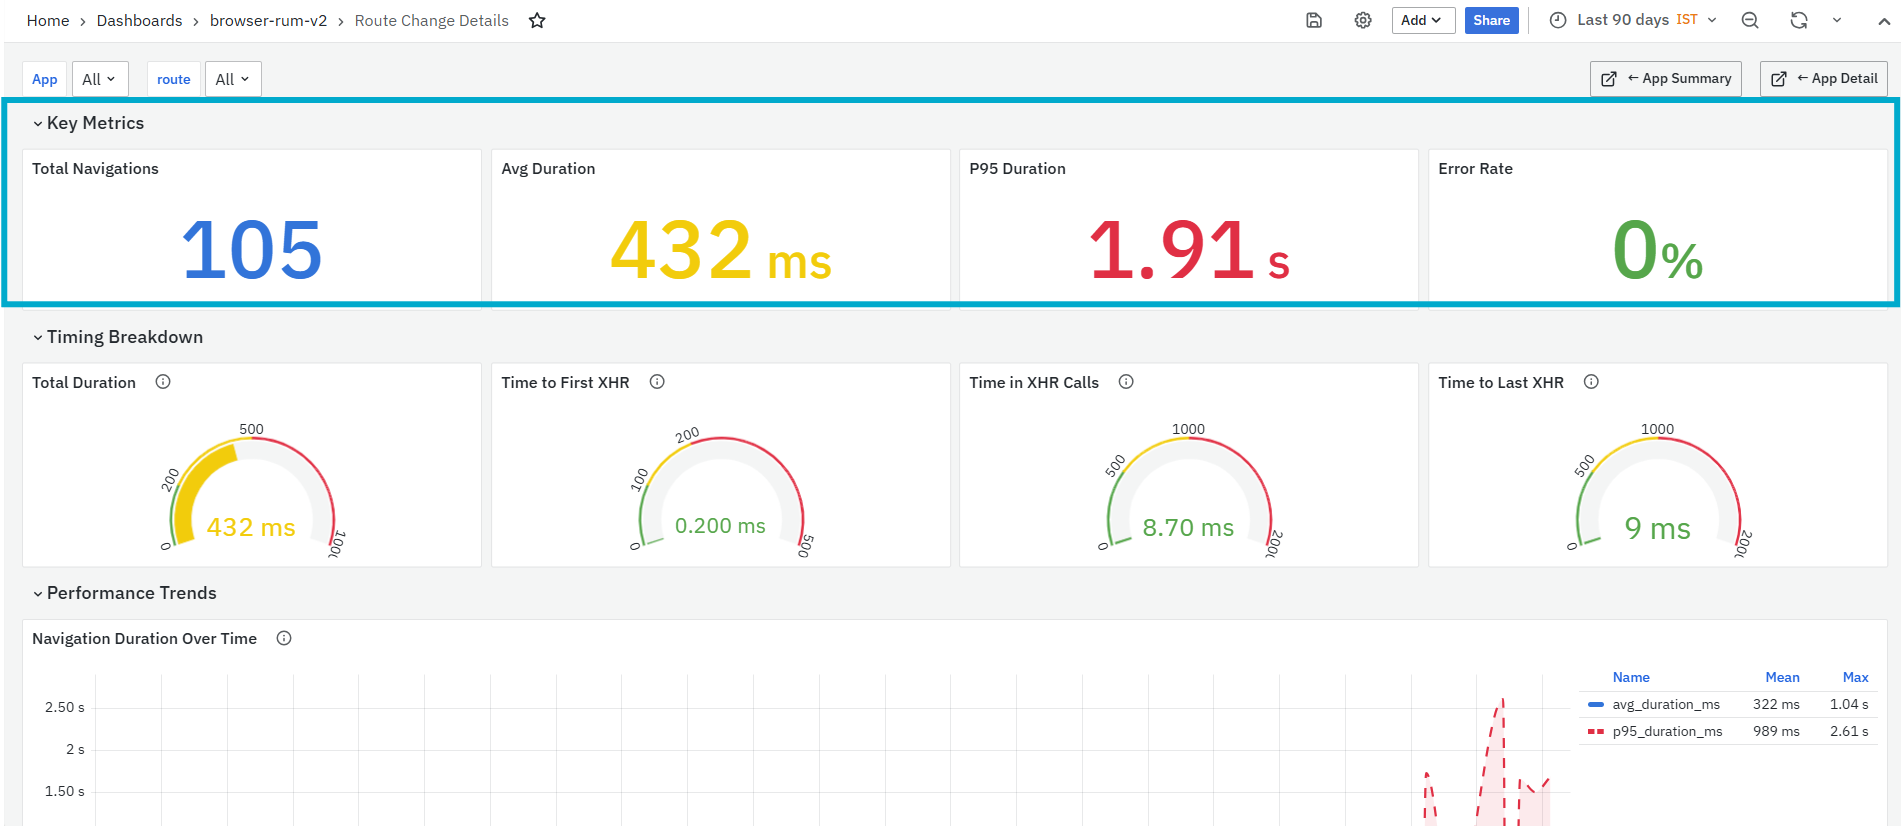
This section includes one panel:
- Navigation Duration Over Time
Navigation Duration Over Time
The Navigation Duration Over Time panel displays route navigation duration trends with percentile values. It shows how average duration and P95 duration change across the selected time range.
It helps you identify:
- Route duration spikes over time
- Difference between average and P95 route duration
- Periods where route navigation became slower
- Whether route slowness is temporary or recurring
- Possible correlation with deployments, traffic changes, or API delays
HTTP Requests
The HTTP Requests section displays HTTP/API requests made during the selected route change. This section helps users understand which API calls were triggered during navigation and whether those calls contributed to latency or errors.

This section includes one panel:
- HTTP Requests
HTTP Requests
The HTTP Requests panel lists the HTTP requests made during the selected route change. It shows the request method, endpoint, number of calls, average response time, and error percentage.
The panel includes the following columns:
- Method: Displays the HTTP method used for the request, such as GET or POST.
- Endpoint: Displays the HTTP/API endpoint called during the route change. The endpoint value is clickable. When clicked, it opens the HTTP Request Details dashboard for the selected endpoint.
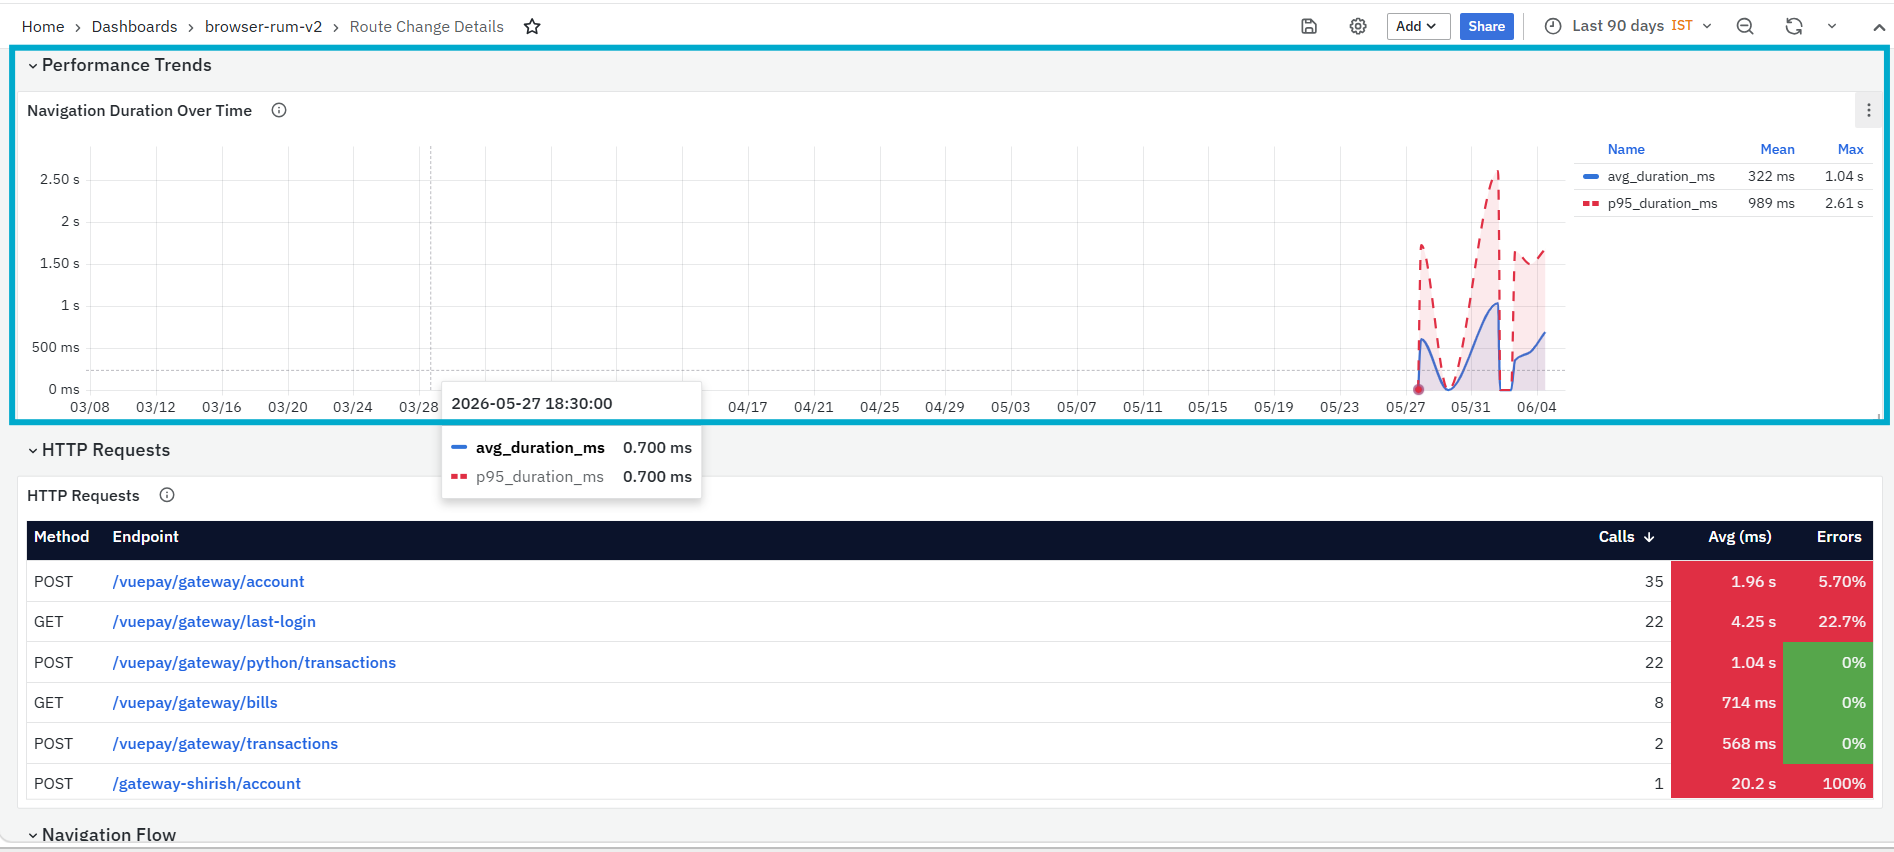
-
The HTTP Request Details dashboard provides a detailed view of the selected HTTP/API endpoint. It shows request volume, average latency, P95 latency, error rate, 4xx/5xx rate, throughput, time breakdown, endpoint performance, error analysis, user segments, recent requests, and endpoint deep-dive details. For more details refer to HTTP Request Details.
-
Calls: Displays the number of times the endpoint was called during the route change.
-
Avg (ms): Displays the average response time for the endpoint.
-
Errors: Displays the error percentage for the endpoint.
This panel is useful when users need to identify whether route navigation delay is caused by slow or failing APIs.
Navigation Flow
The Navigation Flow section shows where users came from before navigating to the selected route. This section helps users understand common route transition paths and identify whether specific route-to-route movements are slower.
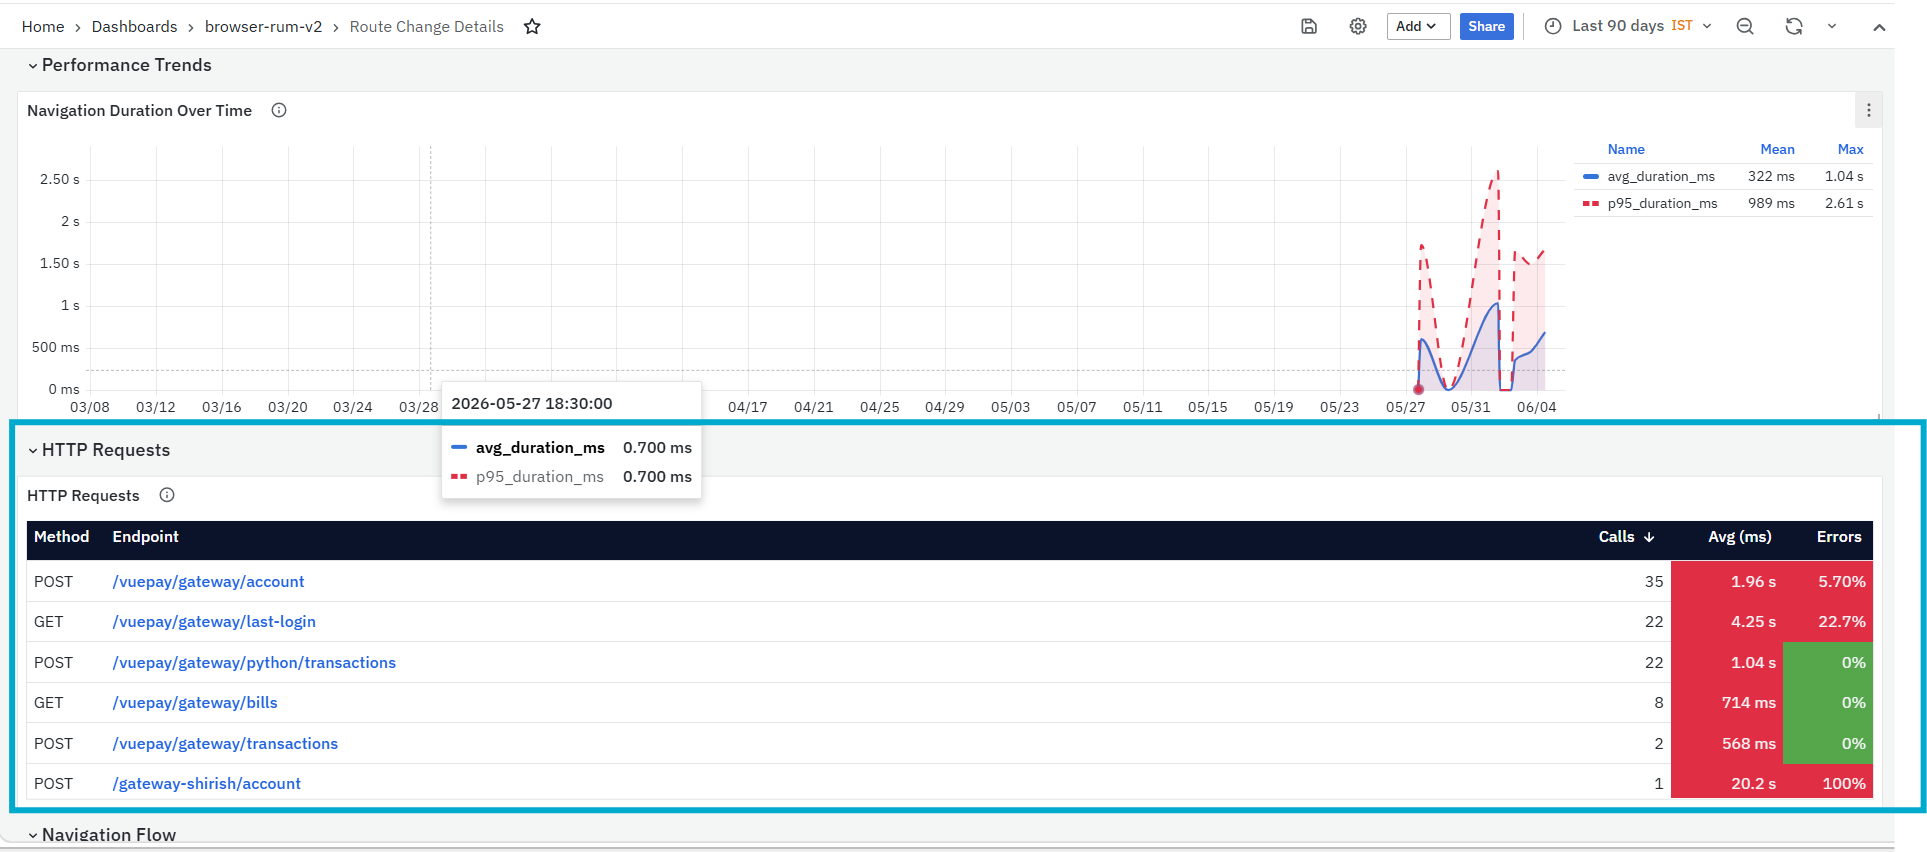
This section includes one panel:
- Entry Points (From → To)
Entry Points (From → To)
The Entry Points (From → To) panel displays the route transition flow into the selected route. It shows the source route, destination route, number of transitions, and average duration.
The panel includes the following columns:
- From Route: Displays the route from which the user navigated.
- To Route: Displays the route to which the user navigated.
- Count: Displays how many times the route transition occurred.
- Avg (ms): Displays the average duration for that route transition.
This panel is useful when users need to understand user navigation paths and identify route transitions that may need optimization.
User Segments
The User Segments section displays route navigation performance by browser and operating system. This section helps users identify whether route changes are slower for specific browsers or OS environments.
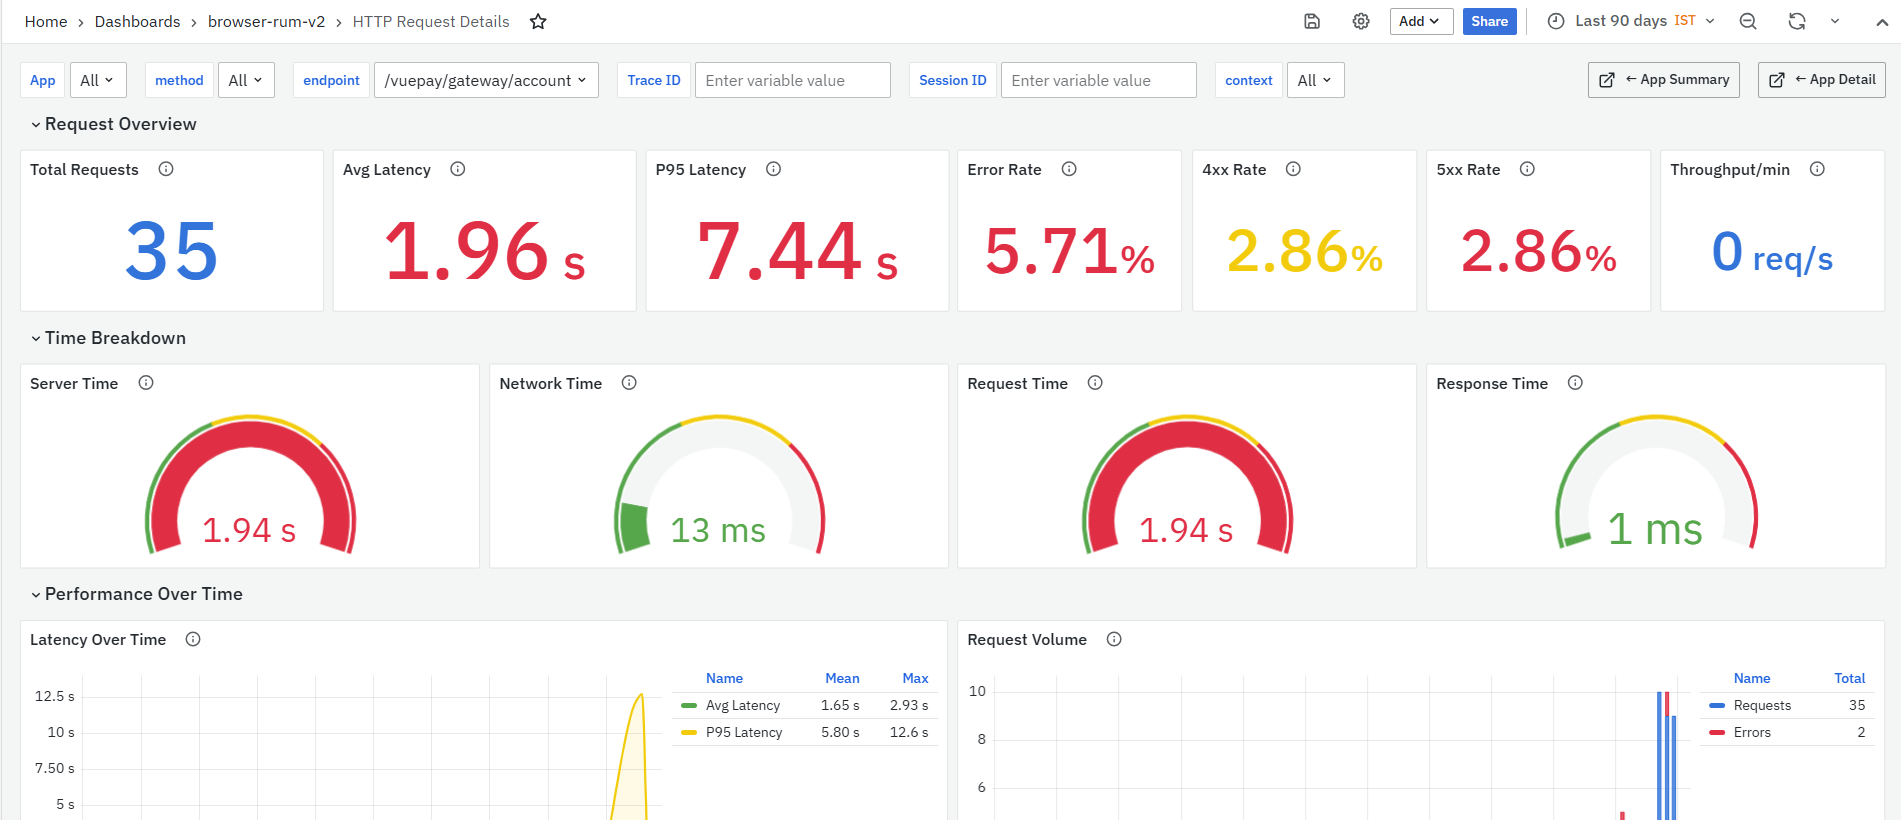
This section includes two panels:
- Browser Performance
- OS Performance
Browser Performance
The Browser Performance panel displays navigation performance grouped by browser. It helps users compare route change duration across browsers such as Safari, Chrome, and Firefox. This panel is useful when users need to identify browser-specific navigation performance issues. If one browser shows higher average duration, the route behavior should be reviewed for that browser.
The panel includes the following columns:
- Browser: Displays the browser used during the route change.
- Count: Displays the number of route changes recorded for that browser.
- Avg (ms): Displays the average route change duration for that browser.
OS Performance
The OS Performance panel displays navigation performance grouped by operating system. It helps users compare route change duration across OS types such as macOS and Linux. This panel is useful when users need to identify browser-specific navigation performance issues. If one browser shows higher average duration, the route behavior should be reviewed for that browser.
The panel includes the following columns:
- OS: Displays the operating system used during the route change.
- Count: Displays the number of route changes recorded for that OS.
- Avg (ms): Displays the average route change duration for that OS.
TraceMap Waterfall Dashboard
The TraceMap Waterfall Dashboard is a dashboard in the Browser Real User Monitoring module. It provides a detailed waterfall view of a selected trace. A trace represents a browser-side activity such as a document load, page load, route change, user interaction, or resource fetch. This dashboard helps users understand how the selected trace was executed from start to finish. It shows trace details, user environment, service time distribution, service-level contribution, and span-level timing so users can identify where time was spent during the trace.
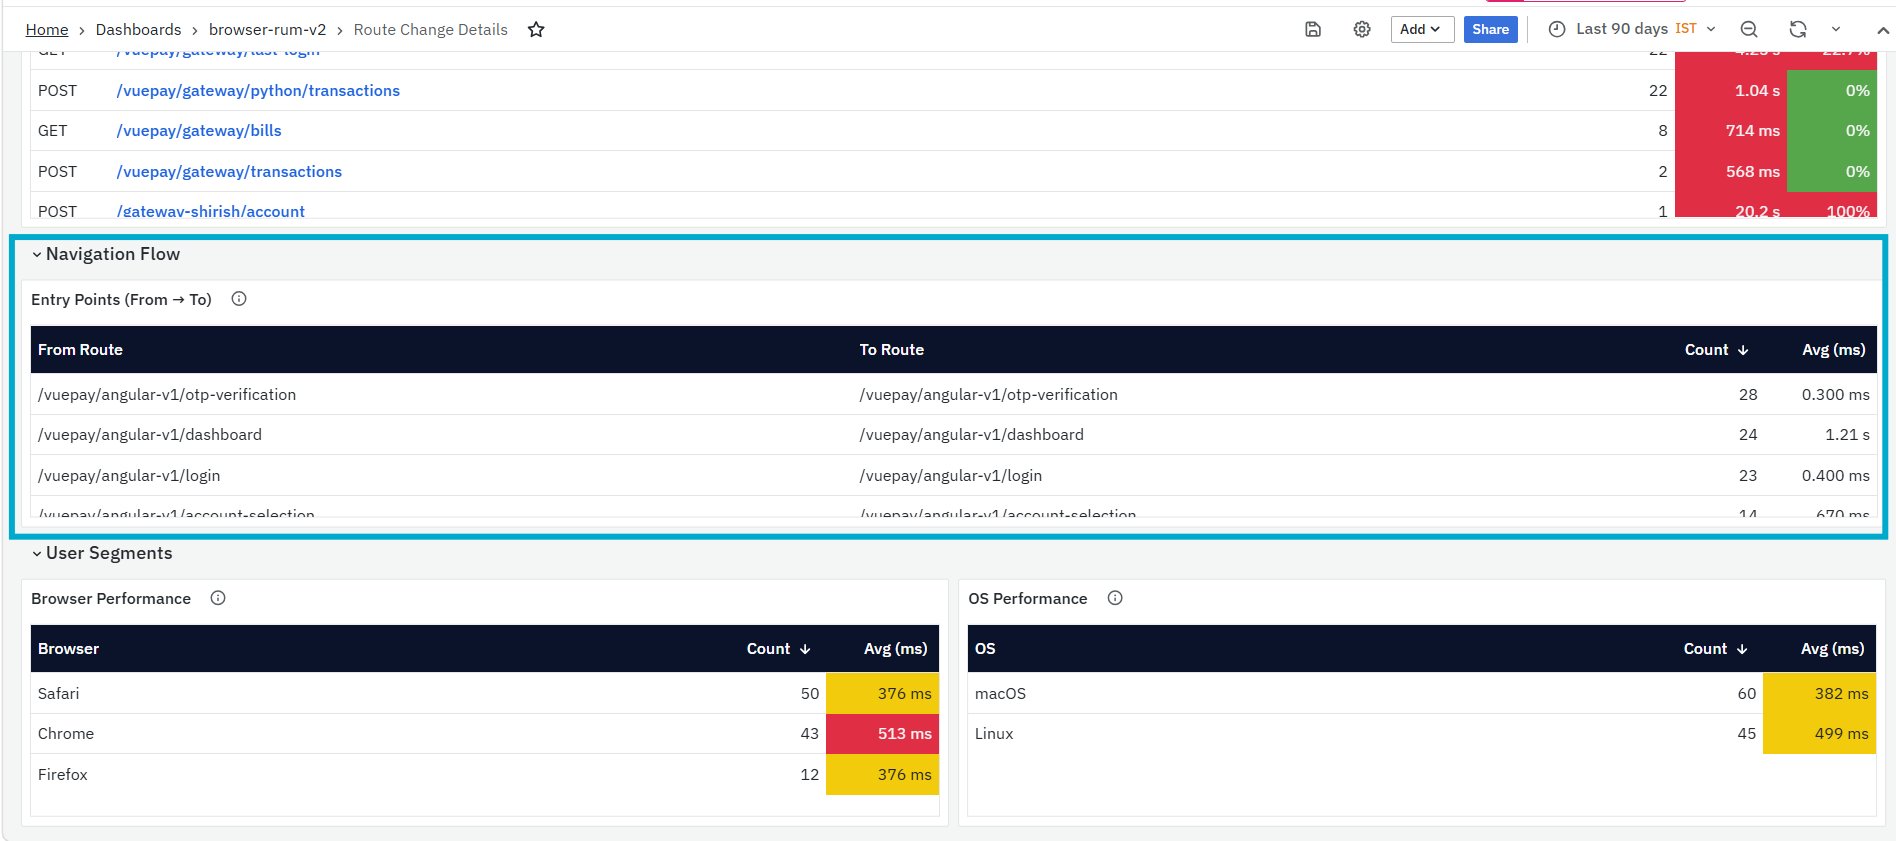
The dashboard is divided into the following sections:
- Trace Summary
- Environment
- Service Time Distribution
- Service Summary
- Trace Waterfall
Trace Summary
The Trace Summary section provides the basic details of the selected trace. It helps users confirm that they are analyzing the correct browser-side activity before reviewing the detailed waterfall.

It helps you identify:
- Type of trace, such as Document Load
- Application associated with the trace
- Trace ID linked to the selected activity
- Session ID associated with the trace
- Timestamp when the trace occurred
- Total number of spans and total trace duration
- The section includes details such as:
- Trace ID: Displays the unique identifier of the selected trace.
- Session ID: Displays the session associated with the trace.
- Timestamp: Displays when the trace occurred.
- Spans: Displays the total number of spans captured and the total trace duration.
This section is useful when users open the TraceMap Waterfall dashboard from another dashboard and need to verify that the correct trace has been selected.
Environment
The Environment section displays the browser-side environment in which the trace occurred. It provides context about the user’s browser, operating system, device, and location.
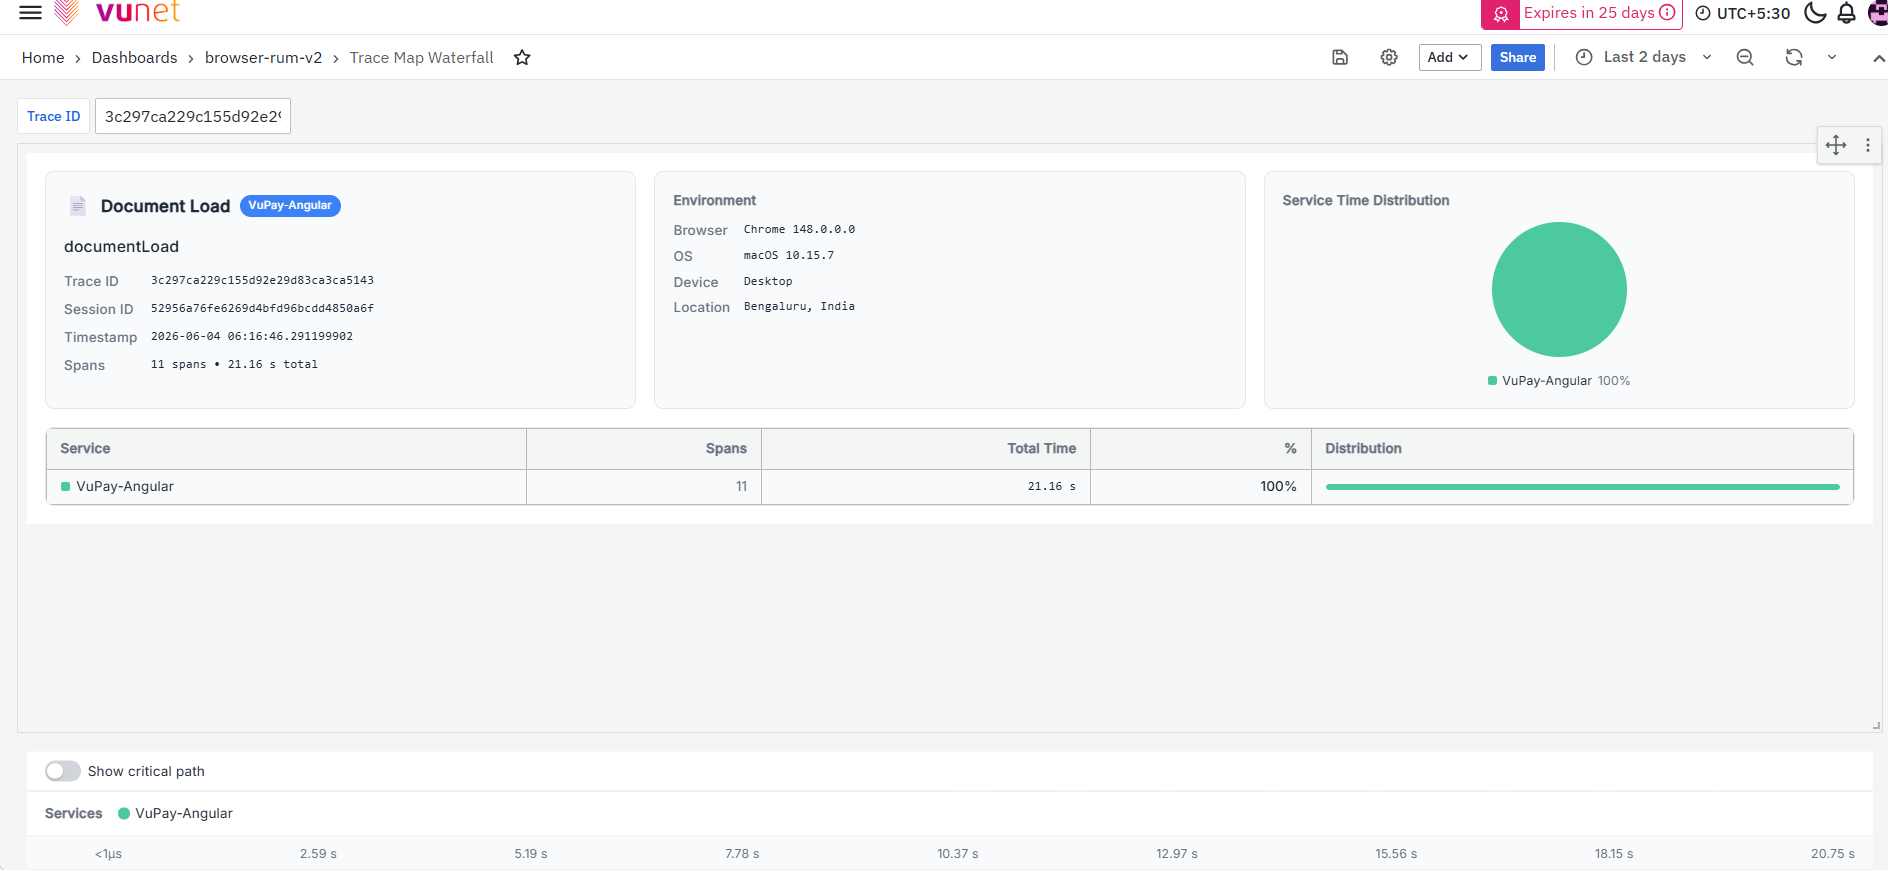
It helps you identify:
- Browser used during the trace
- Operating system used by the user
- Device type, such as Desktop
- User location, where available
- Environment-specific factors that may affect performance
The section includes the following details:
- Browser: Displays the browser version used during the trace.
- OS: Displays the operating system used by the user.
- Device: Displays the device type, such as Desktop.
- Location: Displays the user location associated with the trace.
This section is useful when users need to check whether trace behavior is related to a specific browser, OS, device, or geography.
Service Time Distribution
The Service Time Distribution section shows how the trace time is distributed across services involved in the selected trace. It provides a visual view of service-level contribution.

It helps you identify:
- Services involved in the selected trace
- Percentage contribution of each service
- Whether one service is consuming most of the trace duration
- Services that may require deeper investigation
- Trace time distribution across frontend or backend services
This section is useful when users need a quick visual understanding of where the trace duration is concentrated.
Service Summary
The Service Summary section provides a table-level breakdown of services involved in the selected trace. It shows how many spans were captured for each service, how much time each service consumed, and how much each service contributed to the total trace duration.
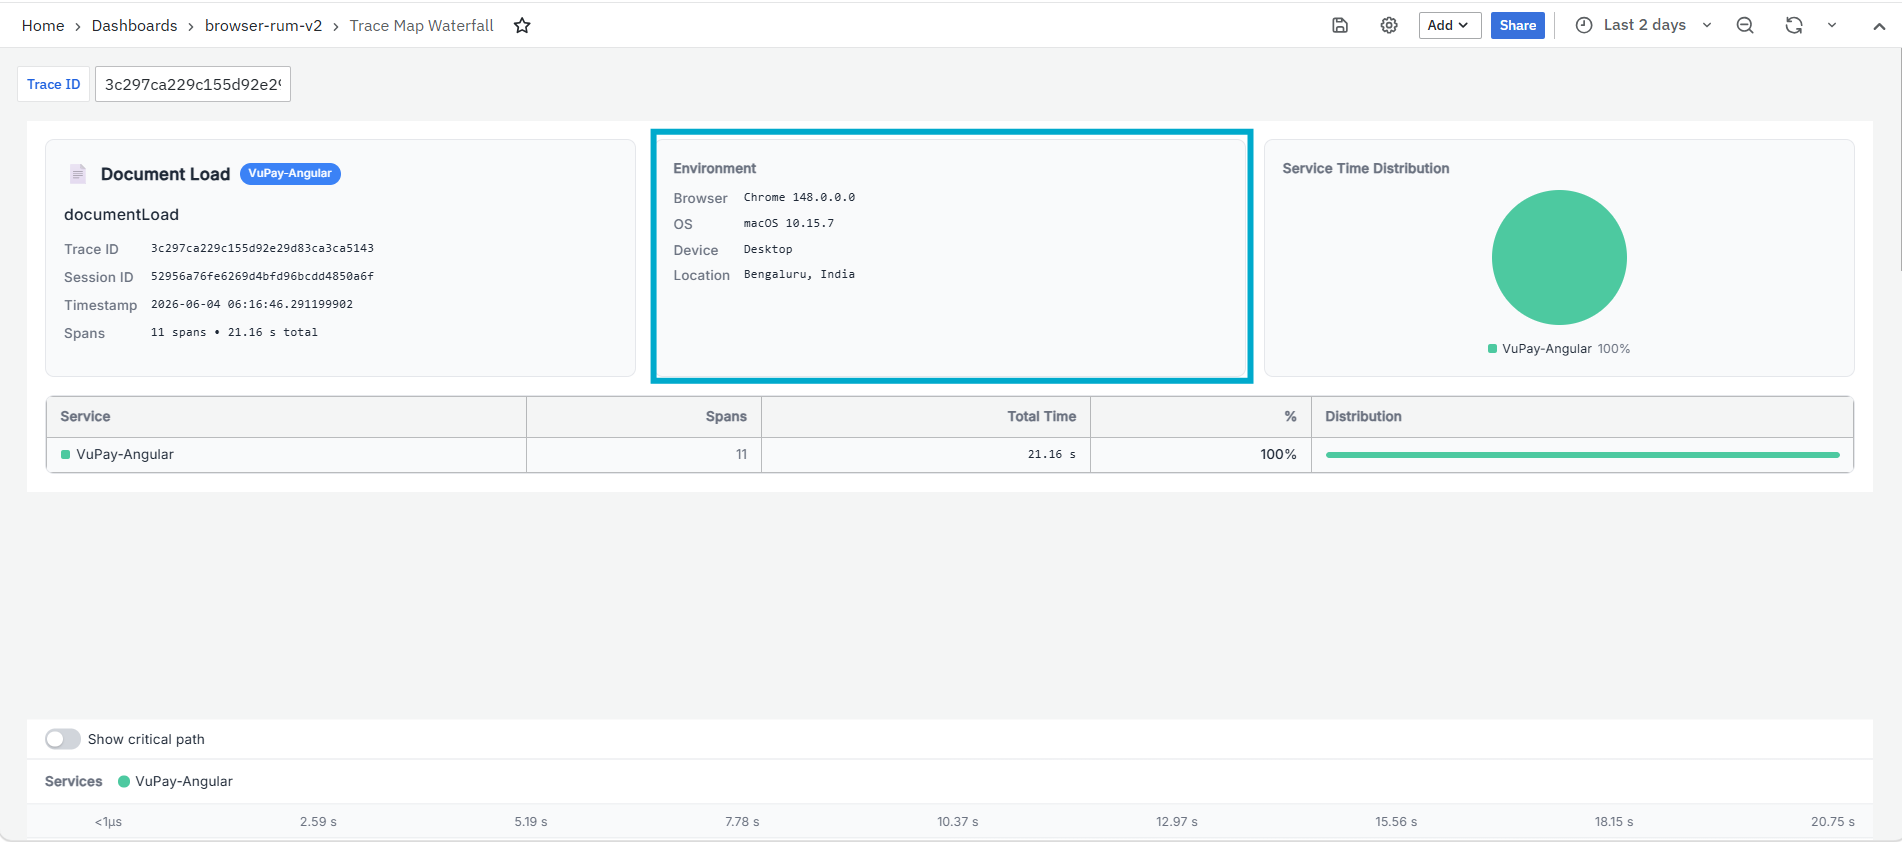
It helps you identify:
- Services involved in the selected trace
- Number of spans captured for each service
- Total time spent by each service
- Percentage contribution of each service to the trace duration
- Services that contributed most to the overall trace time
The panel includes the following columns:
- Service: Displays the service involved in the selected trace.
- Spans: Displays the number of spans captured for that service.
- Total Time: Displays the total time spent by that service during the trace.
- %: Displays the percentage contribution of the service to the total trace duration.
- Distribution: Displays a visual bar representing the service’s contribution to the overall trace time.
Trace Waterfall
The Trace Waterfall section displays the span sequence of the selected trace in a timeline view. It shows each span, when it occurred, how long it took, and how it contributed to the complete trace duration.
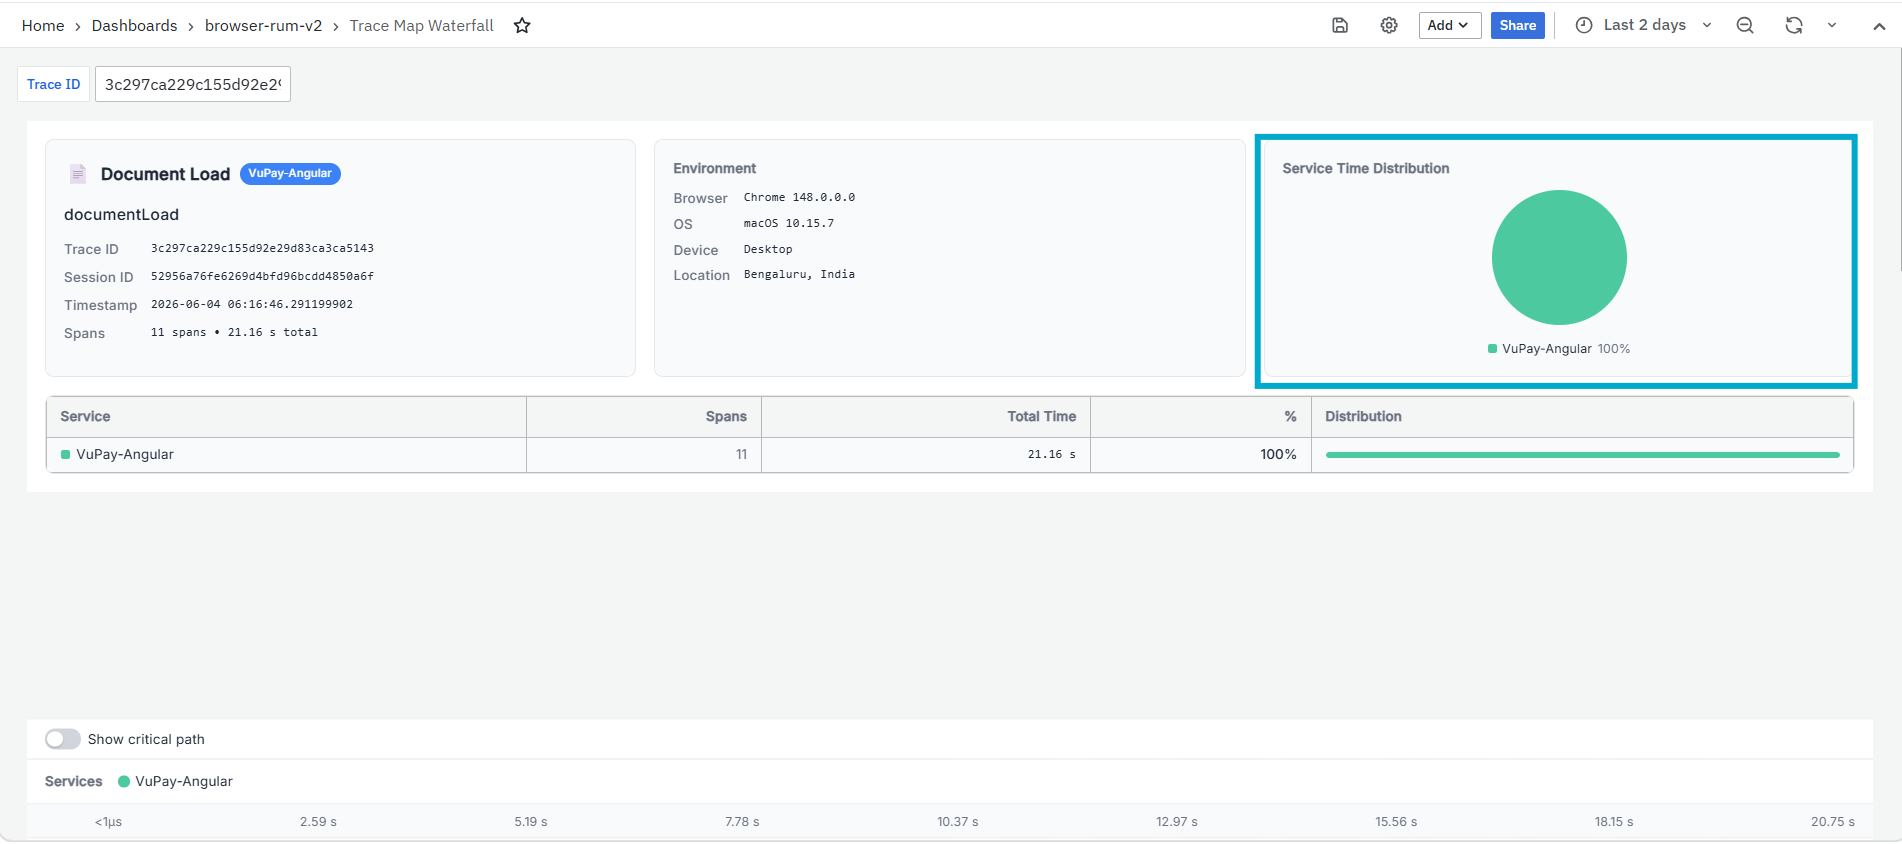
It helps you identify:
- Sequence of spans within the selected trace
- Parent-child relationship between spans
- Slow spans or long-running operations
- Resource fetch, document load, and web vital timing
- Time gaps between operations
- Whether operations are sequential or overlapping
- Where most of the total trace duration was spent
The section includes a Show critical path option. When enabled, it helps users focus on the spans that directly contribute to the overall trace duration.
The waterfall view displays a time scale across the top and span rows below it. Each span is represented visually on the timeline, making it easier to understand which operation started first, which operation took longer, and where the main delay occurred during the trace.
