Browser RUM V2
Introduction
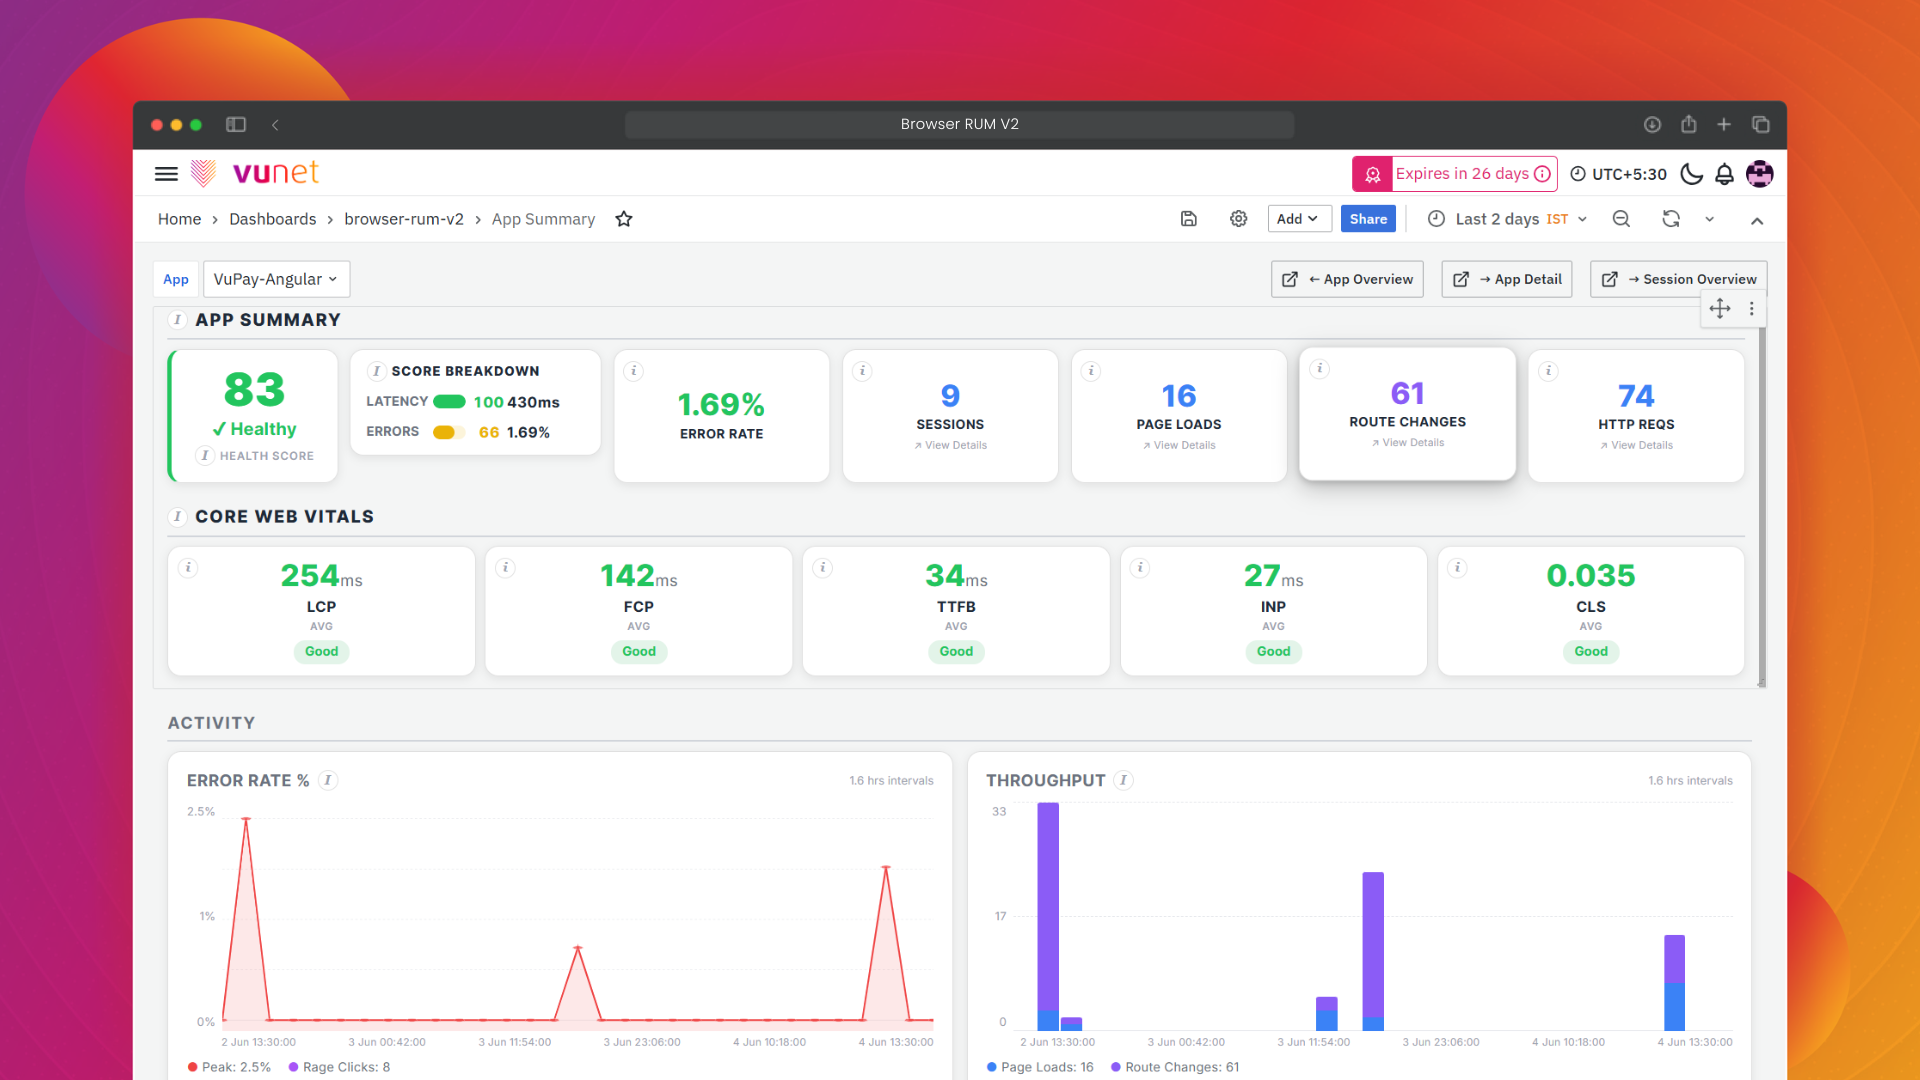
Browser Real User Monitoring (RUM) V2 provides end-to-end visibility into the real user experience across web applications by capturing performance and interaction data directly from users' browsers. It monitors key metrics such as page load times, HTTP request performance, route changes, application errors, session activity, and user interactions, helping teams understand how applications perform under real-world conditions.
With Browser RUM V2 in vuSmartMaps, organizations can gain actionable insights into application performance, identify frontend bottlenecks, analyze user behavior, investigate errors, and troubleshoot issues more efficiently. By correlating user experience data with performance metrics, Browser RUM V2 enables proactive optimization of web applications, helping deliver fast, reliable, and seamless digital experiences.
BRUM V2 Architecture
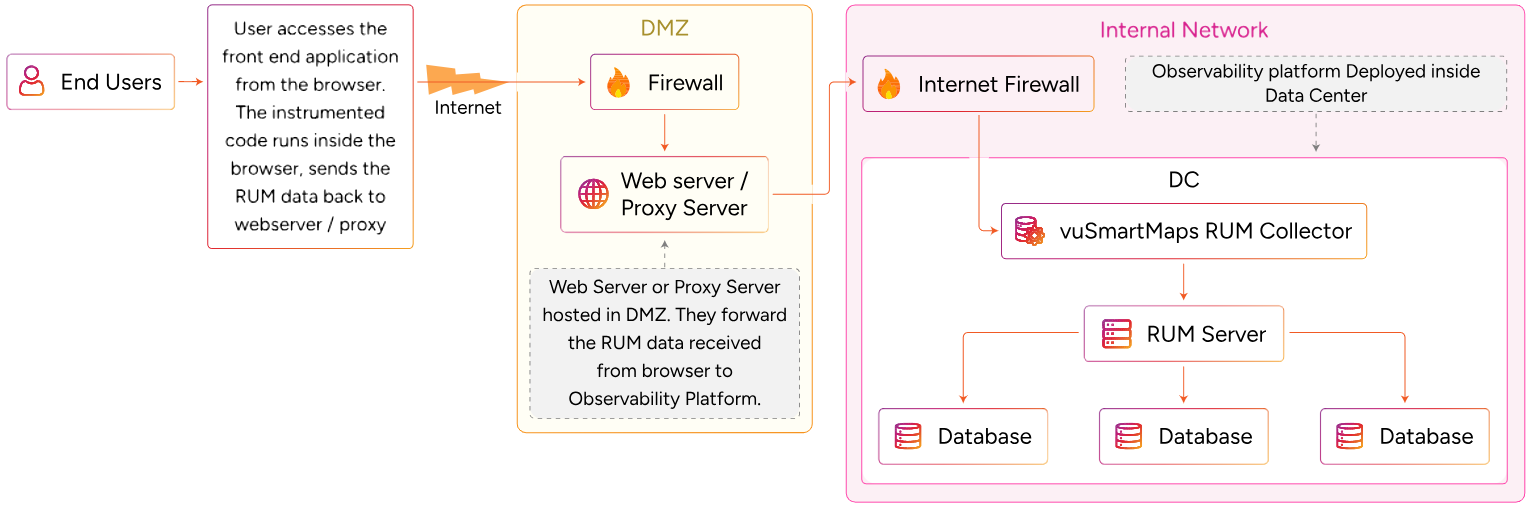
The Browser RUM V2 architecture provides end-to-end visibility into web application performance by collecting telemetry directly from end-user browsers and forwarding it to the vuSmartMaps observability platform for analysis and visualization.
- End User Browser:
The monitoring process begins when a user accesses a web application through a supported browser. The Browser RUM V2 JavaScript Agent embedded within the application captures real user telemetry, including page load performance, HTTP requests, route changes, user interactions, application errors, and session activity. - Internet:
The collected telemetry data is securely transmitted from the user's browser over the internet to the organization's monitoring infrastructure. - External Firewall:
Incoming telemetry traffic passes through the organization's external firewall before reaching the designated ingestion endpoint. - DMZ – Proxy Server:
A proxy server deployed within the Demilitarized Zone (DMZ) receives telemetry data from user browsers. The proxy acts as a secure intermediary between external users and the internal observability platform. It can perform functions such as SSL termination, request validation, CORS handling, and secure forwarding of telemetry data. - Internal Firewall:
After validation, the telemetry data passes through the internal firewall into the organization's internal network. - OpenTelemetry Collector:
The OpenTelemetry (OTEL) Collector receives telemetry data from the proxy server and performs collection, processing, and forwarding operations before sending the data to the Browser RUM services within vuSmartMaps. - vuSmartMaps Platform:
Browser RUM data is processed, stored, and correlated within the vuSmartMaps platform, where it is used to power dashboards, session analysis, performance investigations, trace visualization, and troubleshooting workflows.
Why Browser RUM V2 is Required
- Modern web applications are accessed by users across different browsers, devices, networks, and geographical locations. Traditional infrastructure and backend monitoring tools provide visibility into server-side performance but do not capture how users actually experience an application.
- Browser RUM V2 bridges this gap by collecting real user telemetry directly from users' browsers, including page load performance, HTTP requests, route changes, user interactions, application errors, and session activity. This enables organizations to understand application behavior from the end-user perspective, quickly identify performance bottlenecks, troubleshoot user-facing issues, and optimize digital experiences based on real-world usage patterns.
- By combining frontend performance monitoring with session-level visibility and detailed telemetry analysis, Browser RUM V2 helps teams improve application reliability, reduce troubleshooting time, and deliver a faster and more consistent user experience.
Data Collection and Processing
Browser RUM V2 collects real user monitoring data using the Browser RUM V2 JavaScript Agent. The recommended approach is to deploy a proxy server in the DMZ (Demilitarized Zone) to receive telemetry from users' browsers running the web application. This proxy serves as a secure intermediary between end-user browsers, where the Browser RUM V2 JavaScript Agent executes, and the OpenTelemetry (OTEL) Collector within the observability platform hosted in the internal network. This architecture enables secure and reliable telemetry collection while preventing direct exposure of internal monitoring components to the internet.
Prerequisites
Before configuring Browser RUM V2, ensure that the required network access, application instrumentation, and Browser RUM V2 configuration parameters are available.
Firewall Requirements
To collect Browser RUM V2 data successfully, ensure that the following ports are open. Traffic flow is described from the vuSmartMaps platform perspective.
| Source IP | Destination IP | Destination Port | Protocol | Direction |
|---|---|---|---|---|
| Browser | Proxy Server | 443 | TCP | Inbound |
| Proxy Server | vuSmartMaps Web Services | 443 | TCP | Outbound |
| Proxy Server | vuSmartMaps OTEL Collector | 4322* | TCP | Outbound |
Destination port values may vary depending on the deployment environment.
Preparing the Target Application
- Modify the application's frontend code to include the Browser RUM V2 JavaScript Agent using either the CDN-based or NPM-based integration method, depending on your deployment environment.
- The complete instrumentation package and integration instructions can be downloaded from the Browser RUM V2 O11ySource after completing the data source configuration.
Configuration Parameters
To configure Browser RUM V2 O11ySource, the following parameters are required:
| Parameter | Description |
|---|---|
| Application | Enter the name of the application you want to monitor |
| SSL Required | Enable TLS communication for Browser RUM ingestion. Once enabled, browser RUM data sent from the application to the vuSmartMaps ingestion endpoint will be securely encrypted. After enabling this feature, follow the additional instrumentation configuration steps provided in the 'TLS Configuration' section of the instrumentation guide. |
| Traces Sampling Percentage | Specify the sampling percentage for trace data collected by browser RUM agent. A percentage number between 0 and 100 is to be provided. If 0% is used, RUM agent will not collect any traces. If 100% is used, RUM agent will collect and send all traces. When a number between 0 and 100 is used, the RUM agent will send the specified percentage of traces using a random sampling policy. |
| Session Replay Sampling Percentage | Specify the sampling percentage for session replay data collected by the browser RUM agent. A value between 0 and 100 must be provided. If set to 0% , the RUM agent will not collect any session replay data. If set to 100% , session replay data will be captured and sent for all user sessions. For values between 0 and 100, the RUM agent uses a normalized percentage function to decide whether a session is selected for replay. The decision is based on the following logic: percentage(base + replayPercentage * RandomJitter) < replayPercentage base : A numeric value generated by hashing the session ID (originally a string). RandomJitter : A randomness factor that can vary by ±25% to ensure better distribution across sessions. percentage : A function that normalizes the result to always fall within the range of 0 to 100. Values above 100 (e.g., 105) are capped at 100. Values below 0 (e.g., -5) are raised to 0. If the normalized value is less than the configured replayPercentage , the session is selected for replay. This mechanism helps control the volume of session replay data while maintaining fair and balanced sampling across sessions. |
| Allowed Origins | Allowed Origins: Comma-separated list of origins permitted to access the OpentTelemetry Collector. Example: "http://example.com,https://app.example.com,http://localhost:3000" If not specified, defaults to "*" (allow all origins) |
| Allowed Headers | Allowed Headers: Comma-separated list of HTTP headers permitted in CORS requests Example: "Content-Type,Authorization,X-Requested-With" If not specified, defaults to "*" (allow all headers) |
Session Replay Sampling Logic
When a value between 1 and 99 is configured for Session Replay Sampling Percentage, the Browser RUM V2 Agent uses the following logic to determine whether a session should be selected for replay:
| percentage(base + replayPercentage * RandomJitter) < replayPercentage |
|---|
Where:
- base – A numeric value generated by hashing the session ID.
- RandomJitter – A randomness factor that varies by ±25% to improve distribution across sessions.
- percentage() – A normalization function that ensures the calculated value remains between 0 and 100.
If the resulting value is less than the configured replay percentage, the session is selected for replay.
- Values greater than 100 are capped at 100.
- Values less than 0 are raised to 0.
Disabling Options
- To disable trace collection, set Traces Sampling Percentage to 0.
- To disable session replay collection, set Session Replay Sampling Percentage to 0.
- To disable both features, set both values to 0.
Browser RUM V2 Alerts
Browser RUM V2 includes a set of default alert rules that help identify performance degradations, API issues, rendering delays, and user experience problems across monitored web applications.
- Browser RUM Page-High Server Time: This alert is generated when page server response times exceed expected thresholds for an application. It helps identify backend performance issues that may impact page load performance and user experience.
- Browser RUM Page-High XHR Response Time: This alert is generated when XHR request response times are high for an application. It helps detect slow API responses, network delays, and service performance issues.
- Browser RUM Page-High Browser Rendering Time: This alert is generated when browser rendering time exceeds expected thresholds. High rendering times may indicate frontend performance bottlenecks that affect page responsiveness.
- Browser RUM Page-Load Time High for Geo Location: This alert is generated when page load times are significantly higher for users from a specific geographic location. It helps identify regional performance issues and content delivery bottlenecks.
- Browser RUM API Historical Error Rate: This alert is generated when API error rates deviate significantly from historical patterns. It helps detect unexpected service failures and abnormal error spikes.
- Browser RUM API High Duration: This alert is generated when API response durations exceed configured thresholds or are substantially higher than historical trends. It helps identify performance degradation in backend services.
- Browser RUM API Error Rate Greater Than 5%: This alert is generated when the percentage of failed API requests exceeds the defined threshold. It helps identify service reliability issues and application failures.
- Browser RUM Page-High Network Time: This alert is generated when network latency contributes significantly to page load delays. It helps identify connectivity issues, network congestion, and slow data transfer times affecting user experience.
