4 posts tagged with "Scalability"

Updates designed to improve the platform ability to scale with growing data or user volume. This includes better resource management, improved load balancing, and the ability to handle larger deployments with ease.

View All Tags

NG 3.1.0

πŸ—“οΈ ⏱️ 56 min read

Overview​

vuSmartMaps NG 3.1.0 introduces significant advancements in observability, automation, AI-driven analytics, and platform operations. This release focuses on simplifying infrastructure onboarding, expanding observability coverage, improving application and digital experience monitoring, and enhancing operational efficiency through intelligent automation and centralized management. vuSmartMaps NG 3.1.0 introduces significant advancements in observability, automation, AI-driven analytics, and platform operations. This release focuses on simplifying infrastructure onboarding, expanding observability coverage, improving application and digital experience monitoring, and enhancing operational efficiency through intelligent automation and centralized management.

NG 3.1.0 introduces major capabilities such as Auto-Discovery & Instrumentation (ADI) for automated discovery and monitoring of supported environments, Application Workbench for business-centric application modeling, Smart Frames and Smart Frame Studio for customizable operational workspaces, APM Studio for centralized telemetry governance, and Browser Real User Monitoring (BRUM) V2 for enhanced end-user experience monitoring. The release also introduces AI-powered capabilities through Anomaly Detection and Ved AI, along with the new NG Alert Engine for scalable and high-performance alert processing. NG 3.1.0 introduces major capabilities such as Auto-Discovery & Instrumentation (ADI) for automated discovery and monitoring of supported environments, Application Workbench for business-centric application modeling, Smart Frames and Smart Frame Studio for customizable operational workspaces, APM Studio for centralized telemetry governance, and Browser Real User Monitoring (BRUM) V2 for enhanced end-user experience monitoring. The release also introduces AI-powered capabilities through Anomaly Detection and Ved AI, along with the new NG Alert Engine for scalable and high-performance alert processing.

In addition, NG 3.1.0 expands observability with new O11ySources, enhances Application Performance Monitoring (APM), Mobile Real User Monitoring (MRUM), Data Explorer, ContextStreams, Dashboards, ITSM integrations, HyperScale, reporting, platform security, and overall platform usability. Together, these enhancements provide deeper visibility across applications, infrastructure, and digital experiences while reducing operational effort, accelerating troubleshooting, and enabling organizations to build a more scalable, resilient, and intelligent observability platform. In addition, NG 3.1.0 expands observability with new O11ySources, enhances Application Performance Monitoring (APM), Mobile Real User Monitoring (MRUM), Data Explorer, ContextStreams, Dashboards, ITSM integrations, HyperScale, reporting, platform security, and overall platform usability. Together, these enhancements provide deeper visibility across applications, infrastructure, and digital experiences while reducing operational effort, accelerating troubleshooting, and enabling organizations to build a more scalable, resilient, and intelligent observability platform.

Key Highlights​

New Features​

  • Auto-Discovery & Instrumentation (ADI): * Introduces an automated observability framework for discovering and enabling monitoring of APM Java Traces on standalone Linux environments through Host Landscape, OmniAgent, and automated discovery capabilities.
  • Application Workbench: A business-centric modeling module that enables users to group observability sources and source instances into logical applications. Future enhancements will integrate these applications with Alerts, Dashboards, and targeted data filtering.
  • Auto-Discovery & Instrumentation (ADI): * Introduces an automated observability framework for discovering and enabling monitoring of APM Java Traces on standalone Linux environments through Host Landscape, OmniAgent, and automated discovery capabilities.
  • Application Workbench: A business-centric modeling module that enables users to group observability sources and source instances into logical applications. Future enhancements will integrate these applications with Alerts, Dashboards, and targeted data filtering.
  • NG Alert Engine: New Go-based alert processing engine designed to improve scalability, performance, and resource efficiency, with a redesigned Alert Configuration Studio.
  • APM Studio: New centralized workspace for telemetry governance, naming, classification, failure detection, and data control.
  • Smart Frames: A fully customizable alternative to traditional dashboards that unifies observability data, visualizations, and insights into an interactive workspace with seamless, context-aware drill-downs.
  • Smart Frames: A fully customizable alternative to traditional dashboards that unifies observability data, visualizations, and insights into an interactive workspace with seamless, context-aware drill-downs.
  • Smart Frame Studio: Introduces a visual design workspace for creating, configuring, and managing Smart Frames through an intuitive, widget-based interface.
  • Anomaly Detection: AI-driven anomaly detection capability that automatically identifies abnormal behavior across applications and infrastructure using adaptive learning models.
  • Ved AI: New AI-powered assistant that enables conversational incident investigations, alert analysis, and guided root cause analysis.
  • Browser Real User Monitoring (BRUM) V2: reimagined browser observability solution that provides deep visibility into end-user experiences by capturing application performance, errors, and user journeys, enabling faster troubleshooting and improved digital experiences.
  • Browser Real User Monitoring (BRUM) V2: reimagined browser observability solution that provides deep visibility into end-user experiences by capturing application performance, errors, and user journeys, enabling faster troubleshooting and improved digital experiences.

Major Enhancements​

  • O11ySources: Enhanced O11ySource management with Source Instances view, Table View, YAML editing, bulk operations, and multiple data collection modes. Also introduces new O11ySources across cloud, database, infrastructure, and observability domains.
  • Application Performance Monitoring (APM): Enhanced APM experience with redesigned Smart Frame dashboards and GeoIP telemetry enrichment for deeper application visibility.
  • Application Performance Monitoring (APM): Enhanced APM experience with redesigned Smart Frame dashboards and GeoIP telemetry enrichment for deeper application visibility.
  • Data Explorer: Evolution of Log Analytics into a unified platform for exploring and analyzing all table-based datasets.
  • ContextStreams: Enhanced debugging capabilities with new and updated plugins, along with improvements to multiline log processing and data enrichment workflows.
  • ContextStreams: Enhanced debugging capabilities with new and updated plugins, along with improvements to multiline log processing and data enrichment workflows.
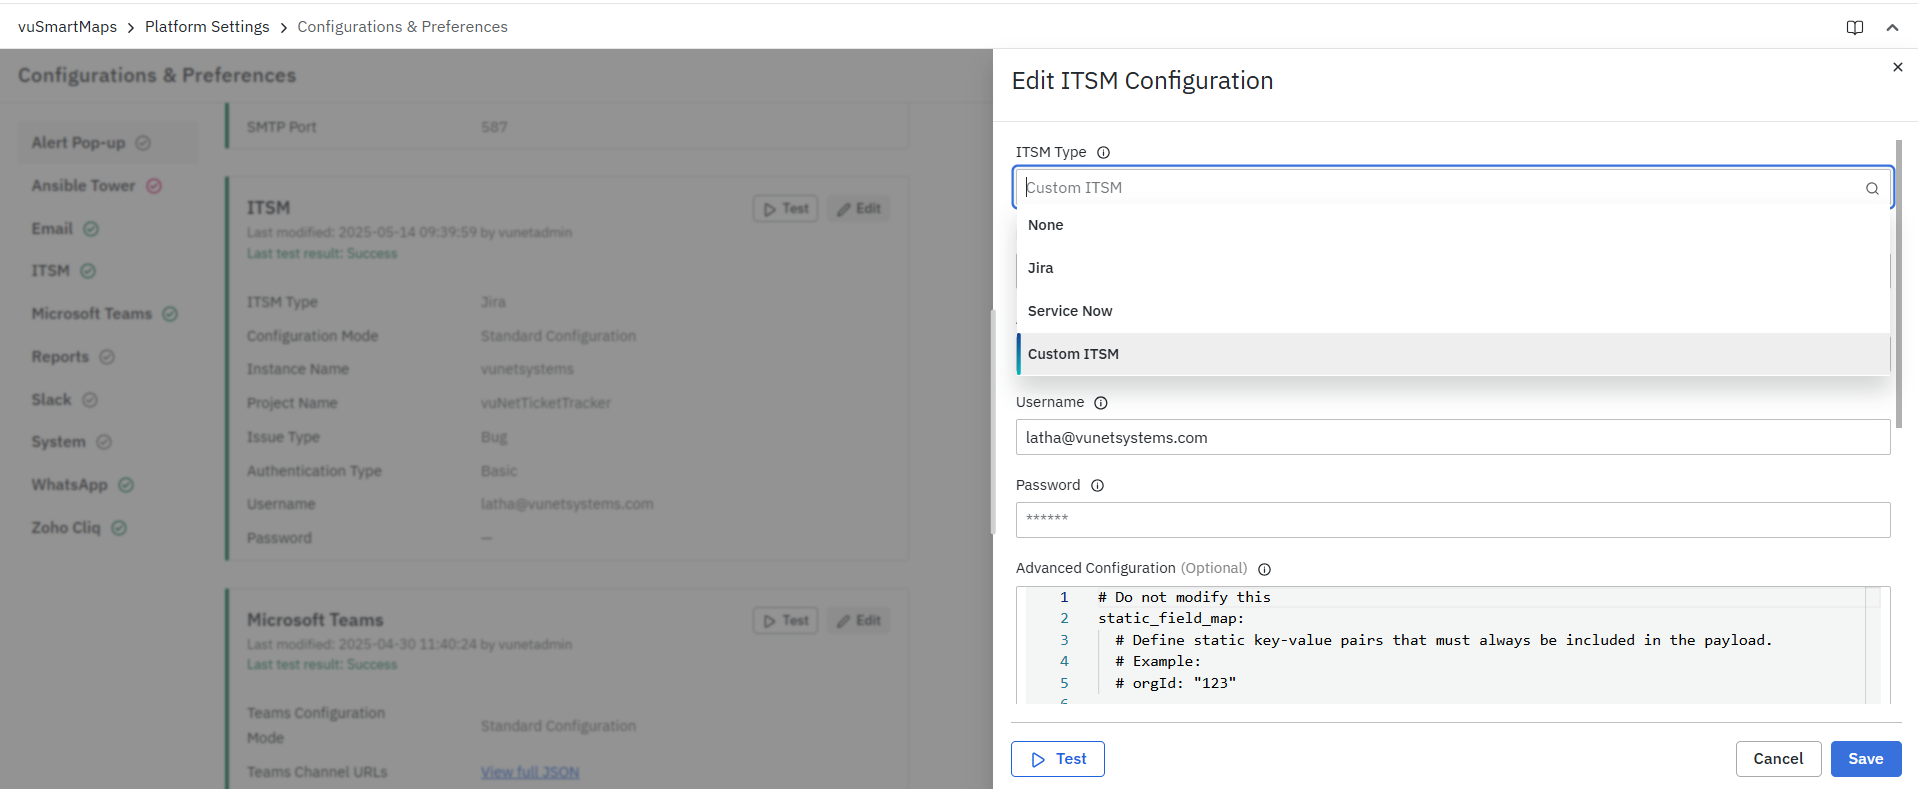
  • ITSM Platform Configurations: Expanded integration capabilities with PATCH support, custom authentication, configurable search payloads, and proxy support.
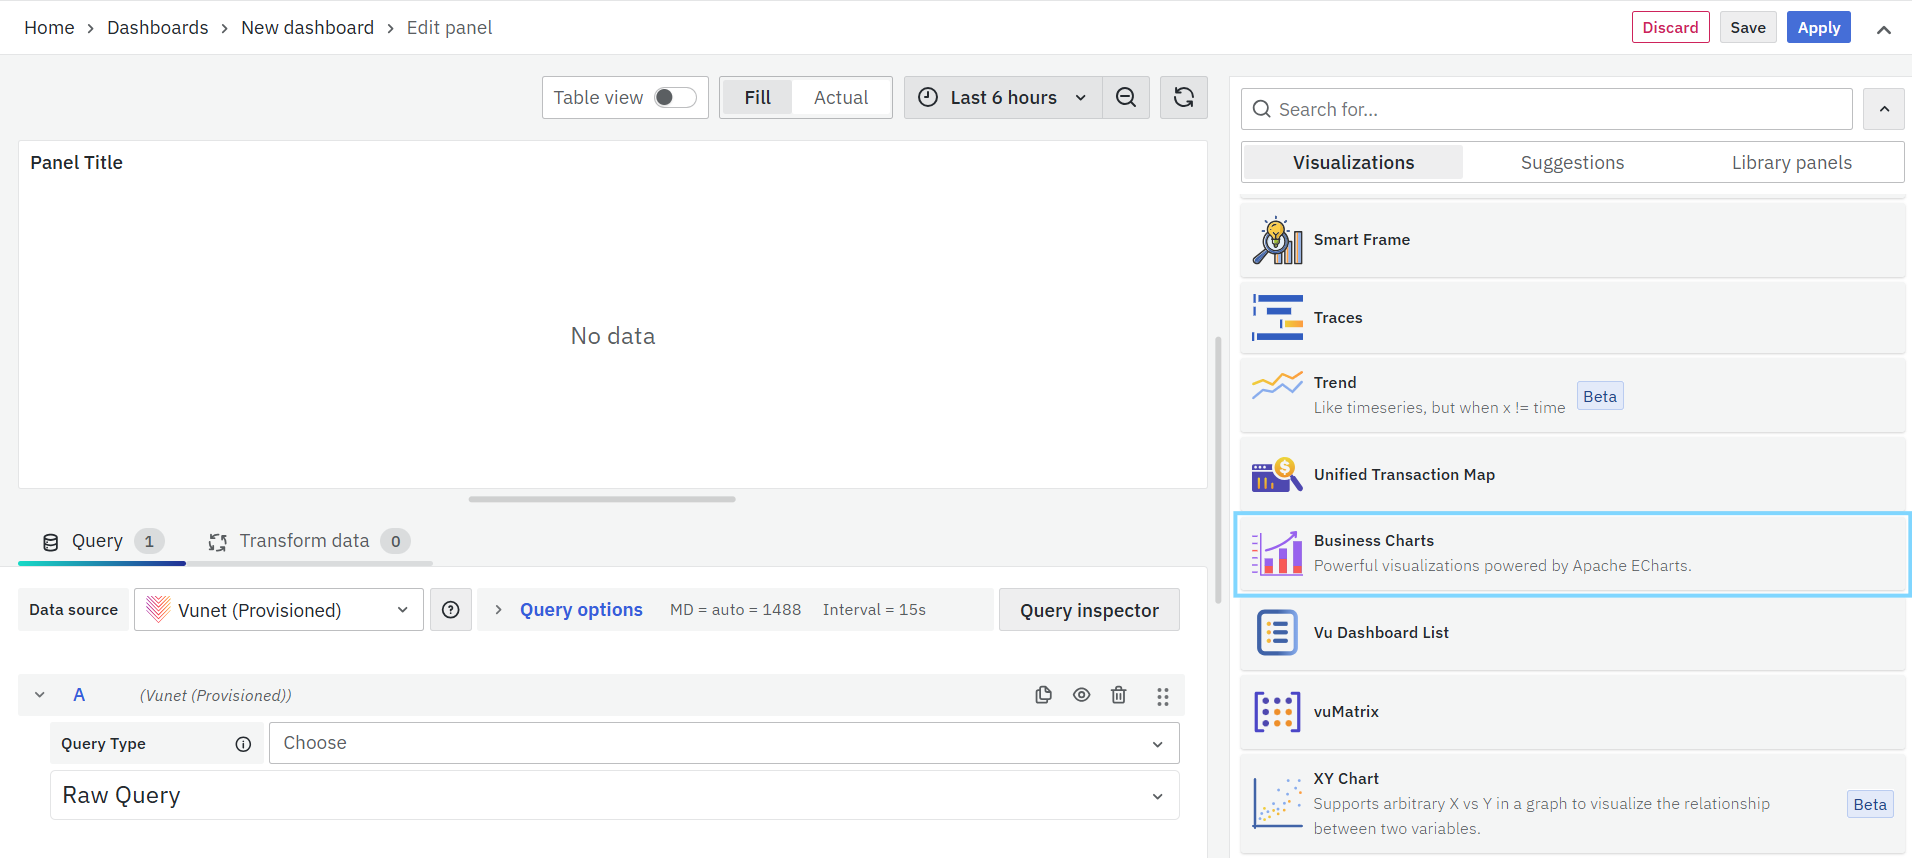
  • Dashboards: Support for Business Charts powered by the Volkov Labs ECharts plugin, enabling advanced and interactive visualizations.
  • Synthetic Browser Journey Monitoring: Added support for Internet Explorer (IE) mode to monitor and validate legacy browser-based workflows.

Platform & Infrastructure Improvements​

  • PostgreSQL High Availability (HA): Introduces automated failover and recovery capabilities to improve database reliability and reduce downtime.
  • HyperScale: Automated database recovery scripts and ClickHouse upgrade from 25.3 to 26.2 for improved stability and compatibility.
  • Data Retention: Enhanced restore workflows now restore archived data directly into original tables for consistent visibility across the platform.
  • Reports: Generated PDF reports now include a dedicated introduction page for improved presentation and document structure.
  • OpenTelemetry Collector Upgrade: Upgraded from v0.113.1.0 to v0.138.0 to improve telemetry processing efficiency, reliability, and compatibility.
  • Kafka Data Ingestion: Optimized JSONAsString ingestion for improved Kafka throughput and processing efficiency.
  • Alert Console & Alert Email Enhancements: Improved alert visibility controls, cleaner notification layouts, and configurable contextual information.
  • Platform Configurations: Renamed and redesigned the configuration workspace with improved Quick Links and better content accessibility.
  • Main Menu Enhancements: Reorganized navigation structure with improved module grouping and quick search support using Ctrl + K.
  • Platform Security Improvements: Security enhancements across web, API, container, network, and compliance layers.

O11ySources Highlights​

New O11ySources​

We continue to expand our observability coverage with new out-of-the-box O11ySources in NG 3.1.0. These additions improve monitoring and data collection across different environments, helping users gain deeper insights and better visibility into their systems.

The new O11ySources include:

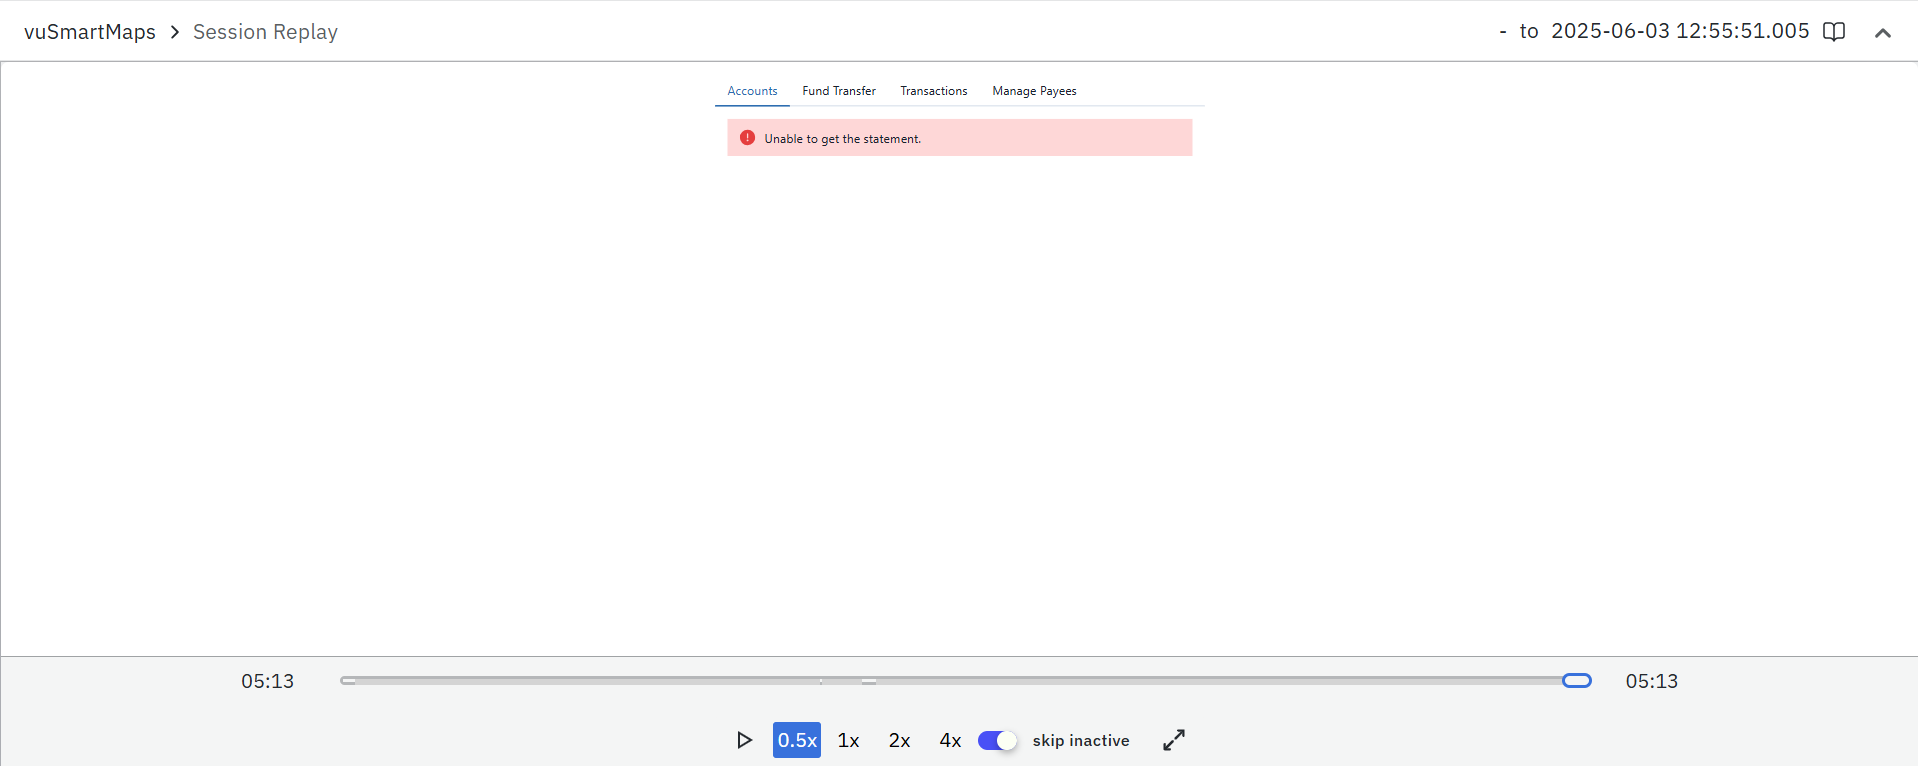
  • Browser RUM V2: Browser RUM V2 (Real User Monitoring) provides comprehensive visibility into the real end-user experience of web applications by capturing browser-side telemetry directly from live user sessions. This O11ySource enables monitoring of page load performance, API calls, route changes, user interactions, application errors, session activity, and user journeys within vuSmartMaps. It also supports advanced capabilities such as session replay and session-level analysis through purpose-built dashboards, helping teams analyze frontend performance, troubleshoot issues faster, and optimize digital user experiences.

  • Browser RUM V2: Browser RUM V2 (Real User Monitoring) provides comprehensive visibility into the real end-user experience of web applications by capturing browser-side telemetry directly from live user sessions. This O11ySource enables monitoring of page load performance, API calls, route changes, user interactions, application errors, session activity, and user journeys within vuSmartMaps. It also supports advanced capabilities such as session replay and session-level analysis through purpose-built dashboards, helping teams analyze frontend performance, troubleshoot issues faster, and optimize digital user experiences.

  • HPE Router: HPE Routers are enterprise-grade networking devices that provide routing and connectivity services across organizational networks. This O11ySource enables monitoring of router health, performance, and operational status within vuSmartMaps by collecting key SNMP-based metrics such as CPU utilization, memory usage, interface statistics, and hardware health indicators.

  • Mobile RUM: Mobile RUM (Real User Monitoring) provides end-to-end visibility into how users interact with mobile applications across Android, iOS, and Flutter platforms. This O11ySource captures real-time user experience metrics, application performance data, crashes, errors, API activity, and user interactions, enabling teams to monitor application health, identify performance bottlenecks, and improve mobile user experiences.

  • NetApp Storage Monitor: NetApp Storage Monitor provides comprehensive visibility into the performance, capacity, and health of NetApp storage environments. This O11ySource enables monitoring of storage controllers, aggregates, volumes, disks, and protocols within vuSmartMaps by collecting key metrics such as IOPS, latency, throughput, capacity utilization, and hardware health, helping ensure reliable and efficient storage operations.

  • NewNet Security Gateway: NewNet AccessGuard is a secure payment transaction routing and transport gateway designed to handle high volumes of digital payment traffic. This O11ySource provides visibility into gateway performance, transaction processing, and operational health within vuSmartMaps, enabling organizations to monitor secure payment infrastructure and ensure reliable transaction routing and communication.

  • SpringBoot: Spring Boot is a widely used framework for building enterprise Java applications and microservices. This O11ySource provides comprehensive observability into Spring Boot applications by collecting application, JVM, Tomcat, JDBC, executor, and Actuator-based metrics, enabling teams to monitor application health, resource utilization, request processing, and operational performance in real time.

  • Storage Monitor: Storage Monitor enables real-time monitoring of CIM/WBEM-compliant storage systems, including enterprise storage platforms such as HP 3PAR, Dell EMC PowerMax, and other SMI-S compliant arrays. This O11ySource provides visibility into storage performance, capacity utilization, and operational health within vuSmartMaps, helping teams proactively manage storage infrastructure and identify potential issues.

  • Traces Collector: Traces Collector enables the collection and ingestion of distributed tracing telemetry from applications and services. This O11ySource provides visibility into transaction flows, service dependencies, request latency, and application interactions within vuSmartMaps, helping teams troubleshoot performance issues and perform end-to-end observability across distributed environments.

  • Versa Appliance: Versa Appliances are secure SD-WAN and edge networking platforms that combine routing, security, and traffic management capabilities. This O11ySource provides visibility into appliance performance, network health, traffic patterns, and operational status within vuSmartMaps, helping organizations monitor distributed network infrastructure and maintain secure, reliable connectivity across enterprise environments.

Complete list of O11ySources available in NG 3.1.0​

Active DirectoryFortinet FirewallRabbitMQAIX Monitor
Dell SwitchRadware Load Balancer (SNMP)Amazon RDSDevice Availability
RancherApacheGKERedis
Apache HDFSHAProxySAP ASEApache Solr
Hitachi StorageService MonitorAWS ALBHPUX Monitor
SFTP MonitorAWS API GatewayHTTP PollerSNMP Polling
AWS Classic ELBIBM HTTP ServerSNMP TrapAWS CloudFront
IBM MQSolaris MonitorAWS ElastiCacheIBM WAS
SQL Data CollectorAWS Network FirewallIISSSL Certificate Monitor
AWS NLBJBossSynthetic Browser Journey MonitoringAWS Route53
JVM MonitorSyslogAWS S3Kafka
Task SchedulerAWS Transit GatewayKafka Data CollectorTomcat
AWS VPCKeycloakTracesAWS WAF
KeyDBURL AvailabilityAzure API ManagementKong API Gateway
VaultAzure App GatewayKubernetesvSphere
Azure CDN WAF PolicyLinux MonitorWeblogicAzure EventHub
Log CollectorWindows Events LogsAzure FirewallMariaDB
Windows MonitorAzure Key VaultMicroSoft DFSAzure Load Balancer
MongoDBAzure MySQL DatabaseMSSQLAzure Redis Cache
MYSQLAzure SQL DatabaseNetApp StorageAzure SQL Managed Instance
NetFlowAzure Storage BlobNginxBrowser RUM
NutanixCassandraOCI API GatewayCheckpoint Firewall
OCI Autonomous DatabaseCisco ACIOCI ComputeCisco Firewall
OCI Kubernetes Engine (OKE)Cisco RouterOHSCisco Switch
OracleDNS MonitoringPalo Alto FirewallF5 Load Balancer
PostgreSQL

NG 3.1.0 O11ySources

Browser RUM-V2HPE RouterMobile RUMNetApp Storage Monitor
NewNet Security GatewaySpringBootStorage MonitorTraces Collector
Versa Appliance

Improvements/Technology Upgrades in the Release​

Auto-Discovery & Instrumentation (ADI)​

NG 3.1.0 introduces Auto-Discovery & Instrumentation (ADI), a new observability framework designed to simplify and automate the process of discovering infrastructure, enabling automated monitoring of systems, and maintaining visibility across dynamic environments.

In traditional monitoring environments, teams often spend considerable time onboarding hosts, configuring monitoring sources, deploying collectors, and maintaining monitoring configurations. ADI addresses these challenges by providing an automated and policy-driven approach to observability. Once OmniAgent is installed on a supported host, ADI automatically discovers supported hosts, services, runtime components, and monitorable entities across the environment. It maintains an up-to-date inventory of discovered assets, evaluates them for monitoring, and helps streamline the onboarding process with minimal manual intervention.

note

In the NG 3.1.0 release, ADI capabilities are focused on APM Java Traces running on standalone Linux environments. Support for additional technologies such as .NET, Python, and Node.js, broader operating systems including Windows, AIX, and Solaris, additional telemetry types such as Metrics, Logs, and Browser RUM, and containerized environments (Docker and Kubernetes) is planned for future releases.

In traditional monitoring environments, teams often spend considerable time onboarding hosts, configuring monitoring sources, deploying collectors, and maintaining monitoring configurations. ADI addresses these challenges by providing an automated and policy-driven approach to observability. Once OmniAgent is installed on a supported host, ADI automatically discovers supported hosts, services, runtime components, and monitorable entities across the environment. It maintains an up-to-date inventory of discovered assets, evaluates them for monitoring, and helps streamline the onboarding process with minimal manual intervention.

note

In the NG 3.1.0 release, ADI capabilities are focused on APM Java Traces running on standalone Linux environments. Support for additional technologies such as .NET, Python, and Node.js, broader operating systems including Windows, AIX, and Solaris, additional telemetry types such as Metrics, Logs, and Browser RUM, and containerized environments (Docker and Kubernetes) is planned for future releases.

The ADI framework combines discovery, inventory management, monitoring, and instrumentation into a unified workflow, making it easier for operations teams to gain visibility into their infrastructure and applications. ADI is built around three key components:

Host Landscape​

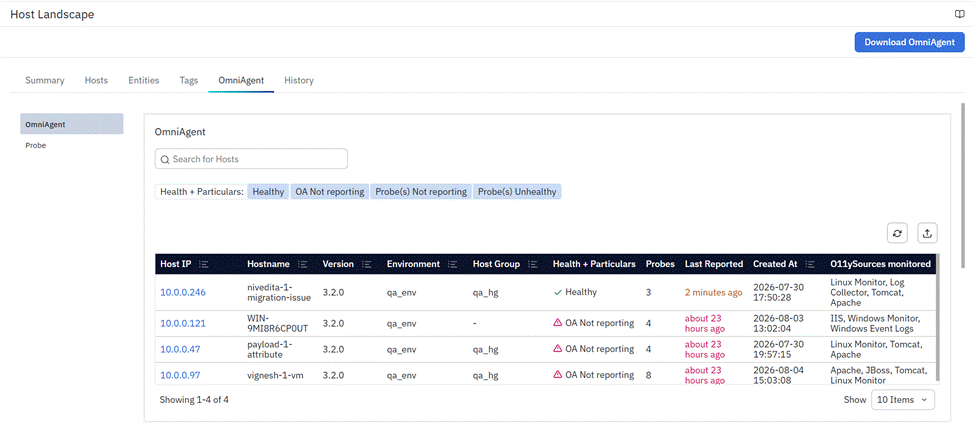
Host Landscape serves as the centralized operational interface for ADI and provides a complete view of discovered infrastructure and monitoring activities. It acts as a unified inventory where users can view discovered hosts, monitored entities, onboarding status, monitoring coverage, and operational health across environments. By consolidating this information into a single interface, Host Landscape helps teams understand what assets exist in the environment, which assets are being monitored, and where additional attention may be required.
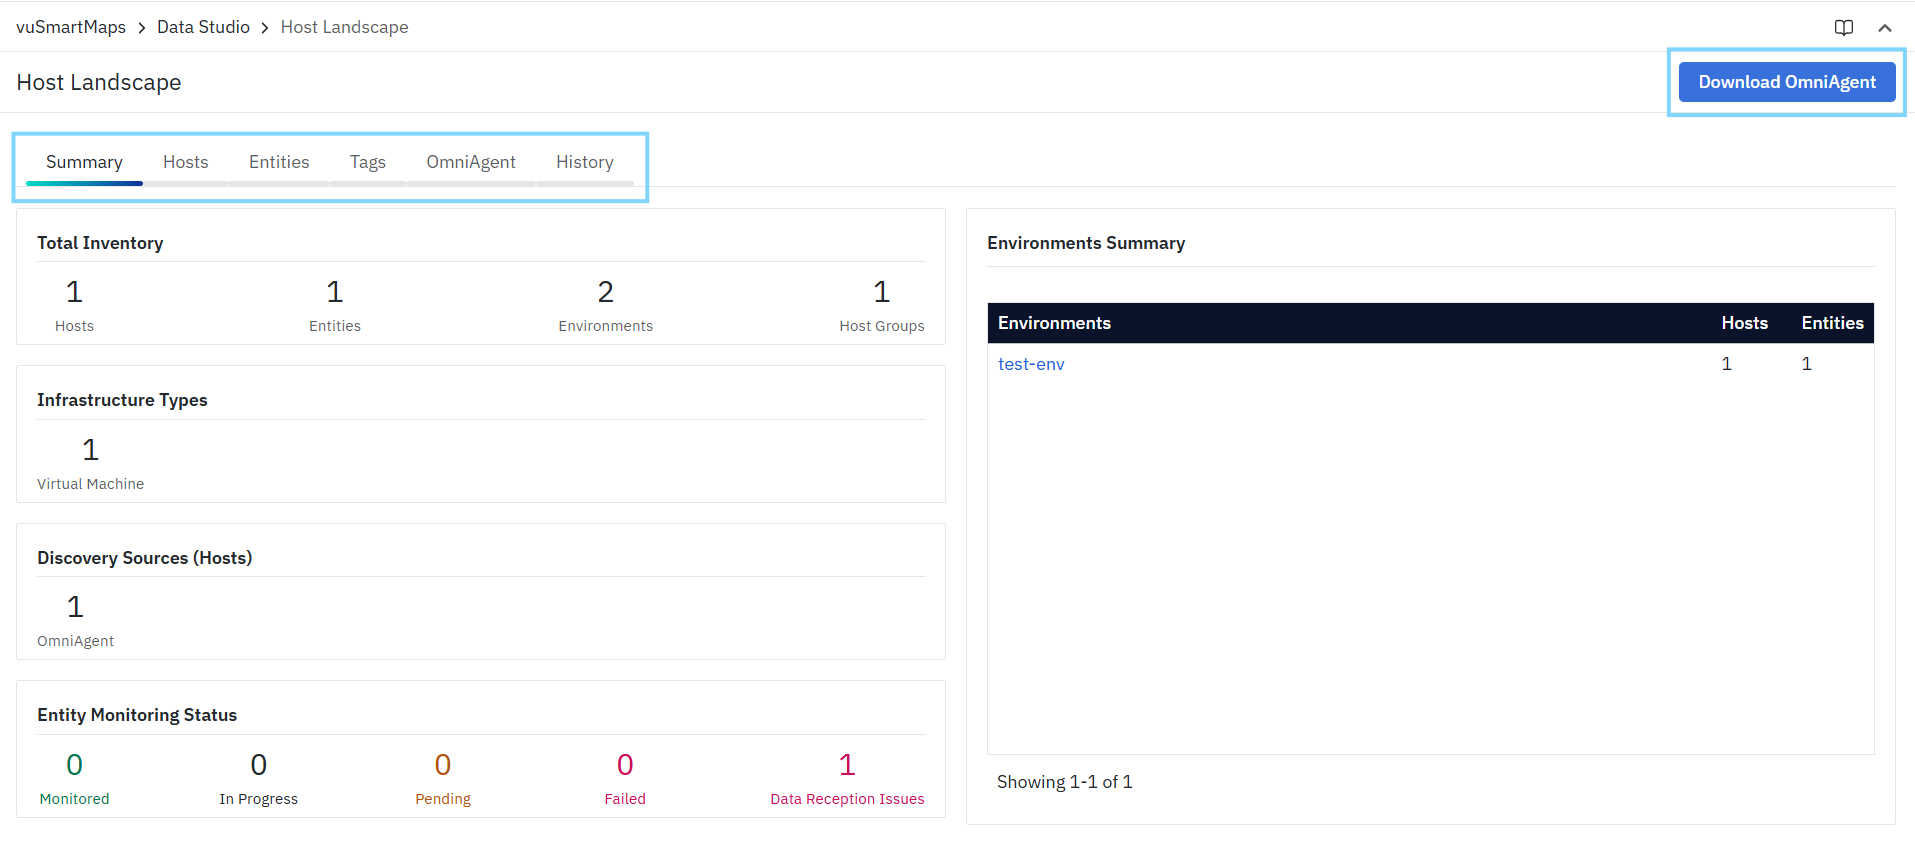
Using Host Landscape, users can: Using Host Landscape, users can:

  • View hosts and monitored entities discovered by ADI across environments (manually onboarded hosts and entities are not displayed).
  • View hosts and monitored entities discovered by ADI across environments (manually onboarded hosts and entities are not displayed).
  • Track onboarding and discovery progress.
  • Organize infrastructure using Environments and Host Groups.
  • Monitor overall monitoring coverage and asset health.
  • Review historical discovery and onboarding activities for operational analysis.

Host Landscape provides a centralized view of the entire discovery and monitoring lifecycle, enabling teams to manage infrastructure visibility more efficiently. For more details, refer to the Host Landscape documentation in the user guide.

OmniAgent​

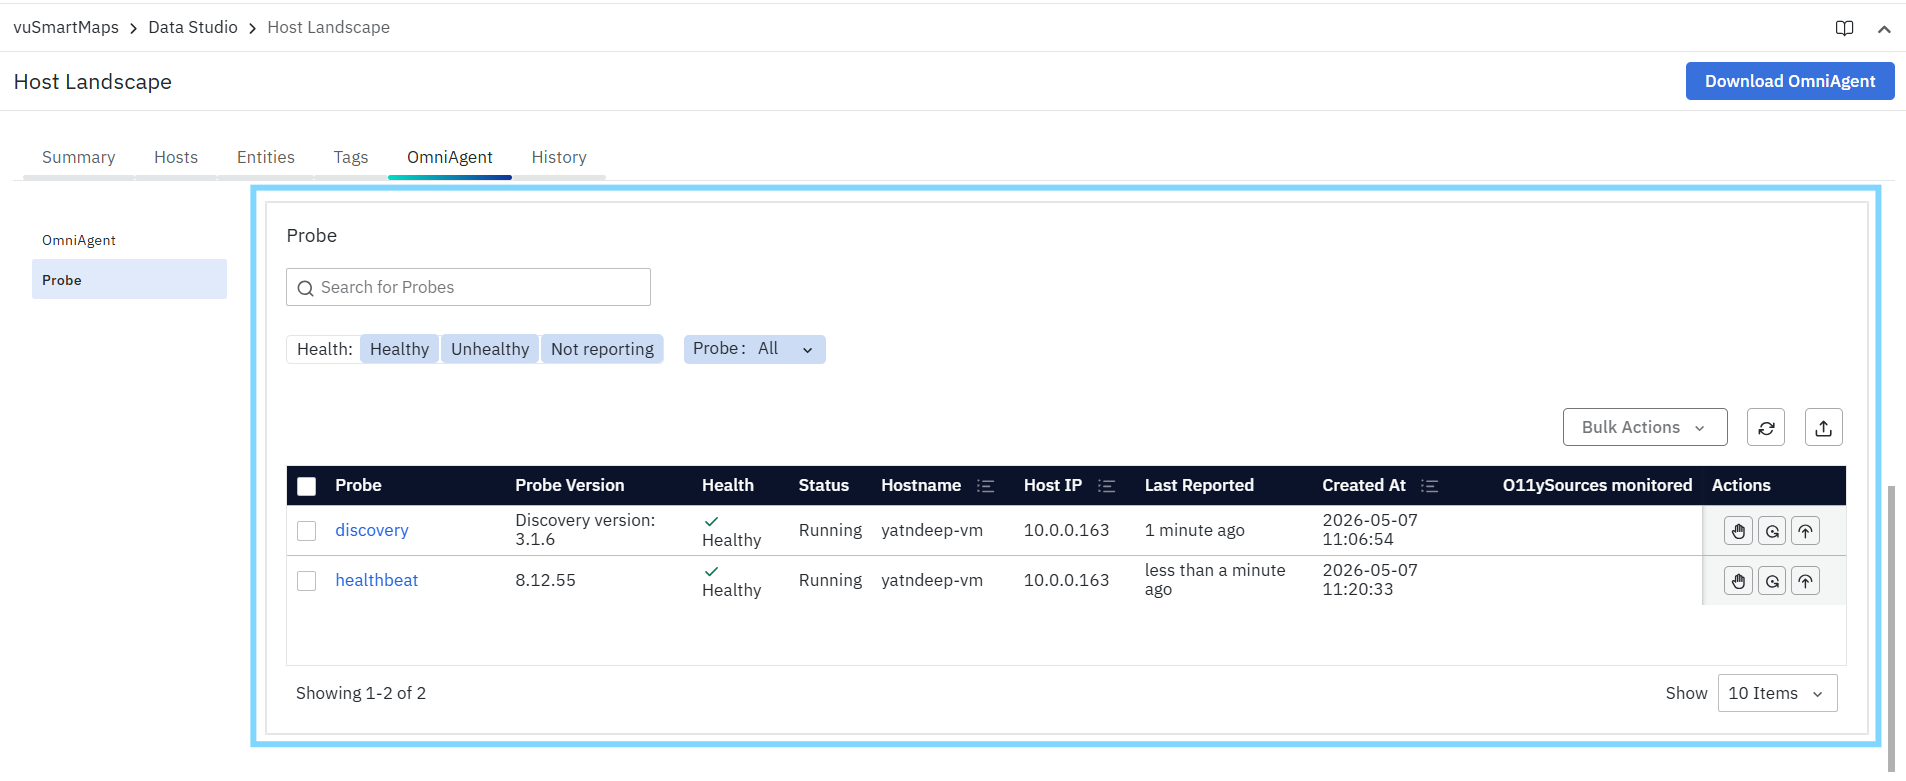
OmniAgent acts as the execution layer within the ADI framework and runs directly on monitored hosts to manage the monitoring probes responsible for data collection. When OmniAgent is installed, it includes the required monitoring components and automatically discovers supported technologies running on the host. Based on the discovery results, it deploys and manages the appropriate monitoring probes, enabling data collection and transmission to the vuSmartMaps platform.

Operating securely over TLS and based on centrally managed policies, OmniAgent continuously monitors probe health, applies configuration updates, performs automated recovery where required, and reports operational status back to the platform. The enhanced capabilities introduced in NG 3.1.0 further simplify host onboarding and reduce operational overhead by automating the discovery, deployment, and management of monitoring probes. OmniAgent acts as the execution layer within the ADI framework and runs directly on monitored hosts to manage the monitoring probes responsible for data collection. When OmniAgent is installed, it includes the required monitoring components and automatically discovers supported technologies running on the host. Based on the discovery results, it deploys and manages the appropriate monitoring probes, enabling data collection and transmission to the vuSmartMaps platform.

Operating securely over TLS and based on centrally managed policies, OmniAgent continuously monitors probe health, applies configuration updates, performs automated recovery where required, and reports operational status back to the platform. The enhanced capabilities introduced in NG 3.1.0 further simplify host onboarding and reduce operational overhead by automating the discovery, deployment, and management of monitoring probes.

Key capabilities include:

  • Automated deployment and management of monitoring probes.
  • Centralized lifecycle management for probes, including start, stop, restart, and upgrade operations.
  • Automatic synchronization of monitoring configurations.
  • Continuous health monitoring and self-healing capabilities.
  • Secure TLS-based communication with the platform.
  • Simplified onboarding through platform-generated installation workflows.

By centralizing probe management and configuration delivery, OmniAgent helps ensure consistency, reliability, and operational efficiency across monitored environments. For more details, refer to the OmniAgent documentation in the user guide.

Discovery Capabilities​

The discovery capabilities of OmniAgent automatically identify supported services, runtime components, processes, and infrastructure components running on onboarded hosts. OmniAgent continuously analyzes host environments and collects the information required to support automated discovery and monitoring workflows. As new services or runtime components are detected, the information is reported back to the platform, where ADI evaluates them for monitoring and instrumentation based on configured policies.

  • These discovery capabilities help eliminate the need for manual inventory creation and significantly reduce the effort required to identify and onboard new systems into observability workflows. By continuously discovering supported components, OmniAgent helps ensure that monitoring remains aligned with the actual state of the environment.
  • For more details about the discovery capabilities, refer to the OmniAgent documentation in the user guide.
Benefits​
  • Automatically discovers supported infrastructure, services, and runtime components.
  • Reduces manual onboarding and monitoring configuration effort.
  • Accelerates the time required to bring new systems under observability.
  • Provides centralized inventory and monitoring visibility through Host Landscape.
  • Improves monitoring coverage across dynamic and rapidly changing environments.
  • Simplifies operational management through automated and policy-driven workflows.
  • Enhances consistency by standardizing discovery, onboarding, and monitoring processes.
  • Provides a scalable foundation for future automation and intelligent observability capabilities.

O11ySources​

NG 3.1.0 introduces important enhancements to O11ySources to improve visibility, simplify management, and provide better operational control during data source onboarding and monitoring.

Key Enhancements​

Grid View and Table View Support

The O11ySources tab now supports two views:

  • Grid View (Tile View): Provides the existing visual overview of all O11ySources with quick status visibility.
  • Table View: Introduced as an additional view to provide more operational details for each O11ySource in a structured tabular format.
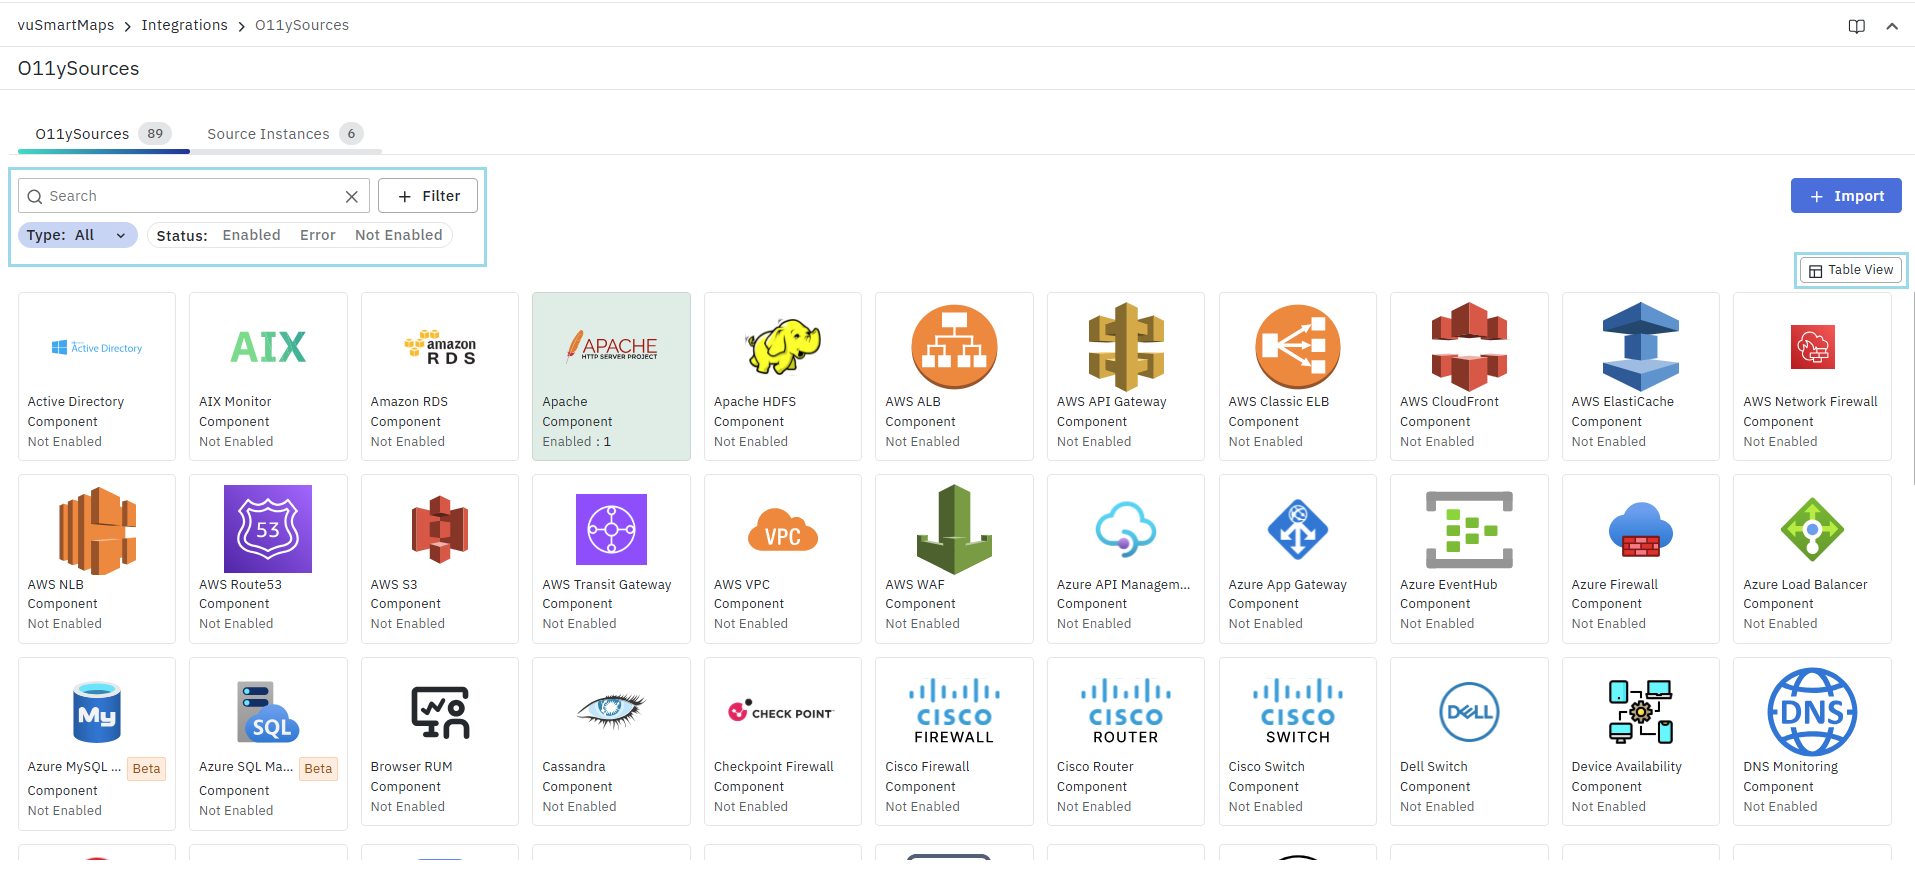
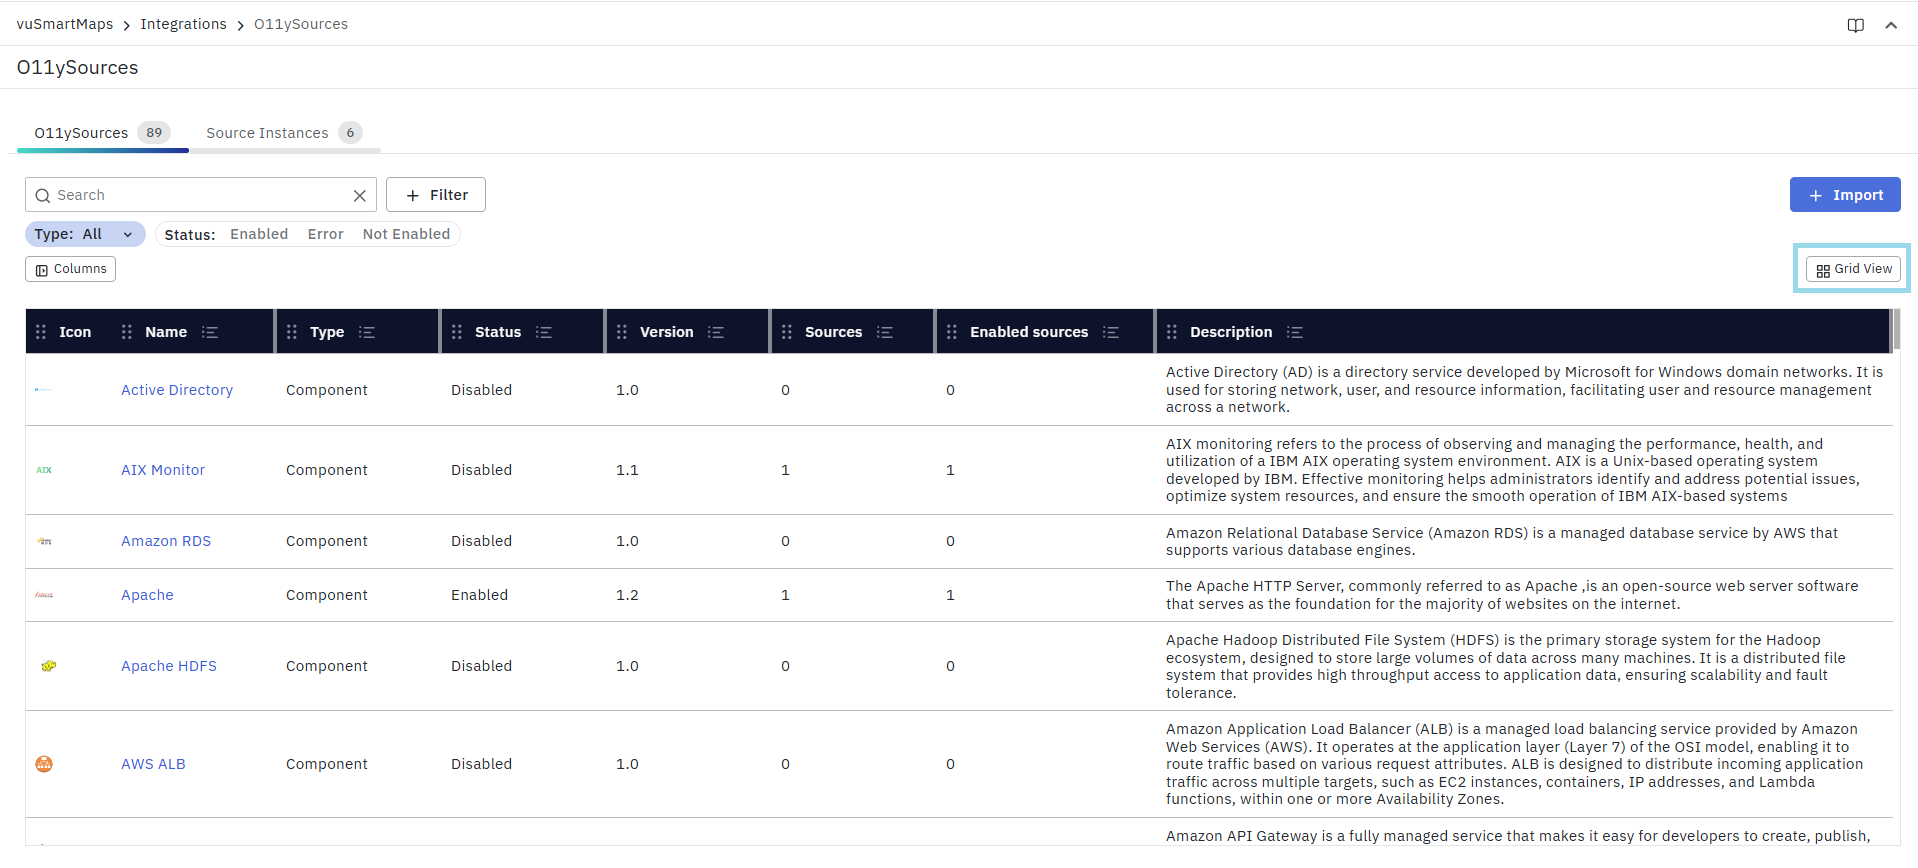
The Table View allows users to view additional information, such as:

  • O11ySource version
  • Number of configured Source Instances
  • Status visibility
  • Sortable columns
  • Customizable column display

This helps users monitor and manage O11ySources more efficiently, especially in larger environments.

Source Instances View

A new Source Instances view has been introduced to provide a centralized, flattened view of all configured source instances across O11ySources in a single screen.

This view helps users:

  • See all configured source instances in one place
  • Monitor configuration status and data reception visibility
  • Quickly identify operational issues across configured instances
  • Manage source instances more efficiently without navigating into each O11ySource

For grouped O11ySources, the configured instances are flattened and displayed in this unified view, making it easier to monitor all underlying source instances at the device or endpoint level.

Multiple Data Collection Modes

O11ySources now supports multiple data collection methods, including:

  • OmniAgent-based collection
  • Remote collection
  • Manual collection

This provides greater flexibility to support different deployment and onboarding requirements.

Enhanced Bulk Import & Export
Structured spreadsheet-based import and export workflows now support:

  • Add
  • Update
  • Delete
  • Bulk configuration changes with validation

This reduces manual effort and improves scalability for large-scale onboarding.

Structured 3-Step Configuration Workflow

The O11ySource configuration flow now follows a guided 3-step process:

  • Add
  • Configure
  • Review

This improves clarity during setup and helps reduce configuration errors.

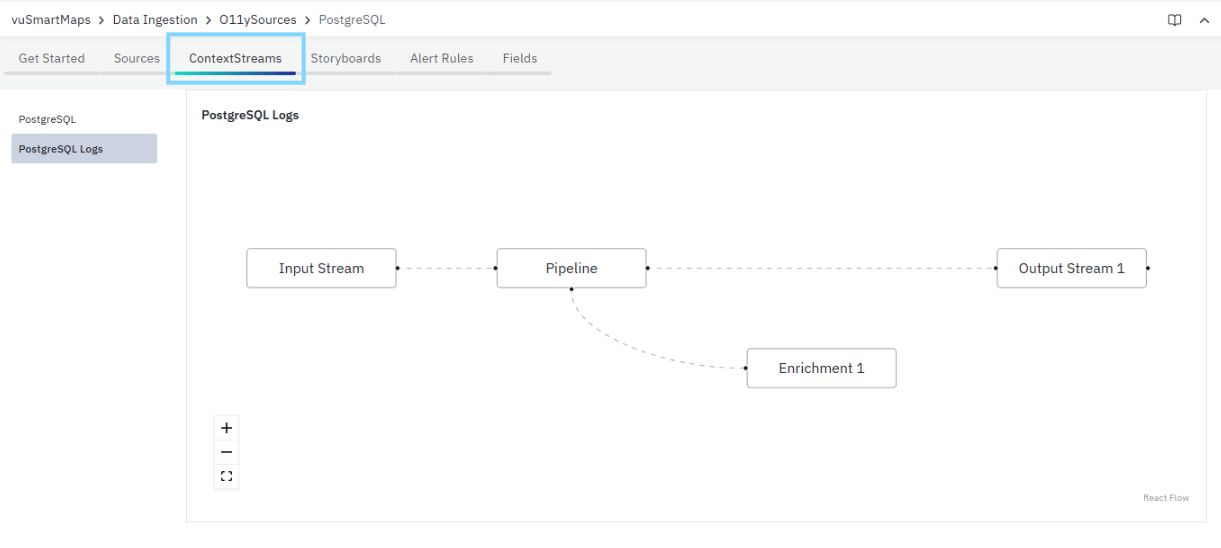
Enhanced ContextStreams Visualization

The ContextStreams flow view within O11ySources has been improved with better layout spacing and a cleaner visual structure. A left-side menu is now available to easily navigate and view pipelines within the flow.
YAML Editor in O11ySource Wizard

The O11ySource Wizard now supports a YAML editor, allowing users to view and update configurations directly within the wizard. This simplifies configuration management and provides greater flexibility during setup.

For more details, refer to the O11ySources documentation in the user guide.

Benefits​

  • Improved Visibility: Grid and Table views provide both a visual overview and a more detailed operational view of O11ySources.
  • Better Operational Control: Table View helps users monitor additional O11ySource details such as version, status, and Source Instance counts in a structured format.
  • Centralized Source Monitoring: The Source Instances view provides a single-screen, flattened view of all configured source instances, including configuration and data reception status.
  • Improved Manageability for Grouped O11ySources: Flattening grouped O11ySources into the Source Instances view makes it easier to monitor underlying devices or endpoints.
  • Deployment Flexibility: Multiple data collection modes support different onboarding and deployment requirements.
  • Reduced Manual Effort: Bulk import/export, guided configuration workflows, and in-wizard YAML editing simplify setup and configuration management.

Application Workbench​

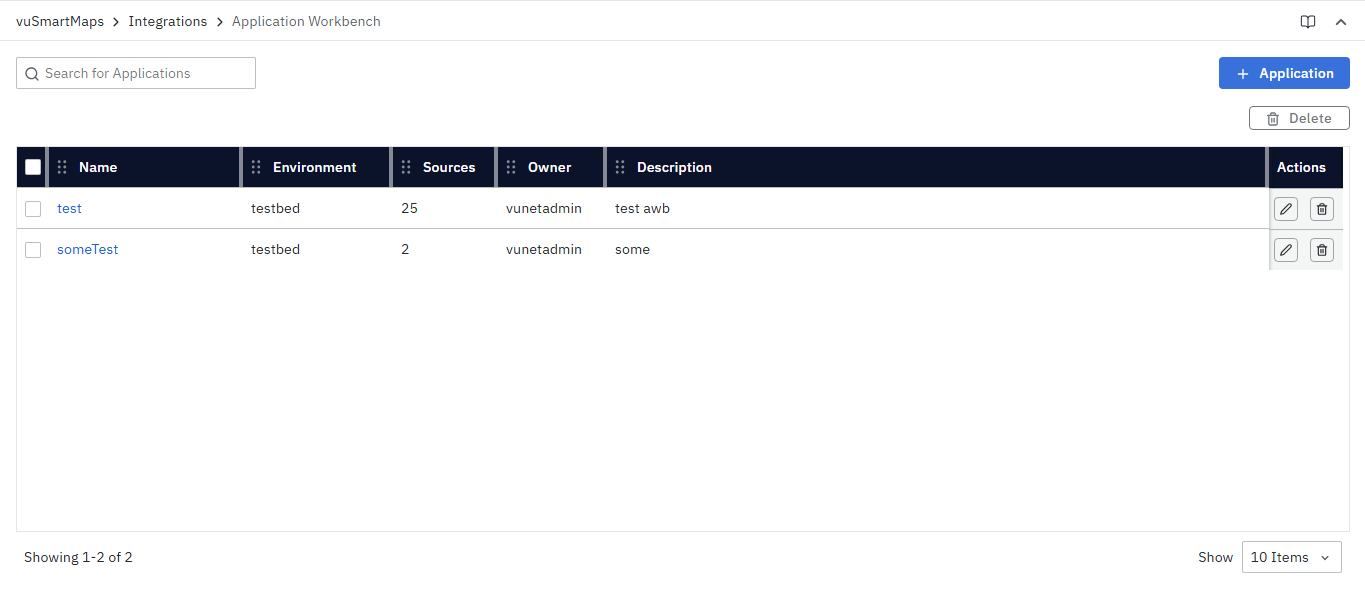
  • NG 3.1.0 introduces Application Workbench, a new business-centric modeling module that enables users to create logical applications by grouping observability sources and Source Instances into a single business context. Rather than viewing infrastructure as individual servers, databases, APIs, or services, Application Workbench allows teams to organize and manage these components as logical business applications, providing a more application-centric view of the monitored environment.
  • Application Workbench builds on existing O11ySources and Source Instances without collecting data directly. Users can define application metadata, associate relevant Source Instances, and create reusable application models that simplify monitoring and operational visibility. Future enhancements will integrate these logical applications with Alerts, Dashboards, and targeted data filtering to deliver a more contextual observability experience.
  • NG 3.1.0 introduces Application Workbench, a new business-centric modeling module that enables users to create logical applications by grouping observability sources and Source Instances into a single business context. Rather than viewing infrastructure as individual servers, databases, APIs, or services, Application Workbench allows teams to organize and manage these components as logical business applications, providing a more application-centric view of the monitored environment.
  • Application Workbench builds on existing O11ySources and Source Instances without collecting data directly. Users can define application metadata, associate relevant Source Instances, and create reusable application models that simplify monitoring and operational visibility. Future enhancements will integrate these logical applications with Alerts, Dashboards, and targeted data filtering to deliver a more contextual observability experience.

For more details, refer to the Application Workbench documentation in the user guide.
Benefits​

  • Business-Centric View: Organize infrastructure components as complete applications instead of isolated systems.
  • Improved Impact Visibility: Quickly understand which business application is affected when a monitored source experiences issues.
  • Centralized Application Management: View, edit, and manage application-to-source mappings from a single interface.
  • Flexible Source Mapping: Associate one source instance with multiple applications where required.

Smart-Frames​

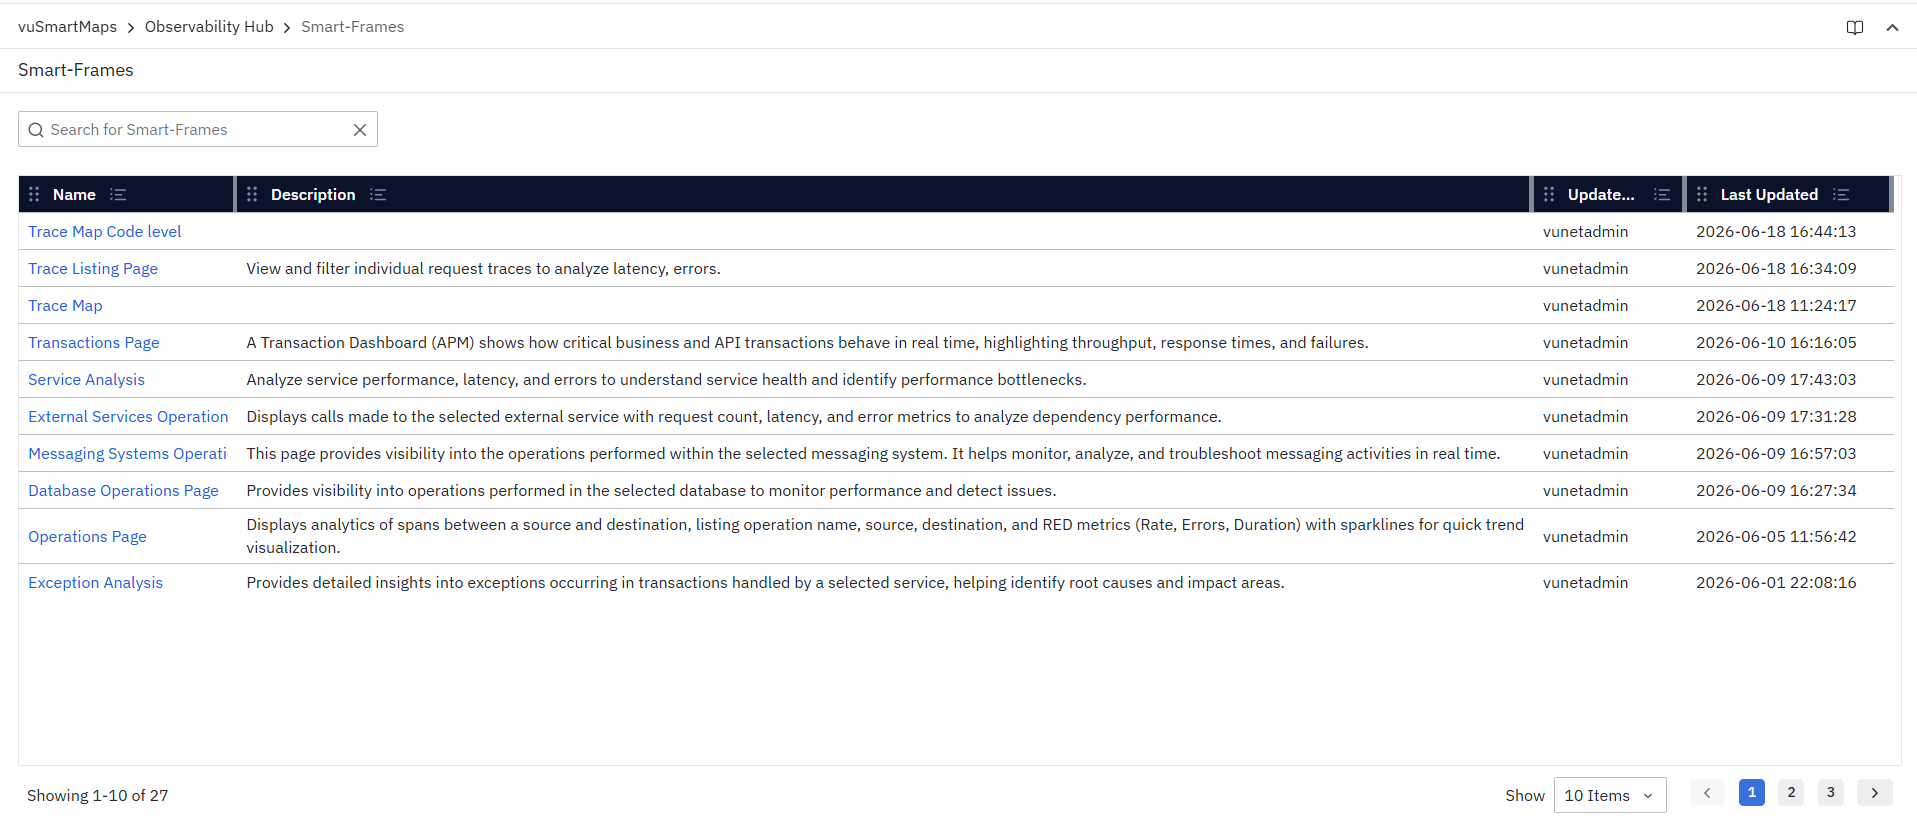
Smart Frames introduce a new way to create reusable operational workspaces that consolidate observability data, visualizations, insights, and navigation into a single unified dashboard. They enable teams to bring together multiple widgets, including KPI cards, trend charts, tables, service maps, service flows, dynamic insights, text widgets, and navigation links, to build context-aware dashboards for monitoring, troubleshooting, and operational analysis. Smart Frames allow users to access all relevant operational information from a single interface, reducing the need to switch between multiple dashboards or monitoring tools. Built-in filters, drill-down capabilities, panel interactions, and contextual navigation help users quickly investigate issues and move seamlessly between high-level summaries and detailed analysis. For more details, refer to the Smart-Frames in the user guide.
Benefits​

  • Provides a centralized operational workspace for monitoring and investigation.
  • Combines multiple visualizations, metrics, and insights into a single dashboard.
  • Enables faster root cause analysis through interactive drill-downs and contextual navigation.
  • Supports reusable dashboards for different operational and business use cases.
  • Improves collaboration by providing standardized monitoring views across teams.
  • Reduces dashboard switching and accelerates operational decision-making.

Smart-Frame Studio​

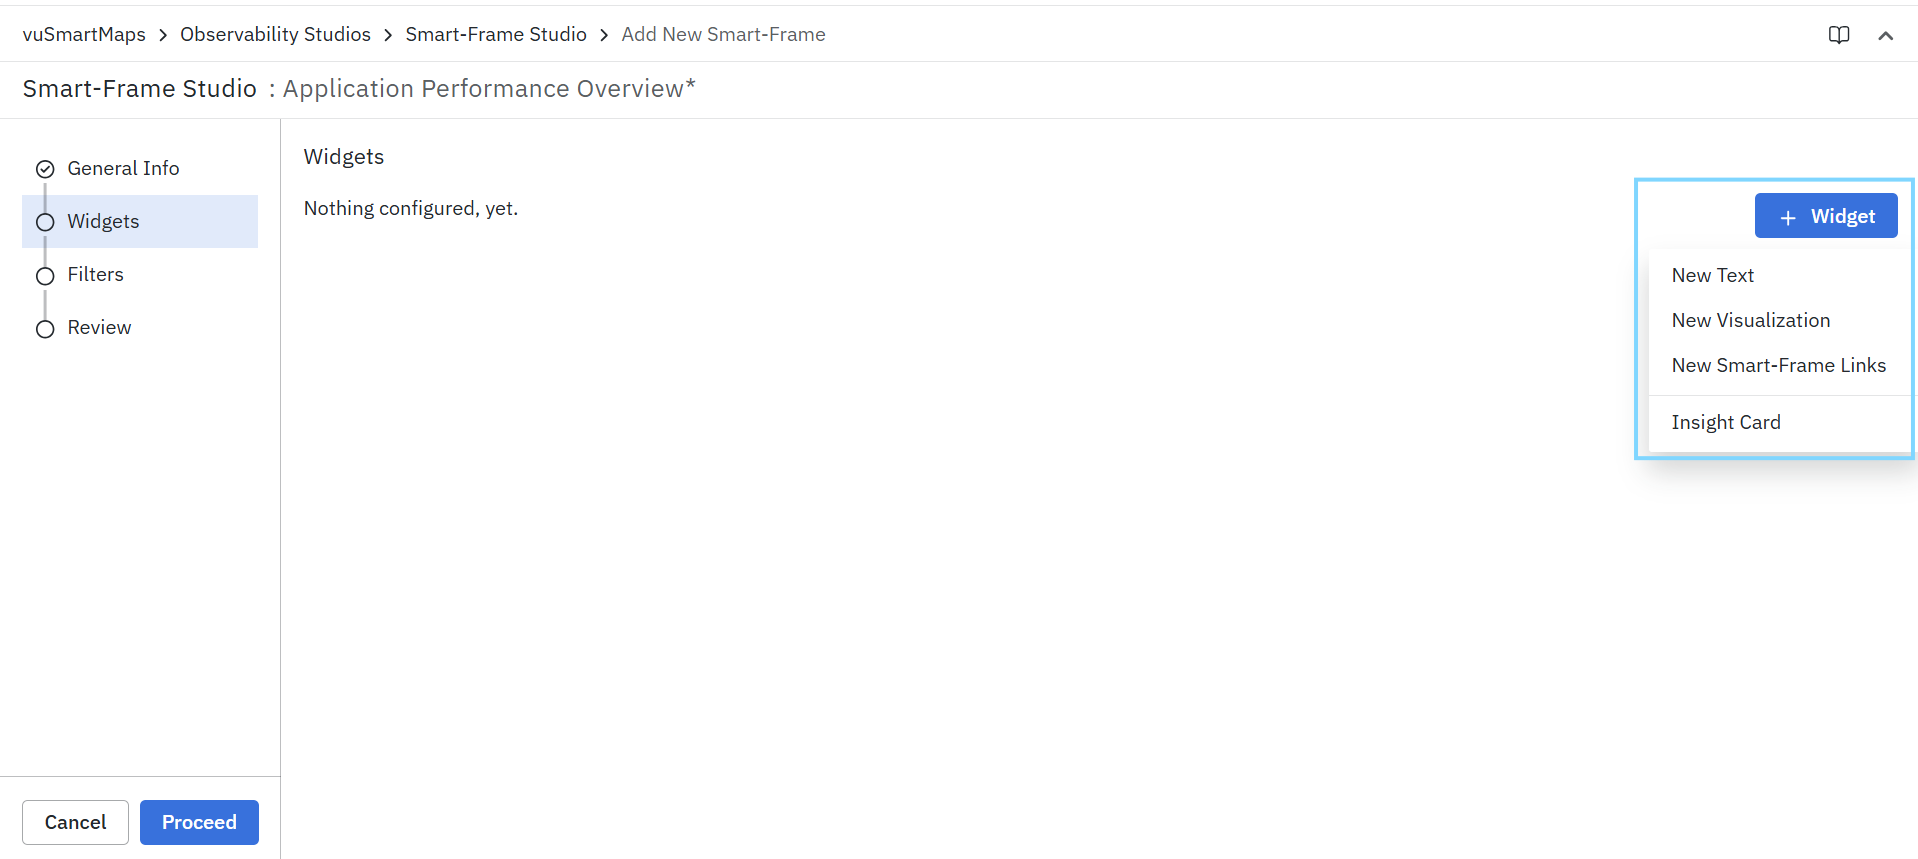
Smart Frame Studio is a new visual design and management workspace that enables users to create, configure, and maintain Smart Frames. It provides a guided workflow for defining dashboard metadata, adding widgets, configuring visualizations, applying filters, and reviewing configurations before publishing. The studio supports multiple visualization types, customizable widgets, advanced query building, threshold configurations, historical comparisons, formatting options, navigation links, and interactive data filters. Users can also preview Smart Frames before publishing, ensuring dashboards are validated and optimized for operational use. For more details, refer to the Smart-Frame Studio in the user guide. Smart Frame Studio is a new visual design and management workspace that enables users to create, configure, and maintain Smart Frames. It provides a guided workflow for defining dashboard metadata, adding widgets, configuring visualizations, applying filters, and reviewing configurations before publishing. The studio supports multiple visualization types, customizable widgets, advanced query building, threshold configurations, historical comparisons, formatting options, navigation links, and interactive data filters. Users can also preview Smart Frames before publishing, ensuring dashboards are validated and optimized for operational use. For more details, refer to the Smart-Frame Studio in the user guide.
Benefits​

  • Simplifies Smart Frame creation through an intuitive, guided configuration workflow.
  • Enables rapid development of customized operational dashboards without complex manual setup.
  • Supports reusable widgets, filters, and visualization configurations for consistency across dashboards.
  • Provides preview and validation capabilities before publishing Smart Frames.
  • Offers extensive customization for visualizations, thresholds, formatting, historical comparisons, and interactions.
  • Reduces dashboard development time while improving maintainability and standardization.

Alerts (NG Alert Engine)​

Introduction of the NG Alert Engine​

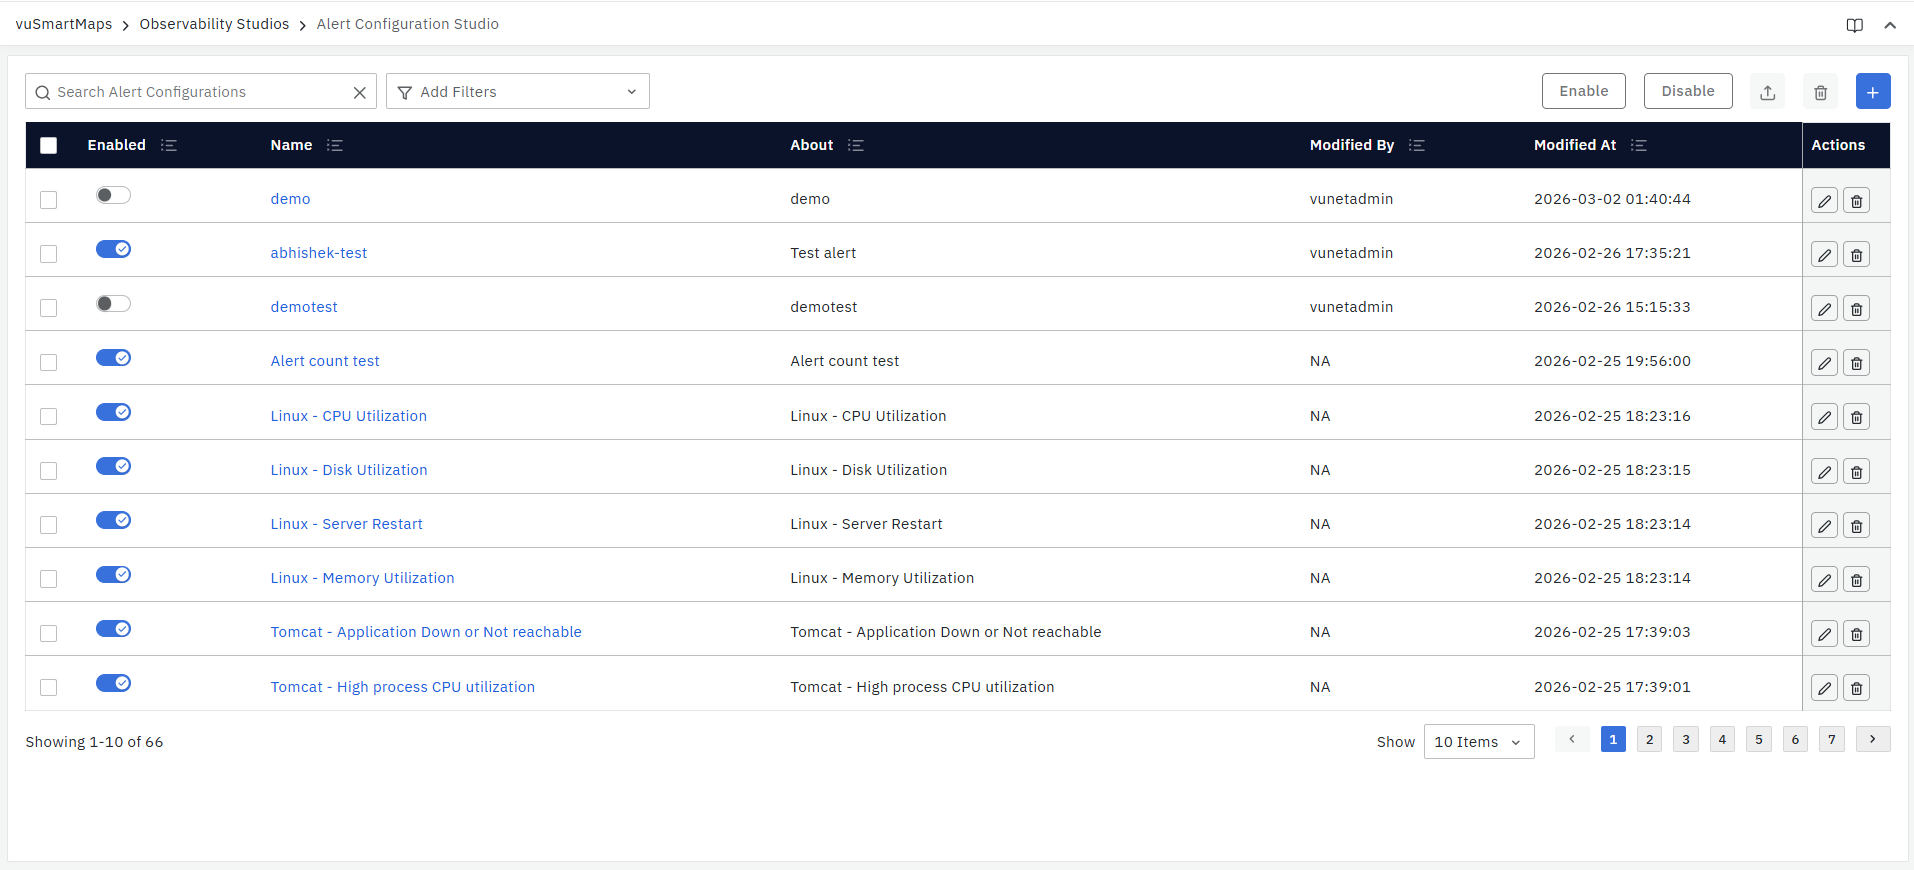
NG 3.1.0 introduces the NG Alert Engine, a new Go-based alerting framework designed to improve alert processing performance, scalability, and resource efficiency for large-scale monitoring environments. This new engine has been introduced to address the growing need for faster alert evaluations, better handling of high alert volumes, and a more scalable foundation for future alerting capabilities.

Along with the new engine, NG 3.1.0 also introduces a new and more structured alert configuration user interface through the Alert Configuration Studio. The updated UI provides a guided 7-step workflow to create alert rules in a clearer and more organized manner, making alert configuration easier to understand and manage.

A key part of this workflow is the definition of Alert Evaluation Conditions, where users can configure metrics, evaluation windows, and threshold logic that determine when an alert should trigger. Multiple conditions can be combined to build more precise and flexible alert rules.

As part of the transition to the new alerting architecture, both the existing Python-based alert engine and the new Go-based alert engine are currently supported. This allows a gradual migration path while the platform incrementally moves toward the new framework.

The NG Alert Engine also brings improved state handling, better consistency across notification channels, and enhanced configurability to support a wider range of technical and business alerting requirements. Alerts can continue to operate in both alarm and non-alarm modes and are centrally managed through the Alert Console for better visibility and control.

For more details, refer to Alert Configuration Studio (NG Alert Engine) in the user guide.
Benefits​

  • Improved Performance & Scalability: Faster and more efficient alert processing with a Go-based architecture.
  • Flexible Alert Logic: Supports advanced conditions, scripting, and dynamic configurations.
  • Reduced Alert Noise: Intelligent alarm state handling minimizes unnecessary notifications.
  • Enterprise-Ready Framework: Optimized to handle large volumes of alert rules with minimal resource usage.

PostgreSQL High Availability (HA)​

NG 3.1.0 introduces PostgreSQL High Availability (HA) support to improve database reliability and availability within the platform. This enhancement helps ensure that database services remain available even during failures, reducing downtime and improving overall platform stability.

  • With this update, the platform can automatically handle database failover and recovery more effectively, helping maintain continuous operations with less manual intervention. It also provides a more resilient database setup compared to a standalone deployment and supports a smoother transition from the earlier PostgreSQL setup to the new HA-based architecture.
  • This enhancement strengthens the database foundation of vuSmartMaps by improving service continuity, operational reliability, and recovery readiness.

For more details, refer to the PostgreSQL High Availability Configuration documentation.

Benefits​

  • Improved Availability: Helps keep database services available during failures.
  • Better Reliability: Provides a more resilient database setup for stable platform operations.
  • Reduced Downtime: Supports automatic failover and recovery to minimize service disruption.
  • Lower Manual Effort: Reduces the need for manual intervention during database issues.
  • Smoother Migration: Supports transition from standalone PostgreSQL to a more reliable HA setup.

Application Performance Monitoring (APM)​

NG 3.1.0 significantly enhances Application Performance Monitoring (APM) with improved dashboarding capabilities using Smart Frames, advanced telemetry standardization through APM Studio, and geographic enrichment of application telemetry. Together, these enhancements provide deeper visibility into application performance, improve troubleshooting efficiency, and enable teams to gain richer business and operational insights from distributed applications.

Enhanced APM Dashboards​

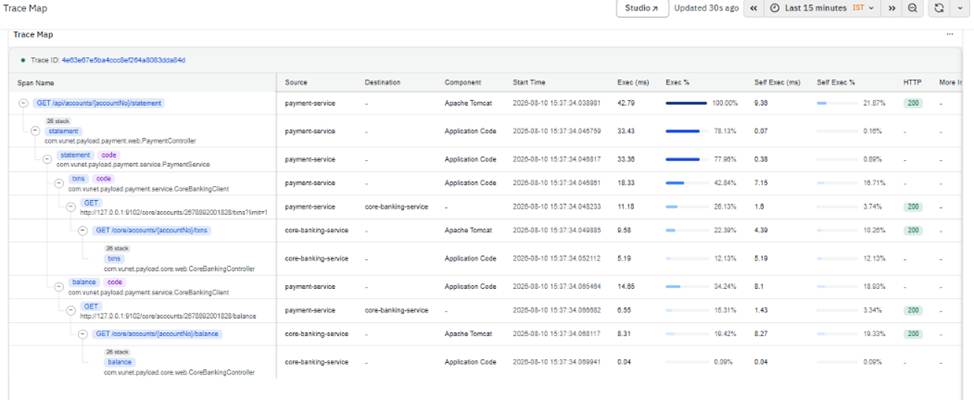
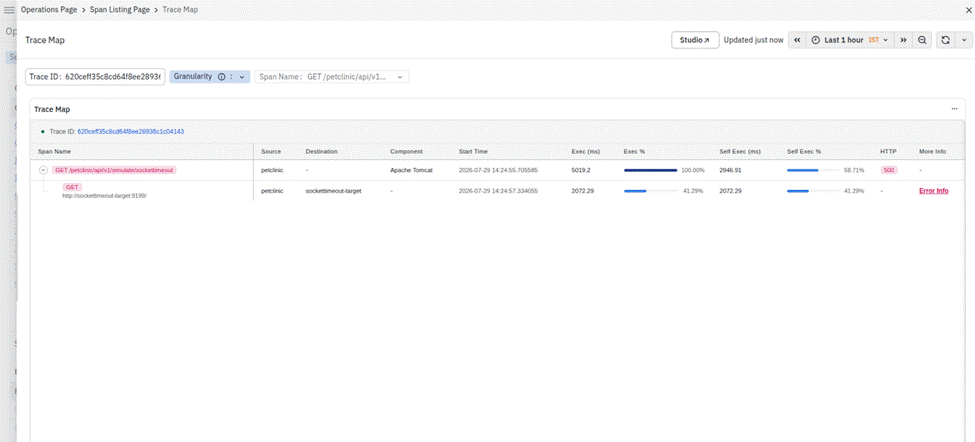
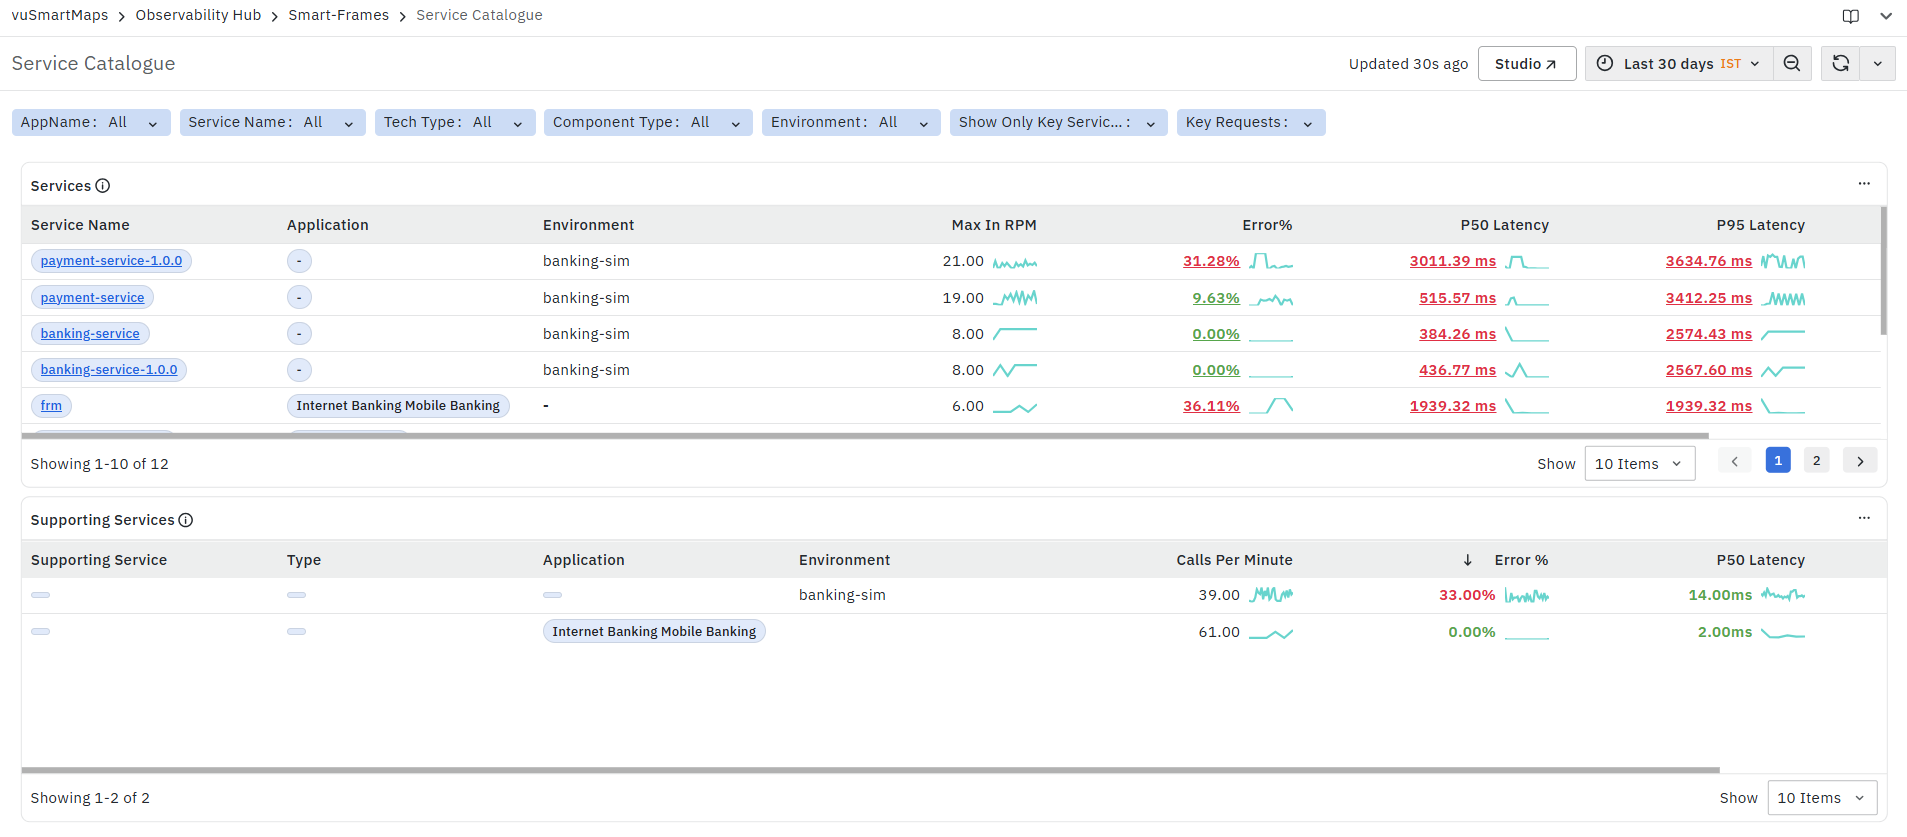
The APM dashboards have been redesigned using Smart Frames and enhanced to provide more meaningful visibility into application performance, service health, request behavior, and distributed transaction flows. The updated dashboards offer improved trace analytics, service-level insights, request performance monitoring, and failure analysis, enabling teams to quickly identify bottlenecks, performance degradations, and application issues.

The enhanced dashboards leverage standardized service, request, and operation naming while incorporating richer telemetry context, making application monitoring more intuitive and actionable. For more details, refer to the APM Documentation.
Benefits​
  • Improved visibility into service performance and application health.
  • Faster identification of performance bottlenecks and failure patterns.
  • Better correlation between services, requests, and distributed traces.
  • Enhanced troubleshooting and root cause analysis capabilities.
  • More meaningful business-aligned observability views.

APM Studio​

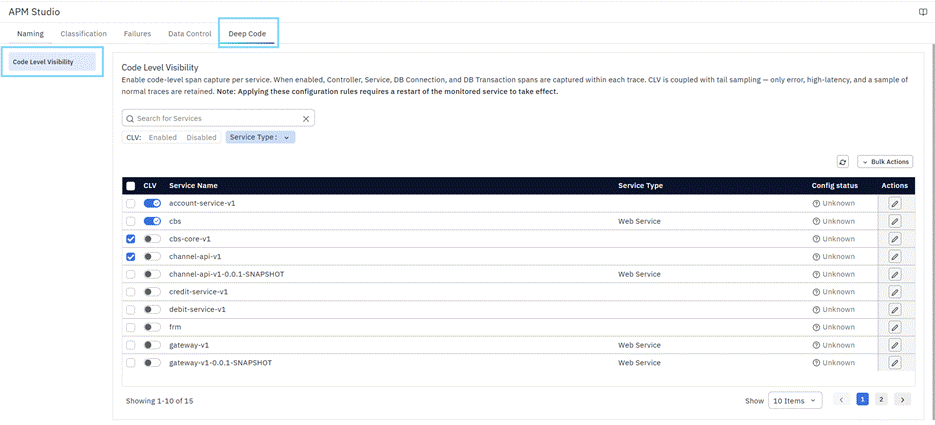
NG 3.1.0 introduces APM Studio, a centralized configuration workspace that enables organizations to standardize, classify, enrich, and control application telemetry before it is consumed by APM dashboards and analytics workflows. APM Studio helps transform raw telemetry into meaningful business context by providing centralized controls for service naming, request naming, operation naming, service classification, request classification, failure detection, and telemetry data governance. This ensures that application observability data accurately reflects business processes and operational requirements.

Key Capabilities

Naming

  • Configure naming rules for services, requests, operations, and supporting services.
  • Replace technical identifiers with business-friendly names for improved observability.

Classification

  • Classify services and requests based on business importance.
  • Prioritize critical services and transactions for monitoring and analysis.

Failure Detection

  • Define custom failure detection logic using protocol errors, exceptions, span status, and business-specific conditions.
  • Improve the accuracy of service health and failure analysis.

Data Control

  • Manage telemetry attributes using pruning, whitelisting, and masking policies.
  • Protect sensitive information and reduce telemetry noise.

For more details, refer to the APM Studio Documentation.

Benefits​
  • Improves telemetry consistency and data quality.
  • Enables business-centric observability.
  • Enhances monitoring, troubleshooting, and root cause analysis.
  • Provides greater control over telemetry processing and governance.
  • Reduces operational noise and improves analysis efficiency.

GeoIP Data Enrichment for Telemetry​

A new GeoIP processor has been introduced to enrich telemetry data with geographical information based on client IP addresses. This enhancement automatically adds location-related metadata such as country, city, and region to application traces and telemetry records. By enriching telemetry with geographic context, teams can better understand where requests originate, analyze application performance across different regions, and identify location-specific performance trends or issues.

Benefits​
  • Adds geographic context to application telemetry and traces.
  • Provides better visibility into user and request distribution.
  • Supports region-based monitoring and troubleshooting.
  • Enables location-aware performance analysis and reporting.

Anomaly Detection​

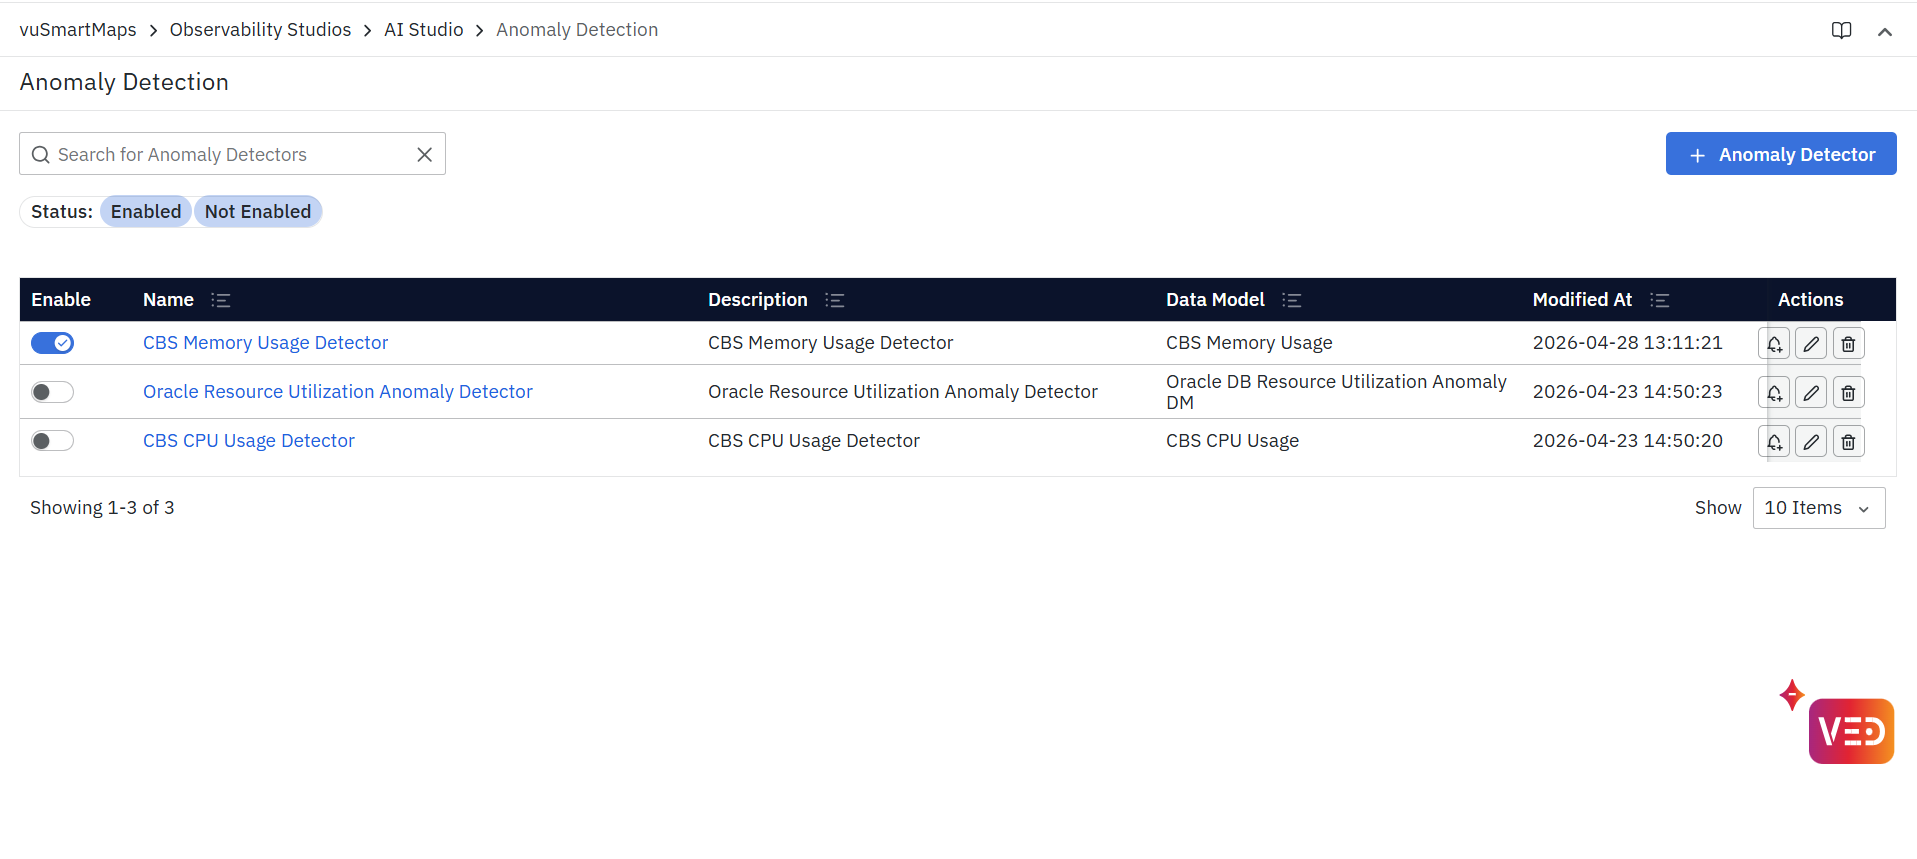
NG 3.1.0 introduces Anomaly Detection, an AI-driven capability that automatically identifies unusual behavior across applications, infrastructure, and observability metrics.

  • Unlike traditional threshold-based monitoring, Anomaly Detection uses adaptive forecasting models that learn historical behavior patterns and continuously adjust to changing system conditions.
  • The solution continuously monitors incoming metrics, detects unexpected deviations, and helps teams identify potential issues before they impact service reliability or user experience. Users can configure anomaly detectors for specific metrics and investigate detected anomalies through dedicated analysis views that provide contextual insights, anomaly trends, and correlation analysis.
  • Anomaly Detection also includes the Anomaly Explorer, which enables users to analyze anomalies across metrics, applications, journeys, and O11ySources, helping teams understand the scope, impact, and potential root causes of abnormal behavior.

For more details, refer to the Anomaly Detection documentation in the user guide.
Benefits​

  • Proactive Issue Detection: Identifies abnormal behavior before it develops into service-impacting incidents.
  • Adaptive Learning Models: Automatically learn normal behavior patterns and reduce dependency on static thresholds.
  • Faster Root Cause Analysis: Provides contextual insights, anomaly trends, and correlation analysis for quicker investigations.
  • Reduced Alert Noise: Minimizes false positives through intelligent anomaly detection and forecasting.
  • Scalable Monitoring: Supports anomaly detection across large and complex environments without extensive manual tuning.

Ved AI​

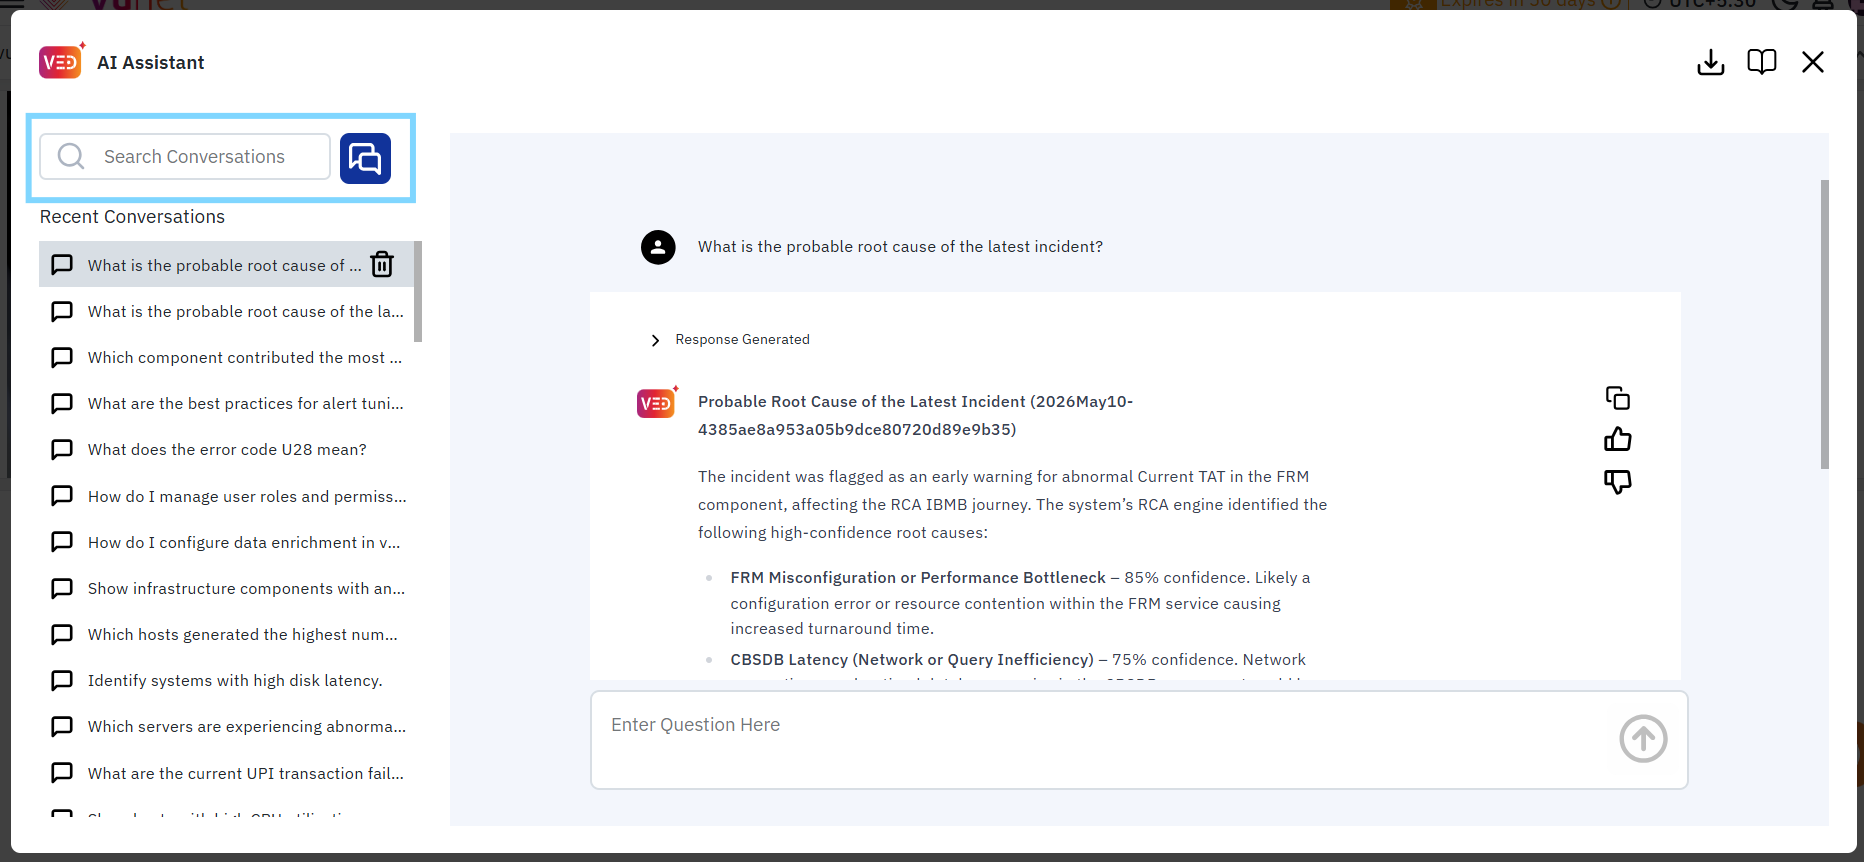
NG 3.1.0 introduces Ved AI, an AI-powered assistant for vuSmartMaps that simplifies incident investigation and alert analysis through natural language interactions.

  • Instead of manually navigating multiple dashboards and operational views, users can interact with Ved conversationally to investigate incidents, analyze alerts, identify trends, and perform guided root cause analysis.
  • Ved provides contextual insights, structured summaries, reasoning traces, and visualizations to help teams understand operational issues more quickly and make informed decisions. With support for multi-turn conversations and context-aware investigations, users can seamlessly continue troubleshooting workflows and explore operational data through an intuitive chat-based experience.
  • Ved also leverages MCP (Model Context Protocol) to securely access relevant operational data, improving response relevance and helping deliver accurate, explainable insights.

For more details, refer to the Ved AI documentation in the user guide.
Benefits​

  • Conversational Investigations: Analyze incidents and alerts using natural language queries.
  • AI-Assisted Root Cause Analysis: Accelerates troubleshooting through contextual insights and guided investigations.
  • Explainable Responses: Provides reasoning traces and supporting sources for improved transparency.
  • Interactive Operational Analysis: Supports multi-turn conversations and follow-up investigations.
  • Intelligent Data Access: Uses MCP-based integrations to retrieve relevant operational information securely.

Platform Configurations​

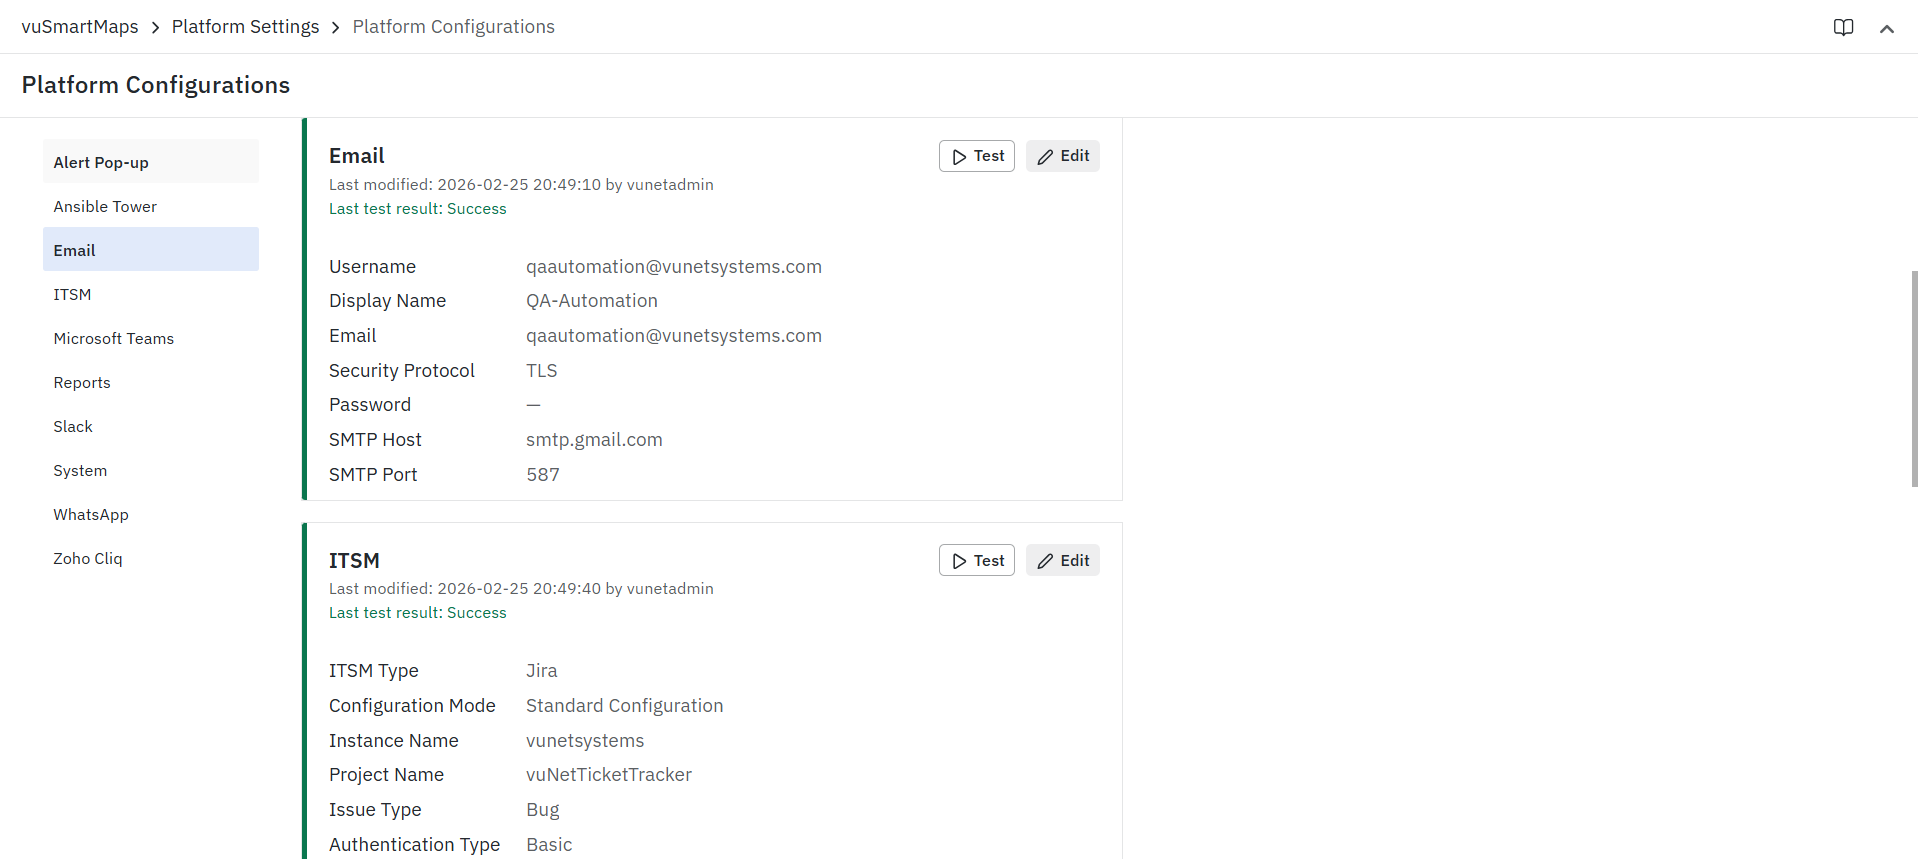
  • The module previously known as "Configurations and Preferences" has been renamed to "Platform Configurations" to align with updated terminology and improve clarity across the platform.
  • In addition, the Quick Links section in this module has been redesigned for a cleaner, more structured layout. The updated design enhances panel presentation, improves active card highlighting, and ensures better visual consistency.
  • Text handling has also been improved; long content is now truncated after four lines with a "Read More" option for full visibility, and tooltips appear only when text exceeds the available space. The label "View full JSON" has been simplified to "View JSON."

For more details, refer to Platform Configurations in the user guide.
Benefits​

  • Clearer Module Naming: Improved terminology for better platform-wide consistency.
  • Enhanced User Experience: Redesigned Quick Links and refined panel styling deliver a cleaner, more intuitive interface.
  • Better Content Accessibility: Expandable content and contextual tooltips ensure important information remains accessible without cluttering the UI.

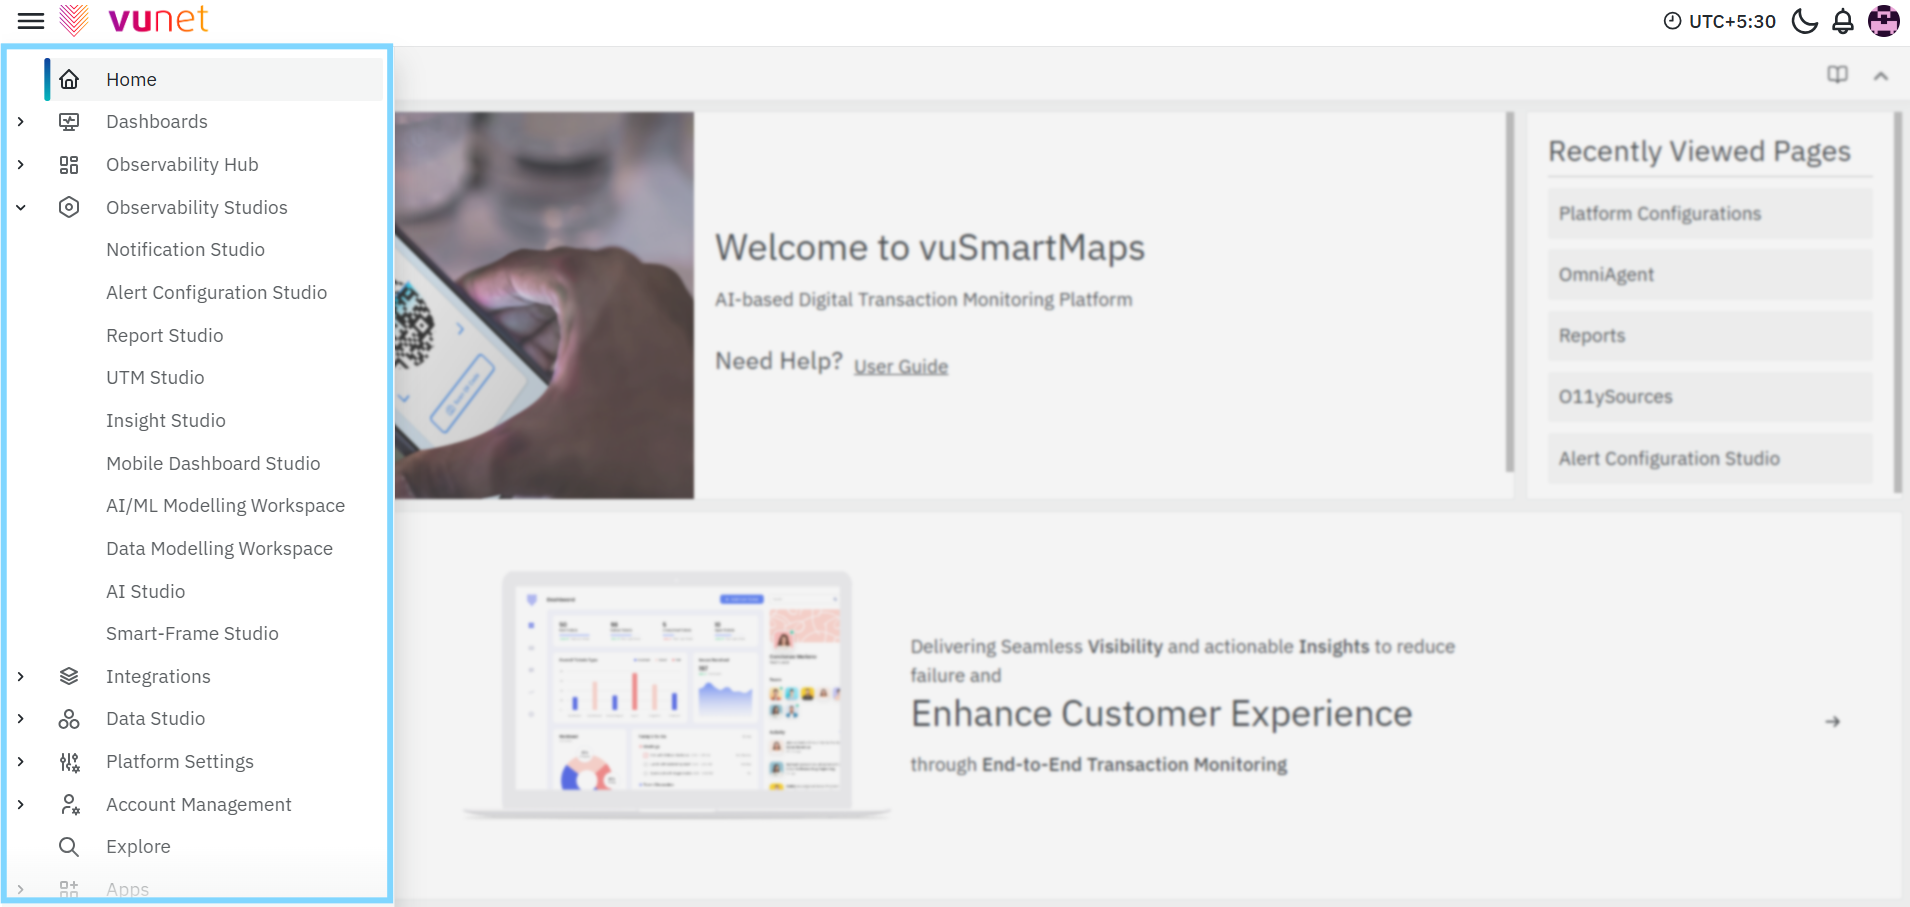
The Main Menu has been reorganized in NG 3.1.0 to provide a clearer and more structured navigation experience. Menu sections have been renamed, reordered, and recategorized to better group related capabilities under refined sections such as Observability Hub, Observability Studios, Integrations, Data Studio, and Platform Settings. In addition to the structural reorganization, individual sections have been streamlined with updated grouping and alignment to reflect the latest platform enhancements. The overall hierarchy has been improved to ensure better logical flow and usability across the application.
Quick Module Search with Ctrl + K

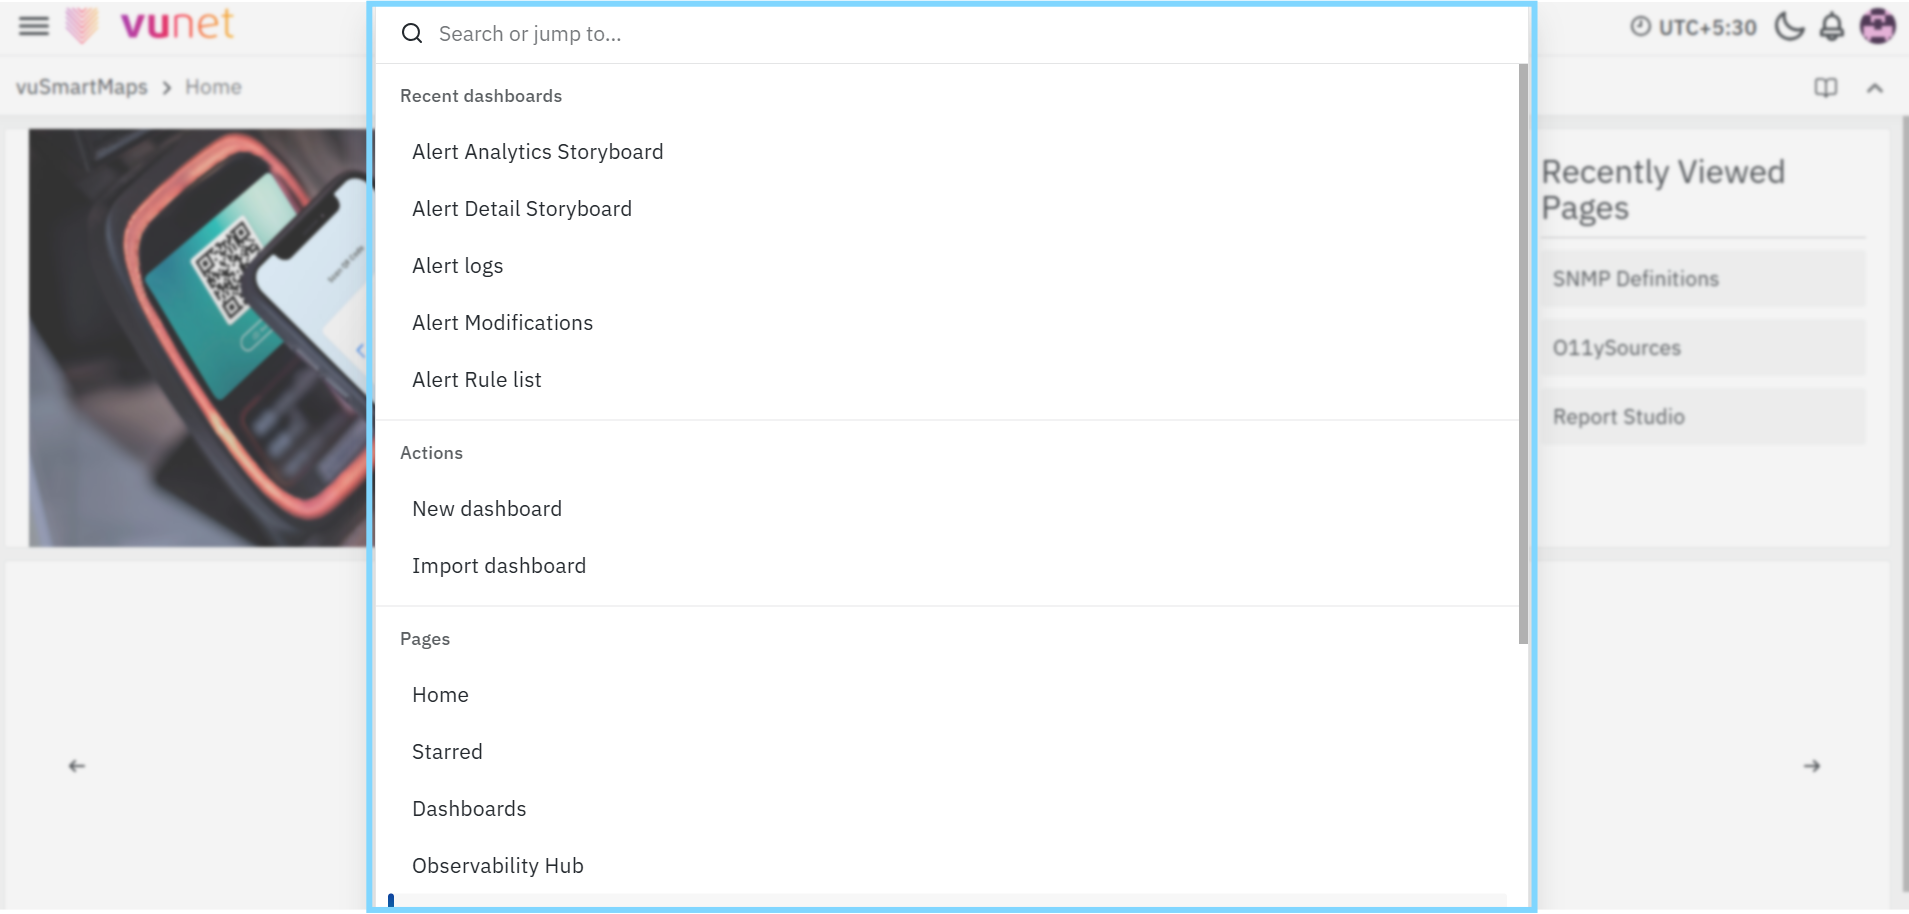
To help users navigate faster, NG 3.1.0 also provides a quick search option for modules. Users can press Ctrl + K to open the search interface and directly search for the required module, making it easier to quickly access specific areas of the platform without navigating through the full menu structure.
Benefits​

  • Clearer Navigation Structure: Logical regrouping of sections makes it easier to understand the platform layout.
  • Improved Module Organization: Related capabilities are grouped more intuitively under refined sections.
  • Better Usability: Streamlined hierarchy enhances overall navigation flow across the application.
  • Faster Module Access: Users can quickly search and navigate to specific modules using the Ctrl + K shortcut, reducing the need for manual menu navigation.

Data Explorer​

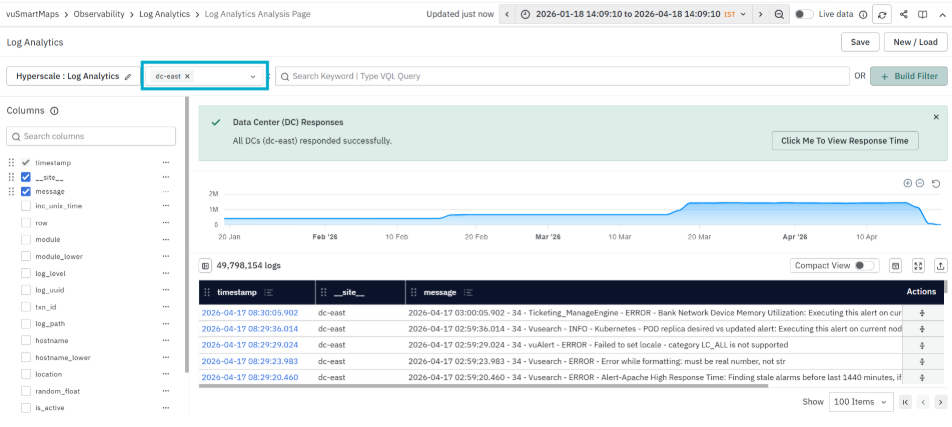
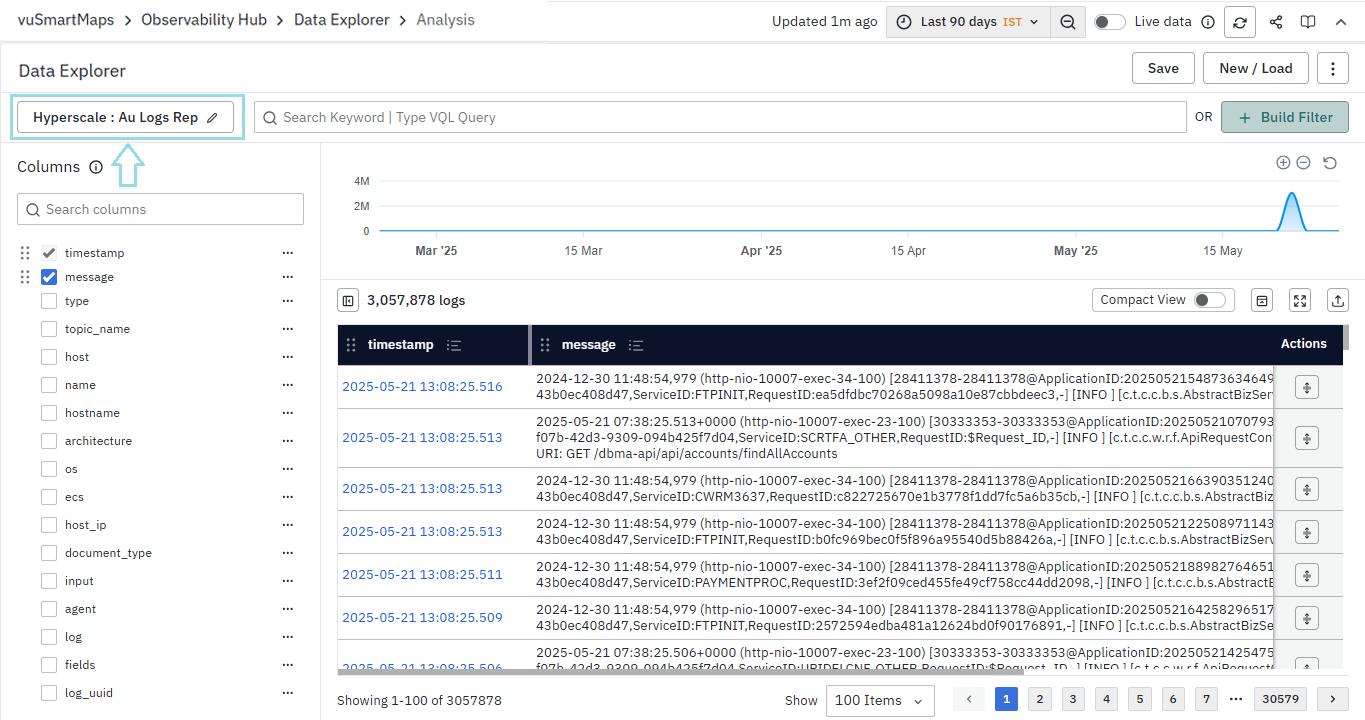
  • In NG 3.1.0, the earlier Log Analytics capability has been enhanced and expanded to support visualization and analysis of all types of data tables, not just log tables. To reflect this broader capability, Log Analytics is now presented as Data Explorer.
  • With this enhancement, users can now explore and analyze a wider range of datasets through a more flexible and unified interface.
  • Data Explorer allows filtering and sorting across all table columns and automatically selects the first four columns (alphabetically) as default-visible for better organization. The interface also adapts based on the dataset structure. If a dataset does not include a timestamp field, time-based features such as the Time Filter, Live Data toggle, and Trend Chart are automatically disabled.
  • A new option has also been added to view individual row details directly from the Data Table, improving record-level visibility during analysis.
  • In addition, performance optimizations have been introduced to improve large-scale data analysis. These include improvements to search efficiency, validation of horizontal scaling capabilities for better performance with large data volumes, and more efficient handling of searches involving IP address fields.

For more details, refer to the Data Explorer documentation in the user guide.
Benefits​

  • Expanded Data Exploration: Enables analysis and visualization of all types of data tables, beyond traditional log tables.
  • Unified User Experience: Brings broader table exploration capabilities under a single Data Explorer interface.
  • Improved Usability: Filtering, sorting, and default column selection make data analysis more efficient.
  • Context-Aware Interface: Automatically adjusts available features based on dataset structure.
  • Better Data Visibility: Allows users to view detailed information for individual records directly from the data table.
  • Improved Query Performance: Optimizations help process large volumes of data more efficiently, including better handling of IP-based searches.

VQL​

The following enhancements have been made to improve usability and flexibility in VQL:

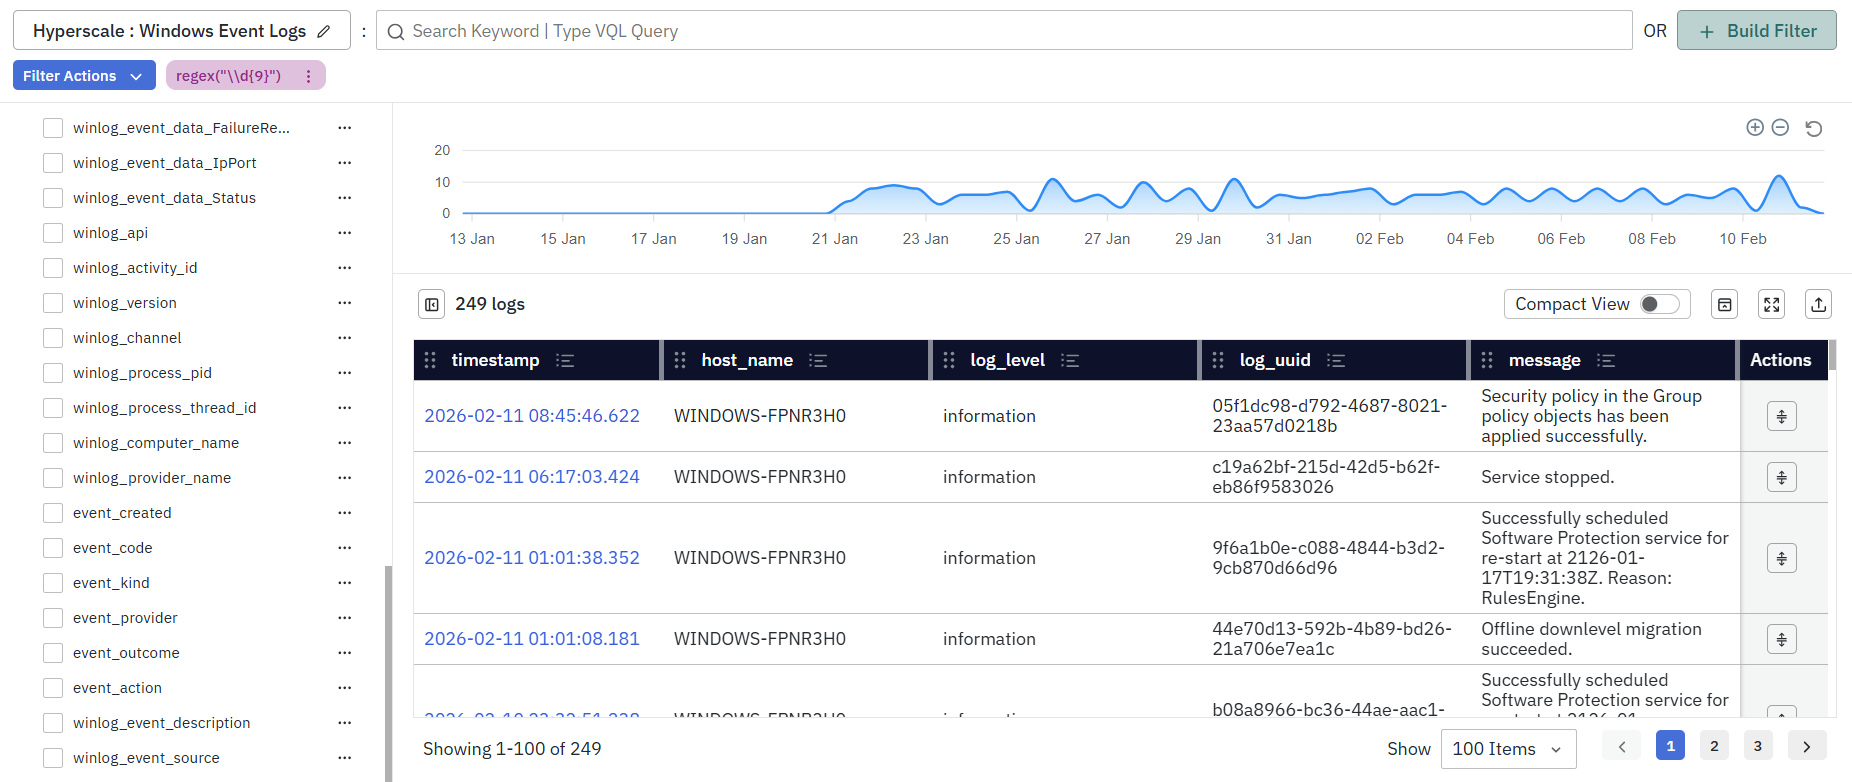
  • Improved Special Character Search Handling: VQL search now provides better guidance and validation when searching with special characters. Previously, entering special characters directly in token searches could result in generic errors. Users are now prompted to use quoted searches (" ") for such cases, and search behavior has been improved to ensure accurate and consistent results.
  • Enhanced VQL Support in Data Models: VQL can now be used more flexibly within Data Models to control query behavior at runtime without modifying the underlying SQL. Users can dynamically enable or disable specific parts of a query, adjust filtering, grouping, ordering, and aggregation logic, and build more adaptable Data Models while maintaining stability and consistency.
For more details, refer to the VQL documentation in the user guide.

Benefits​

  • Improved Search Experience: Clearer guidance and better handling of special character searches.
  • Reduced User Errors: Minimizes generic failures caused by incorrect search syntax.
  • Greater Query Flexibility: Enables dynamic control of Data Model behavior without manual query modifications.
  • Enhanced Usability: Simplifies runtime query customization while preserving stability.

ContextStreams​

The following enhancements have been made in NG 3.1.0 to improve debugging reliability and pipeline flexibility:

  • Debug pipelines are now automatically cleaned up if a user closes the browser tab during an active debug session, preventing unnecessary resource usage.
  • Block-level debugging has been corrected to display input events from the preceding block instead of incorrectly showing events directly from the Kafka topic.
  • A new Multiline Logs plugin has been introduced to handle logs that span multiple lines. It combines related log lines into a single event using simple patterns, making it easier to extract important information from large multi-line log data while keeping the original logs unchanged.
  • Enhancements have been made to the C24, KV, and XML plugins to improve log parsing and data extraction. The C24 plugin now supports multiple patterns for processing logs, while improvements to the KV and XML plugins help extract and process log data more accurately.
  • Increased JSON Upload Size for Debugging: In ContextStreams, the JSON file upload size limit for debugging has been increased from 1 MB to 5 MB. This allows users to upload larger JSON files for preview and validation during debugging, improving flexibility when testing and troubleshooting larger sample payloads.
  • Direct Topic Creation Without Mandatory Pipelines: Previously, in ContextStreams, a topic could not exist independently, and a Data Pipeline was always required. In scenarios where no transformation or enrichment was needed, users often had to create dummy pipelines only to enable data ingestion, which added unnecessary configuration overhead and additional resource usage.
    • With NG 3.1.0, users can now create topics without configuring a pipeline when no enrichment or processing is required. This reduces unnecessary load, simplifies setup, and makes data onboarding more efficient for straightforward ingestion use cases.
  • Improved Data Enrichment Processing: The data enrichment workflow in ContextStreams has been improved by moving the preprocessing step directly into the data ingestion layer. Previously, a separate preprocessing pipeline was used to convert incoming enrichment data into a usable format before it could be applied in ContextStreams pipelines. With this enhancement, the conversion is now handled within the data streaming framework itself, eliminating the need for the additional preprocessing pipeline and ensuring enrichment data is processed more reliably and efficiently before being used in pipelines.
  • GROK Plugin Enhancements: The GROK plugin in ContextStreams has been enhanced to improve overall performance and reliability during log parsing. Additional safeguards and usage recommendations have been introduced to guide users toward more optimized configurations, helping prevent inefficient pattern usage and ensuring smoother log processing.
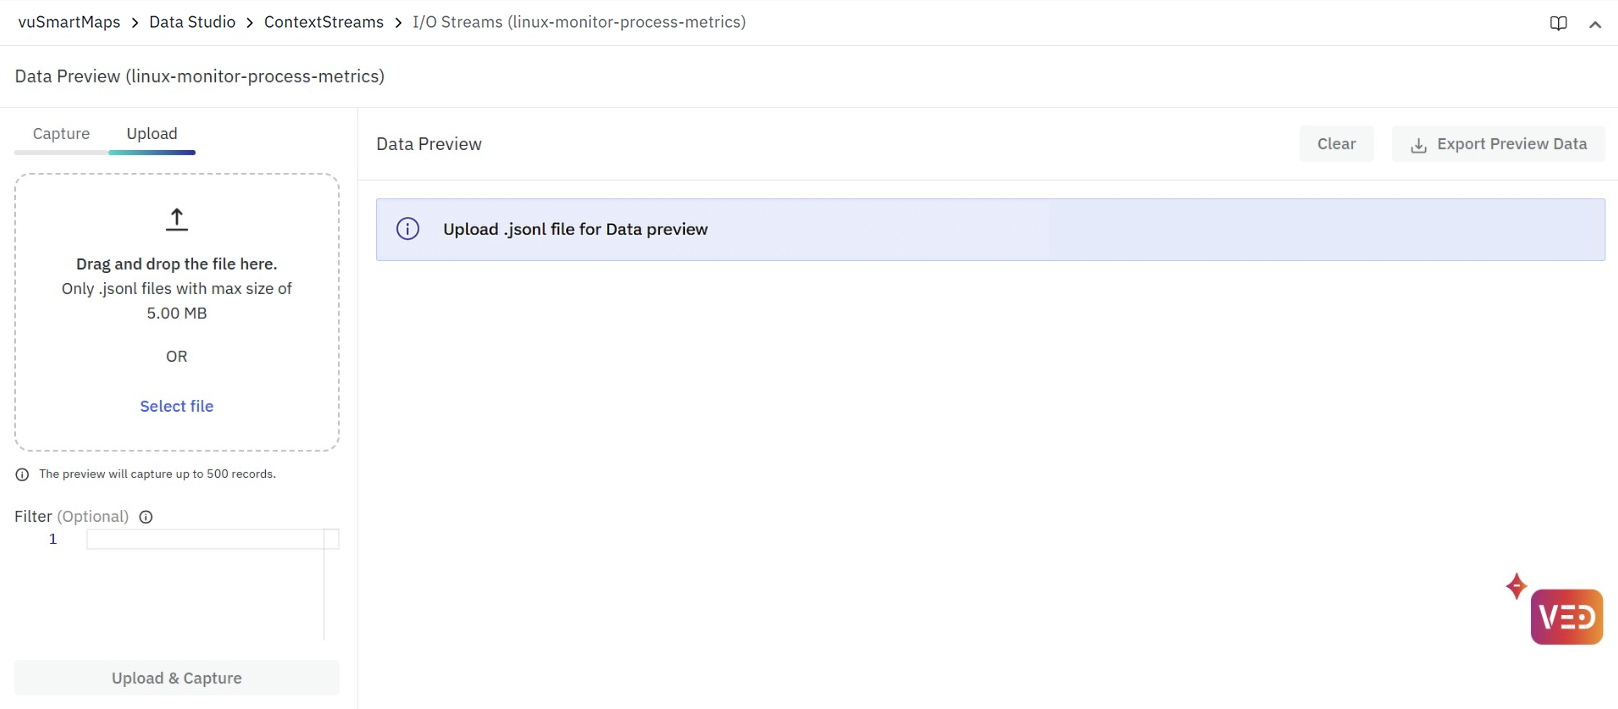
For more details on debugging capabilities, refer to Debugging ContextStreams in the user guide.

To learn more about available plugins, refer to the ContextStreams Plugin documentation.

Benefits​

  • Improved Resource Management: Prevents unused debug pipelines from consuming system resources.
  • Accurate Debugging: Ensures correct event flow visibility during block-level debugging.
  • Operational Flexibility: Simplifies data ingestion for O11ySources where transformation is not required.
  • Improved Log Processing: Supports handling multiple log formats more efficiently.
  • Enhanced Flexibility: Improved plugin capabilities support a wider range of log structures.
  • Improved Reliability: Eliminates dependency on a separate preprocessing pipeline that could fail or require manual restarts.
  • Simplified Architecture: Reduces the number of components involved in the enrichment workflow.

GSH Format Improvements - O11ySources​

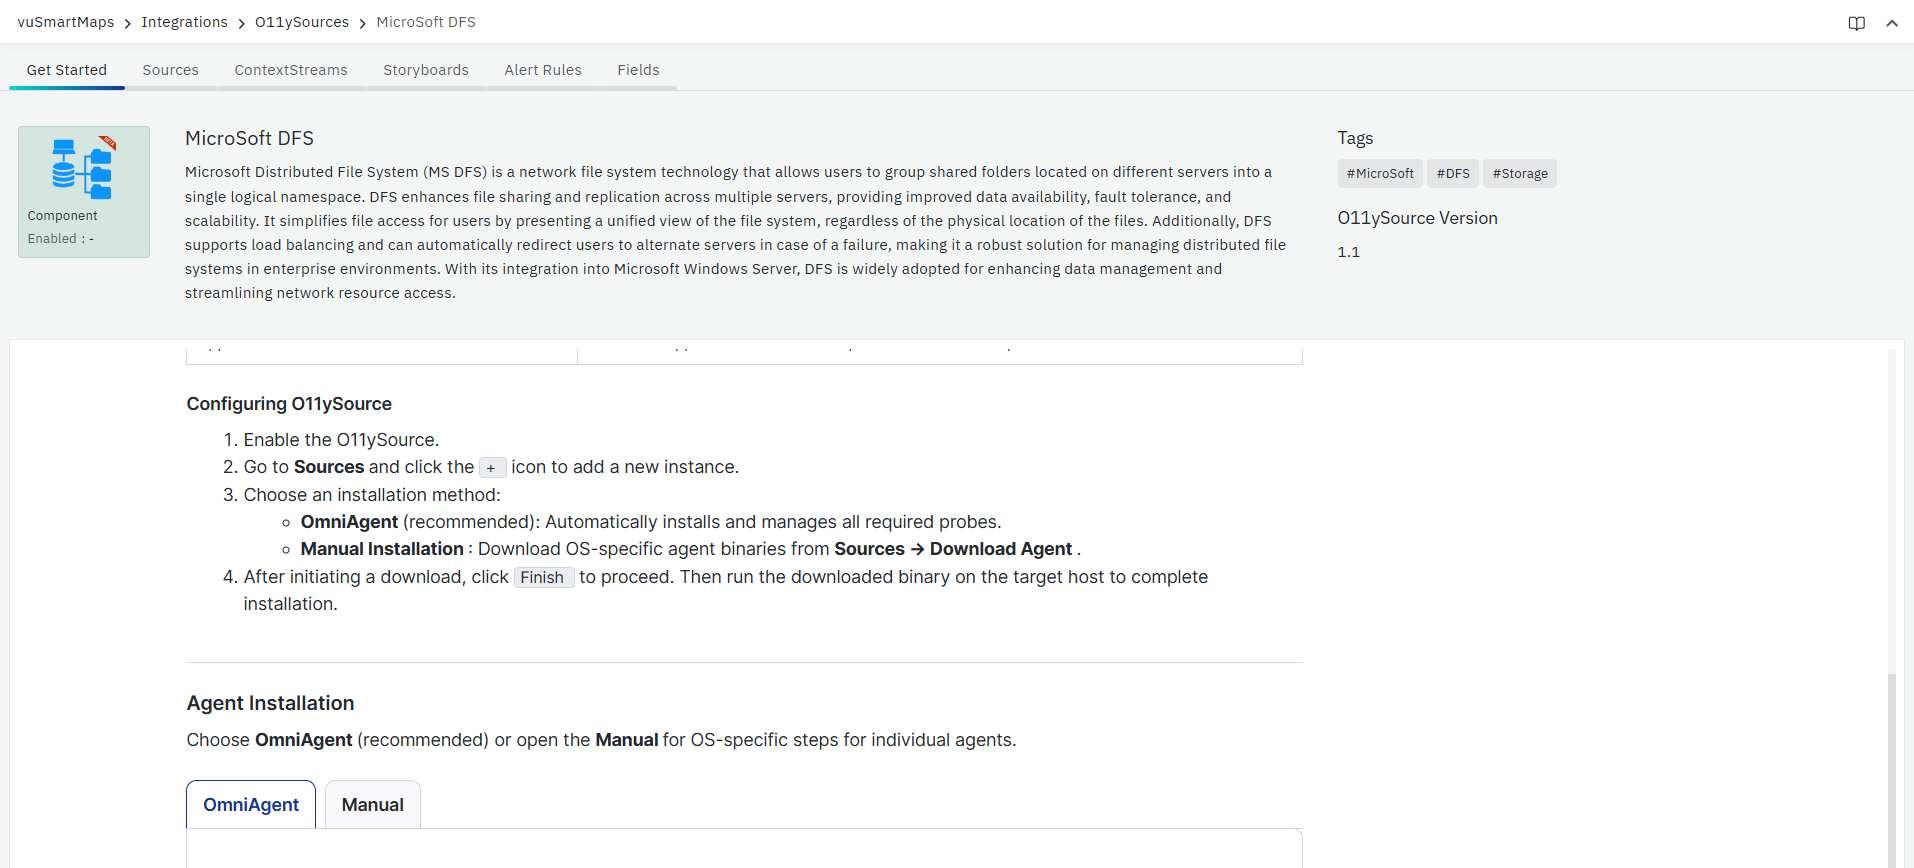
The GSH (Getting Started Help) format for O11ySources has been improved to provide a clearer and more structured user experience. The documentation layout has been refined with better styling and an improved section sequence, making it easier for users to understand the onboarding steps. Installation guidance has also been enhanced to include both OmniAgent-based installation and manual installation methods, allowing users to follow the setup process based on their deployment approach.

For more details, refer to the O11ySources documentation in the user guide.
Benefits​

  • Improved Readability: Better styling and structured layout make the guide easier to follow.
  • Clearer Installation Guidance: Users can now choose between OmniAgent and manual installation methods.
  • Better Onboarding Experience: Organized steps help users configure O11ySources more efficiently.

Dashboards​

Support for Business Chart (Volkov Labs Plugin)​

NG 3.1.0 introduces support for the Business Chart by Volkov Labs (ECharts) plugin in vuSmartMaps dashboards. This enhancement enables users to build dynamic, interactive, and highly customizable charts beyond the standard predefined visualization panels. The plugin adds significant value for business-centric and advanced analytical visualizations. With Business Chart support, users can design custom layouts, interactive visual elements, and advanced chart representations tailored to specific operational and business requirements. For more details on Business Chart, refer to Dashboards -> Business Chart in the user guide.
Benefits​

  • Advanced Visualization Capabilities: Build highly customizable and interactive charts.
  • Enhanced Dashboard Experience: Create dynamic business-focused visual representations.
  • Greater Flexibility: Go beyond standard panel limitations for complex visualization needs.

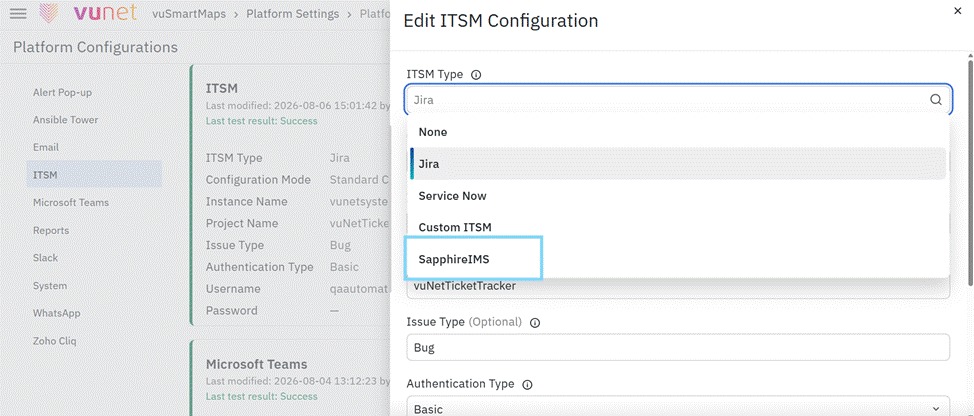
ITSM - Platform Configurations​

The following enhancements have been made to improve ITSM integration flexibility:

  • Added support for the PATCH method for ticket update operations. Previously, only standard methods such as GET, POST, and PUT were supported. With this enhancement, vuSmartMaps can now seamlessly integrate with ITSM platforms that require PATCH to update tickets, without modifying the existing endpoint structure.
  • Extended the integration framework to support custom dynamic token-based authentication mechanisms. This enables connectivity with ITSM systems that use vendor-defined authentication flows that do not align with standard authentication methods currently supported by the platform.
  • Introduced support for a customizable search payload in ITSM integrations. Users can now modify the search request structure to fetch issues based on custom criteria instead of relying on a fixed payload format.
  • Added proxy configuration support for ITSM integrations, allowing outbound requests to be routed through enterprise proxy servers to support secure and restricted network environments.

For more details, refer to Platform Configurations - ITSM Section in the user guide.

Benefits​

  • Improved Compatibility: Supports ITSM systems with specific update, authentication, and connectivity requirements.
  • Greater Search Flexibility: Allows customized issue retrieval based on business-specific criteria.
  • Simplified Enterprise Connectivity: Enables seamless integration in environments that require proxy-based network access.
  • Seamless Integration: Supports ticket operations without requiring structural changes to existing integrations.
  • Expanded Authentication Support: Allows integration with platforms using non-standard authentication mechanisms.

Browser Real User Monitoring (BRUM) V2​

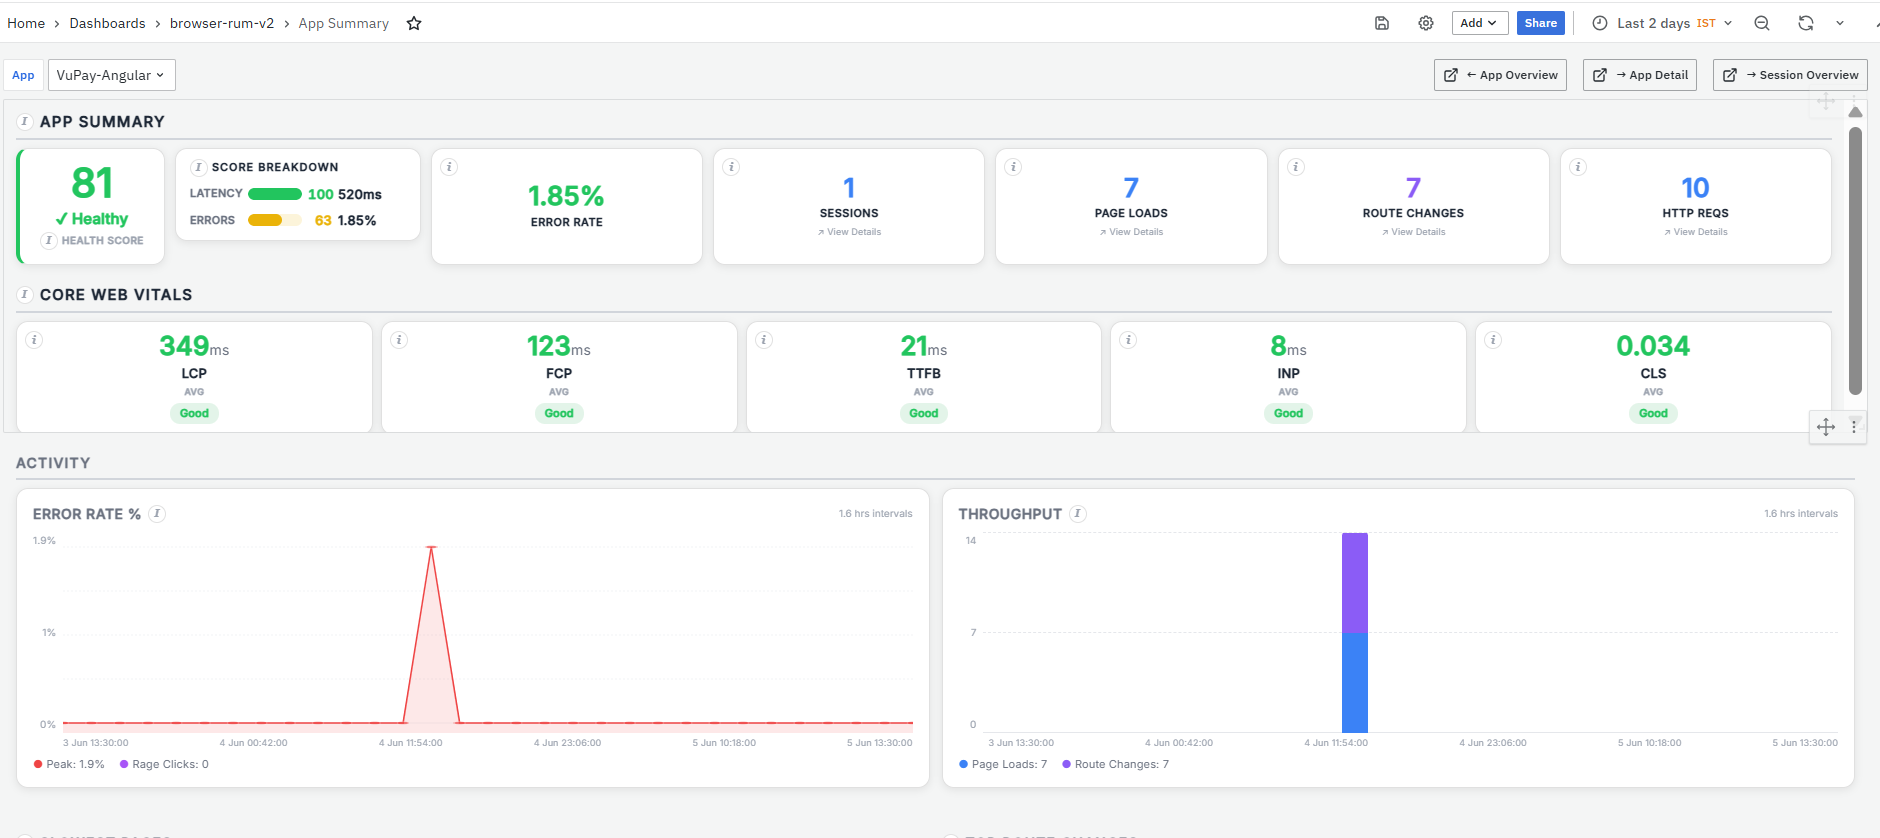
NG 3.1.0 introduces BRUM V2, a new browser observability solution that provides end-to-end visibility into real user experiences across web applications. Built on an OpenTelemetry-based architecture, BRUM V2 captures browser-side telemetry, including page loads, HTTP requests, route changes, user interactions, application errors, and user sessions, helping organizations monitor application performance from the end-user perspective.

BRUM V2 introduces advanced capabilities such as session replay, trace correlation, waterfall trace analysis, user journey tracking, and enhanced performance analytics. Combined with a comprehensive set of dashboards and alerts, BRUM V2 enables faster troubleshooting, improved frontend observability, and deeper insights into application performance and user behavior.

For more details, refer to the BRUM V2 documentation in the user guide. For more details, refer to the BRUM V2 documentation in the user guide.
Benefits​

  • Enhanced User Experience Visibility: Provides real-time insights into how users interact with web applications.
  • Advanced Session Analytics: Enables user journey analysis, session replay, and detailed session-level troubleshooting.
  • Improved Frontend Observability: Monitors page loads, route changes, user interactions, errors, and browser performance metrics.
  • Faster Root Cause Analysis: Correlates browser telemetry with traces and waterfall visualizations for quicker issue investigation.

Mobile Real User Monitoring (MRUM)​

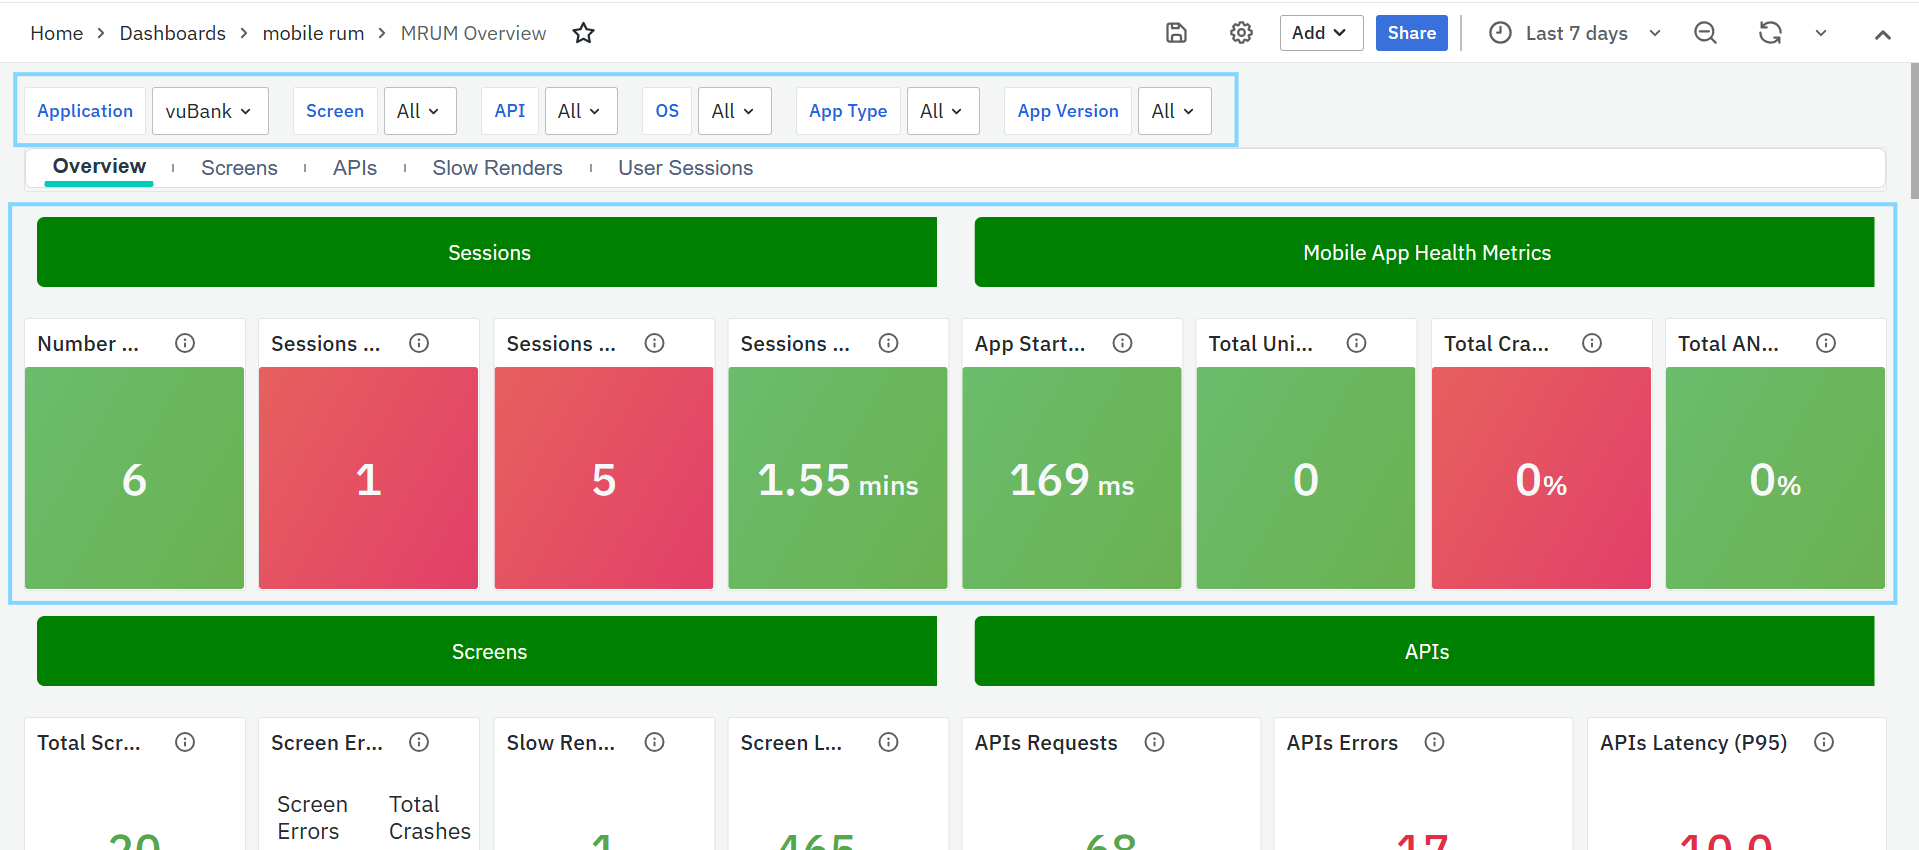
  • NG 3.1.0 enhances Mobile Real User Monitoring (MRUM) with expanded platform support, richer observability dashboards, advanced session analytics, and improved monitoring capabilities for mobile applications.
  • MRUM provides real-time visibility into how users experience mobile applications by capturing key performance and user experience metrics such as screen load times, API latency, crashes, errors, user interactions, and session activity. In this release, MRUM has been extended to support Android Native, Flutter, and iOS applications, enabling comprehensive monitoring across multiple mobile platforms.
  • The release introduces enhanced dashboards for application overview, screens, APIs, user sessions, traces, geographical insights, and performance analysis. New capabilities such as ANR (Application Not Responding) monitoring, slow render detection, trace visualization, user journey analysis, and proactive alerting help teams identify performance bottlenecks, stability issues, and user-impacting problems more quickly.

For more details, refer to the MRUM documentation in the user guide. For more details, refer to the MRUM documentation in the user guide.
Benefits​

  • Expanded Platform Coverage: Supports Android Native, Flutter, and iOS applications through a unified monitoring framework.
  • Comprehensive User Experience Visibility: Provides real-time insights into application performance, user interactions, and session behavior.
  • Enhanced Observability Dashboards: Delivers detailed visibility into screens, APIs, sessions, traces, crashes, and geographical usage patterns.
  • Faster Performance Issue Detection: Helps identify crashes, ANRs, slow renders, and application bottlenecks more quickly.

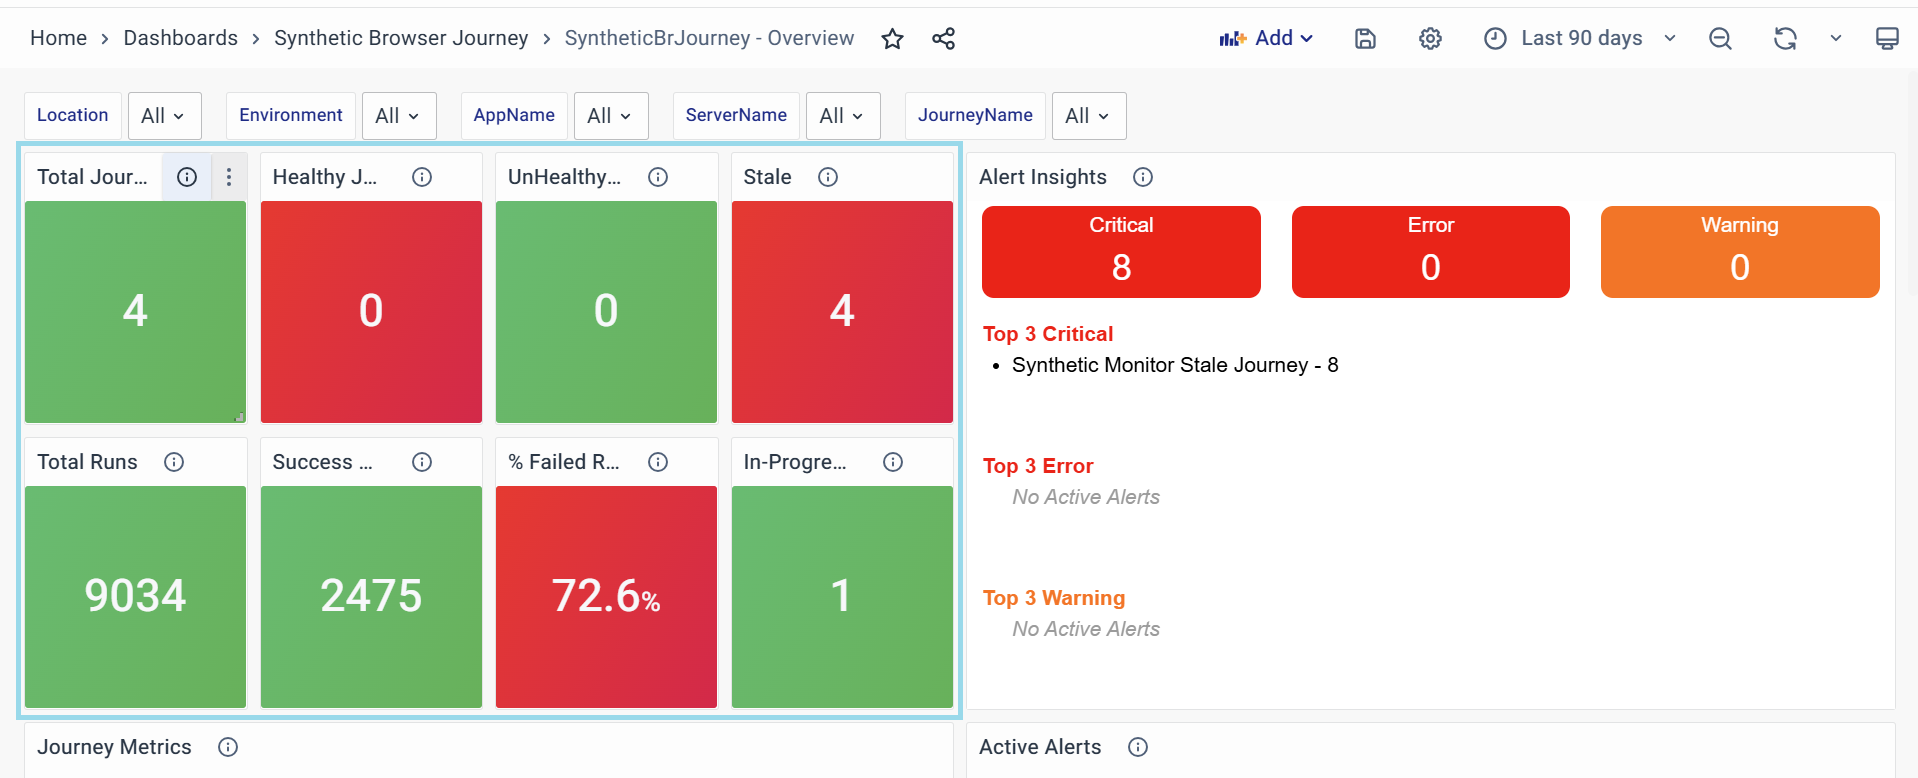
Synthetic Browser Journey Monitoring​

NG 3.1.0 enhances Synthetic Browser Journey Monitoring with support for Internet Explorer (IE) mode, enabling organizations to monitor and validate business-critical workflows that depend on legacy browser compatibility. This enhancement allows synthetic journeys to be executed in IE mode, helping ensure continued visibility into applications that require Internet Explorer-specific functionality. For more details, refer to the Synthetic Browser Journey Monitoring documentation in the user guide. NG 3.1.0 enhances Synthetic Browser Journey Monitoring with support for Internet Explorer (IE) mode, enabling organizations to monitor and validate business-critical workflows that depend on legacy browser compatibility. This enhancement allows synthetic journeys to be executed in IE mode, helping ensure continued visibility into applications that require Internet Explorer-specific functionality. For more details, refer to the Synthetic Browser Journey Monitoring documentation in the user guide.
Benefits​

  • Legacy Browser Support: Enables monitoring of applications that require Internet Explorer compatibility.
  • Expanded Monitoring Coverage: Extends synthetic monitoring capabilities to IE-mode workflows.

Reports​

Introduction Page Added to Generated Reports​

Reports generated using Report Builder now include an introduction (cover) page when downloaded in PDF format. This page appears before the main report content, providing a structured start to the document. For more details, refer to the Report Builder documentation in the user guide. Reports generated using Report Builder now include an introduction (cover) page when downloaded in PDF format. This page appears before the main report content, providing a structured start to the document. For more details, refer to the Report Builder documentation in the user guide.

Benefits​

  • Improved Presentation: Adds a professional cover page to downloaded reports.
  • Better Report Structure: Clearly separates introductory information from report content.

Data Retention​

Enhanced Data Restore Handling​

  • The data restore process has been enhanced to restore archived data directly into the original table from which it was backed up. Restored data is now treated as part of the main table instead of being managed separately.
  • Previously, when archived data was restored, it was created as a separate table with a restored prefix. Although this restored data could be queried, it did not get reflected in platform visualizations, which limited its usability and created inconsistency between query results and visual analysis.
  • With NG 3.1.0, this limitation has been addressed by restoring data directly into the original table, ensuring that restored data is available consistently for both querying and visualization.
  • A new configurable setting has also been introduced to define how many days of restored data should be retained in the main table. The earlier default retention policy for restored tables has been removed to provide more controlled and consistent data lifecycle management.

For more details, refer to the Data Retention documentation in the user guide.

Benefits​

  • Unified Data Handling: Restored data is managed within the original table.
  • Configurable Retention Period: Administrators can define the retention duration for restored data.
  • Improved Lifecycle Control: Provides clearer and more consistent retention management for restored partitions.

Java Agents Benchmarking​

  • A Java Agents Benchmarking report has been introduced to provide detailed insights into the performance and resource utilization of VuNet agents. The report evaluates both Health Probe (metrics collection) and Log Probe (log collection) agents across multiple operating systems such as Linux, Windows, and AIX.
  • The benchmarking tests validate agent behavior under various operational scenarios, including continuous monitoring, high-throughput log ingestion, and large-scale environments. The results confirm that VuNet agents maintain low CPU overhead, stable memory usage, and predictable performance while monitoring system metrics and collecting logs.
  • This report helps organizations better understand agent resource consumption and supports informed decisions during deployment and infrastructure planning.

For more details, refer to the Agent Benchmarking External documentation.

Benefits​

  • Improved Deployment Planning: Provides visibility into agent resource usage before deployment.
  • Operational Transparency: Offers clear insights into how agents perform under different workloads.
  • Reliable Monitoring: Validates that agents operate with minimal impact on host systems.
  • Production Readiness: Confirms stable and predictable performance across supported environments.

SMS Integration Enhancements​

SMS integration has been enhanced to support OAuth-based authentication for improved security. With this update, SMS requests can now be authenticated using OAuth instead of relying solely on API key-based access. This enhancement strengthens the security of SMS communication by aligning the integration with modern authentication standards.

Benefits​

  • Enhanced Security: Supports OAuth-based authentication for SMS requests.
  • Improved Access Control: Strengthens authentication for SMS communication.
  • Modern Integration Standards: Aligns SMS integration with standard authentication mechanisms.

OpenTelemetry Collector Upgrade​

The OpenTelemetry Collector has been upgraded from v0.113.1.0 to v0.138.0 to improve the efficiency, reliability, and compatibility of telemetry data collection. This upgrade enhances how logs and metrics are processed and exported, ensuring smoother data handling across observability pipelines. The update also improves overall compatibility and stability of telemetry data flow within the platform.

Benefits​

  • Improved Data Handling: Enhances the processing of logs and metrics.
  • Better Performance: Ensures smoother and more efficient telemetry collection.
  • Greater Stability: Improves reliability of telemetry data export and processing.

Improved Kafka Data Ingestion​

Data ingestion from Kafka has been enhanced to improve performance and efficiency. The platform now supports storing incoming Kafka data using an optimized JSONAsString format, which enables faster data processing and improved ingestion throughput. With this enhancement, new O11ySources automatically use the improved format, and existing configurations can be updated to adopt the new ingestion method.

Benefits​

  • Faster Data Ingestion: Improves Kafka data ingestion performance.
  • Better Processing Efficiency: Optimized format enhances overall data handling.
  • Seamless Adoption: New O11ySources automatically use the improved ingestion approach.

Alert Console and Alert Email Enhancements​

Based on feedback from CSG, NG 3.1.0 includes enhancements to the Alert Console and alert notification channels to provide better control over contextual information visibility.

  • Users can now choose to disable Contextual Metrics in the Alert Console and email notification channels through a configuration option. When disabled, contextual metrics will not be displayed, resulting in a cleaner and more focused alert view.
    • This option has been introduced to address cases where, in multi-bucket alert scenarios, contextual metrics could display additional entities that were not directly relevant to the primary alert condition. By allowing this to be disabled, alerts and notifications can remain more concise and focused on the most relevant breached entity. For more details, refer to Alert Configuration Studio -> Disabling Contextual Metrics in Alert Console in the user guide.
  • Improved Similar Events Display: When the number of similar incidents exceeds the system tracking limit, the alert email will now indicate that more than 30 incidents were detected instead of displaying fixed counts.
  • Dynamic Platform URL in Alert Emails: Alert email footers now include a dynamically generated link to the customer's vuSmartMaps platform for easier access.
  • Clearer Alarm State Notifications: Alert emails now display simplified messages for Alarm New, Alarm Update, and Alarm Clear events to make the alert status easier to understand.
  • Cleaner Alert Console View: Information sections without data are now hidden to avoid empty tables and improve readability.
  • Improved Handling of Missing Data: When contextual information is not available, the system now displays a clear message instead of showing errors.
  • Configurable Contextual Information: Users can now enable or disable contextual information tables in alert emails through configuration.

Benefits​

  • Better Control Over Contextual Visibility: Users can choose whether contextual metrics should be displayed in the Alert Console and email notifications.
  • Cleaner Alert Presentation: Reduces unnecessary contextual details for a more focused alert view.
  • Improved Alert Relevance: Helps ensure alert details remain centered on the most relevant breached entity, especially in multi-bucket scenarios.
  • Clearer Alert Notifications: Easier to understand alert emails and status messages.
  • Better Navigation: Alert emails now include a direct link to the customer's platform.
  • Flexible Configuration: Users can control whether contextual information appears in alert emails.

Platform Security Improvements​

NG 3.1.0 includes security improvements based on the latest vulnerability assessments and security checks conducted across the platform. Updates have been made in the following areas:

  • Web Application Security
  • API Security
  • Container Security
  • Network Security
  • Compliance-related Security Checks

These improvements strengthen the platform's overall security posture and readiness for internal validation and future deployments.

Benefits​

  • Improved Security Posture: Addresses identified security gaps across key platform areas.
  • Reduced Risk Exposure: Helps minimize known risks across web, API, container, and network layers.
  • Better Compliance Readiness: Improves alignment with security and compliance review requirements.

HyperScale​

NG 3.1.0 introduces enhancements to HyperScale environments through automated database issue resolution capabilities and an upgrade of the underlying ClickHouse database platform.

  • Automated scripts have been introduced to help resolve certain database issues that may occur in HyperScale environments, such as operations getting stuck or tables becoming unavailable for updates. These scripts help restore normal database functionality more quickly and reduce the need for manual troubleshooting. For more details, refer to the CH Resolution Scripts document.
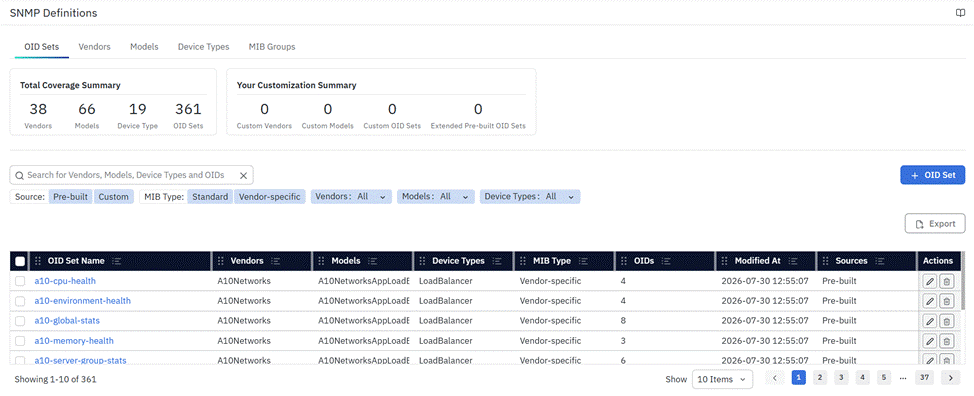
  • In addition, HyperScale environments now support an upgrade of ClickHouse from version 25.3 to 26.2. This upgrade addresses limitations impacting certain O11ySources, including SNMP-based monitoring scenarios, and provides access to newer ClickHouse capabilities that support future platform enhancements.

Benefits​

  • Improved Database Reliability: Helps maintain stable database operations in HyperScale environments.
  • Faster Issue Resolution: Automated scripts reduce recovery time for common database issues.
  • Enhanced O11ySource Compatibility: Addresses ClickHouse limitations impacting specific monitoring use cases.

Known Issues​

S. No.Ticket No.IssueSeverity
1VUQA-6890[Report Genration]: Report is not getting generated intermittently in some environments and on vunodes restart it again starts workingS1
2VUQA-6879[Site-Manager] - Dspec apply operation is failingS1
3VUQA-6870O11y Traces Source Not Recreated After OmniAgent Reinstallation - Trace Data Collection StopsS1
4VUQA-5798DataRetention: Backup size validation should be done before deleting the backup.S2
5
6VUQA-4947User Management: Help text is not proper in User roleS2
7VUQA-5273User Management:Write access to a data model should not be downgraded by assigning read access to an alertS2
8VUQA-5687User specific view - Data Source permissions not being reflected in the Report Builder section.S2
9VUQA-6520Alertconsole - Timezone selection is ignored on date picker ; defaults to system time.S2
10VUQA-6423[Automation]: Facing Auto Logout issue while performing operation.S2
11VUQA-6420Platform Configuration [ITSM]: The "Password" field is actually an API key.S2
12VUQA-6376Data Model : Unable to edit Data Model object despite having modify permission on the objectS2
13VUQA-6374Insight : Permission error occurs while saving Insight object despite having modify permissionS2
14VUQA-6283[Scale & Performance][Go Engine]: Alert Engine behaviour for 2 Lakh unique records.S2
15VUQA-6297User Federation: Getting Error when we click on Test Authentication while editing LDAP config.S2
16VUQA-6235[Reports]: Multiple reports having the same schedule is failing.S2
17VUQA-6180[LDAP]: Incorrectly configuring and enabling LDAP is not letting admin access users pageS2
18VUQA-6037Omniagent: If omniagent installed as user service, install command able to attempt to install as system serviceS2
19VUQA-5687User specific view - Data Source permissions not being reflected in the Report Builder section.S2
20VUQA-6840BRUM App Summary Dashboard Displays Core Web Vitals (LCP, INP, CLS) as ZeroS2
21VUQA-5650Errors in the Kafka connect Monitoring Dashboard.S3
22VUQA-5138Log Analytics: Save button should be disabled for the role who doesn't have access to the tableS3
23VUQA-5130UTM: The Non existing Data model still shows up in UTMS3
24VUQA-5313Report : Target and Avg_CPU name should be corrected in downloaded reportsS3
25VUQA-6883Fortinet Firewall CPU & Memory Usage Panels Showing 'No Data' in VuSmartMapsS3
26VUQA-5144Report Generation : There is no < / > / == / != filter for download count field in Generated Reports tabS4

*S5, S4, S3 & S2 issues will be prioritized in the NG 3.1.0 release. S1 - Critical. S2 - Major, S3 - Moderate, S4 - Minor, S5 - Cosmetic.

Issues Fixed​

S. No.Ticket No.IssueSeverityStatus
1VUQA-5596ContextStreams: UI Issues in Plugin Selection and Processing Block Edit in Pipelines Page. PFA for issue details.S2Fixed in NG 3.1.0
2VUQA-5705Context Streams : Debug services are not getting deleted when it is not in useS2Fixed in NG 3.1.0
3VUQA-5699User roles: Creating of new role is not getting reflected immediately in the User page.S2Fixed in NG 3.1.0
4VUQA-5697Table listing issues in the Data Model PageS2Fixed in NG 3.1.0
5VUQA-5693Scheduling fails only for custom time range.S2Fixed in NG 3.1.0
6VUQA-5949[Weblogic]: Issue in the Weblogic plugin configuration.S2Fixed in NG 3.1.0

Release Attributes​

Build/Module NameNG 3.1.0
User GuideHost Landscape
OmniAgent
O11ySources
Application Workbench
Alert Configuration Studio (NG Alert Engine)
APM
APM Studio
Smart-Frames
Smart-Frame Studio
Anomaly Detection
Ved AI
Platform Configurations
Data Explorer
VQL
O11ySources - Getting Started
Dashboards -> Business Chart
Platform Configurations - ITSM Section
BRUM V2
MRUM
Synthetic Browser Journey Monitoring
Report Builder
Data Retention
Alert Configuration Studio -> Disabling Contextual Metrics in Alert Console
note

All the user guide links in this document are up to date and align with NG 3.1.0 updates.

System Requirements​

The supported browser version is Chrome 109 or above.

Upcoming Release​

We are preparing for the upcoming vuSmartMaps NG 3.1.1 release, which will introduce additional observability capabilities, platform enhancements, usability improvements, and operational innovations across the platform. The release will continue to expand automation, AI-driven analytics, observability coverage, and user experience monitoring to help organizations gain deeper operational visibility and improve monitoring efficiency.

note

A migration plan is being developed for customers using vuSmartMaps 8.x or 9.x versions to support their transition to the NG platform.

Support​

support@vunetsystems.com

NG 2.16.13

πŸ—“οΈ ⏱️ 12 min read

Overview​

vuSmartMapsβ„’ NG 2.16.13 introduces enhancements and fixes across Observability, RCABot Integration, Query Optimization, and Platform Stability. This release improves Monitoring Coverage, O11y Source Configuration, Alerting Workflows, Query Performance, and Data Ingestion Reliability. It also addresses key issues across Drilldowns, Filters, Reporting, Historical Alert Execution, and User Engagement Visibility.

New Features​

RCABot Email Alert Integration​

Introduced RCABot Email Alert Integration to support alert generation and email notification workflows based on RCABot incident information. The enhancement enables RCABot incident details to be reflected through alert lifecycle events such as new, update, and clear, helping users receive structured alert information through the configured alert notification flow.

The integration includes updates to alert titles, email notification content, incident-related contextual information, and alert UI fields so that RCABot-generated alerts provide clearer incident details during alert creation, update, and closure. This update also includes dashboard filter support in the Alert Console for RCABot alerts. With this enhancement, RCABot-related alert views can use the required dashboard filters during alert investigation, improving the consistency of alert context and dashboard-based analysis.

  • CCBD-4902: RCABot Email Alert Integration and Dashboard filters support in Alert Console for RCABot

New O11y Sources​

The following new O11y Sources are introduced in this release:

Server Monitoring Using SNMP​

Introduced a new O11y Source for server monitoring using SNMP. This O11y Source enables SNMP-based monitoring for server environments as part of the supported O11y Source coverage. The update also includes the required Pluto file support for Generic Server monitoring and Cisco EIGRP-related support, ensuring that the required monitoring definitions are available as part of the O11y Source package.

  • CCBD-4545: New O11y Source - Server monitoring using SNMP and Pluto files for Generic Server and Cisco EIGRP support

Spring Boot Application Monitoring​

Introduced a new O11y Source for Spring Boot application monitoring using Actuator metrics. This O11y Source supports collection of Spring Boot application metrics from Actuator endpoints and maps the collected metrics into the required observability schema. This enables Spring Boot application monitoring through the supported vuSmartMaps O11y Source workflow.

  • CCBD-3179: Create O11ySource for Spring Boot application monitoring using Actuator metrics

Enhancements​

O11ySource: F5 Load Balancer Additional Metrics Monitoring​

Enhanced the F5 Load Balancer O11y Source to support additional metrics monitoring and failover status-related updates. This update expands the existing F5 monitoring coverage and includes the required Pluto file changes for F5 Load Balancer failover status support.

The update also includes pipeline directory-related changes required for the F5 monitoring package, ensuring that the updated monitoring components are aligned with the expected package structure.

  • CCBD-4834: UCO | F5 || Additional metrics monitoring required for F5 Loadbalancer, Pluto file for F5 LB Failover Status and update the Pipeline Directory

O11ySource: Cisco Router and Switch EIGRP Monitoring​

Enhanced Cisco Router and Cisco Switch monitoring support for EIGRP-based environments. This update includes support for Cisco Router EIGRP monitoring and Cisco Switch EIGRP Point-to-Point link monitoring as part of the required network monitoring enhancements. This enhancement expands Cisco network monitoring coverage for EIGRP-related routing and point-to-point link use cases through the supported O11y Source workflow.

  • CCBD-4823: Cisco Router Enhancement (EIGRP Support) and Cisco Switch Enhancement [EIGRP] (P2P Link)

O11ySource: Kong API Gateway GSH Configuration and Packaging Update​

Updated the Kong API Gateway GSH configuration workflow for target configuration changes and validated the latest package update. This enhancement ensures that the Kong API Gateway O11y Source setup flow is aligned with the expected configuration and packaging requirements. The update also includes validation of the latest package replacement to ensure the supported package is used during setup and deployment.

  • VUQA-6679: Kong API Gateway - GSH changes on Configuration Target and Packaging Update Validation

O11ySource: Kafka Jinja Template and UI Workflow Improvements​

Enhanced the Kafka O11ySource Jinja templates and UI workflow to improve configuration generation, package handling, and deployment consistency. This update includes improvements to the existing Jinja templates, validation of package type coverage, and alignment of Kafka O11ySource configuration with the updated UI-based setup flow. The enhancement also includes review and improvement of the Kafka O11ySource migration and packaging workflow to ensure that the required configuration files, beat mappings, and package-related changes are handled correctly during deployment and upgrade scenarios.

  • CCBD-4286: Improve Kafka O11ySource Jinja Templates and UI Workflow

O11ySource: Kafka Dashboard Enhancements​

Enhanced Kafka O11ySource dashboards as part of the Kafka monitoring improvement activities. This update focuses on improving the existing Kafka monitoring dashboards and adding or refining visualizations for the collected Kafka metrics. The enhancement also includes validation of dashboard data mapping with the latest ingestion pipeline and alignment with the updated UI, data model, and Jinja template changes to ensure dashboard consistency for Kafka monitoring.

  • CCBD-4852: Kafka O11ySource - Dashboard Enhancements

O11ySource: Tomcat JMX SSL and Authentication Support​

Enhanced Tomcat JMX monitoring support by enabling SSL and authentication-related configuration changes and validating the same through vuAppAgent. This update supports secure JMX configuration requirements for Tomcat monitoring. The enhancement includes configuration changes required for authenticated JMX access and validation of the updated Tomcat JMX setup through the monitoring agent workflow.

  • CCBD-3356: Enabling JMX with SSL and Authentication changes in Tomcat and Validation in Vuappagent

O11ySource: PostgreSQL Metrics Inclusion​

Enhanced the PostgreSQL O11ySource by adding additional metrics required for DOP use cases. This includes metrics related to Top SQL, Top Users, Top Programs, database wait events, and SQL execution plan information. This enhancement expands PostgreSQL monitoring coverage by including the newly required database metrics in the O11y Source.

  • CCBD-4911: DOP | PostgreSQL O11ysource - Metrics Inclusion

O11ySource: Database Query Enhancements for MSSQL, Azure SQL, and PostgreSQL​

Enhanced Database O11ySource queries for MSSQL, Azure SQL, and PostgreSQL monitoring. For MSSQL and Azure SQL queries, additional session-level settings have been added to improve query execution behavior during production monitoring. This update includes SET DEADLOCK_PRIORITY -10 and SET LOCK_TIMEOUT 5000 for the applicable MSSQL and Azure SQL query configurations. These changes help ensure that monitoring queries do not interfere with application transactions and do not wait indefinitely during lock contention scenarios.

  • CCBD-4901: Database O11ySource Query Enhancements for MSSQL, Azure SQL, and PostgreSQL

O11ySource: MSSQL Deadlock Query Statement Enhancement​

Enhanced MSSQL deadlock monitoring to include the deadlock query statement information. This update improves the existing deadlock monitoring by making the query statement associated with the deadlock available as part of the collected information. The enhancement supports better visibility into MSSQL deadlock events by including query-level details where required.

  • CCBD-5031: CLONE - O11Y Source | MSSQL | DEADLOCK QUERY STATEMENT | INUS:IND

Query Optimization for Visualizations and Variables​

Improved query handling for visualizations and variables by adding query optimization changes. This includes support for conditional query clauses and timestamp-based filtering where applicable. The update helps optimize visualization and variable queries by reducing unnecessary query execution scope and aligning query behavior with selected filters and time ranges.

  • CCBD-2096: Query Optimization for Visualizations and Variables

Updated OKE, Rancher, and GKE dashboard links to use the latest Kubernetes dashboard references. This enhancement ensures that dashboard links point to the latest folder and are aligned with the updated Kubernetes dashboard folder structure. The update also removes outdated 1.0 folder references for Rancher and GKE dashboards, preventing broken dashboard links and ensuring that the latest dashboards are loaded correctly during O11ySource enablement and package validation.

  • CCBD-4953: Update OKE, Rancher, and GKE Links to Use latest K8's dashboard

Bug Fixes​

UTM Drilldown Metrics Display Fix​

Resolved an issue where UTM drilldown displayed only the first 10 configured metrics for a selected node or link. Metrics configured beyond the first 10 were not displayed in the drilldown view. This fix ensures that all configured metrics for the selected node or link are displayed correctly in the UTM drilldown/popup panel.

  • VUQA-6804: UTM: UTM Drilldown Displays Only First 10 Configured Metrics

Alert Console Entity Filter Count Fix​

Resolved an issue where alert counts became zero after applying entity filters with string-based time filters in the Alert Console. The issue was observed when using time filters such as Yesterday or Day Before Yesterday and then applying one or more entity filters. This fix ensures that alert counts are displayed correctly after applying entity filters for the selected time range.

  • VUQA-6757: Alert Console : Alert counts become 0 after applying entity filters with string-based time filters in Alert Console

Alert Report Attachment Selection Fix​

Resolved an issue where users were unable to attach reports to alerts because the report selection dropdown was empty. When the attach report option was enabled, the available reports were not listed for selection. This fix ensures that available reports are displayed correctly in the dropdown while configuring report attachments for alerts.

  • VUQA-6834: Alerts: Unable to attach report with alert

Historical Alert Execution Time Range Fix​

Resolved an issue where historical alert execution did not work as expected because the selected historical time range was not being applied correctly. The alert execution was evaluated using the data model metric time range instead of the selected historical time range. This fix ensures that historical alert execution uses the selected historical time range as expected.

  • VUQA-6816: Alerts : Historical Alert Execution not working is expected

User Engagement Logout and Session Duration Fix​

Resolved an issue in the User Engagement dashboard where logout time and total duration were not displayed properly for some user sessions. In such cases, login time was available, but logout and duration details were missing or incorrect. This fix ensures that logout time and total session duration are displayed correctly in the User Engagement dashboard.

  • VUQA-6692: User Engagement : Logout and Total Duration Time Are Not Displaying Properly in the User Engagement Dashboard

Pipeline Configuration Deletion Fix​

Resolved an issue where pipeline configuration could get deleted without a recovery option. This fix addresses the configuration handling issue to avoid unintended loss of pipeline configuration. The update improves reliability of pipeline configuration management by ensuring the reported deletion behavior is addressed.

  • CCBD-4591: Pipeline Configuration Gets Deleted Without Possibility of Recovery

ClickHouse Shared Distributed Table Creation Fix​

Resolved an issue where ClickHouse tables were not created correctly when two primary table templates referenced the same distributed table. In this scenario, table creation did not behave as expected. This fix ensures that ClickHouse table creation works correctly when multiple primary table templates reference the same distributed table.

  • CCBD-4777: ClickHouse tables are not being created correctly when two primary table templates reference the same distributed table

O11ySource: Oracle Log Firewall Requirement Information Fix in GSH​

Resolved an issue where Oracle log firewall requirement information was not captured in GSH. Firewall requirement details such as source IP, destination IP, destination port, protocol, and direction were not captured as expected. This fix ensures that the required Oracle log firewall information is included correctly in the GSH configuration.

  • VUQA-6656: Oracle Log Information not captured in firewall Requirement (GSH)

O11ySource: vSphere Dashboard Owner Validation Fix​

Resolved an issue where vSphere O11ySource enablement failed due to an invalid owner reference in dashboard JSON templates. The issue caused dashboard creation validation to fail during O11ySource enablement. This fix ensures that vSphere dashboard creation works correctly during O11ySource enablement.

  • VUQA-6789: vSphere O11ySource enable failing - Invalid owner PK causes dashboard creation failure

O11ySource: JBoss Plugin Configuration Filename Fix​

Resolved an issue where JBoss O11ySource data ingestion was not working due to a plugin configuration filename mismatch. The expected plugin configuration filename and the deployed filename were different, causing the plugin configuration to not be loaded correctly. This fix ensures that the JBoss plugin configuration filename is aligned with the expected plugin configuration reference.

  • VUQA-6780: JBoss O11y source data ingestion not working - plugin config filename mismatch

O11ySource: IIS Application Pool and Website Monitoring Fix​

Resolved an issue where IIS Application Pool and Website monitoring data was not being ingested correctly due to configuration-related issues. The updated iis.yml configuration and heartbeat binary changes ensure that Application Pool and Website monitoring data is collected and displayed successfully in dashboards. This fix also includes validation of the updated IIS monitoring configuration across supported Windows Server environments, including Windows Server 2016, 2019, and 2022, to ensure consistent data collection and dashboard visibility.

  • VUQA-6661: Validate and Roll Out Updated IIS Configuration for Application Pool and Website Monitoring

O11ySource: Kubernetes Data Ingestion Fix​

Resolved an issue where Kubernetes O11ySource data ingestion was not working as expected. The fix updates the required packaging and HyperScale table reference handling to support the correct ingestion behavior. This fix ensures that Kubernetes O11ySource data ingestion works correctly with the updated package and table reference configuration.

  • VUQA-6778: Kubernetes O11y source data ingestion not working

O11ySource: Query Accuracy Fix​

Resolved query accuracy issues in O11ySource dashboards, alert data models, and related queries where last_value() was used. The queries have been updated to use argMax(<field>, timestamp) wherever the latest timestamp-based value is required. This fix ensures that dashboard and alert queries return the expected latest values based on timestamp. The update has been applied across applicable O11ySource queries for the 2.16 and 3.1 branches.

  • CCBD-4886: Product Repository Fix for 2.16 and 3.1

Summary​

With vuSmartMapsβ„’ NG 2.16.13, the focus remains on delivering a more consistent, reliable, and operationally efficient observability experience. This release continues to improve monitoring coverage and operational visibility across supported environments. We look forward to building on these enhancements in upcoming releases with continued focus on usability, performance, and broader observability coverage.

NG 2.16

πŸ—“οΈ ⏱️ 34 min read

Overview​

The vuSmartMaps NG 2.16 release brings a wide range of enhancements and new capabilities across the platform. Highlights include exportable alert rules, a new Generic ITSM configuration option, Session Replay in Browser RUM, and a redesigned Log Analytics module with faster performance and better usability. Offline CAPTCHA now supports secure login in restricted environments, while updates to User Engagement Dashboards and Report Builder downloads improve user visibility and data control. The Grafana 11 upgrade delivers a refreshed UI, and vuApp360 introduces support for new technologies like Go, Node.js, Python, and NGINX along with flexible trace sampling and memory control options. Platform-wide improvements cover data retention handling, optimized storage reporting for non-Minio setups, and reduced installation package sizes. Additionally, multiple new O11ySources like SAP ASE, Azure Firewall, Checkpoint Firewall, and Kafka Data Collector expand observability coverage, complemented by targeted bug fixes and dashboard performance updates across existing O11ySources.

In addition to the base NG 2.16 release capabilities, the NG 2.16.12 Patch Release introduces further enhancements across observability, HyperScale governance, alerting, dashboarding, and platform stability. Key additions include Federated Search in Log Analytics, Platform Self-Observability Alerts, HyperScale Guardrails, expanded infrastructure monitoring support, new storage and network O11ySources, and multiple platform stability improvements. For more details, refer to the NG 2.16.12 Patch Release section.

Key Highlights​

  • Alerts: Alert rules can now be exported to CSV for easy sharing, and active alerts are automatically cleared when rules are disabled or deleted, reducing manual effort.
  • Configurations & Preferences: Added a Generic ITSM option and Python script support to simplify custom integrations and enhance flexibility.
  • Browser RUM: Introduced Session Replay and improved dashboards for better visibility into real user interactions and web app performance.
  • Log Analytics: Introduced a new table component, faster loading, better navigation, larger log display, and more export and filtering options for an improved user experience.
  • Accessing vuSmartMaps: Offline CAPTCHA support has been added to enable secure logins in restricted or no-internet environments.
  • User Engagement Dashboards: Updated dashboards now provide insights into platform adoption, configuration trends, and overall user activity.
  • vuApp360: Expanded instrumentation support for Go, Node.js, Python, and NGINX; UI-based Tail Sampling and HTTP header attribute capture, plus advanced configuration for Tail Sampling and Memory Limiter without redeployment.
  • Analytics Reports: Report Builder now applies user-specific views to downloads, ensuring users only access the data they’re permitted to see.
  • User Management: Enhanced support for hybrid user-role setups with clear identification of LDAP/AD roles, new columns for local and federated roles, and a CSV export option for streamlined user data management.
  • Grafana 11 Upgrade: Brings a refreshed interface, improved navigation, new chart types, and smarter filtering for a better dashboard experience.
  • Agents: Enhanced WebLogic monitoring, improved connection handling, and accurate IPv4 address selection.
  • Platform: Optimized container image sizes to speed up installation and enhanced the Global Time Selector, now retains recently used absolute time ranges, allowing quick and consistent reuse across all modules.
  • Data Retention: Retention policies now apply consistently across all tables by automatically linking data tables with their distributed counterparts, even when using custom naming conventions.
  • Hyperscale: Upgraded to the latest ClickHouse LTS version with improved performance and default support for JSON data handling.
  • Insights: Upgraded Chart.js to v4.4.9, enabling advanced charting features and more dynamic, interactive visualizations.
  • Federated Search: Added unified cross-cluster log search capability across multiple vuSmartMaps data centers for improved distributed observability and operational visibility.
  • Platform Self-Observability: Introduced ingestion pipeline and workflow health monitoring alerts for Kafka, ContextStreams, HyperScale, and related platform services.
  • HyperScale Guardrails: Added operational guardrails, query execution controls, and resource protection mechanisms to improve platform resilience during high-load conditions.
  • Infrastructure Monitoring Enhancements: Expanded monitoring coverage for Cisco Switches, Cisco Firepower Firewalls, F5 WAF metrics, HP-UX socket metrics, and WebLogic thread diagnostics.
  • Platform Stability Improvements: Included fixes for pipeline CrashLoopBackOff conditions, alert timestamp synchronization issues, retention policy handling, and user configuration data protection.

O11ySources Highlights​

New O11ySources​

We continue to expand our observability capabilities with new out-of-the-box O11ySources in NG 2.16, enhancing support for a wide range of use cases. These additions ensure comprehensive monitoring and data collection, providing deeper insights and improved visibility across diverse environments.

The new O11ySources include:

  • Azure Firewall: Azure Firewall is a cloud-based security service that protects your network by filtering traffic and blocking unauthorized access. It helps keep your environment secure by applying rules to control traffic and detect threats, making sure only safe connections are allowed.

  • Kafka Data Collector: Kafka Data Collector allows users to collect data directly from a configured Kafka cluster. It helps monitor and process Kafka stream data efficiently within vuSmartMaps.

  • OCI Kubernetes Engine (OKE): OCI Kubernetes Engine (OKE) is a managed Kubernetes service in Oracle Cloud Infrastructure that helps deploy, manage, and scale containerized applications. This O11ySource enables observability into OKE clusters, making monitoring cloud-native workloads running in OCI easier.

  • SAP ASE (Adaptive Server Enterprise): SAP ASE is a high-performance database system, and this O11ySource helps monitor its health and performance. It collects important metrics like query load, CPU and I/O usage, locks, and cache activity. This makes detecting issues early, understanding slowdowns, and keeping business-critical applications running smoothly and reliably easier.

  • Checkpoint Firewall: Checkpoint Firewall is a network security solution that protects your systems by blocking unauthorized access and inspecting network traffic. This O11ySource helps monitor firewall activity, providing visibility into threats, access patterns, and security events to ensure safe and controlled communication across your network.

  • Cisco ACI: Introduced a new O11y Source for Cisco Application Centric Infrastructure (ACI) to enable monitoring and observability of Cisco ACI environments, including fabric health, tenant-level visibility, and infrastructure performance monitoring.

  • NetApp Storage: Introduced a new O11y Source for NetApp Storage systems to enable collection and monitoring of storage performance, capacity utilization, health metrics, and operational statistics from NetApp environments.

  • Hitachi Storage: Introduced a new O11y Source for Hitachi Storage systems to provide visibility into storage infrastructure health, performance metrics, capacity monitoring, and operational status.

  • Apache Solr: Apache Solr is an open-source enterprise search platform used for indexing, searching, and analyzing large volumes of data. This O11ySource enables monitoring of Solr clusters and nodes by collecting key metrics such as query performance, indexing rates, cache utilization, JVM health, replication status, and request handling metrics. It helps administrators identify performance bottlenecks, monitor search infrastructure health, and ensure optimal search service availability and responsiveness.

  • Azure CDN WAF Policy: Azure CDN WAF Policy is used to secure web applications and APIs delivered through Azure Content Delivery Network services by filtering malicious traffic and protecting against common web vulnerabilities. This O11ySource provides visibility into WAF policy activity, security events, blocked requests, rule matches, and traffic inspection metrics, helping teams monitor web security posture and detect potential threats effectively.

  • Azure Key Vault: Azure Key Vault is a cloud service used to securely manage secrets, encryption keys, and certificates. This O11ySource enables monitoring of Azure Key Vault operations and performance metrics, including request counts, latency, availability, throttling events, and access activities. It helps ensure secure and reliable secret management across cloud environments.

  • Azure MySQL Database: Azure MySQL Database is a managed relational database service that provides scalable and secure MySQL database hosting in Azure. This O11ySource enables monitoring of database performance, resource utilization, query activity, connections, storage consumption, replication health, and server availability to help maintain optimal database operations and troubleshoot performance issues proactively.

  • Azure Redis Cache: Azure Redis Cache is a fully managed in-memory caching service that improves application performance and scalability. This O11ySource provides observability into cache performance metrics such as cache hits and misses, memory utilization, client connections, throughput, latency, and server health, enabling teams to optimize application responsiveness and cache efficiency.

  • Azure SQL Database: Azure SQL Database is a fully managed relational database service built on Microsoft SQL Server. This O11ySource enables monitoring of database health, query performance, DTU/vCore utilization, storage consumption, connection activity, deadlocks, and overall service availability, helping ensure reliable and optimized database operations in Azure environments.

  • Azure SQL Managed Instance: Azure SQL Managed Instance is a fully managed SQL Server instance in Azure that provides near-complete SQL Server compatibility with cloud scalability and automation benefits. This O11ySource enables monitoring of managed instance performance, CPU and memory usage, storage utilization, query execution metrics, backup status, and availability to support enterprise database operations and performance management.

  • Azure Storage Blob: Azure Storage Blob is a scalable object storage service used for storing unstructured data such as logs, backups, media, and application data. This O11ySource provides visibility into storage account performance, transaction counts, capacity utilization, request latency, availability metrics, and data access operations to help monitor storage efficiency and reliability.

  • OCI Autonomous Database: OCI Autonomous Database is an Oracle-managed cloud database service that automates provisioning, tuning, scaling, patching, and backups. This O11ySource enables monitoring of database workload performance, sessions, storage utilization, CPU usage, SQL execution metrics, and operational health, helping ensure efficient and reliable database operations in Oracle Cloud Infrastructure environments.

  • OCI Compute: OCI Compute provides scalable virtual machine and bare metal compute resources in Oracle Cloud Infrastructure. This O11ySource enables monitoring of compute instance health, CPU and memory utilization, disk and network performance, availability status, and infrastructure operational metrics to improve cloud infrastructure visibility and operational monitoring.

  • SNMP Trap: SNMP Trap is a mechanism used by network devices and infrastructure components to send asynchronous event notifications for operational changes, failures, and alerts. This O11ySource enables the collection, processing, and monitoring of SNMP Trap events from supported devices, helping operations teams gain real-time visibility into network incidents, device status changes, and infrastructure alerts for faster troubleshooting and response.

Complete list of O11ySources available in NG 2.16​

Active DirectoryAIX MonitorAmazon RDSApache
Apache HDFSAWS ALBAWS API GatewayAWS Classic ELB
AWS CloudFrontAWS ElastiCacheAWS Network FirewallAWS NLB
AWS Route53AWS S3AWS Transit GatewayAWS VPC
AWS WAFAzure API ManagementAzure App GatewayAzure EventHub
Azure Load BalancerBrowser RUMCassandraCisco Firewall
Cisco RouterCisco SwitchDell SwitchDevice Availability
DNS MonitoringF5 Load BalancerFortinet FirewallGKE
HAProxyHPUX MonitorHTTP PollerIBM HTTP Server
IBM MQIBM WASIISJBoss
JVM MonitorKafkaKeycloakKeyDB
Kong API GatewayKubernetesLinux MonitorLog Collector
MariaDBMicroSoft DFSMongoDBMSSQL
MYSQLNetFlowNginxNutanix
OCI API GatewayOHSOraclePalo Alto Firewall
PostgreSQLRabbitMQRadware Load BalancerRancher
RedisService MonitorSFTP MonitorSNMP Polling
Solaris MonitorSQL Data CollectorSSL Certificate MonitorSynthetic Browser Journey Monitoring
SyslogTask SchedulerTomcatTraces
URL AvailabilityVaultvSphereWeblogic
Windows Events LogsWindows Monitor

New O11ySources in NG 2.16

Azure FirewallKafka Data CollectorOCI Kubernetes Engine (OKE)SAP ASE
Checkpoint FirewallCisco ACINetApp StorageHitachi Storage
Apache SolrAzure CDN WAF PolicyAzure Key VaultAzure MySQL Database
Azure Redis CacheAzure SQL DatabaseAzure SQL Managed InstanceAzure Storage Blog
OCI Autonomous DatabaseOCI ComputeSNMP Trap

Improvements/Technology Upgrades in the Release​

Alerts​

Export Alert Rules to CSV​

vuSmartMaps introduces the ability to export alert rules as a CSV file from the Alerts page. Users can simply click the new Export button next to the Disable option, confirm the action, and download the alert rules for offline use. This simplifies the sharing of alert configurations. Learn more about it in Alerts - Manage Alerts.

Automatic Alert Clearance on Rule Disable/Delete​

When an alert rule is disabled or deleted in vuSmartMaps, all related active alerts are automatically cleared. A Clear Alarm notification is automatically generated and displayed in the Alert Console, and the actual reason for the alarm can be found in the Alarm Clear Reason field, indicating whether the rule was deleted or disabled, along with the user and timestamp for traceability. Additionally, any linked ITSM tickets are automatically closed, ensuring that alerts and incidents remain synchronized without requiring manual intervention.

Benefits​
  • Easy Backup: Save alert rules for future reference or audits.
  • Improved Collaboration: Share rule configurations easily across teams.
  • Automatic Clean-up: Ensures outdated alerts are cleared without manual steps.
  • Transparency: Provides clear reasons and timestamps for each alarm clearance.

Configurations & Preferences​

A new Generic ITSM ticketing system has been introduced to simplify and speed up the integration process with custom ITSM tools. Instead of requiring native support for every individual ITSM platform, users can now configure a flexible Ticketing System type by filling out predefined fields. Users can also upload Python scripts in the ITSM Preferences page, similar to the WhatsApp configuration. This enables greater customization and advanced integration logic for ITSM workflows. Learn more about it in Configurations & Preferences - ITSM Configurations.

Benefits​

  • Faster Integration: Easily connect with any ITSM tool using the generic ticketing system.
  • Reduced Effort: Minimizes development time for new ITSM requests.
  • Flexible Customization: Add Python scripts to tailor ITSM behavior as needed.

Browser RUM​

The Browser RUM O11ySource has been enhanced with Session Replay capabilities, giving deeper visibility into real user sessions and behaviors. Dashboards have also been improved to provide a more insightful and seamless monitoring experience. These updates further extend support for modern web applications built using Angular and React, enabling more detailed tracking of performance and user interactions. For more information, explore Browser RUM - User Session Insights.

Benefits​

  • Visual Session Insights: Replay user sessions for better context during troubleshooting.
  • Deeper Visibility: Correlate frontend activity with backend traces for end-to-end analysis.
  • Improved Dashboards: Access clearer, more actionable views of performance and user behavior.

Log Analytics​

The Log Analytics module has been enhanced with a new table component has been introduced, and the core logic has been optimized for faster loading and better maintainability. Key enhancements include smoother navigation with browser back/forward support, the ability to display more log lines, and a dedicated source selection page for better clarity. Users can now resize columns, export logs in CSV or JSON formats, and share saved searches via direct links. Trend charts are more accurate with millisecond precision, and error messages are now more detailed and informative to help with troubleshooting. Explore the Log Analytics section.

Benefits​

  • Improved Performance: Faster loading and smoother interactions for a better experience.
  • Enhanced Usability: Easier navigation, better error messages, and more control over how logs are viewed.
  • Flexible Export Options: Export logs in CSV or JSON formats for offline use or sharing.
  • Greater Precision: Trend charts now show data with millisecond-level accuracy.

Accessing vuSmartMaps​

Captcha support in vuSmartMaps has been enhanced to work in offline environments. Previously, CAPTCHA relied on Google's APIs through Keycloak, which required internet access. In secured or restricted networks without internet access, this caused challenges. To address this, offline CAPTCHA support has now been implemented, allowing login verification without external API dependency. UI updates have also been made to align with the Grafana 11 upgrade.
To enable offline CAPTCHA in vuSmartMaps, follow the setup guide here: Offline CAPTCHA Setup Guide. For more details on login and authentication configurations, refer to the user guide, Accessing vuSmartMaps – Logging In

Benefits​

  • Secure Login in Offline Setups: Enables CAPTCHA functionality without requiring internet access.
  • Improved Compatibility: Works seamlessly in secured and restricted environments.
  • Updated UI: Screens updated as per Grafana 11 for a consistent login experience.

User Engagement Dashboards​

The User Engagement Dashboards have been updated and are now packaged with vuSmartMaps NG, offering clear visibility into how users and teams interact with the platform. These dashboards include two key views: Configuration Metrics and Operational Metrics. The Configuration Metrics Dashboard helps track trends in the creation of items like dashboards, alerts, reports, data models, insights, and UTM configurations, making it easier to monitor platform setup and adoption. The Operational Metrics Dashboard provides insights into system usage, including login activity, event processing rates, storage trends, alert resolution times, and overall user engagement across dashboards and features. For more information explore Platform Adoption and Engagement - Configurational Metrics Dashboard & Platform Adoption and Engagement - Operational Metrics Dashboard.

Benefits​

  • Better Adoption Tracking: Understand how platform features are being used.
  • Improved Operational Insights: Monitor user activity, alert KPIs, and system usage trends.
  • Proactive Management: Identify underutilized areas and optimize platform usage.

vuApp360​

Instrumentation​

In this release, vuApp360 expands its instrumentation capabilities to support more environments and languages. In addition to Java, .NET, and Kubernetes, users can now instrument applications written in Go, Node.js, and Python and collect telemetry directly from NGINX. This makes setting up end-to-end observability across a wide range of application stacks easier.

Newly Supported Technologies:

  • Go: Instrument Go applications running on Linux or inside Docker using OpenTelemetry auto-instrumentation.
  • Node.js: Capture telemetry from Node.js applications using OpenTelemetry Zero Code Instrumentation (by adding packages and using a preload flag).
  • Python: Automatically collect traces from Python applications using OpenTelemetry Zero Code Instrumentation with supported libraries.
  • NGINX: Enable the OpenTelemetry NGINX module to trace incoming web traffic and capture key metrics directly from the web server.

For more details, explore vuApp360 - Client Side Traces Instrumentation.

Benefits​
  • Wider Coverage: Observe applications across more languages and environments.
  • Simplified Setup: Easy-to-follow steps using OpenTelemetry tooling for each language.
  • Consistent Observability: Unified trace collection regardless of the runtime or framework.
  • Faster Troubleshooting: More comprehensive insights across backend services and web traffic.

Tail Sampling and HTTP Header Capture Enhancements​

This release introduces two important UI-based configuration enhancements for the Traces O11ySource. Users can now enable or disable Tail Sampling directly from the UI. Selecting "Yes" applies the sampling policies configured in the Settings tab, while "No" ensures that 100% of collected traces are stored without sampling. Additionally, a new attribute from the HTTP Header field has been added, allowing users to capture custom attributes from incoming HTTP headers into spans by simply listing the required headers (comma-separated) in the UI. These enhancements make trace data control and customization more flexible and user-friendly.

Benefits​
  • Flexible Trace Sampling: Control how much trace data is stored without backend changes.
  • Custom Attribute Capture: Gain deeper visibility by pulling specific HTTP header values into spans.
  • UI-Driven Configuration: Easily manage settings without requiring manual file edits or redeployments.

Tail Sampling and Memory Limiter Configuration​

In this release, the Traces O11ySource has been enhanced to support UI-based configuration of advanced Tail Sampling and Memory Limiter settings. Previously, any changes to these parameters required manual file-level edits, which were often lost during redeployment. Now, users can easily adjust these settings through the Additional Settings tab, without needing to redeploy the O11ySource. For Tail Sampling, parameters like decision_wait, num_traces, and expected_new_traces_per_sec are now configurable. Similarly, for the Memory Limiter, users can fine-tune limit_mib, spike_limit_mib, and check_interval to better manage resource usage and improve system stability.

Benefits​
  • Easier Configuration Management: Modify sampling and memory settings directly from the UI.
  • No Redeployment Needed: Apply changes at runtime without downtime or redeployment.
  • Better Resource and Data Control: Fine-tune trace volume and memory usage to suit your environment.

Analytics Reports​

Report Builder now applies user-specific views when dashboards are downloaded to improve data security. Previously, all users could access full dashboard data regardless of their permissions. With this update, downloaded reports will only include data that each user is authorized to see. For more details on Report Builder, refer to Report Builder - Managing Reports.

Benefits​

  • Improved Data Security: Ensures users can only download data they are permitted to access.
  • Consistent Experience: Downloaded reports now match on-screen access levels.
  • Better Compliance: Helps meet internal access control and governance policies.

User Management​

The User Management module has been enhanced to better support hybrid Users and Roles configurations. The Created By and Modified By columns in both the Users and Roles sections now display β€œsystem” for roles synced from external directories, making it easier to distinguish them from locally created roles. In the Users tab, two new columns have been introduced: Role(s) for locally assigned roles and Federation Role(s) for roles imported from LDAP/AD. When multiple roles are assigned, an ellipsis (...) appears with a tooltip displaying the full list. Additionally, a CSV Export option is now available from the dashboard.

Benefits​

  • Improved Clarity: Easily identify and differentiate between local and federated roles.
  • Better Visibility: View both local and LDAP/AD roles directly within the Users tab.
  • Easy Reporting: Export user details in one click for audits, reviews, or offline reference.

Grafana 11 Upgrade​

vuSmartMaps now includes the Grafana 11 upgrade, bringing a refreshed and more intuitive interface to the platform. This update introduces improved dashboard navigation, better layout organization, and enhanced visual styling for a smoother and more modern user experience. New chart types like XY charts and improved formatting options provide clearer data visualization. Pagination and smarter filtering also help users manage and explore large datasets more efficiently.

Key Changes

  • UI/UX Enhancements: Updated navigation, layout, and visual styles for a cleaner and more intuitive user experience.
  • Improved Panel Editing: Reorganized configuration options to provide a smoother dashboard editing experience.
  • Enhanced Visualizations: Refreshed chart and table styles with new visual capabilities for a modern and consistent look.
  • Performance and Stability: Overall improvements in responsiveness and reliability.

What Remains Unchanged

  • Dashboard Usage: No changes in how users view or interact with dashboards.
  • Saved Content and Permissions: All existing dashboards, data sources, and user access settings remain intact.
  • Other vuSmartMaps Modules: This upgrade does not affect functionalities outside of Grafana.

Reason for the Upgrade: This upgrade addresses known vulnerabilities in the current Grafana version and ensures alignment with the latest security, stability, and performance standards.

Benefits​

  • Improved Usability: Cleaner interface and better navigation for easier dashboard access.
  • Richer Visuals: New chart types and formatting options help present data more effectively.
  • Better Experience: Enhanced layout and interaction flow for quicker data insights.

Agents​

The vuAppagent (v3.1.0) now captures WebLogic server listener port details, providing more comprehensive server monitoring. Connection handling has also been improved to ensure all connections are properly closed even during error scenarios, preventing open connection build-up and enhancing system stability. Additionally, the agent logic has been enhanced to always select the correct IPv4 address when sending data, ensuring accurate host IP display on dashboards.

Benefits​

  • Improved Monitoring: Provides more detailed WebLogic server insights by capturing listener port information.
  • Better System Stability: Prevents build-up of open connections, even during errors.
  • Accurate Host Information: Ensures the correct IPv4 address is displayed across all dashboards.

Platform​

Object Image Size Reduction​

To improve installation speed and efficiency, several large container images in the platform have been optimized. The total uncompressed package size has been significantly reduced from approximately 40GB, with a goal to cut it by at least half. This helps in achieving faster deployments and reducing setup time for NG installations.

Benefits​
  • Faster Installation: Helps reduce installation time to under 30 minutes.
  • Optimized Resource Usage: Smaller image sizes lower storage and bandwidth needs.
  • Improved Efficiency: Streamlines the deployment process across environments.

Global Time Selector Enhancement​

The Global Time Selector now retains the previously selected absolute time ranges under the Recently Used section. This makes it easier for users to quickly reapply commonly used time ranges across modules like Log Analytics, Reports, Data Models, and Alerts.

Benefits​
  • Improved Usability: Quickly access frequently used absolute time ranges without reselecting.
  • Consistency Across Modules: Provides a uniform experience when switching between different areas of vuSmartMaps.
  • Time-Saving: Reduces repetitive manual time range selections for users working across modules.

Data Retention​

Previously, data retention policies were applied using regex patterns (e.g., vulog*), assuming a consistent naming convention between distributed tables and their corresponding data tables (such as vulog for the distributed table and vulog_data for the data table). However, in cases where users created non-standard data table names like xvulog or vulogx, the regex pattern failed, causing retention mismatches. This issue has now been resolved by automatically fetching the retention policy from the distributed table and applying the same policy to its associated data table, ensuring consistency regardless of naming variations.

Benefits​

  • Consistent Retention Enforcement: Ensures data retention policies apply correctly across both distributed and data tables.
  • Supports Custom Naming: Handles non-standard table names without requiring manual intervention.
  • Reduced Risk of Data Loss or Retention Gaps: Prevents accidental policy mismatches due to naming variations.

Hyperscale​

In this release, Hyperscale has been upgraded to a newer long-term support (LTS) version of ClickHouse, bringing improved stability and performance. JSON data type support is now enabled by default, making it easier to handle dynamic data formats across the platform.

Benefits​

  • Improved Performance: Faster and more stable data processing with the upgraded database version.
  • Better Data Handling: Built-in support for JSON allows smoother storage and analysis of dynamic data.

Insights​

Upgraded Chart.js from version 2.9.4 to 4.4.9 in the Insights module. This upgrade removes previous limitations and enables the use of advanced charting features and customizations. It allows the creation of more dynamic, interactive, and visually rich charts that meet current design and reporting needs.

Benefits​

  • Enhanced Visualization: Allows for more interactive and visually appealing charts.
  • Greater Flexibility: Supports advanced charting features and customizations to meet evolving reporting requirements.

vuSmartMaps NG 2.16.12 Patch Release​

Overview​

vuSmartMapsβ„’ NG 2.16.12 introduces significant enhancements across observability, monitoring, alerting, dashboarding, and platform stability. This patch release focuses on improving operational visibility, strengthening HyperScale reliability, expanding infrastructure and device monitoring coverage, and enhancing overall platform governance and resilience.

The release introduces new capabilities such as Federated Search, Platform Self-Observability Alerts, and HyperScale Guardrails, along with multiple monitoring enhancements for network, firewall, storage, and middleware environments. It also includes new HyperScale monitoring dashboards, RCABot improvements, critical alerting and pipeline stability fixes, and additional O11y Sources for broader infrastructure observability support.

New Features​

Introduced Federated Search capability in Log Analytics, enabling users to perform unified log searches across multiple vuSmartMaps clusters from a single interface. This enhancement improves cross-datacenter visibility by allowing users to query one, multiple, or all configured data centers simultaneously, while providing site-level result identification and partial-result handling for unavailable clusters. The feature is designed to support distributed enterprise deployments while maintaining data residency, security, and operational efficiency requirements.

User Guide: Federated Search

Platform Self-Observability Alerts​

Introduced self-observability alerting capabilities for ingestion components to improve operational monitoring, data freshness tracking, and platform health visibility. The enhancement enables proactive detection of ingestion failures, stream lag, workflow degradation, and component-level bottlenecks across services such as Kafka, ContextStreams, Hyperscale, and related ingestion pipelines. The feature also supports centralized alerting, workflow health computation, and automated RCA integration to assist faster issue identification and resolution.

For more details, refer to the HyperScale Self-Observability and Guardrails Guide.

HyperScale and Alerting Guardrails​

These guardrails are designed to ensure graceful degradation under resource pressure while maintaining the availability of critical observability operations, such as dashboards, alerts, and investigations. The enhancement also introduces configurable limits for query execution and memory utilization to prevent excessive resource consumption during high-load conditions.

For more details, refer to the HyperScale Self-Observability and Guardrails Guide.

Business Text Plugin Packaging​

Added packaging support for the Business Text Plugin within vuSmartMaps NG to simplify deployment and integration workflows. This plugin is used in Browser RUM (BRUM) dashboards and is now bundled as part of the platform distribution for easier installation and upgrade management.

Enhancements​

MS Teams Proxy URL Support​

Added Proxy URL support for Microsoft Teams notification channels in Alerts integration. This enhancement enables alerts and notifications to be routed through configured proxy servers, improving compatibility with enterprise networks and security environments.

NCS-2341/CCBD-4503: Added support for Proxy URL for MS Teams in Alerts notification channel

F5 Load Balancer WAF Metrics Monitoring​

Enhanced the F5 Load Balancer O11y Source to support monitoring of WAF-specific and SSL-related metrics for F5 devices using Web Application Firewall (WAF) modules with SSL offload capabilities. This enhancement improves observability for advanced F5 deployments by enabling the collection and monitoring of additional WAF-related operational metrics.

NCS-2293/CCBD-4505 : Enable WAF Specific Metrics Monitoring in F5 Load Balancer O11y Source

WebLogic ThreadDetails Metric Collection​

Enhanced the WebLogic O11y Source to support end-to-end collection and persistence of the ThreadDetails metricset. This improvement enables storage of thread-level diagnostic information in ClickHouse, including thread status, stuck or hogged thread detection, and other operational thread metrics required for troubleshooting and performance analysis.

CCBD-3898: WebLogic O11y Source: Enable WebLogic ThreadDetails metricset collection

HP-UX Socket Metrics Collection​

Enabled socket metrics collection support in vuHealthAgent for HP-UX environments. This enhancement adds support for collecting and monitoring socket-level metrics such as socket count, socket states, protocol-wise utilization, and network resource usage, improving visibility into HP-UX system networking and operational health.

NCS-2160/CCBD-3899: Enable Socket Metrics Collection on vuHealthAgent for HP-UX

Cisco Switch Monitoring Enhancements​

Enhanced Cisco Switch monitoring support by adding compatibility for additional Cisco Catalyst and Nexus switch models. This enhancement extends the O11y Source capabilities to support monitoring of key network KPIs such as CPU, memory, interface utilization, interface errors, environmental health, and device status, along with dashboarding and alerting support for improved network infrastructure observability.

NCS-2230/CCBD-4502: Cisco Switch Enhancement: Add monitoring support for Cisco Switch models

Cisco Firewall Monitoring Enhancements​

Enhanced firewall monitoring support by adding compatibility for Cisco Firepower 4115 Threat Defense devices. This enhancement enables the collection and monitoring of key firewall metrics through supported data collection mechanisms, along with dashboarding and alerting support for improved firewall observability and operational monitoring.

NCS-2234/CCBD-4504: Cisco firewall Enhancement - Add monitoring support for Cisco Firewall device Firepower 4115

HyperScale GuardRails Dashboards​

Added dedicated dashboards for monitoring HyperScale Guardrails to improve visibility into resource protection, operational thresholds, and platform health. The enhancement also includes support for linking related dashboards from alerts, enabling users to quickly access contextual monitoring views for faster analysis and troubleshooting.

CCBD-4578: Added Dashboards for HyperScale GuardRails

HyperScale Query Profiler Dashboards​

Introduced Query Profiler and monitoring dashboards for HyperScale environments to provide improved visibility into query execution behavior, performance bottlenecks, resource utilization, and slow query analysis. These dashboards help users analyze query patterns, troubleshoot performance issues, and monitor overall HyperScale query health more effectively.

CCBD-3965: Added HyperScale query profiler and monitoring dashboards

RCABot Enhancements​

Implemented minor operational and usability enhancements in the RCABot codebase. The update includes patch-level improvements intended for rollout to customer environments running RCABot on vuSmartMaps NG 2.16.12

CCBD-4355: Minor enhancements for RCABot

Bug Fixes​

User Deletion Data Protection Fix​

Resolved an issue where deletion of a user account unintentionally triggered removal of associated configuration artifacts such as Data Models and Reports. This fix ensures important configurations are retained after user deletion to maintain organizational data continuity and prevent unintended loss of operational assets.

VUQA-6603: Fix for User Deletion Triggering Cascade Config Data Loss

Data Retention and Archival Improvements​

Improved data retention policy handling and archival management to provide safer and more controlled retention operations. The enhancement adds better visibility into retention policy impact, safeguards against unintended large-scale deletions, and fixes an issue where policy removal unintentionally deletes associated cold storage archival data.

CCBD-4521 - Data Retention improvements; Fix the issue - Policy removal, deleting the respective archives in cold storage

User Guide: Data Retention and Archival Improvements

Alert Timestamp Synchronization Fix​

Resolved an issue where timestamp inconsistencies were observed between the Alert Console and the Notification table for the same Alert-ID. This fix ensures synchronized and accurate alert creation timestamps across alerting components for improved consistency and visibility.

NCS-2383/VUQA-6581: Alerts: Timestamp mismatch observed between the Notification table and the Alert Console for the same Alert-ID

Pipeline Stability Fix​

Resolved a pipeline stability issue where pipeline components were entering CrashLoopBackOff state due to vustream processing exceptions in Kafka stream handling. The fix improves pipeline resilience and stability by addressing stream processing failures that were causing repeated pipeline crashes and impacting dashboard data availability.

NCS-2363: Pipeline is going to CrashLoopBackOff state

Alert Update Handling Improvement​

Resolved an issue where alerts were not transitioning correctly to the β€œAlarm Update” state when processing large alert payloads containing oversized message fields. The fix improves alert update handling by preventing failures caused by oversized alert_doc data and ensures consistent alert state updates for repeated alert executions.

NCS-2418/VUQA-6628: Alert update issue caused by oversized alert_doc

Known Issues​

S. No.Ticket No.IssueSeverity
15231Kafka cluster id is different from the one from that of zookeeperS1
25680Telegraf based o11y sources are not getting pods created.S1
34947User Management: Help text is not proper in User roleS2
45138Log Analytics: Save button should be disabled for the role who doesn't have access to the tableS2
55273User Management:Write access to a data model should not be downgraded by assigning read access to an alertS2
65687User specific view - Data Source permissions not being reflected in the Report Builder section.S2
75686Data Source Module permissions are not getting reflected.S2
85596ContextStreams: UI Issues in Plugin Selection and Processing Block Edit in Pipelines Page. PFA for issue details.S2
94963Alert Rules: The Auto Remediation column should be available in the Alert Console and all the Alert Channel detailsS3
105130UTM: The Non existing Data model still shows up in UTMS3
115313Report : Target and Avg_CPU name should be corrected in downloaded reportsS3
125144Report Generation : There is no < / > / == / != filter for download count field in Generated Reports tabS4

*S5, S4, S3 & S2 issues will be prioritized in the NG 3.0 release. S1 - Critical. S2 - Major, S3 - Moderate, S4 - Minor, S5 - Cosmetic.

Issues Fixed​

S. No.Ticket No.IssueSeverityStatus
15474ContextStreams Default Dashboard having errors.S2Fixed in NG 2.16
25468Failure of the View All button in the notification bell icon module.S2Fixed in NG 2.16
35338Report Builder: Creating a Reports using Chart is failingS2Fixed in NG 2.16
45299Report : Sorting on Name column is not working properly.S2Fixed in NG 2.16
55334[Kafka-Perf] Kafka lag is observed in CH (For windows event logs)S2Fixed in NG 2.16
65299Report : Sorting on Name column is not working properly.S2Fixed in NG 2.16
75132Dashboards: Shortened URL results in a "Page Not Found" error when accessed from the dashboard.S3Fixed in NG 2.16
85184ContextStream- Unable to navigate to particular data by specifying the data preview block number.S3Fixed in NG 2.16
95397P95 Latency block showing NaN in the AWS ALB Dashboard.S3Fixed in NG 2.16
105390P95 Latency block showing NaN in the AWS ALB Dashboard.S3Fixed in NG 2.16
115362LDAP configuration : Editing an LDAP-imported user role creates a new role instead of updating the existing oneS3Fixed in NG 2.16
125268Export All Functionality in Definitions > Email/Mobile Group Module Does Not Match Column Order Displayed in GUIS3Fixed in NG 2.16
135274License Management : User is able to access all the modules even if the license is expiredS4Fixed in NG 2.16

Release Attributes​

Build/Module NameNG 2.16
User GuideAlerts - Manage Alerts
Configurations & Preferences - ITSM Configurations
Browser RUM - User Session Insights
Log Analytics
Accessing vuSmartMaps – Logging In
Platform Adoption and Engagement - Configurational Metrics Dashboard
Platform Adoption and Engagement - Operational Metrics Dashboard vuApp360 - Client Side Traces Instrumentation
Report Builder - Managing Reports
Federated Search
Data Retention and Archival Improvements
All the user guide links in this document are up to date and align with NG 2.16 updates.
FilenamevuSmartMaps_offline_NG-2.16.tar.gz

System Requirements​

The supported browser version is Chrome & Version 109 or above.

Upcoming Release​

We are excited to announce the upcoming vuSmartMaps NG 3.1 release, which will bring a range of new features and enhancements to further strengthen your observability experience. Stay tuned for more updates as we continue to evolve and improve vuSmartMaps to meet your needs.

note

We are developing a migration plan for customers using versions 8.x or 9.x to transition them to the NG release.

Support​

support@vunetsystems.com

NG 2.14

πŸ—“οΈ ⏱️ 22 min read

Overview​

We are excited to announce the latest release, which brings a wide range of enhancements to elevate user experience, expand capabilities, and improve system performance. This update includes new O11ySources, integration with Zoho Cliq for alert notifications, enhanced ticket management, and improved documentation with Docusaurus. The vuApp360 Trace Map offers clearer trace analysis, while ContextStreams introduces new features like the Clear button and export functionality. Additionally, updates to User Management simplify bulk permission assignments, and data storage enhancements provide better memory utilization insights. Other highlights include LDAP configuration improvements, custom dashboard visualizations, and the new Sizing Calculator for resource planning. With these updates, users can expect a more efficient, flexible, and insightful platform experience.

Key Highlights​

  • Alerts: Zoho Cliq is now integrated with vuSmartMaps to send alert notifications with key details, easily configurable through the Preferences module.
  • Alert Console: Enhanced ticket management now allows users to create and view tickets directly from the Alert Listing and Details pages, improving workflow and usability.
  • Docusaurus Integration for Documentation: The user guide is now integrated with vuSmartMaps using Docusaurus, offering offline access, version control, and seamless access during deployment, improving documentation reliability and usability.
  • vuApp360: The new Trace Map replaces the Flame Graph, List View, and Database View, offering a clearer and more efficient way to analyze trace data, while the vuApp360 Dashboards now include pre-sampling for focused performance insights.
  • Dashboard: The Custom Dashboard List Visualization organizes dashboards into category-based cards, offering sorting options and personalized panels for quicker access and smoother navigation.
  • ContextStreams: ContextStreams debugging is enhanced with a Clear button for manual data clearing, capped logs at 500 entries, repositioned loading messages, and updated button labels and colors for improved usability and clarity.
  • User Management: Bulk Permission Management lets the admin assign permissions to multiple objects at once, with implicit permissions and improved control.
  • User Federation: LDAP configuration fields have been moved from the Identity Provider UI to the User Federation UI, streamlining the process and improving federation settings management.
  • Data Retention: Data retention management in HyperScale now supports NFS-based storage for simplified data archival, along with improved retention policies, automated scheduling, and enhanced auditing features for more efficient data management.
  • Data storage: Enhancements to the Hot, Warm, and Archive data storage tabs now display memory utilization with color-coded levels and a new Show System Tables option to view hidden internal tables.
  • Data Model: The vuSmartMaps Metric API offers a unified interface for efficient data retrieval, supporting flexible time range queries, dynamic filtering, and column-specific queries, tailored for use cases like LAMA (Log Analytics and Monitoring Application).
  • Journey Workbench (JWB): Journey Workbench (JWB) 1.0 offers a centralized dashboard for business observability in Payment Journeys, with customizable attributes, drill-down storyboards, dynamic UTM generation, and multi-tenancy support for secure, tailored views.
  • Sizing Calculator: The Sizing Calculator helps users estimate the required vCPUs, memory, storage, and pricing for vuSmartMaps, enabling better resource planning and cost management.
  • Streamlined Data Summarization and Roll-Ups: The TTL Roll-Up Methodology summarizes historical data at regular intervals to reduce storage needs, speed up queries, and simplify analysis, with an automated script for easy setup.