Service Level Health
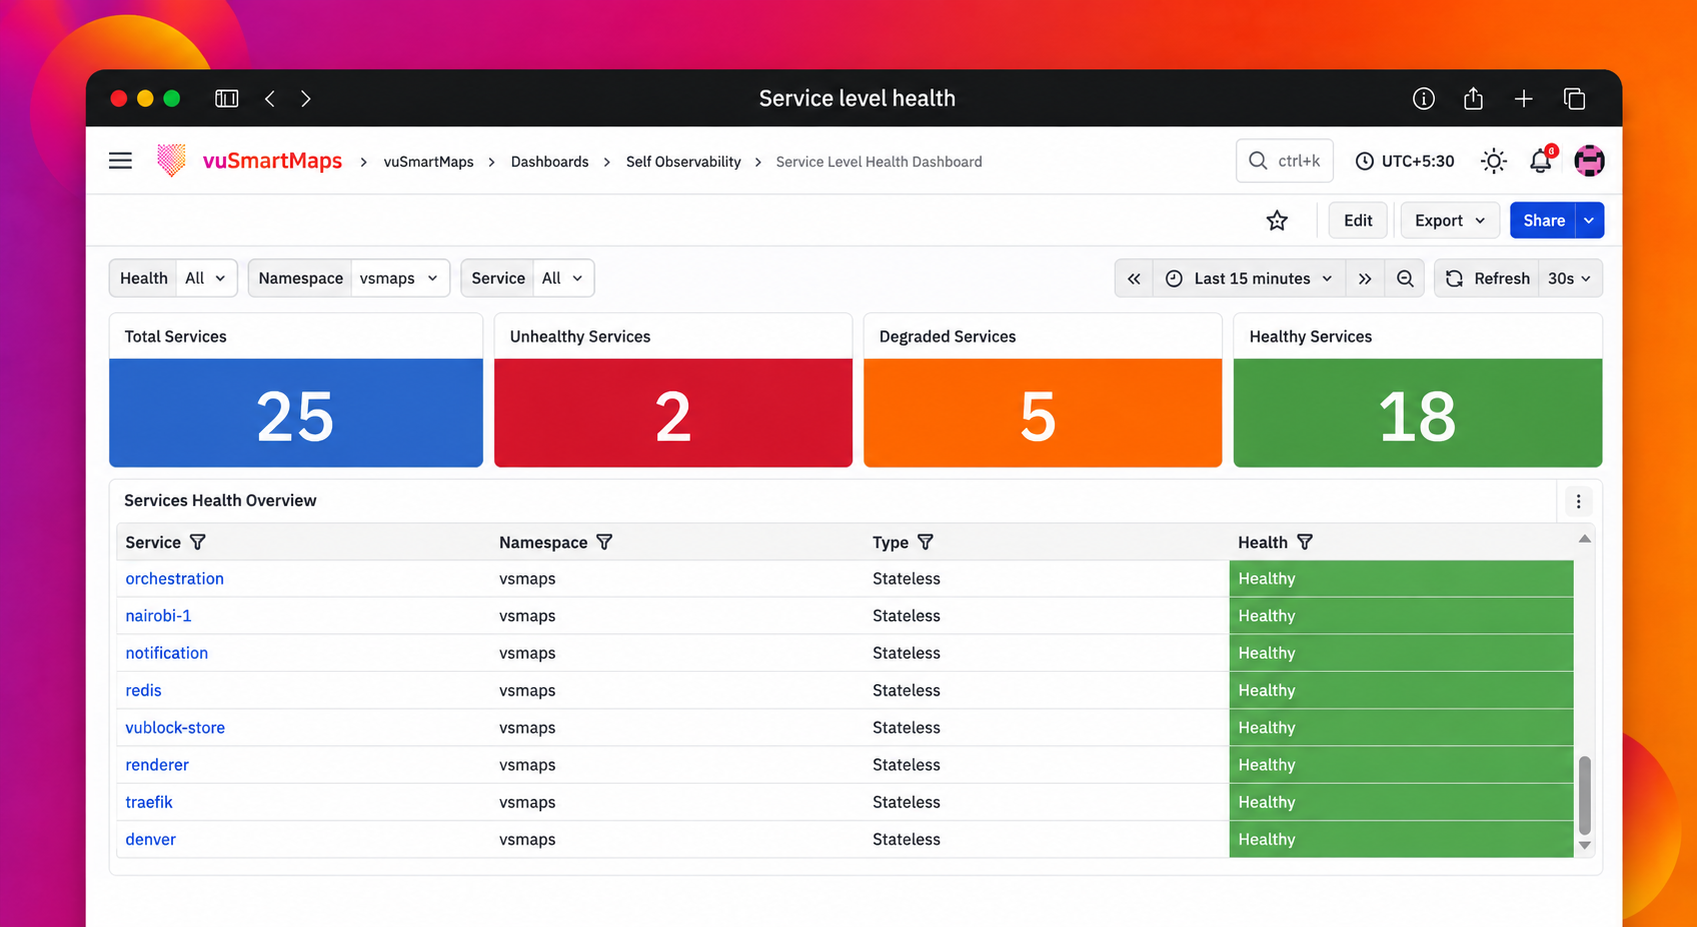
Overview
The Service Level Health capability continuously monitors the operational health of services running in the vuSmartMaps environment. It collects pod-level Kubernetes telemetry for CPU usage, memory usage, disk usage, pod restarts, and availability, and combines these signals to determine the current health of each service. The feature consists of two dashboards that support the complete service-health investigation workflow:
- Service Level Health Dashboard: Provides a consolidated view of the health of all monitored services and highlights services affected by CPU, memory, disk, restart, or availability-related conditions.
- Service Level Health – Drilldown Dashboard: Provides detailed pod-level health information for a selected service, including resource utilization, restart information, health trends, and recent pod logs.
The framework also provides six service-health alerts that notify users when a service enters a Degraded or Unhealthy state. Together, these capabilities help identify affected services and pods before the condition causes a wider impact on platform operations.
Scenarios Considered
The Service Level Health capability supports the following monitoring scenarios:
- A Service Is Running Out of CPU or Memory: CPU or memory consumption may increase as the workload grows. The dashboard helps identify services and pods approaching or exceeding the configured health thresholds.
- A Pod Is Restarting Repeatedly: A pod may enter a restart loop while the overall service still appears available. Restart monitoring helps identify pod instability before it affects service reliability.
- The Shared Data Disk Is Filling Up: ClickHouse, ClickHouse Keeper, PostgreSQL, Kafka, Zookeeper, and MinIO use the shared data volume. A disk-capacity issue can therefore affect multiple services mounted on the same volume.
- A Stateful Service Loses Replicas: Stateful and clustered services depend on the required number of available pods or brokers. Replica loss can cause the service to become Degraded or Unhealthy.
- A Stateless Service Loses Replicas: Deployments and DaemonSets may lose available replicas without the complete service immediately becoming unavailable. Availability monitoring helps identify partial or complete replica loss.
Comprehensive Understanding
The Service Level Health framework includes two dashboards and six alerts. When the capability is enabled, service health is continuously calculated from pod-level telemetry and presented through health indicators, service-level summaries, alert notifications, and pod-level drilldown information.
The framework can represent the current service condition as Healthy, Degraded, Unhealthy, or Stopped, where applicable. The applicable CPU, memory, disk, restart, and availability signals are evaluated to determine the overall health of the service. The overview dashboard helps identify which services require attention and the health signal responsible for the condition. The drilldown dashboard then helps identify the exact pod affected and provides supporting trends and logs for further investigation.
Panel Options
Each dashboard panel includes a three-dot menu in the top-right corner that provides additional panel-level actions:
- View: Opens the panel in an expanded view.
- Edit: Opens the panel configuration for editing.
- Share: Provides options to share the panel.
- Explore: Opens the panel query in Explore for further analysis.
- Inspect: Displays detailed information about the panel, including its data and query details.
- More: Provides additional panel-specific options.
Service Level Health Alerts
The following alerts are available as part of the Service Level Health capability:
- Self-Observability Services High CPU Usage: Generated when one or more pods in a service cross the configured CPU health threshold.
- Self-Observability Services High Memory Usage: Generated when one or more pods in a service cross the configured memory health threshold.
- Self-Observability Services Pod Restarts: Generated when a pod restarts repeatedly within the monitored time window.
- Self-Observability Services High Disk Usage: Generated when the shared data volume crosses the configured disk-usage threshold. This is a node-level alert that applies to the services using the shared data volume.
- Self-Observability Services Statefulset Pod Unavailability: Generated when a stateful service loses the required pods, brokers, or quorum.
- Self-Observability Services Stateless Pod Unavailability: Generated when a Deployment or DaemonSet loses available replicas.
Alert Mail Notifications
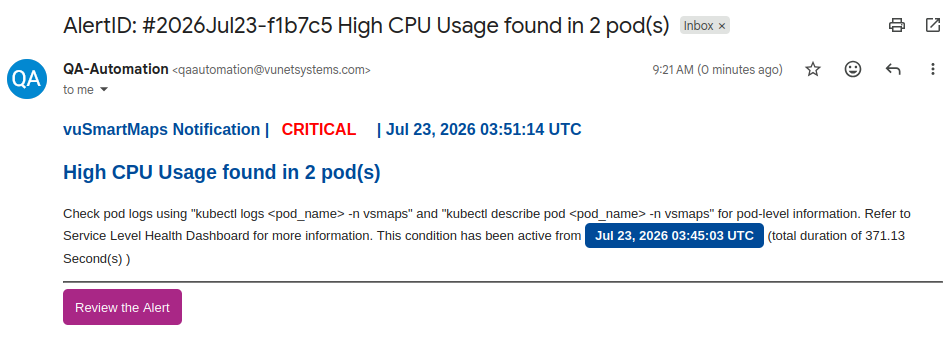
A Service Level Health alert notification is sent through email when a service enters a Degraded or Unhealthy state because of CPU, memory, disk, restarts, or availability. The email subject identifies the alert and the affected service. The notification also displays information about the pods or services responsible for the breach.
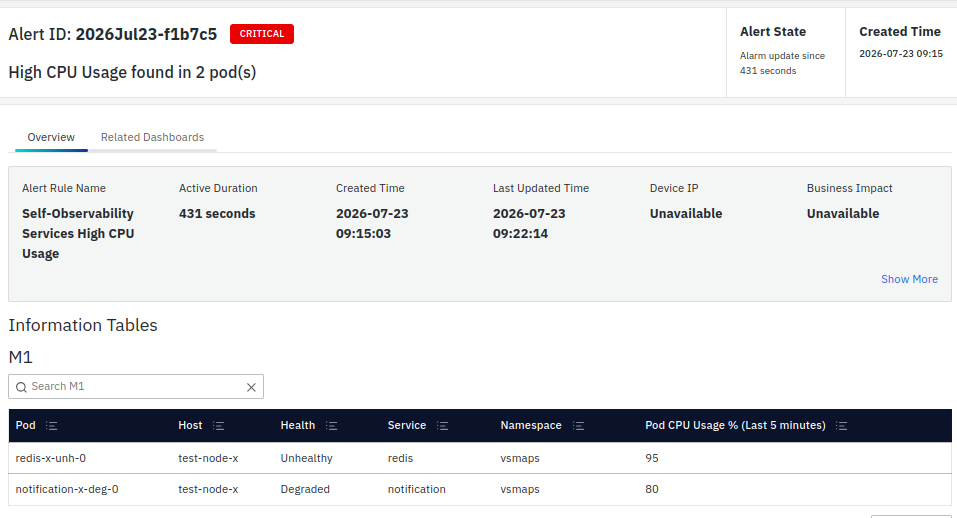
The Review the Alert option opens the corresponding alert in the Alert Console, where the complete alert information can be reviewed. From the alert details, the Related Dashboards section provides access to the Service Level Health Dashboard for further investigation.
Service Level Health Dashboard
The Service Level Health Dashboard provides a consolidated view of the current health of all monitored services. It displays overall service counts, individual service-health states, active service alerts, health distribution, breach categories, top resource-consuming pods, pod restarts, service availability, and shared-disk usage.
The dashboard helps identify the affected service and the signal responsible for its current health state. Service names displayed in the Services Health Overview and Active Service Alerts tables are clickable and provide direct access to the Service Level Health – Drilldown Dashboard for the selected service.
Dashboard Panels
The Service Level Health Dashboard is divided into the following sections:
- Filters
- Service Health Summary
- Services Health Overview
- Active Service Alerts
- Health Summary
- Breaches by Category
- CPU Utilization – Top Pods
- Memory Utilization – Top Pods
- Pod Restarts – Top Pods
- Availability – Lowest Services
- Disk – Shared Data Volume
Service Health Summary
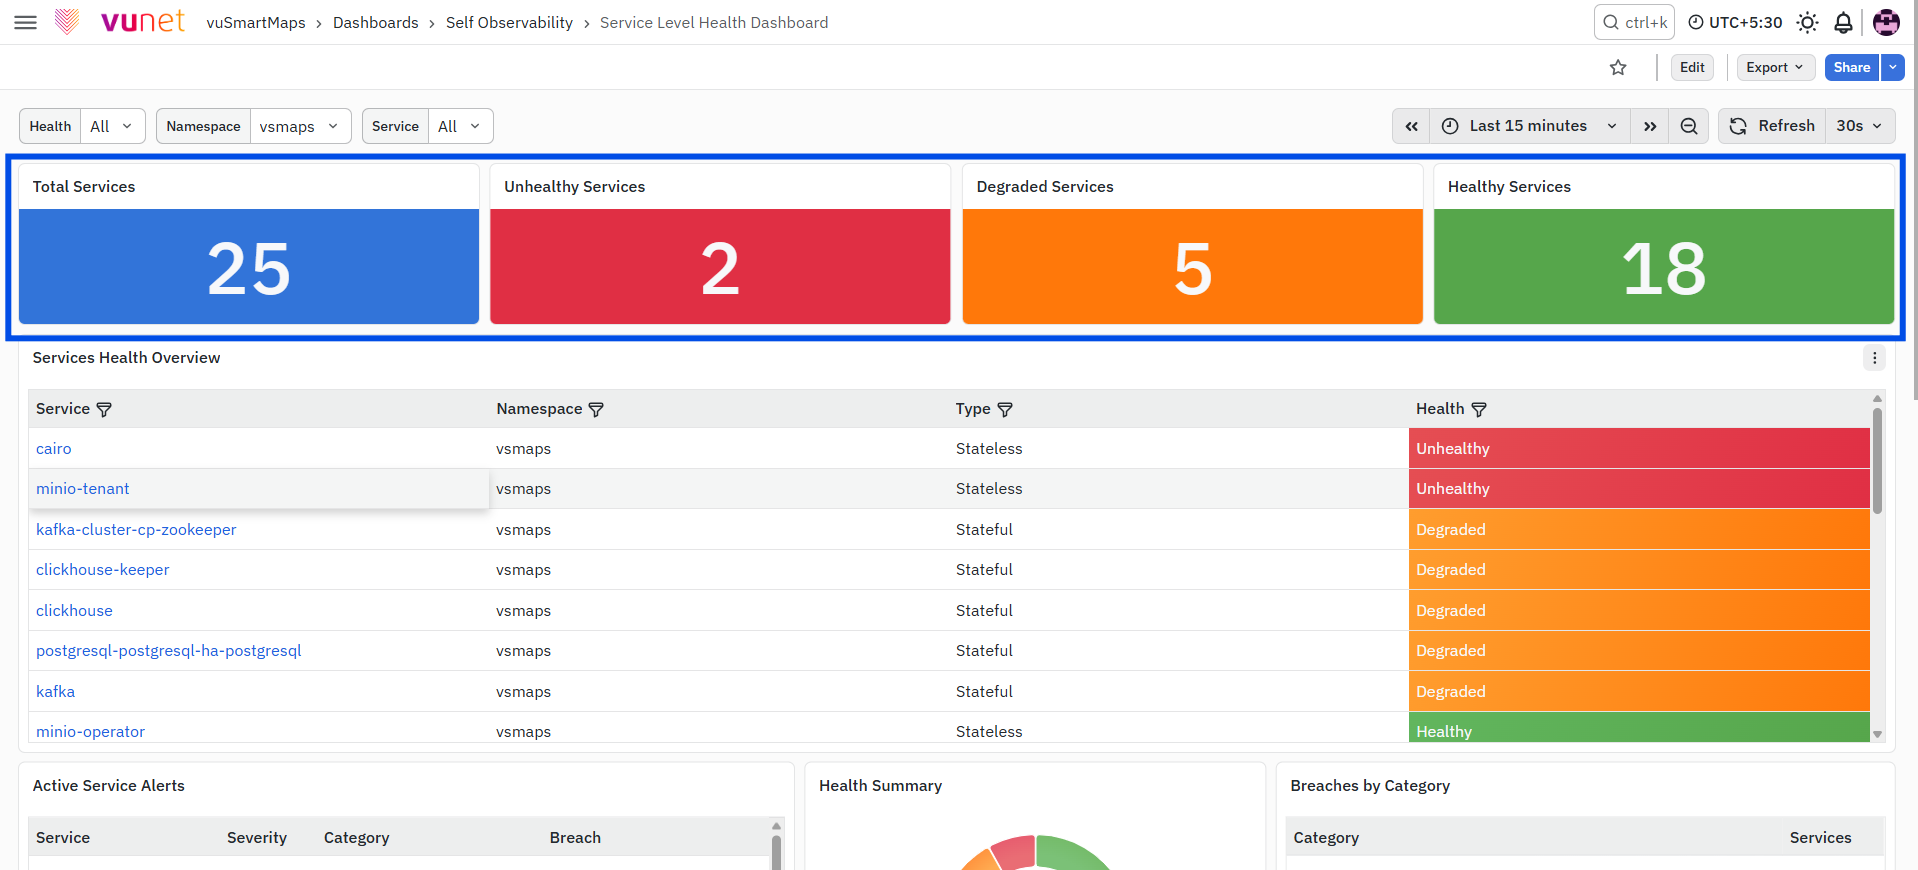
The Service Health Summary provides an overall view of the current health of the monitored services.
- Total Services: Displays the total number of monitored services for the selected filters.
- Unhealthy Services: Displays the number of services currently classified as Unhealthy.
- Degraded Services: Displays the number of services currently classified as Degraded.
- Healthy Services: Displays the number of services currently classified as Healthy.
These panels help identify the overall service-health condition without reviewing each service individually.
Services Health Overview
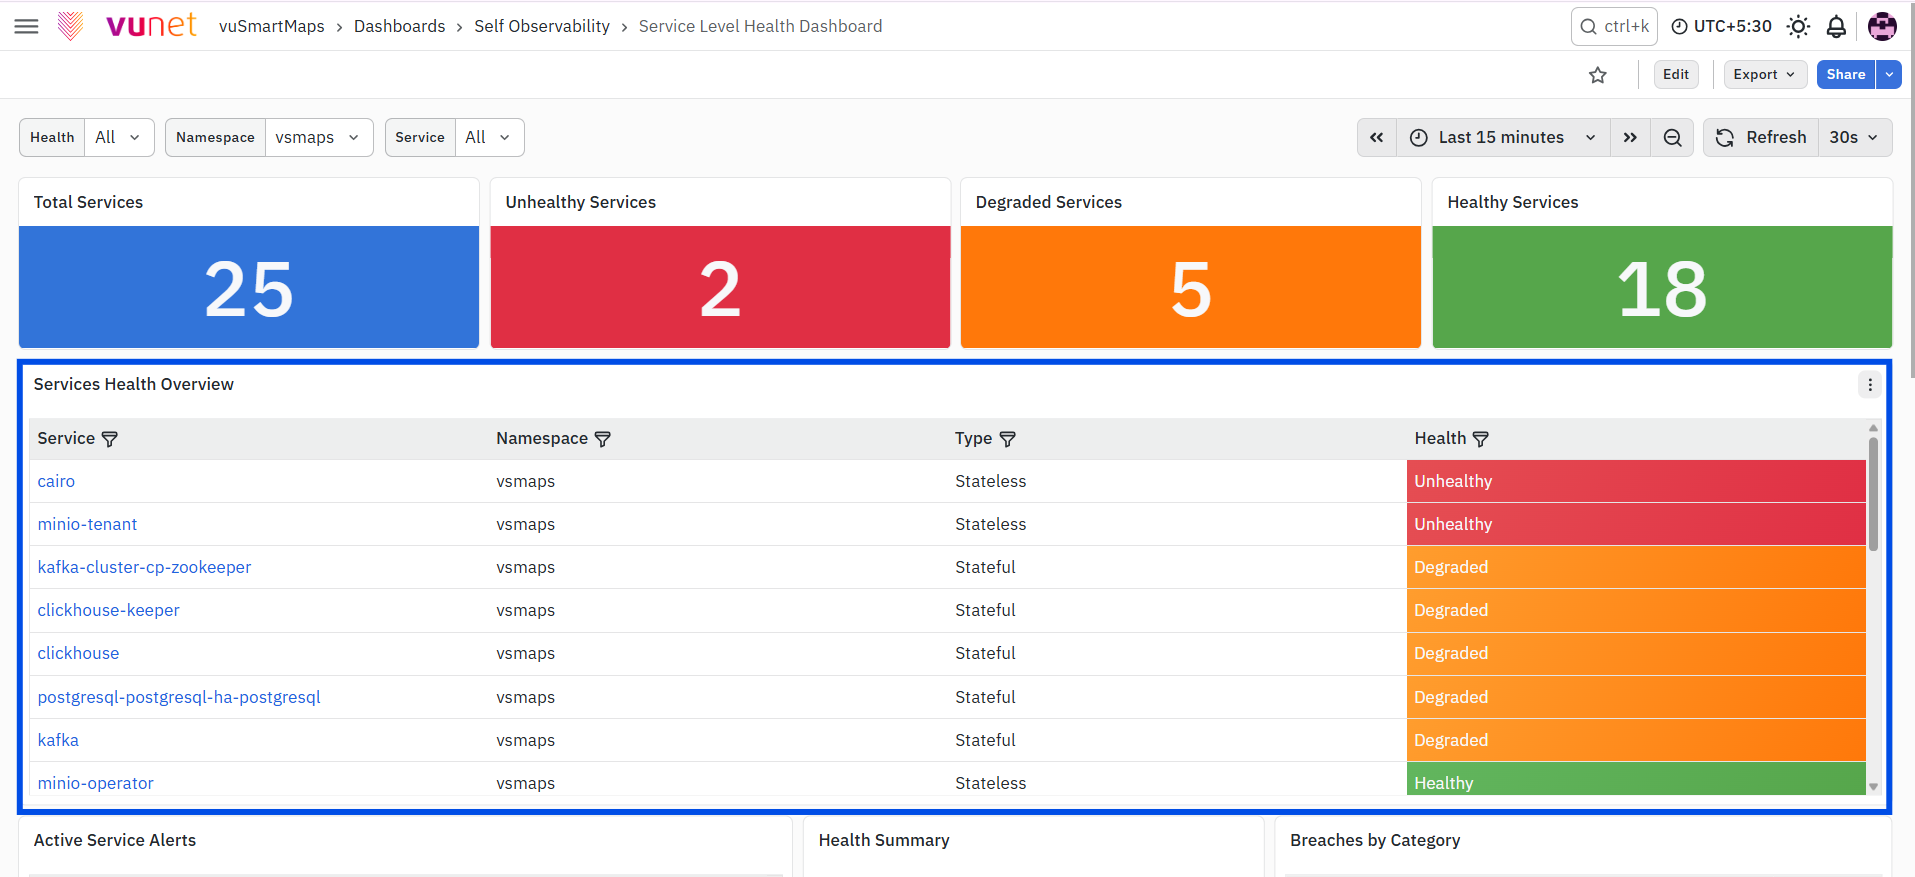
The Services Health Overview table displays the current health information for each monitored service. The table contains the following fields:
- Service: Displays the name of the monitored service as a clickable link. Selecting the service name opens the Service Level Health – Drilldown Dashboard, with the selected service automatically applied in the Service filter.
- Namespace: Displays the Kubernetes namespace in which the service is running.
- Type: Displays whether the service is Stateful or Stateless.
- Health: Displays the current health of the service, such as Healthy, Degraded, or Unhealthy.
The table provides a consolidated view of service health and helps identify services that require pod-level investigation.
Active Service Alerts
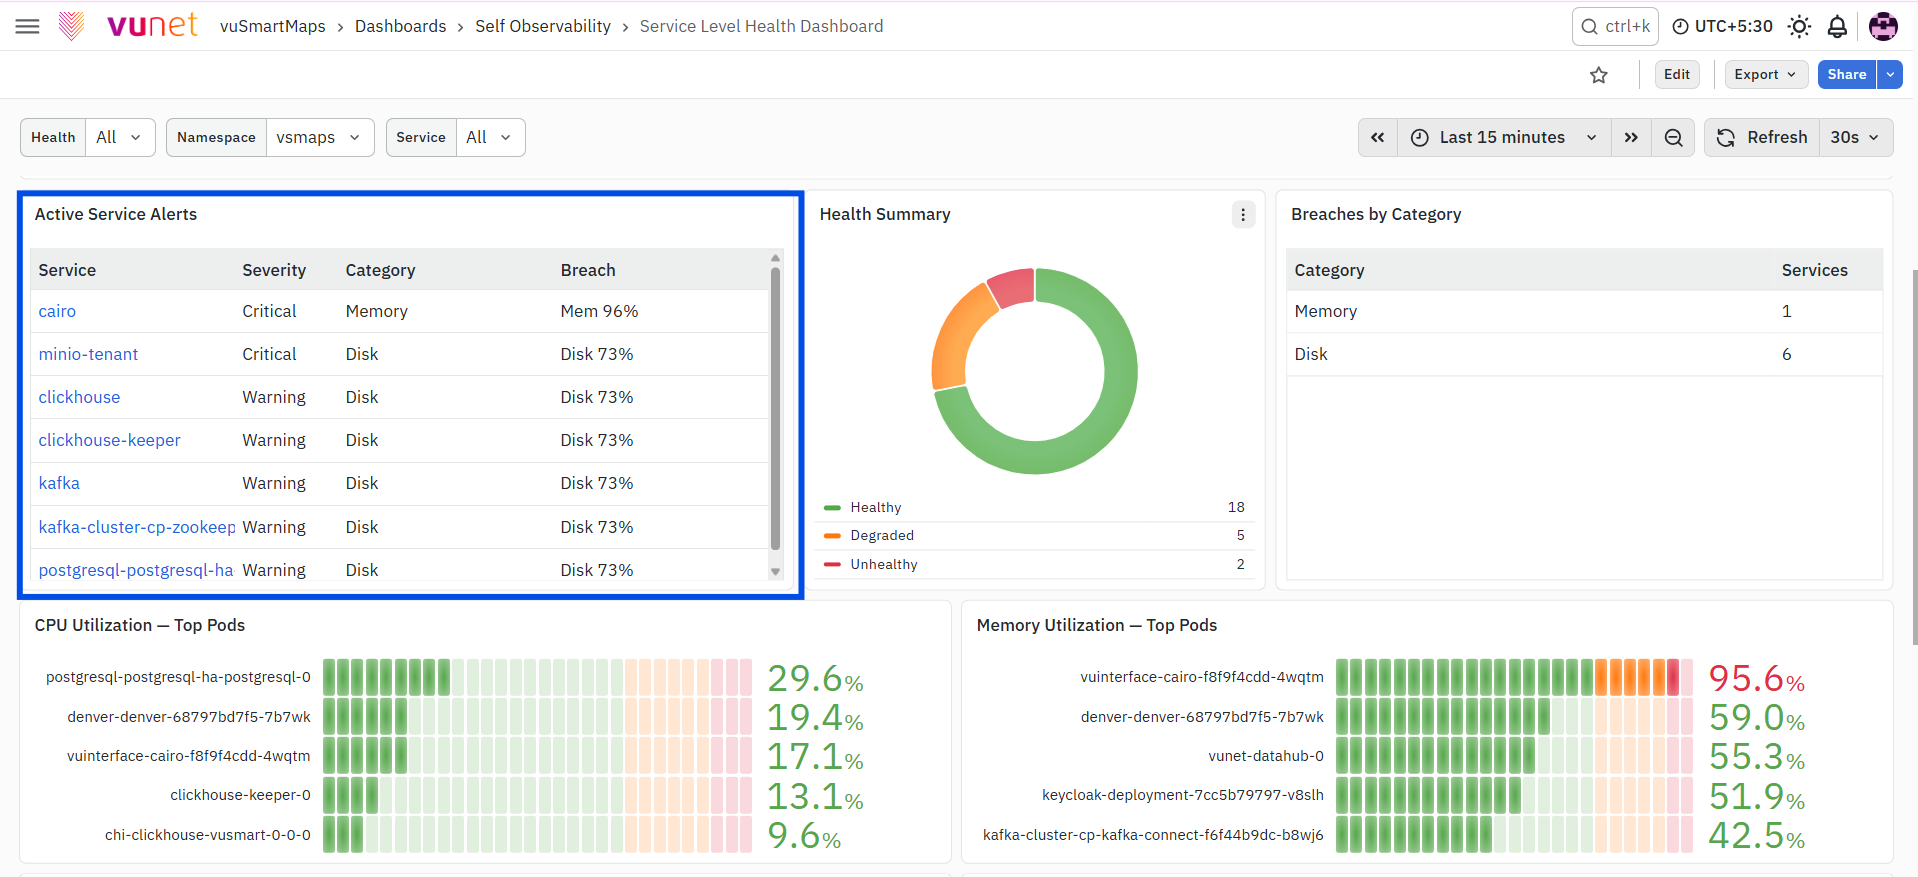
The Active Service Alerts table displays services that currently have an active service-health breach. The table contains the following fields:
- Service: Displays the affected service name as a clickable link. Selecting the service name opens the Service Level Health – Drilldown Dashboard, with the affected service automatically selected.
- Severity: Displays the severity of the health breach, such as Warning or Critical.
- Category: Displays the health signal responsible for the breach, such as CPU, Memory, Disk, Restarts, or Availability.
- Breach: Displays a summary of the detected breach, including the affected metric and its current value, where applicable.
This table helps identify the affected service, the severity of the condition, and the health signal responsible for the current service-health state.
Health Summary
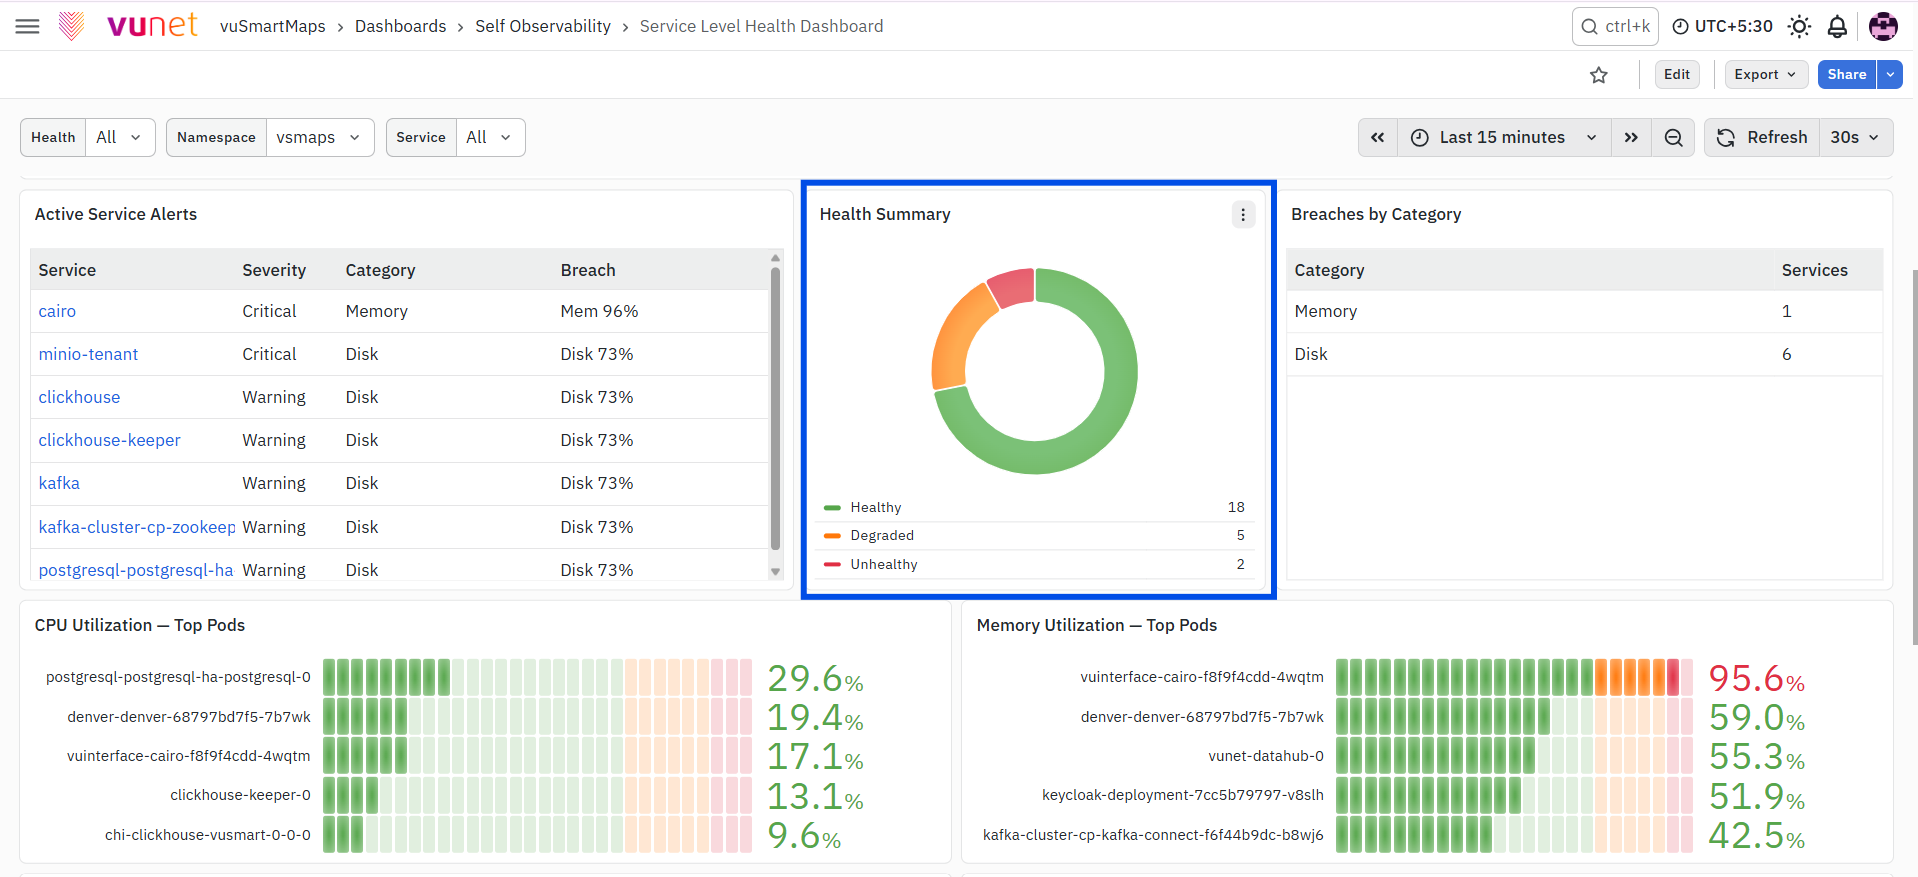
The Health Summary panel displays the distribution of monitored services according to their current health state.The donut chart provides a visual comparison of Healthy, Degraded, Unhealthy, and Stopped services, where applicable. The corresponding service count is displayed for each available health state. This panel helps determine whether service-health issues are limited to a small number of services or affect a larger portion of the environment.
Breaches by Category
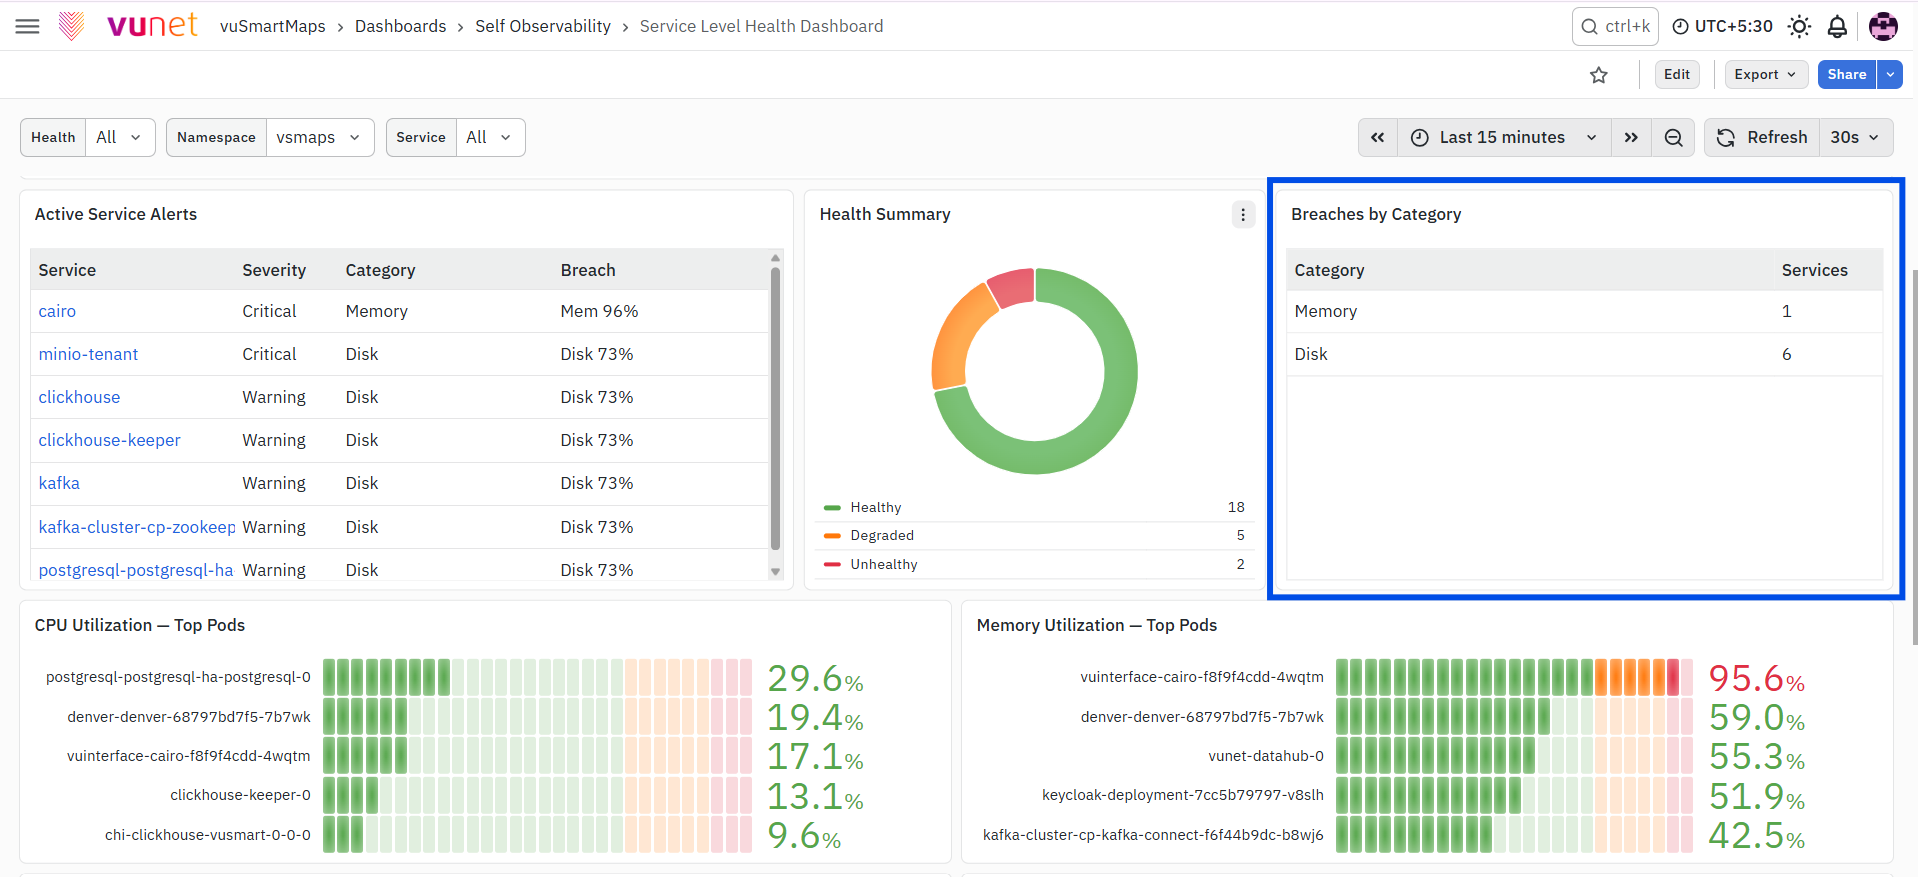
The Breaches by Category table displays the number of services currently affected by each health-signal category. The table contains the following fields:
- Category: Displays the health signal responsible for the breach, such as CPU, Memory, Disk, Restarts, or Availability.
- Services: Displays the number of services currently affected by the corresponding category.
This table helps determine whether the current service-health issues are primarily related to resource utilization, service availability, repeated restarts, or disk capacity.
CPU Utilization – Top Pods
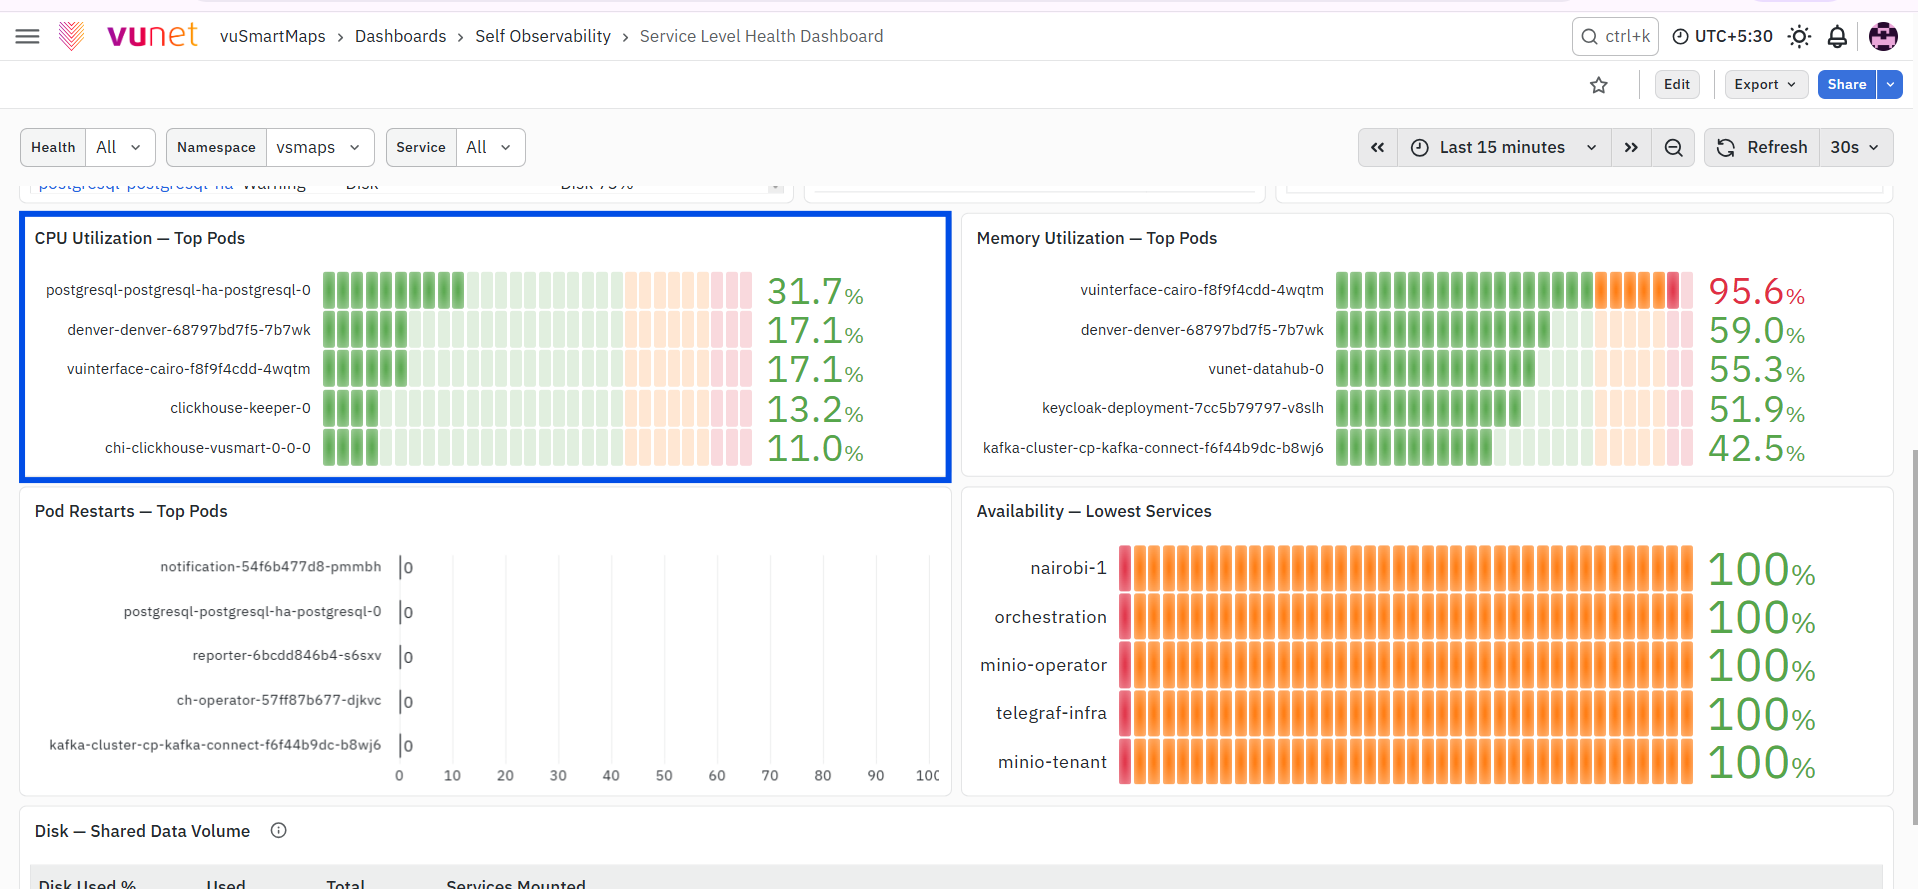
The CPU Utilization – Top Pods panel displays the pods with the highest current CPU utilization. The panel displays each pod name together with its CPU utilization percentage. It helps identify pods consuming comparatively higher CPU resources and supports further investigation when a service is classified as Degraded or Unhealthy because of CPU usage.
Memory Utilization – Top Pods
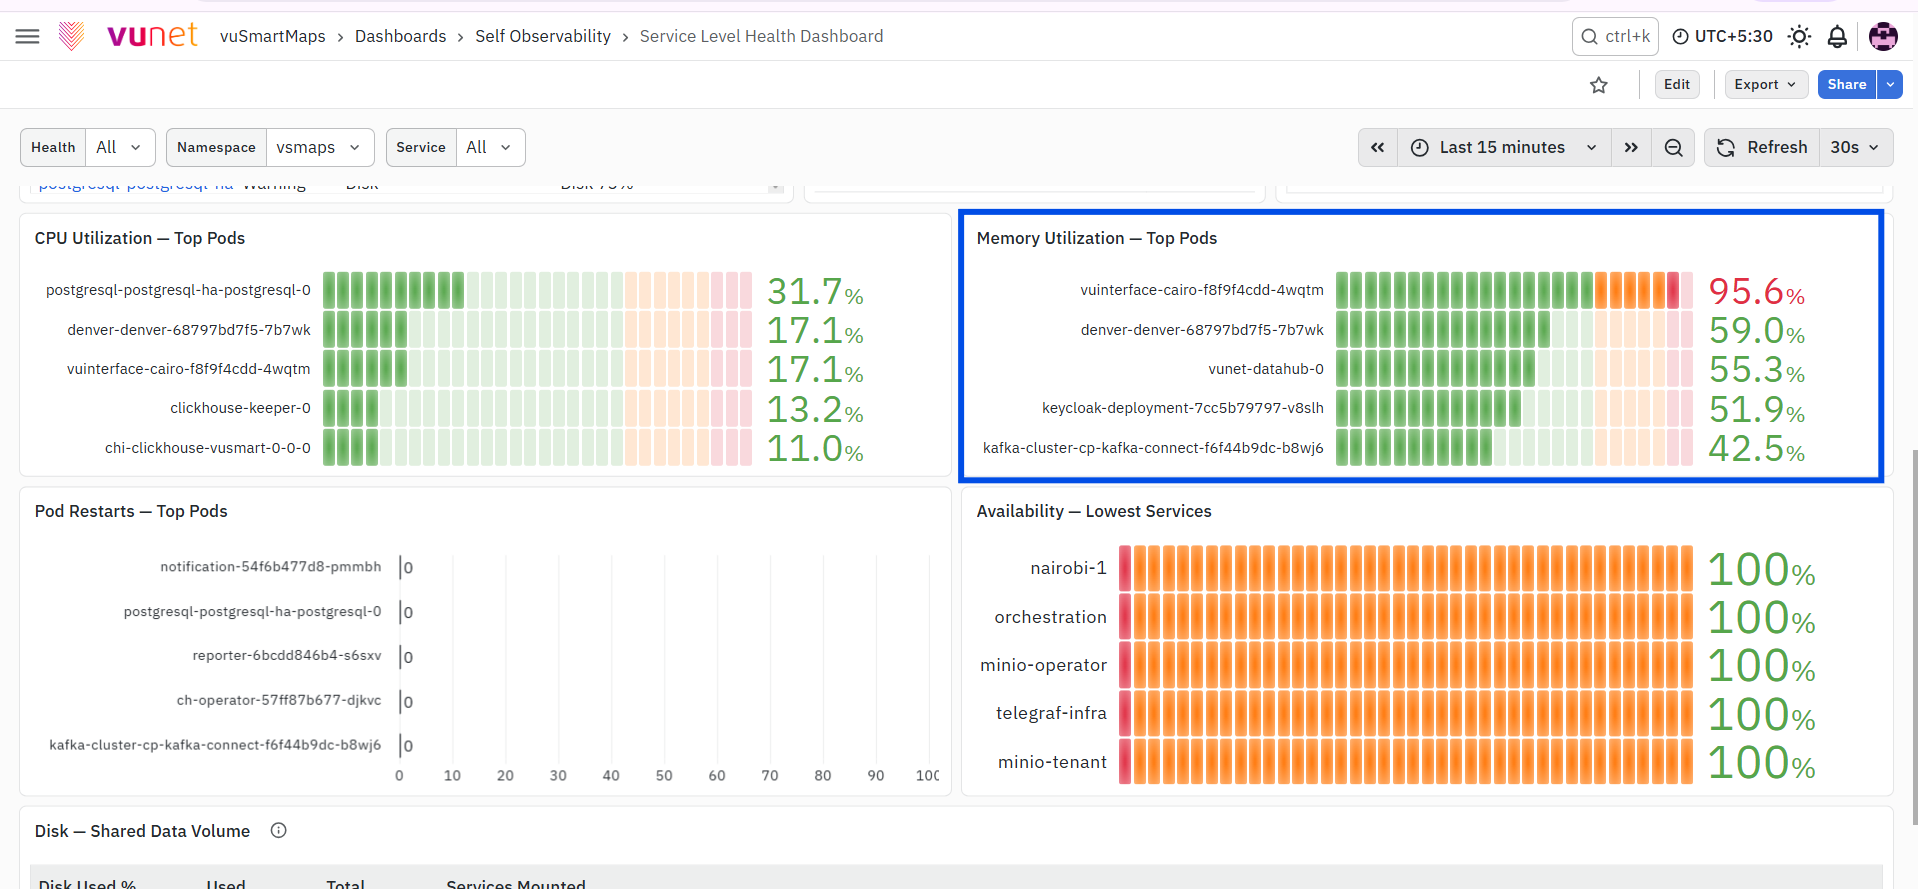
The Memory Utilization – Top Pods panel displays the pods with the highest current memory utilization. The panel displays each pod name together with its memory utilization percentage. It helps identify pods with high memory consumption and determine whether memory usage is contributing to the current service-health condition.
Pod Restarts – Top Pods
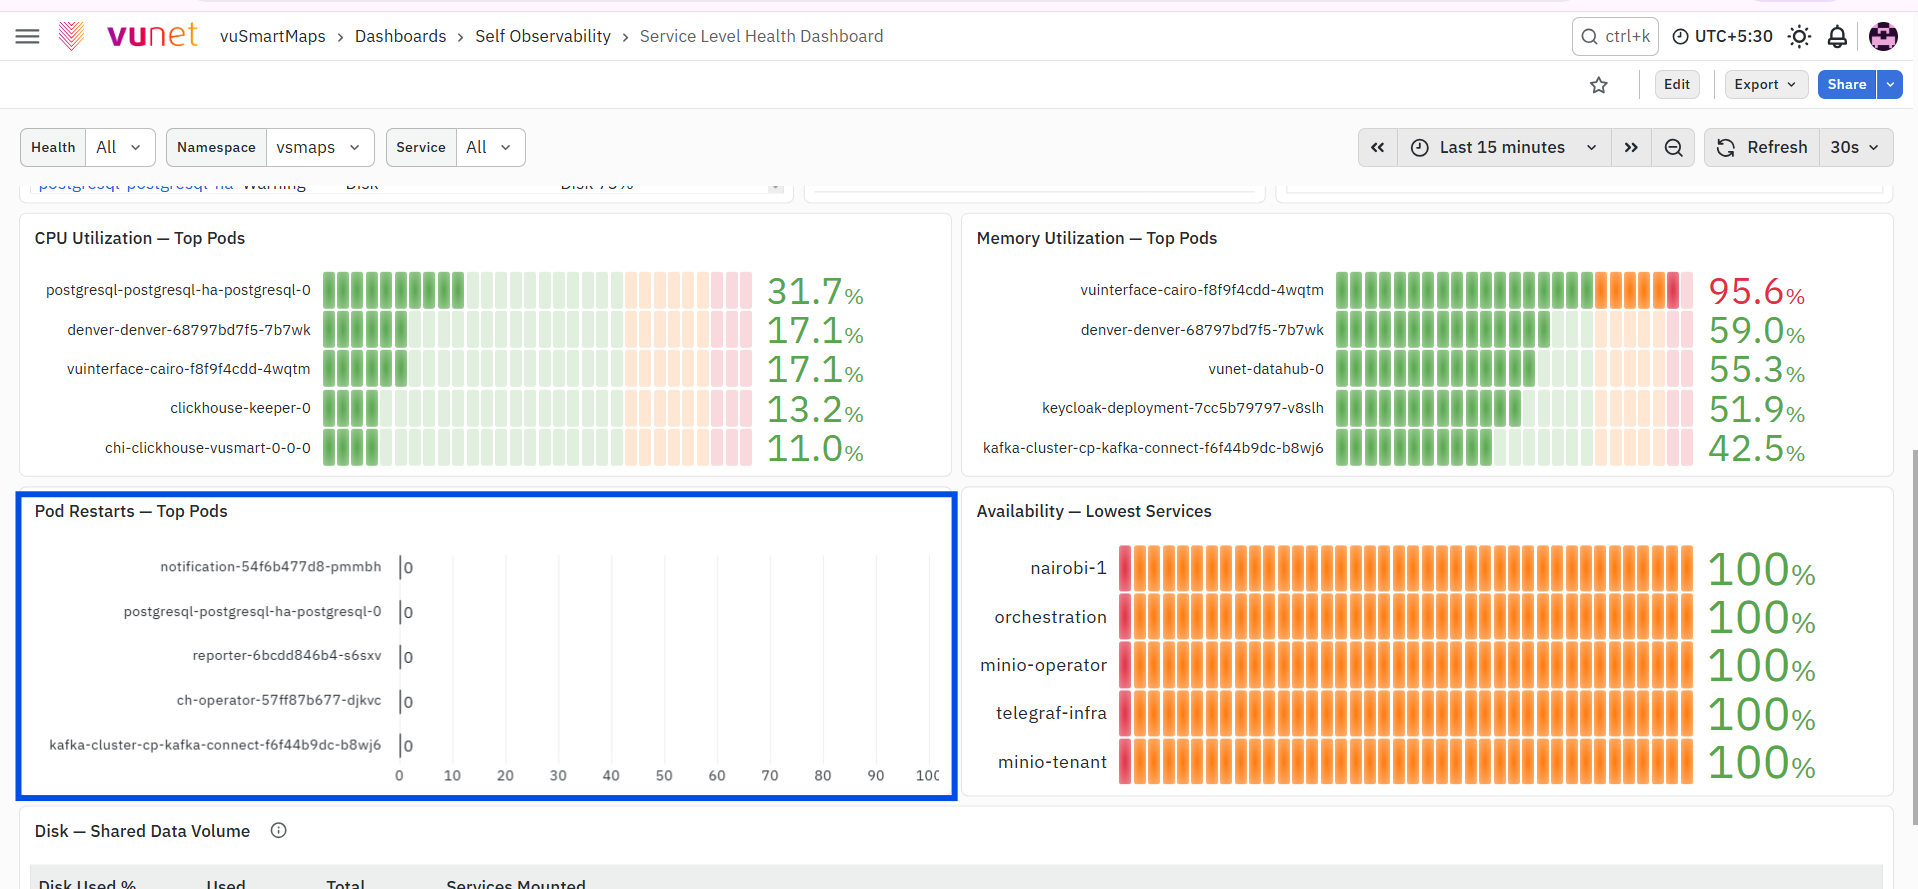
The Pod Restarts – Top Pods panel displays the pods with the highest number of restarts during the monitored interval. The panel helps identify pods that are restarting repeatedly or showing signs of instability. Pods with repeated restarts can then be investigated through the Service Level Health – Drilldown Dashboard.
Availability – Lowest Services
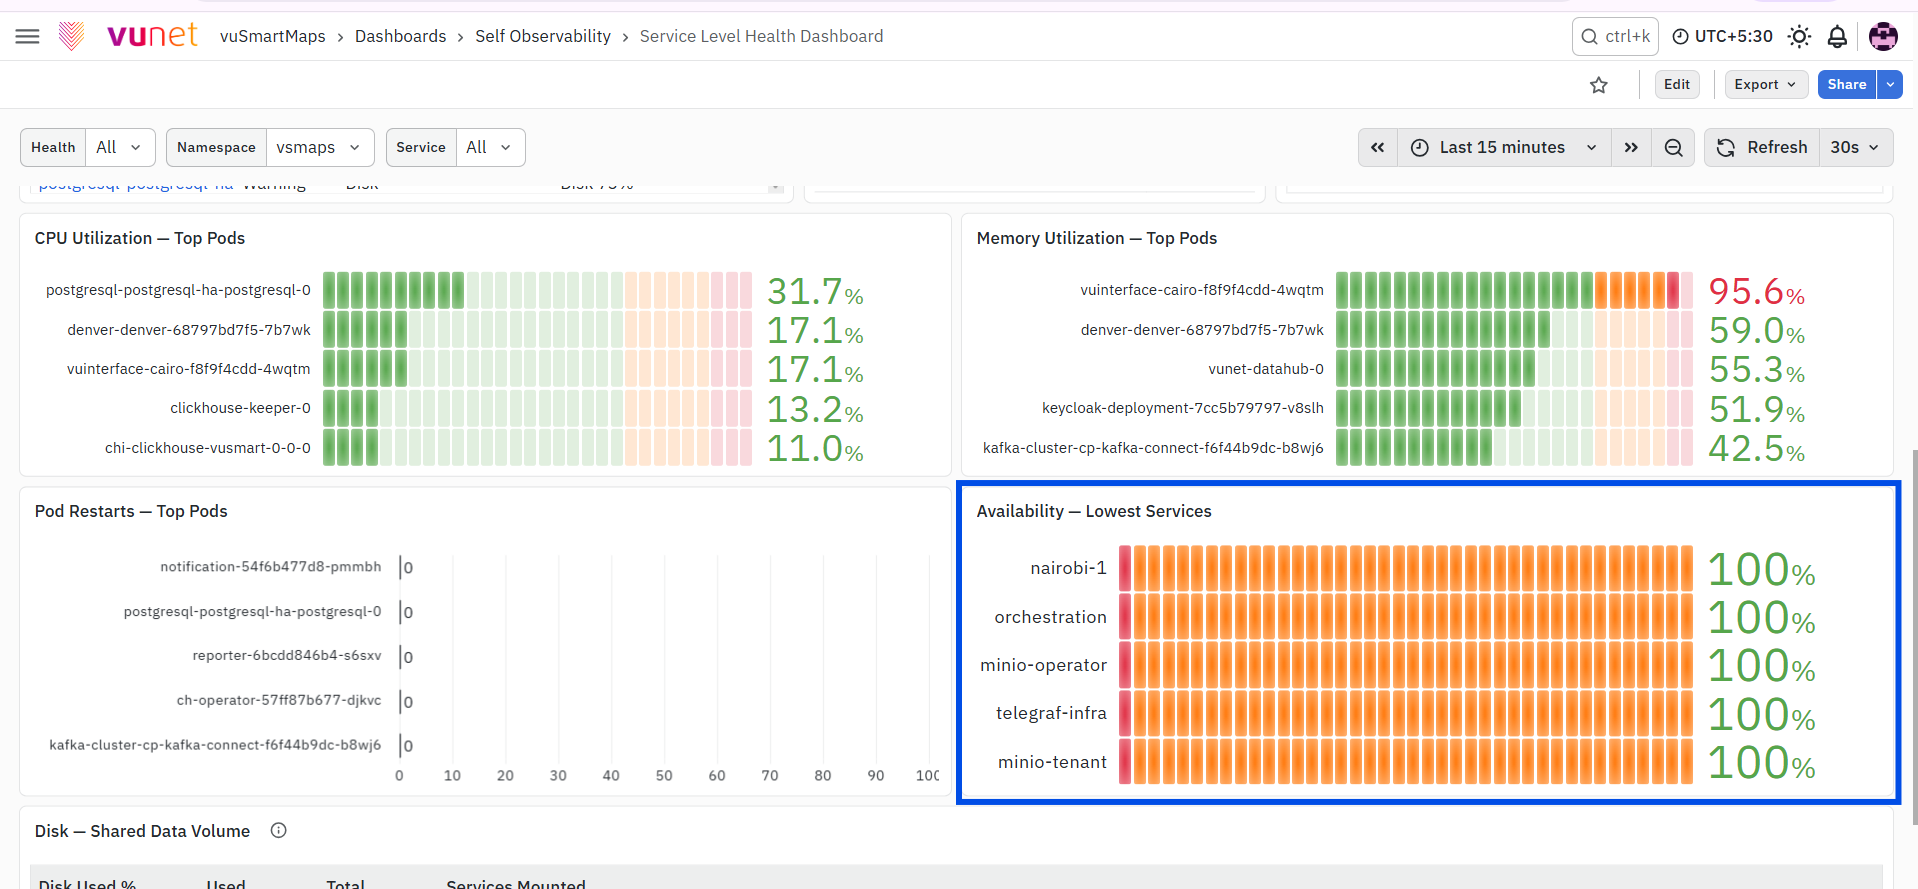
The Availability – Lowest Services panel displays the services with the lowest availability. The panel shows the availability percentage of each listed service based on its available or ready replicas. This helps identify services that have lost one or more replicas, even when the service has not become completely unavailable.
Disk – Shared Data Volume
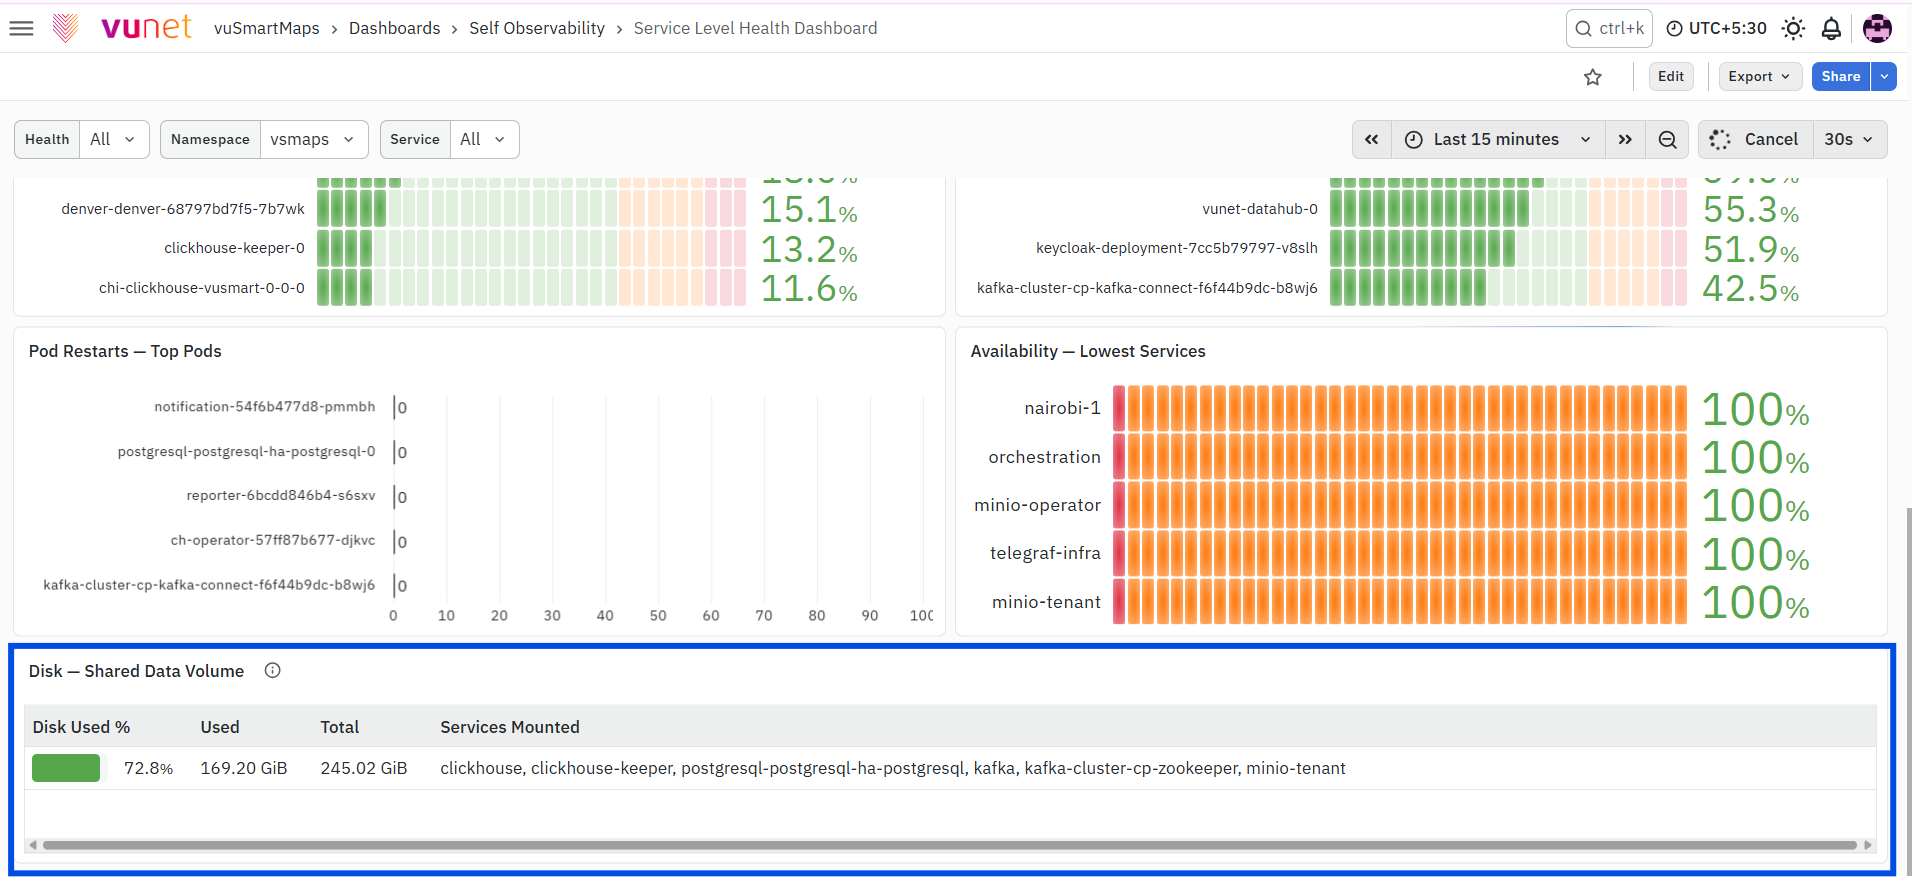
The Disk – Shared Data Volume table displays the current utilization of the shared data volume used by supported stateful services. The table contains the following fields:
- Disk Used %: Displays the percentage of the shared disk currently in use.
- Used: Displays the amount of disk capacity currently consumed.
- Total: Displays the total capacity of the shared data volume.
- Services Mounted: Displays the services using the shared data volume.
Because the disk is shared by multiple stateful services, a disk-capacity condition can affect all listed services. The displayed disk utilization is therefore a shared-volume measurement and not an individual pod-level measurement.
Service Level Health – Drilldown Dashboard
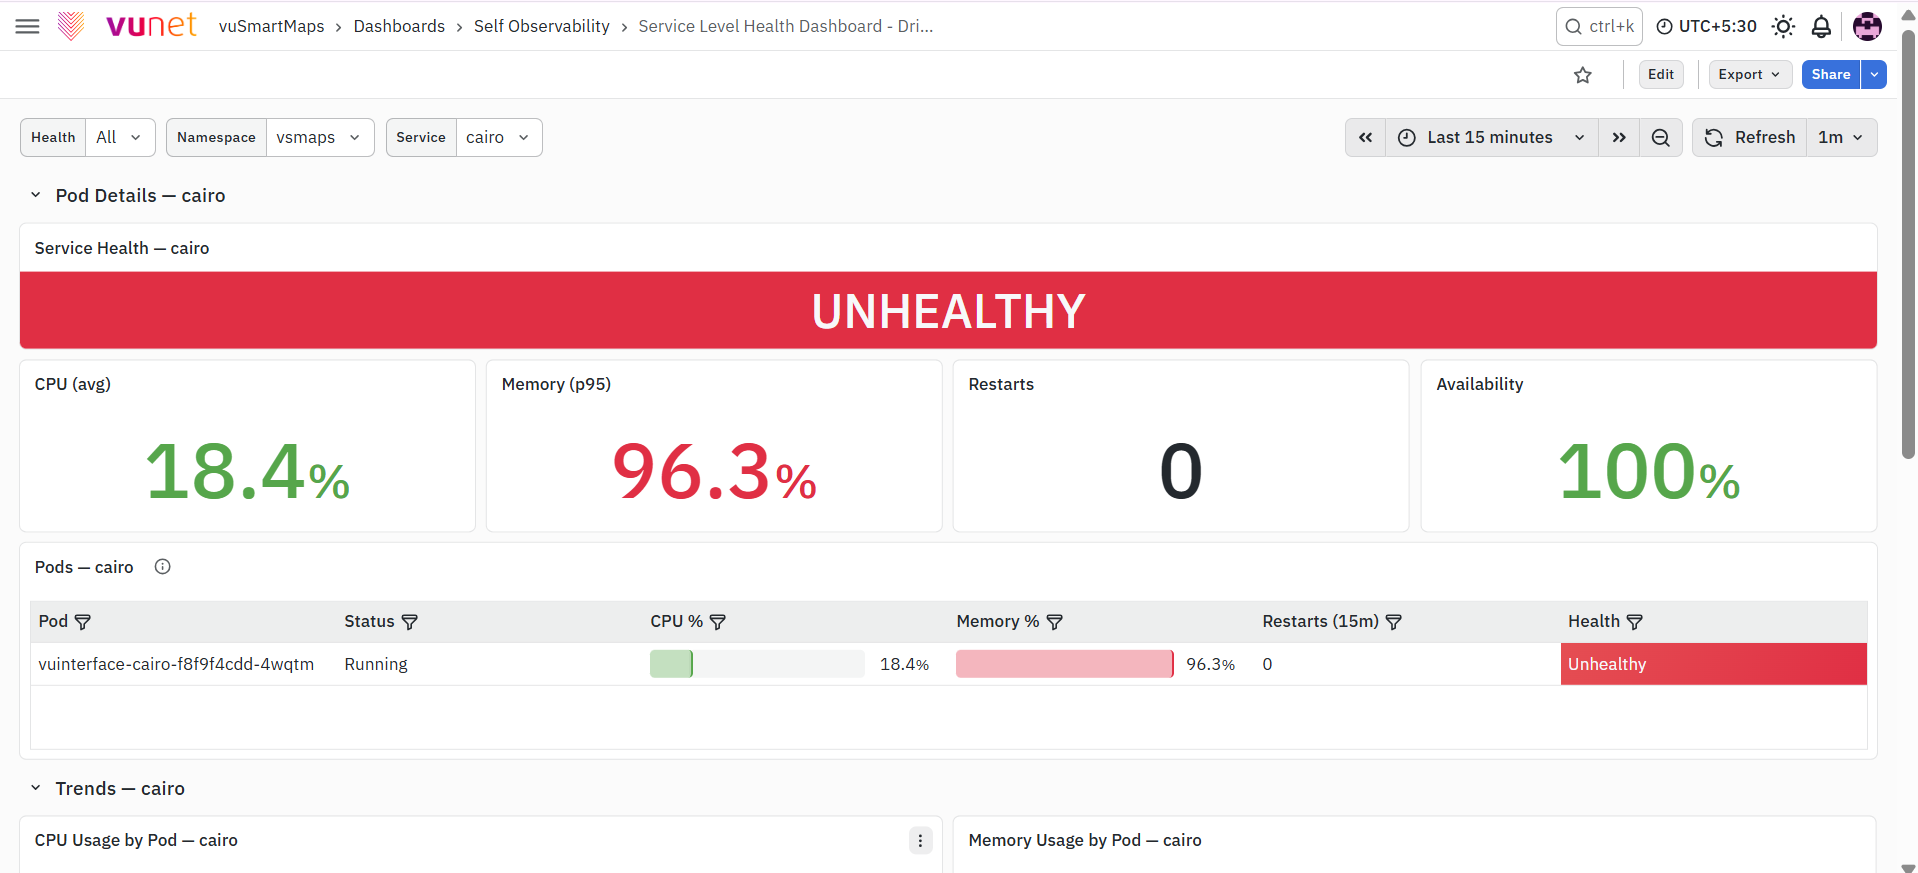
The Service Level Health – Drilldown Dashboard provides detailed health information for an individual service. It is opened by selecting a service name from the Services Health Overview or Active Service Alerts table. When the dashboard opens, the selected service is automatically applied in the Service filter. This allows users to move directly from the environment-level health summary to the pod-level details of the affected service.
Dashboard Panels
The Service Level Health – Drilldown Dashboard is divided into the following sections:
- Filters
- Pod Details
- Service Health
- Service Metrics
- Pods
- Trends
- Logs
Service Health
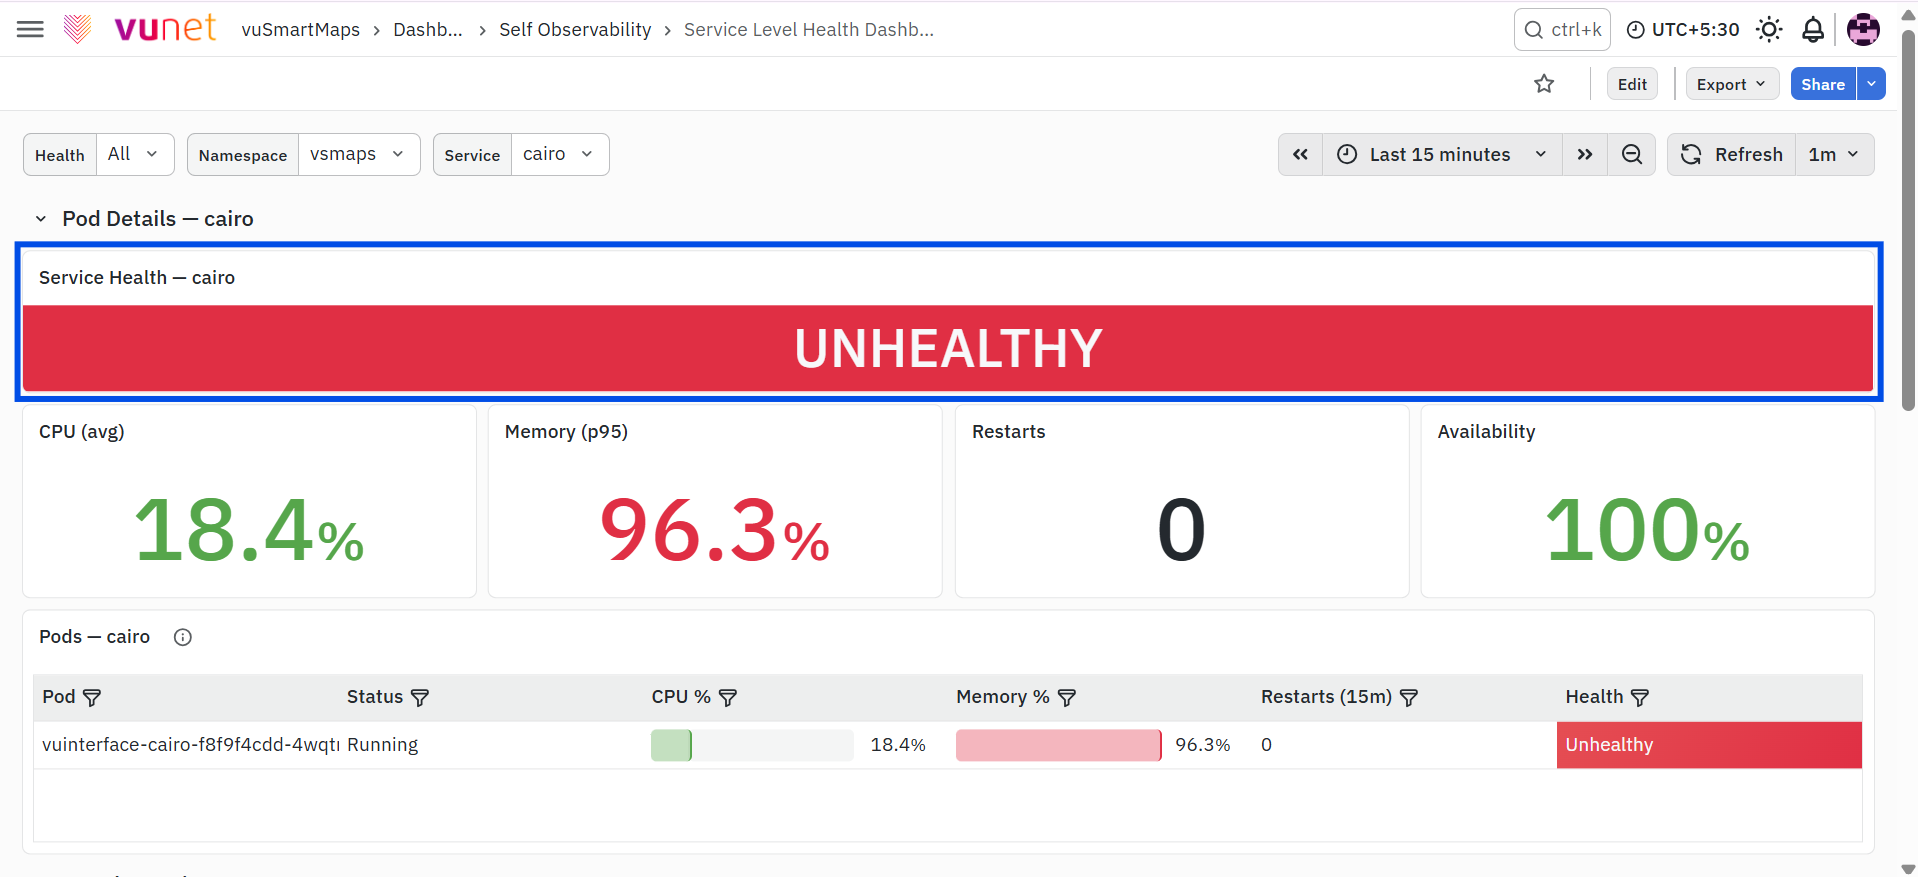
The Service Health panel displays the current overall health of the selected service. The status is displayed prominently across the dashboard and may show Healthy, Degraded, Unhealthy, or Stopped, where applicable. This provides an immediate indication of the current operational condition of the selected service.
Service Metrics
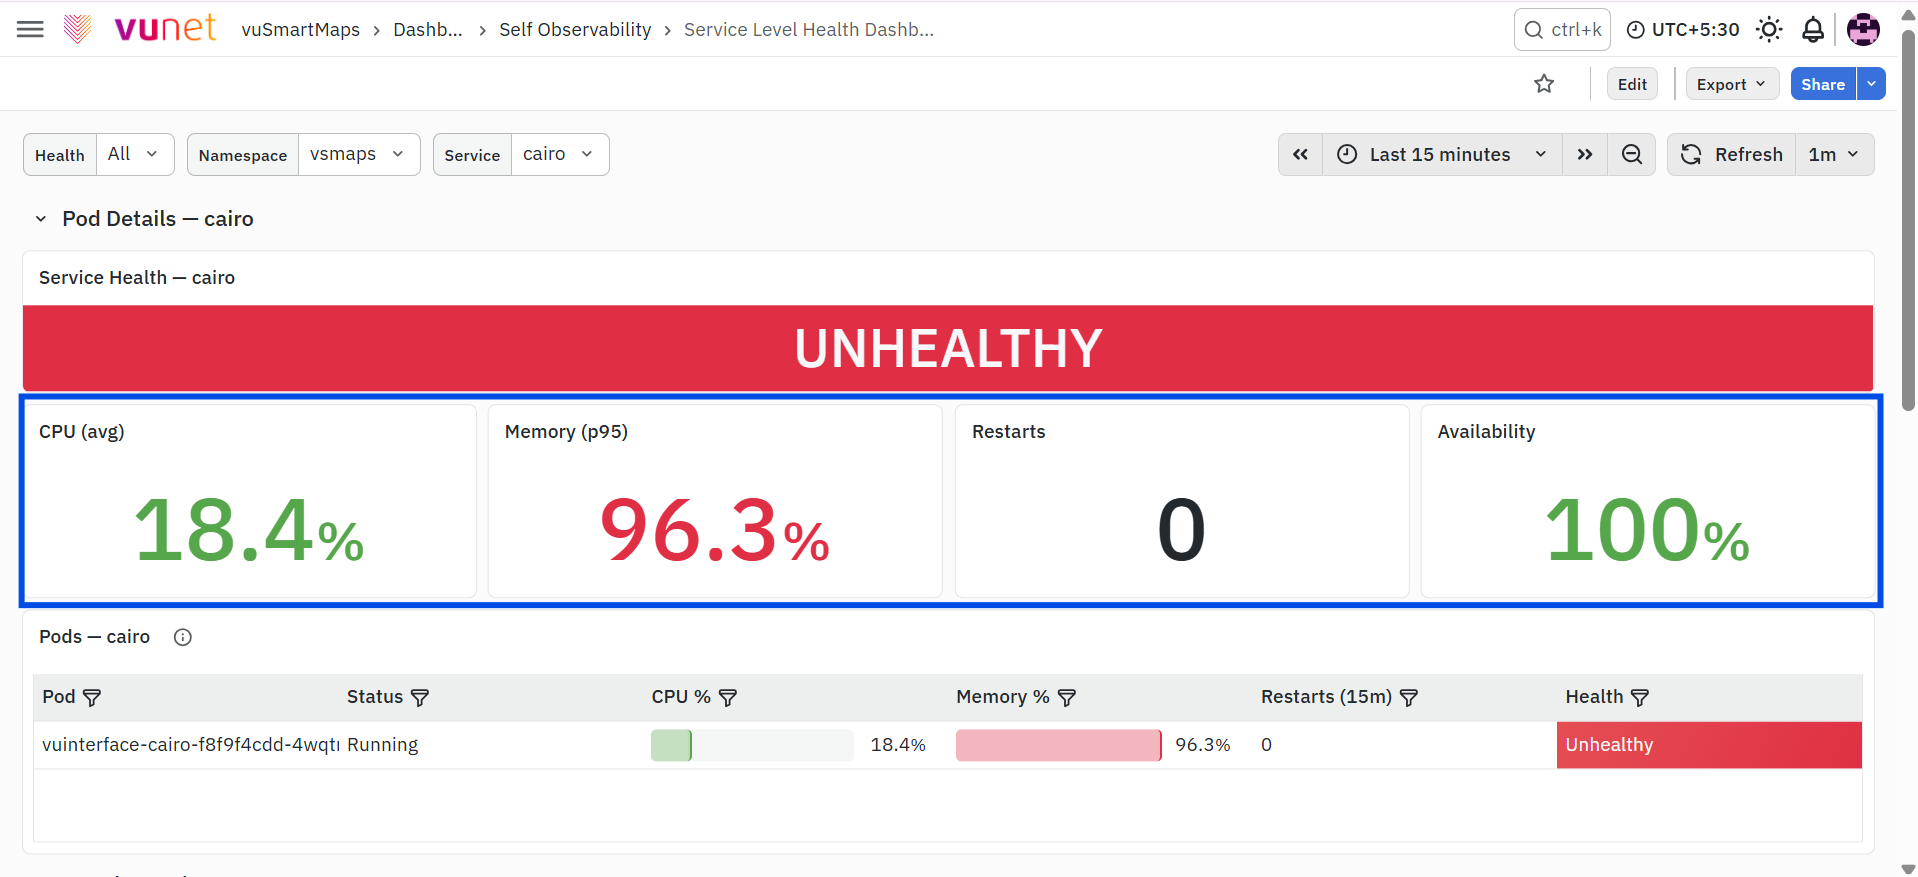
The Service Metrics section provides a summary of the current resource utilization, restart count, and availability of the selected service.
- CPU (avg): Displays the average CPU utilization of the selected service.
- Memory (p95): Displays the 95th percentile memory utilization recorded for the selected service.
- Restarts: Displays the number of pod restarts identified during the monitored interval.
- Availability: Displays the current availability percentage of the selected service.
These panels help identify the signal contributing to the current service-health status before reviewing the individual pods.
Pods
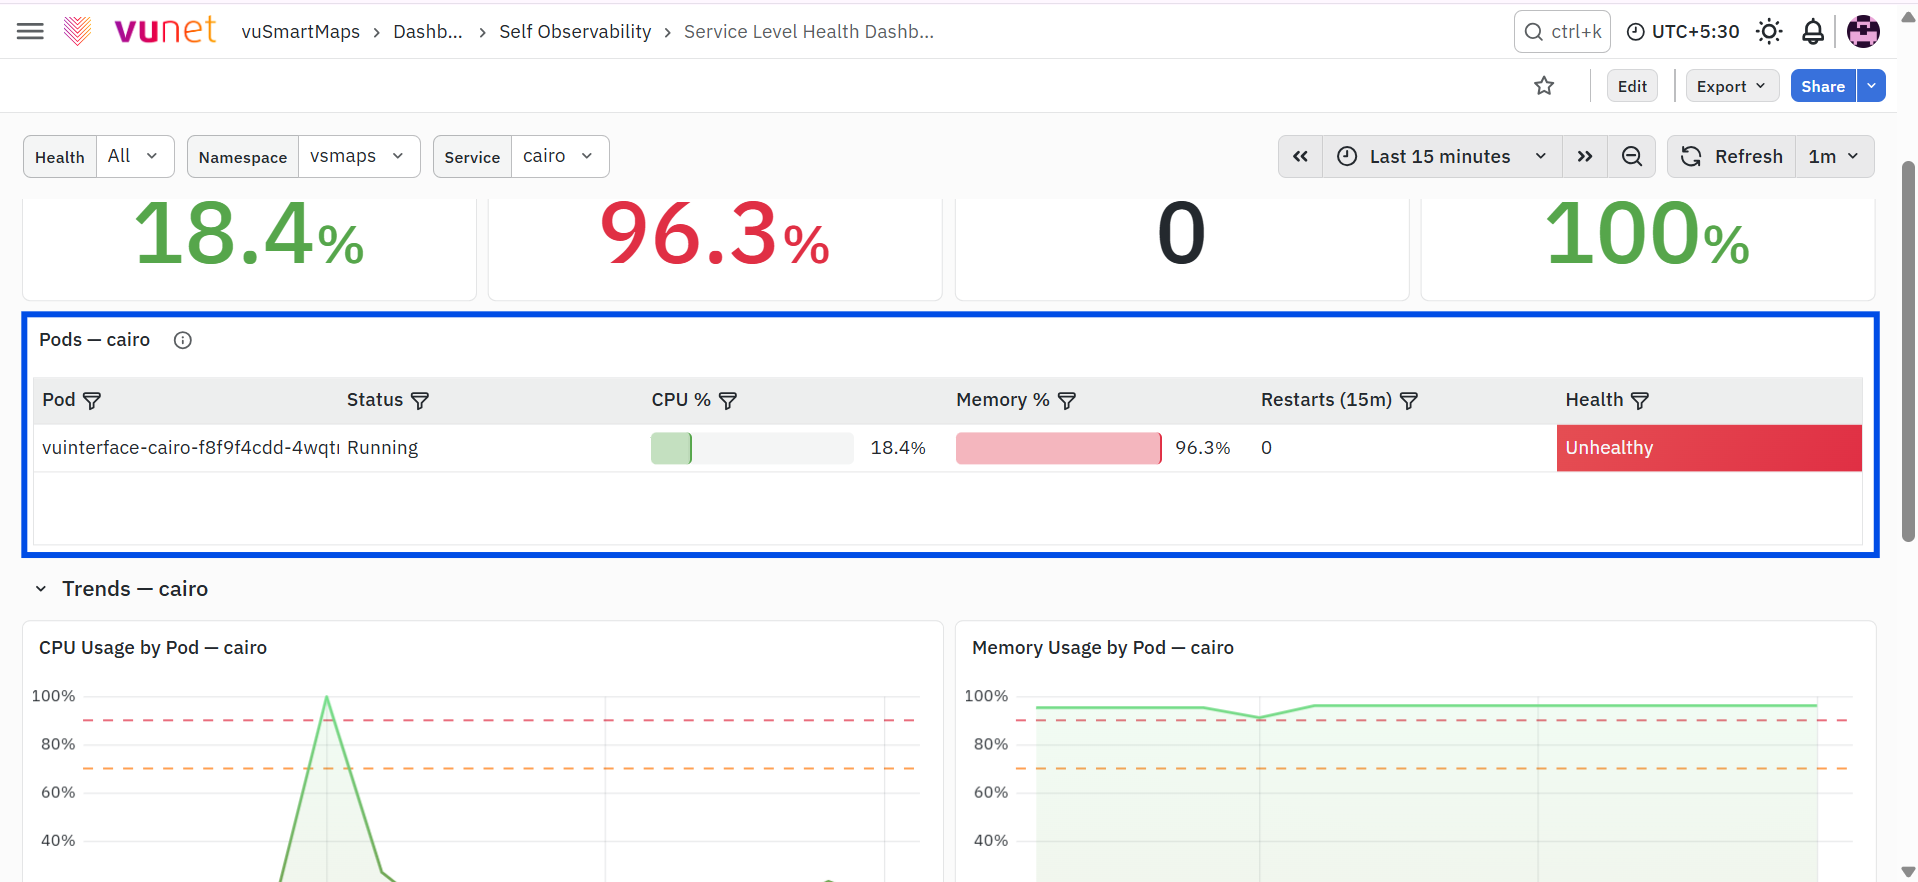
The Pods table displays health and resource information for every pod associated with the selected service.The table contains the following fields:
- Pod: Displays the pod name.
- Status: Displays the current Kubernetes status of the pod, such as Running.
- CPU %: Displays the current CPU utilization of the pod.
- Memory %: Displays the current memory utilization of the pod.
- Restarts (15m): Displays the number of pod restarts recorded during the last 15 minutes.
- Health: Displays the current health classification of the pod.
This table helps identify the exact pod responsible for a service becoming Degraded or Unhealthy.
Trends
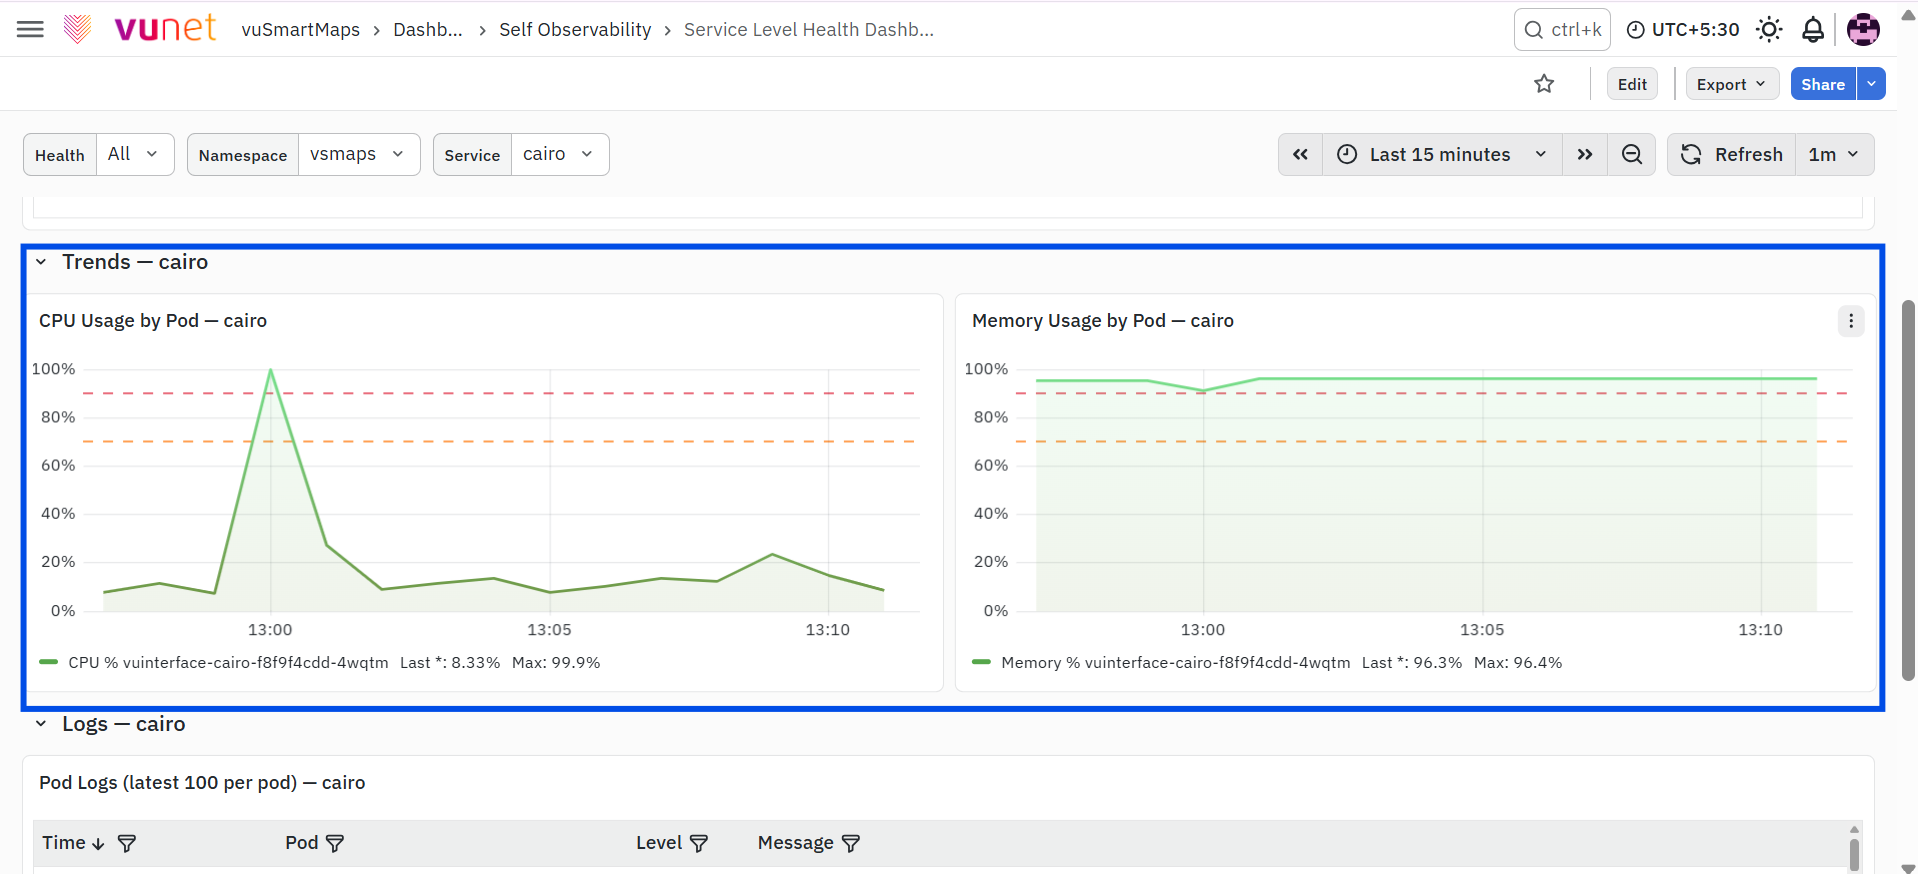
The Trends section displays the CPU and memory utilization of the pods associated with the selected service over the configured time range. These charts help determine whether resource usage increased gradually, remained consistently high, or experienced a sudden spike. Each trend identifies the pod and displays its latest and maximum utilization values, making it easier to compare the current condition with earlier activity. The warning and critical reference lines help identify when CPU or memory usage crosses the configured health thresholds and contributes to the service becoming Degraded or Unhealthy.
CPU Usage by Pod
The CPU Usage by Pod panel displays CPU utilization trends for the pods associated with the selected service. The panel helps determine whether CPU consumption increased gradually, crossed a health threshold, or experienced a short-duration spike. The legend displays the pod name together with the latest and maximum CPU utilization values recorded during the selected time range.
Memory Usage by Pod
The Memory Usage by Pod panel displays memory-utilization trends for the pods associated with the selected service. The panel helps determine whether high memory consumption is continuous or occurred during a particular period. The legend displays the pod name together with the latest and maximum memory-utilization values recorded during the selected time range. The warning and critical reference lines in the trend panels help compare the observed utilization with the configured service-health thresholds.
Pod Logs (Latest 100 per Pod)
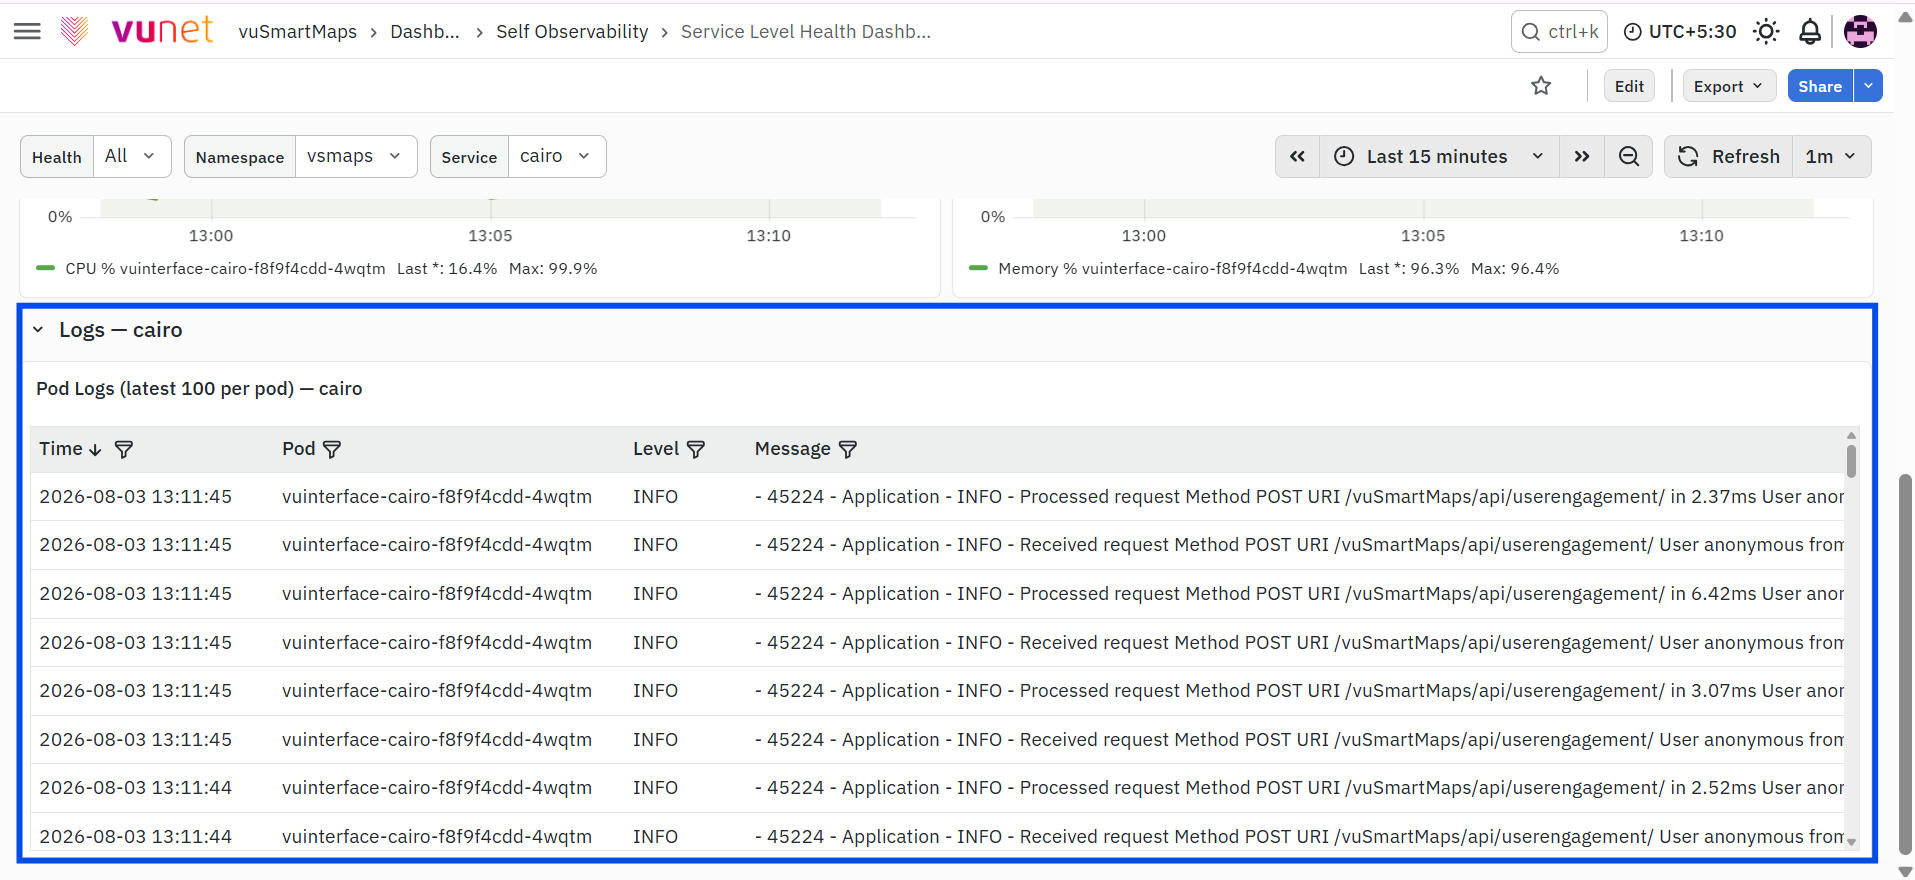
The Pod Logs table displays the latest 100 log entries for each pod associated with the selected service. The table contains the following fields:
- Time: Displays the date and time at which the log entry was generated.
- Pod: Displays the pod that generated the log entry.
- Level: Displays the log level, such as INFO.
- Message: Displays the recorded log message.
The log information helps correlate changes in CPU usage, memory usage, availability, or pod restarts with application or service activity without leaving the drilldown dashboard.
How Service Health Is Determined
The Service Level Health dashboards and alerts use the same service-health model.
- Healthy: The applicable service and pod signals are operating within their expected ranges.
- Degraded: One or more signals have entered a warning condition. The service remains available but requires attention.
- Unhealthy: One or more signals have entered a critical condition, or the service no longer has the required usable replicas.
- Stopped: The service may be displayed as Stopped where the corresponding service state is reported by the platform.
A service is evaluated using the applicable CPU, memory, disk, restart, and availability signals. A warning or critical condition detected for a pod can affect the overall health assigned to its service. Disk usage is measured at the node level for services using the shared data volume. A disk breach can therefore affect all services mounted on that volume and is not treated as an individual pod-level condition.
Clustered services such as ClickHouse, ClickHouse Keeper, Kafka, and Zookeeper use service-specific replica or broker availability rules. Their health is determined according to the number of available and unavailable pods or brokers rather than treating every individual pod loss as a complete service failure.
Step-by-Step Instructions
Access the Service Level Health Dashboard
- Navigate to the left navigation menu and select Dashboards.
- In the dashboard search bar, search for Service Level Health.
- Select the Service Level Health Dashboard from the search results.
- Use the Health, Namespace, Service, and Time Range filters to display the required service-health information.
Open the Service Level Health – Drilldown Dashboard
- In the Services Health Overview table, select the required service from the Service column.
Alternatively, select the affected service from the Service column in the Active Service Alerts table. - The Service Level Health – Drilldown Dashboard opens with the selected service automatically applied in the Service filter.
- Review the Service Health status and the CPU, Memory, Restarts, and Availability panels.
- Review the Pods table to identify the pod responsible for the service-health condition.
- Review the CPU Usage by Pod and Memory Usage by Pod panels to determine when the resource condition started and whether it is continuous or temporary.
- Review the Pod Logs table to correlate the observed condition with the latest service or application log messages.
Investigate a Service Level Health Alert
- Open the Service Level Health alert email.
- Select Review the Alert to open the corresponding alert in the Alert Console.
- Review the alert description and the information about the affected service or pods.
- Open the Related Dashboards section.
- Select the Service Level Health Dashboard.
- Select the affected service from the Services Health Overview or Active Service Alerts table to open the drilldown dashboard.
- Review the pod-level metrics, trends, and logs to identify the cause of the health condition.
- After the underlying condition is addressed, continue monitoring the dashboard until the updated service-health state is reflected.
FAQs
What does the Service Level Health dashboard monitor?
The Service Level Health dashboard monitors the operational health of services using pod-level telemetry for CPU usage, memory usage, disk usage, pod restarts, and availability.
What health states can a service have?
A service can be displayed as Healthy, Degraded, Unhealthy, or Stopped, where applicable. The health state is determined using the applicable CPU, memory, disk, restart, and availability signals.
How can I determine why a service is Degraded or Unhealthy?
Review the Active Service Alerts and Breaches by Category panels to identify whether the condition is related to CPU, memory, disk, pod restarts, or availability.
How do I investigate an affected service at the pod level?
Click the service name in the Services Health Overview or Active Service Alerts table. This opens the Service Level Health – Drilldown Dashboard with the selected service automatically applied for detailed pod-level investigation.
What alerts are provided by Service Level Health?
Service Level Health provides alerts for high CPU usage, high memory usage, repeated pod restarts, high shared-disk usage, StatefulSet pod unavailability, and stateless pod unavailability.
