Data Ingestion Freshness
Overview
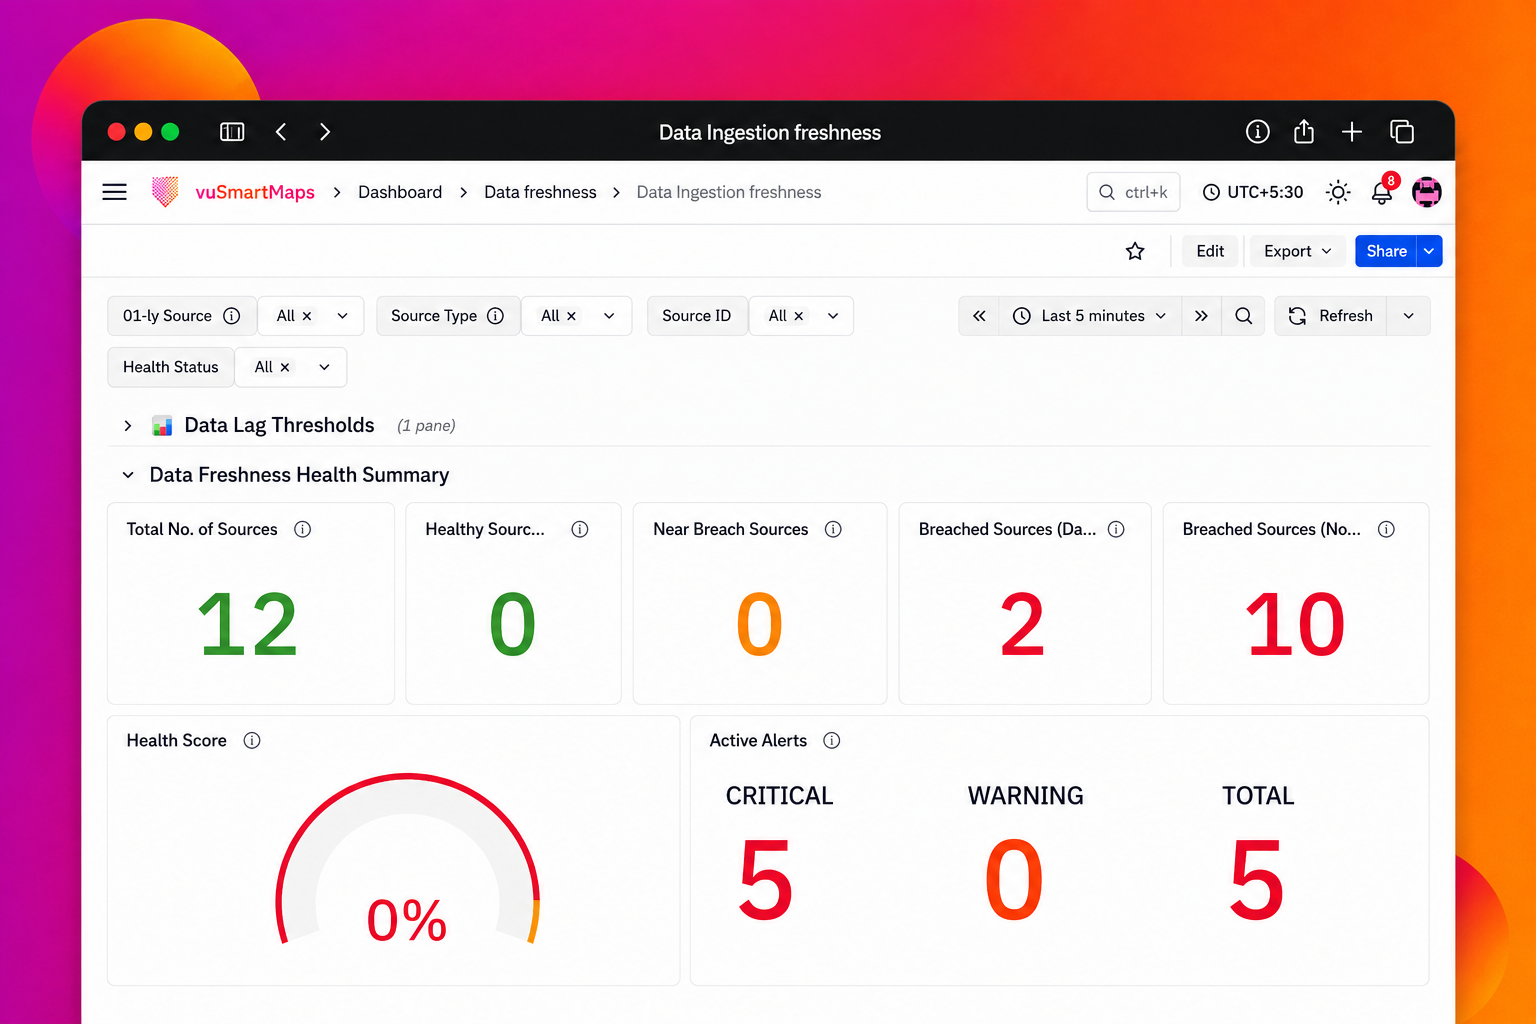
The Self Observability Data Ingestion Freshness dashboard continuously monitors the freshness of data ingested from all configured O11y sources. It evaluates the ingestion health of each source instance based on the configured collection interval and thresholds, and classifies the source instance as Healthy, Near Breach, or Breached.
The dashboard provides a consolidated view of overall ingestion health, affected source instances, ingestion lag, health status, and active Data Freshness alerts. This helps detect ingestion delays or interruptions before they affect dashboards, alerts, or downstream analytics, while also supporting the identification of affected sources and further investigation through the recommended troubleshooting workflows.
Comprehensive Understanding
The Data Ingestion Freshness Overview (O11y Sources) dashboard provides a consolidated view of data-ingestion freshness across all configured O11y source instances. It displays the configured freshness thresholds, overall source health, active Data Freshness alerts, and detailed health information for each source instance.
Panel Options
Each dashboard panel includes a three-dot menu in the top-right corner that provides additional panel-level actions:
- View: Opens the panel in an expanded view.
- Edit: Opens the panel configuration for editing.
- Share: Provides options to share the panel.
- Explore: Opens the panel query in Explore for further analysis.
- Inspect: Displays detailed information about the panel, including its data and query details.
- More: Provides additional panel-specific options.
Filters
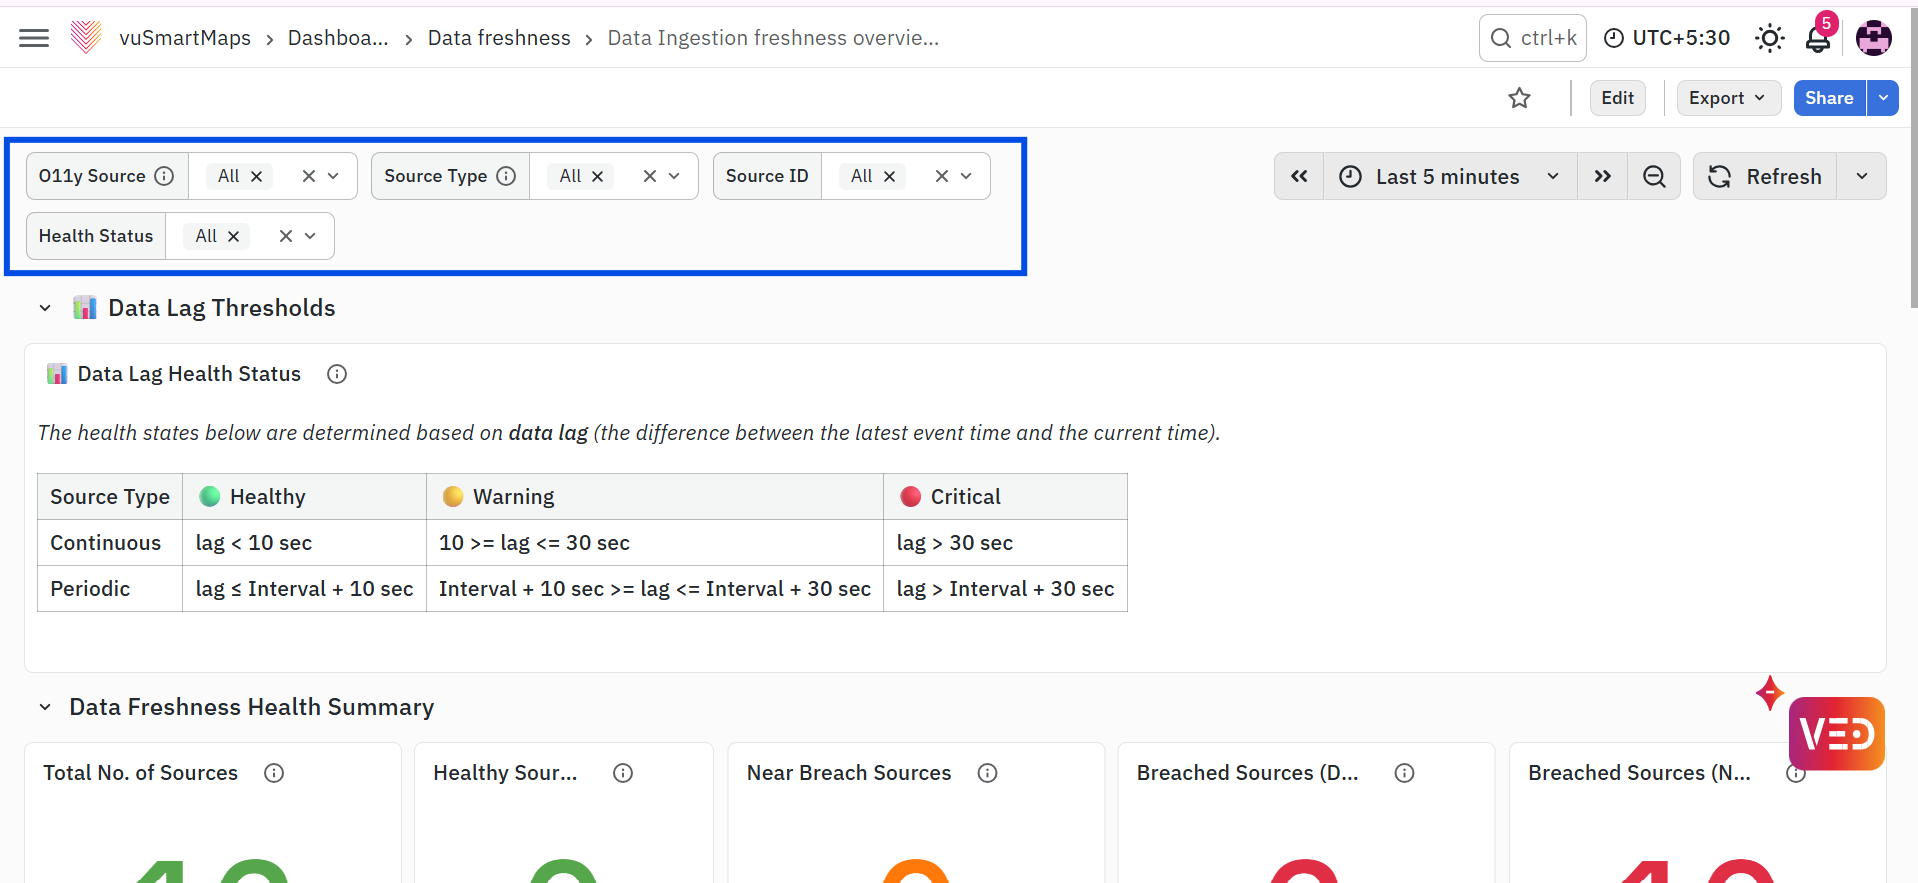
The filters at the top of the dashboard help narrow the displayed information for targeted analysis:
- O11y Source: Filters the dashboard by the selected observability source.
- Source Type: Filters the information based on the selected source type.
- Source ID: Displays information for the selected source instance.
- Health Status: Filters source instances based on their current health state.
- Time Range: Controls the period for which the dashboard information is displayed.
- Refresh: Reloads the dashboard with the latest available data.
Data Lag Thresholds
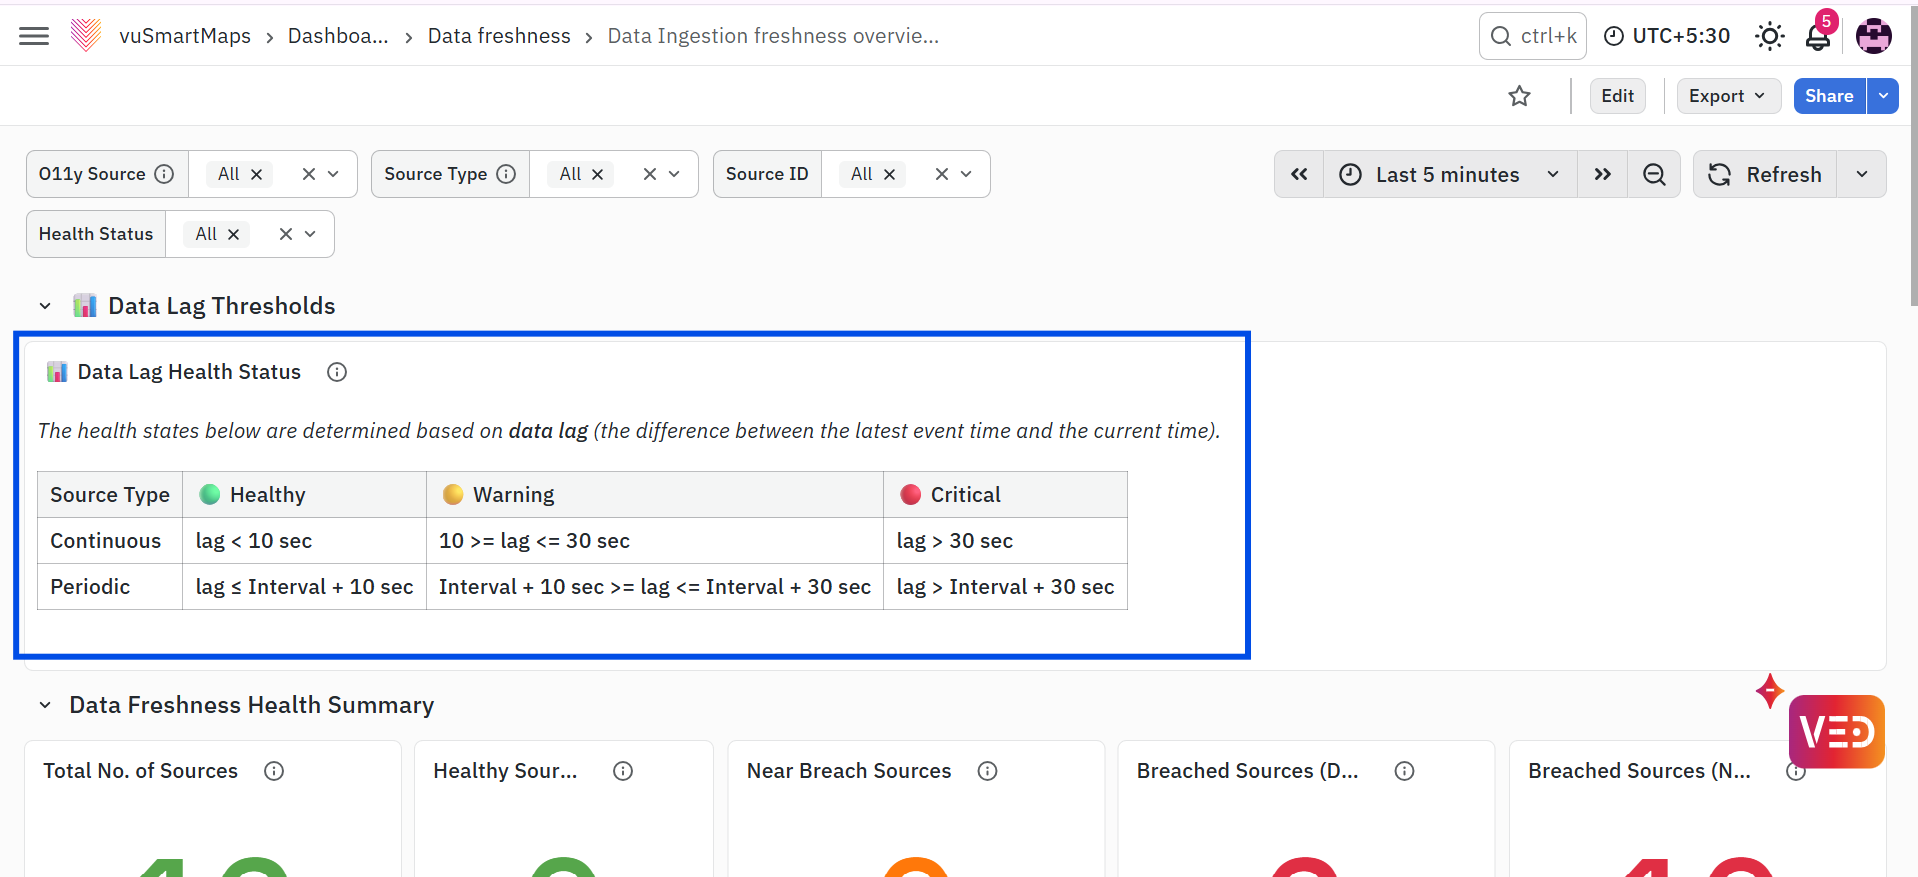
The Data Lag Thresholds section describes how source-instance health is determined based on data lag. Data lag represents the difference between the latest event time and the current time.
The Warning threshold corresponds to the Near Breach health state, while the Critical threshold corresponds to the Breached health state.
The thresholds differ for continuous and periodic source types:
Continuous Sources
- Healthy: Data lag is less than 10 seconds.
- Warning: Data lag is between 10 and 30 seconds.
- Critical: Data lag is greater than 30 seconds.
For continuous ingestion sources, the collection interval is considered as 0 seconds. The ingestion health is therefore determined directly from the data lag.
Periodic Sources
For periodic sources, the configured collection interval is included when evaluating data lag.
- Healthy: Data lag is less than or equal to the collection interval plus 10 seconds.
- Warning: Data lag is greater than the collection interval plus 10 seconds and less than or equal to the collection interval plus 30 seconds.
- Critical: Data lag is greater than the collection interval plus 30 seconds.
The Warning threshold corresponds to the Near Breach health state, while the Critical threshold corresponds to the Breached health state.
Data Freshness Health Summary
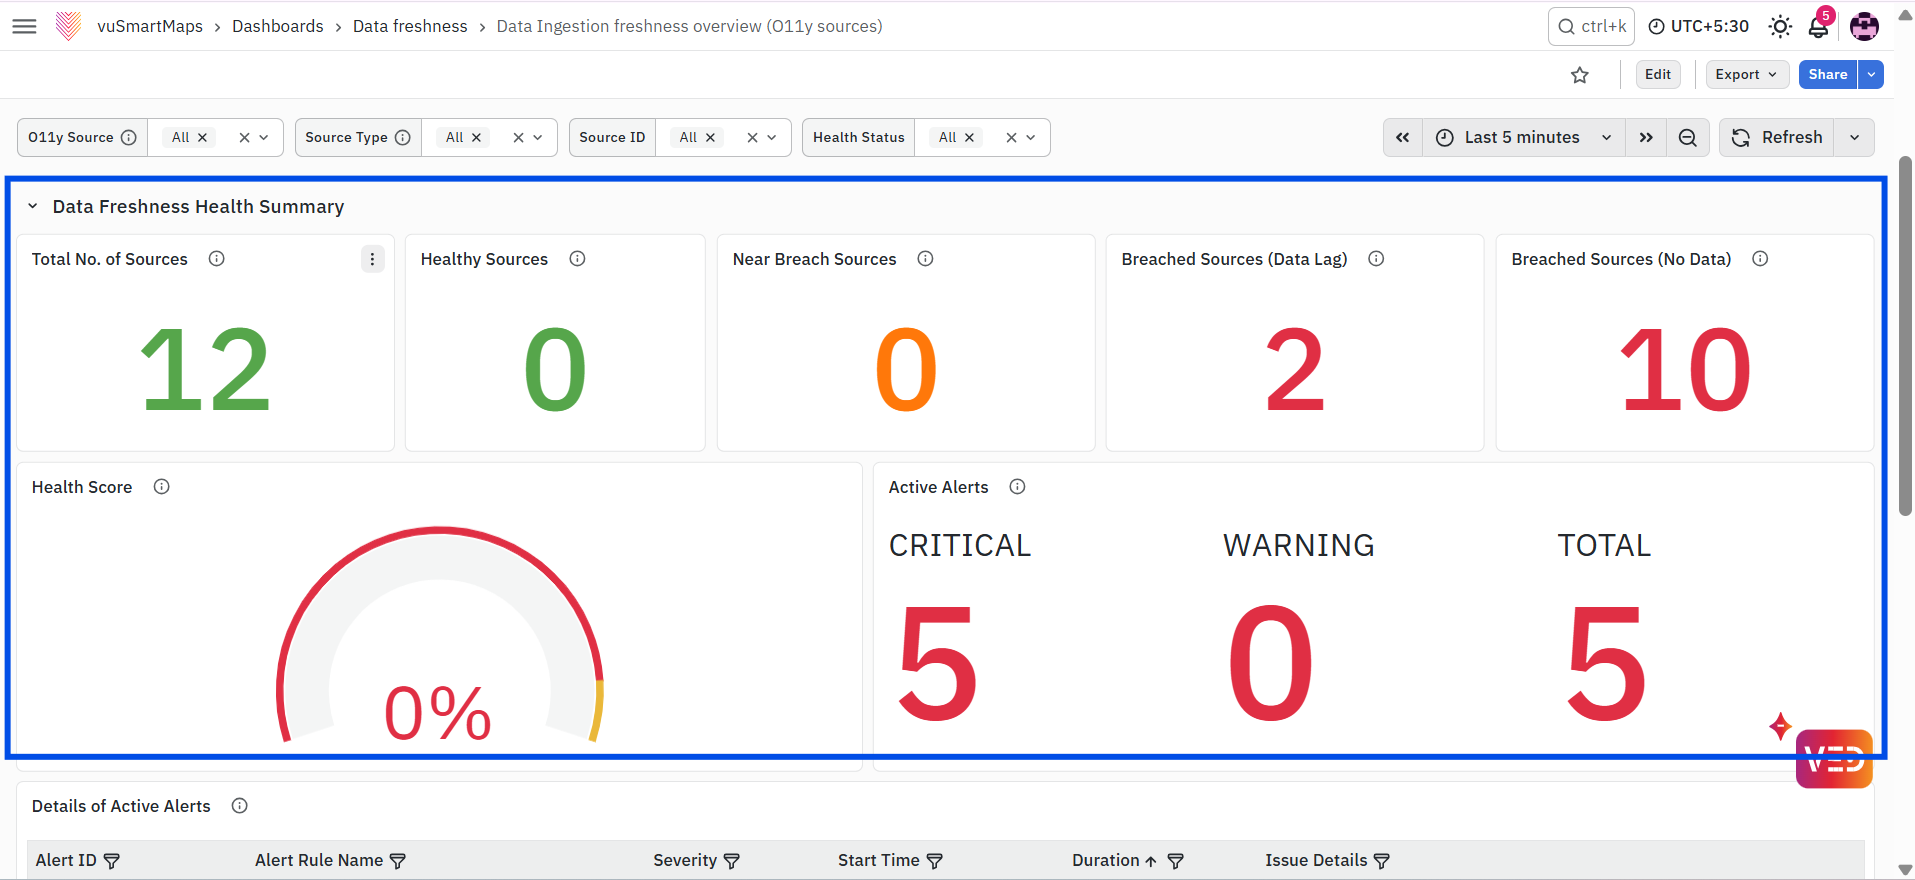
The Data Freshness Health Summary section provides a high-level view of the ingestion health of all configured source instances.
- Total No. of Sources: Displays the total number of configured source instances.
- Healthy Sources: Displays the number of source instances currently ingesting data within the configured freshness threshold.
- Near Breach Sources: Displays the number of source instances approaching the configured freshness threshold but not yet in the Breached state.
- Breached Sources (Data Lag): Displays the number of source instances where data is still being ingested, but the ingestion lag has exceeded the configured threshold.
- Breached Sources (No Data): Displays the number of source instances from which no data has been received since the source instance was configured.
- Health Score: Displays the percentage of healthy source instances compared with the total number of configured source instances.
Active Alerts
The Active Alerts panel displays the number of currently active Data Freshness alerts according to severity.
- Critical: Displays the number of active critical alerts.
- Warning: Displays the number of active warning alerts.
- Total: Displays the total number of active Data Freshness alerts.
Details of Active Alerts
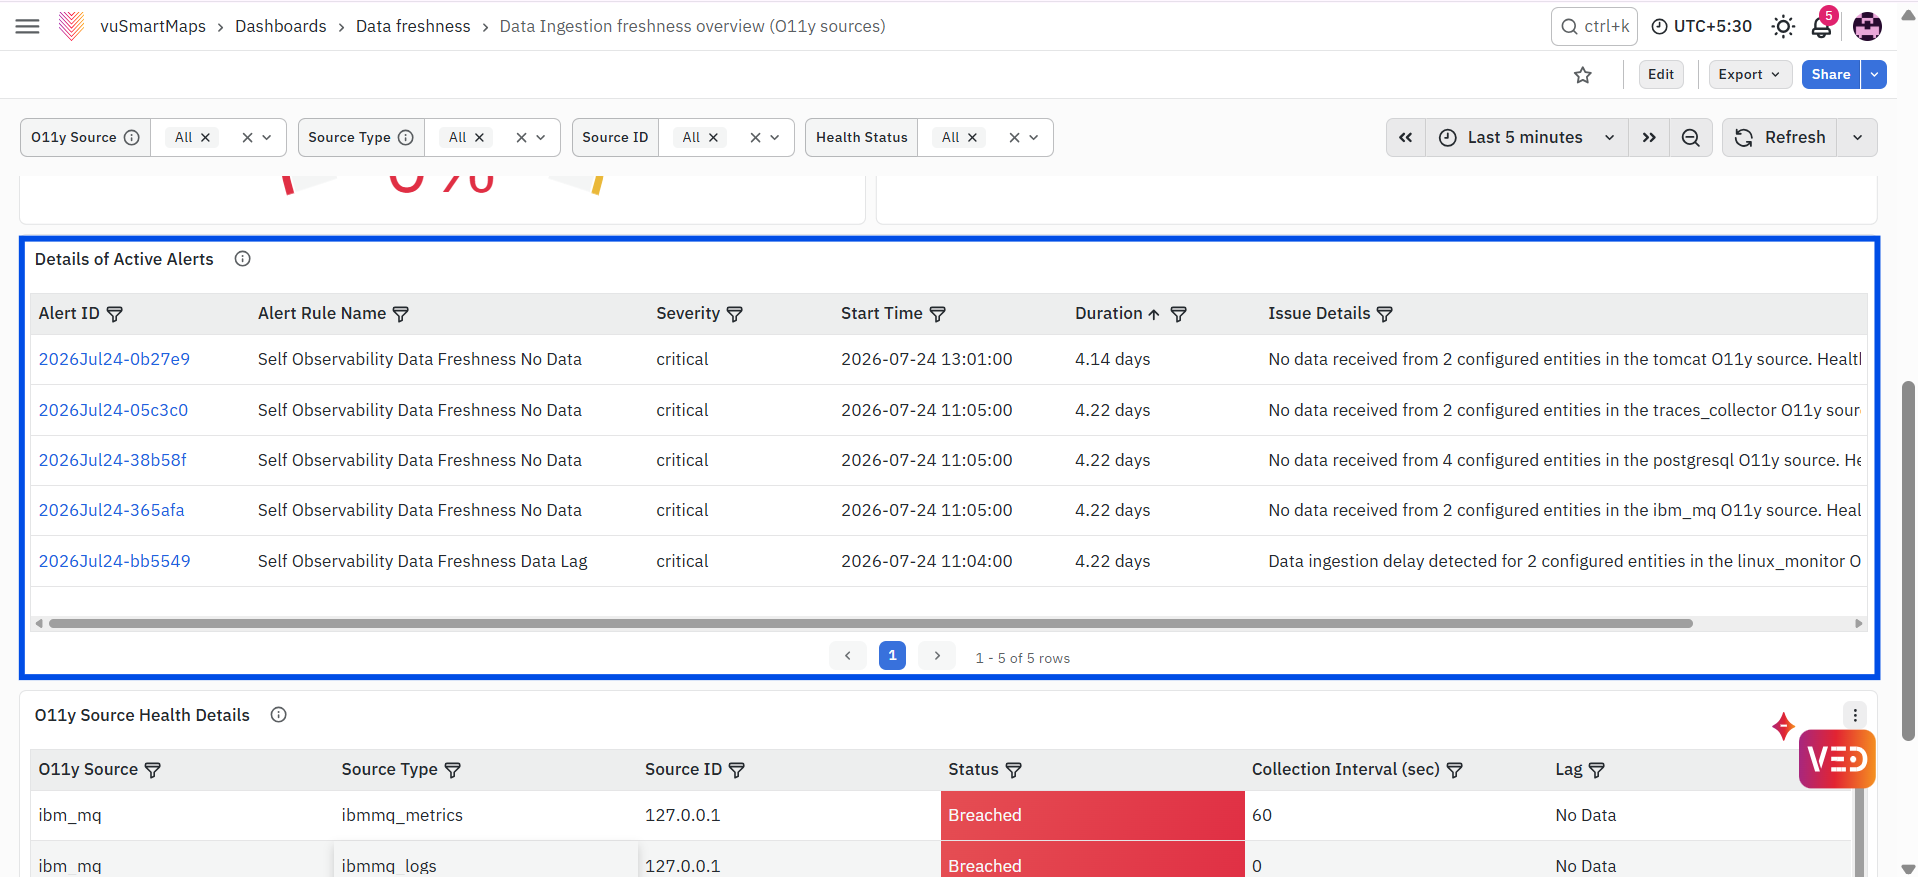
The Details of Active Alerts table displays information about active Data Freshness alerts generated due to delayed or interrupted data ingestion.
The table contains the following fields:
- Alert ID: Displays the unique identifier assigned to the alert as a clickable link. Selecting the Alert ID opens the corresponding alert under Control Center > System Console > View System Alerts > View Alerts. The alert view provides complete alert details and access to related dashboards for further analysis.
- Alert Rule Name: Displays the alert rule that generated the alert, such as Self Observability Data Freshness Data Lag or Self Observability Data Freshness No Data.
- Severity: Displays the severity of the alert as Warning or Critical, based on the detected ingestion condition.
- Start Time: Displays the date and time when the alert became active.
- Duration: Displays the period for which the alert has remained active.
- Issue Details: Displays a summary of the detected issue, including delayed data ingestion or no data received from the affected source instances.
The opened alert provides the following information and actions:
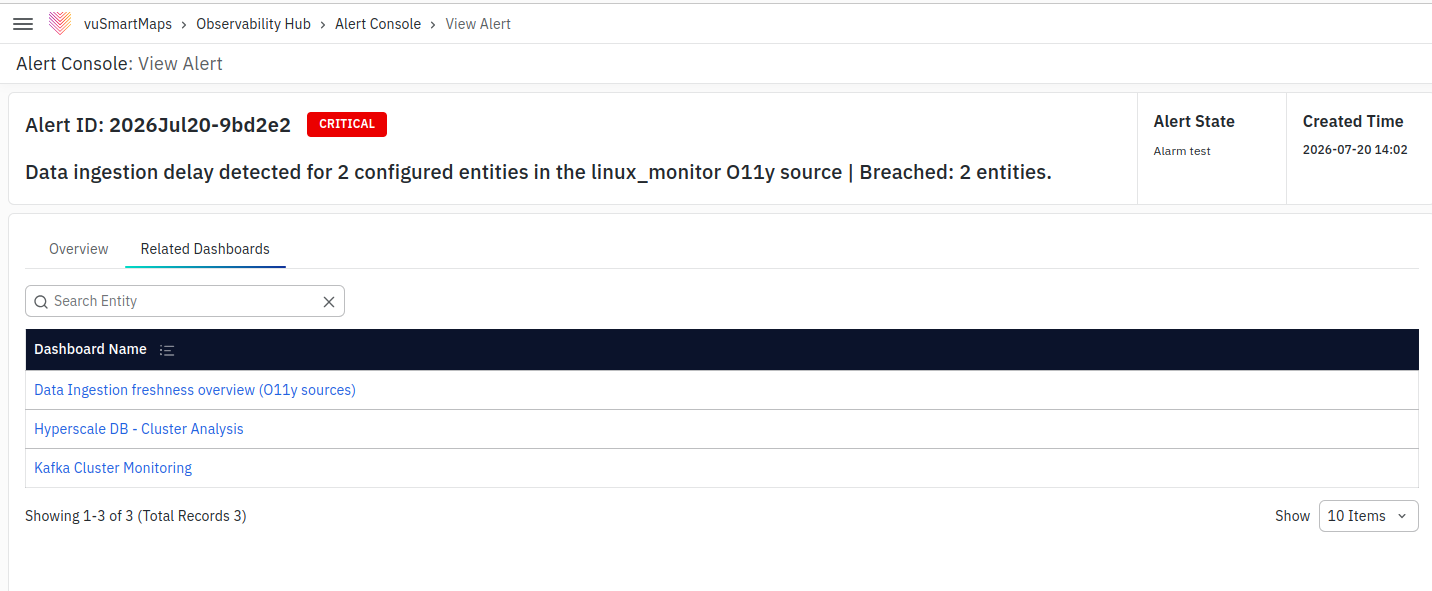
- Alert Details: Displays complete information about the selected alert, including the alert rule name, alert state, creation time, and last updated time.
- Alert Description: Provides the recommended next steps for investigating and troubleshooting the ingestion issue.
- Information Table: Displays the top five affected source instances for the O11y Source that triggered the alert.
- Related Dashboards: Provides access to the dashboards associated with the selected alert. The Data Ingestion Freshness Overview (O11y Sources) dashboard can be opened for further analysis of the affected source instances.
Data Freshness Alert Email
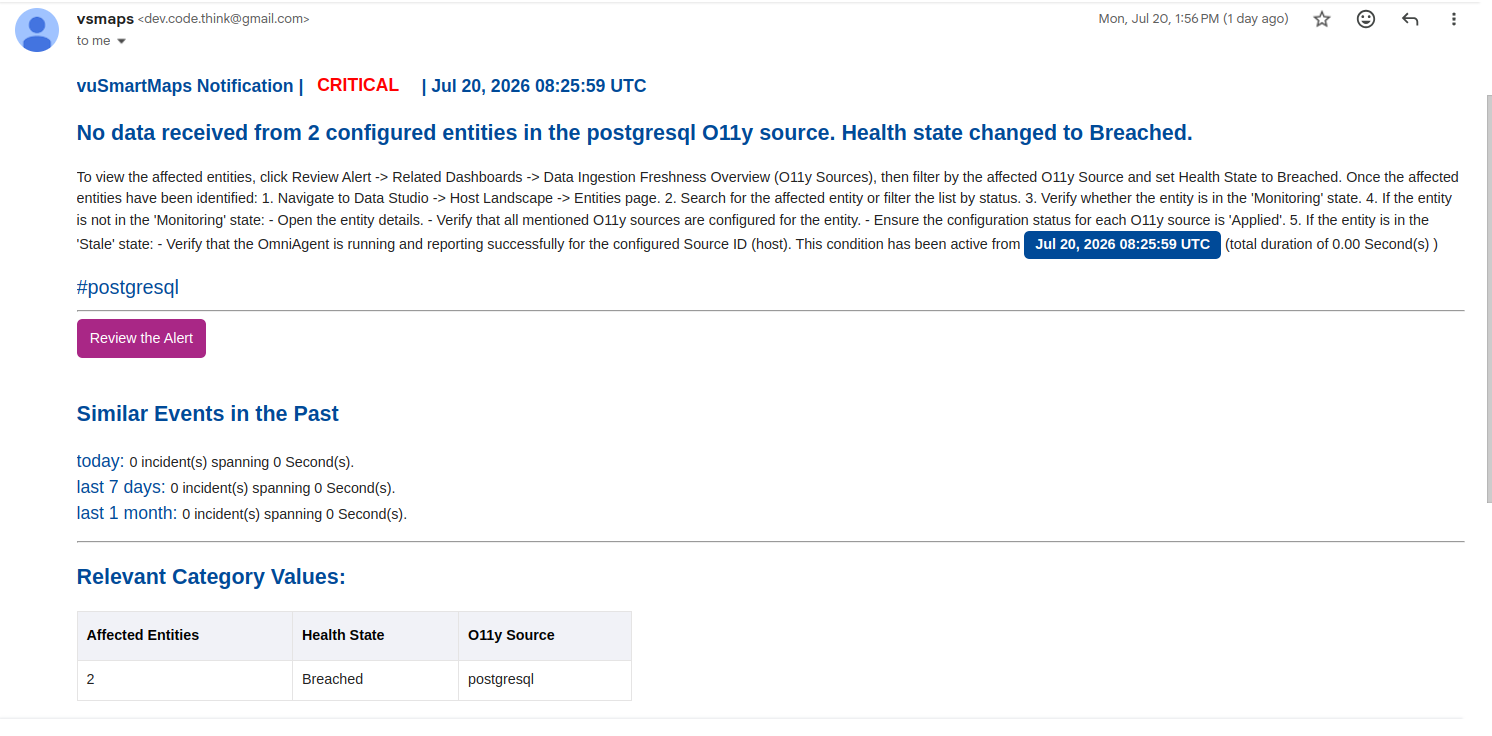
Data Freshness alert notifications are sent when delayed or interrupted data ingestion is detected. Separate notifications are generated for the following conditions:
- Self Observability Data Freshness Data Lag Alert: Generated when data ingestion continues but is delayed beyond the expected collection interval or configured threshold.
- Self Observability Data Freshness No Data Alert: Generated when no data is received from one or more source instances from the time the source instance was configured.
Each alert email contains the following information and actions:
- Alert Summary or Mail Subject: Displays the reason for the alert, the affected O11y source, and the number of impacted source instances.
- Alert Description: Provides the recommended next steps for investigating and troubleshooting the ingestion issue.
- Information Table: Displays the top five affected source instances for the O11y source that triggered the alert.
The Information Table displays only the top five affected source instances for the triggered O11y Source. To view all affected source instances, open the Data Ingestion Freshness Overview (O11y Sources) dashboard from Related Dashboards and apply the relevant O11y Source and Health Status filters.
- Review Alert: Opens the corresponding alert in the Alert Console, where complete alert details can be reviewed.
- Related Dashboards: Provides access to dashboards associated with the alert. From the alert details, open the Related Dashboards tab and select the Data Ingestion Freshness Overview (O11y Sources) dashboard for further analysis.
For a Data Lag alert, filter the dashboard using the affected O11y Source and the Near Breach and Breached health states. For a No Data alert, filter the dashboard using the affected O11y Source and the Breached health state.
O11y Source Health Details
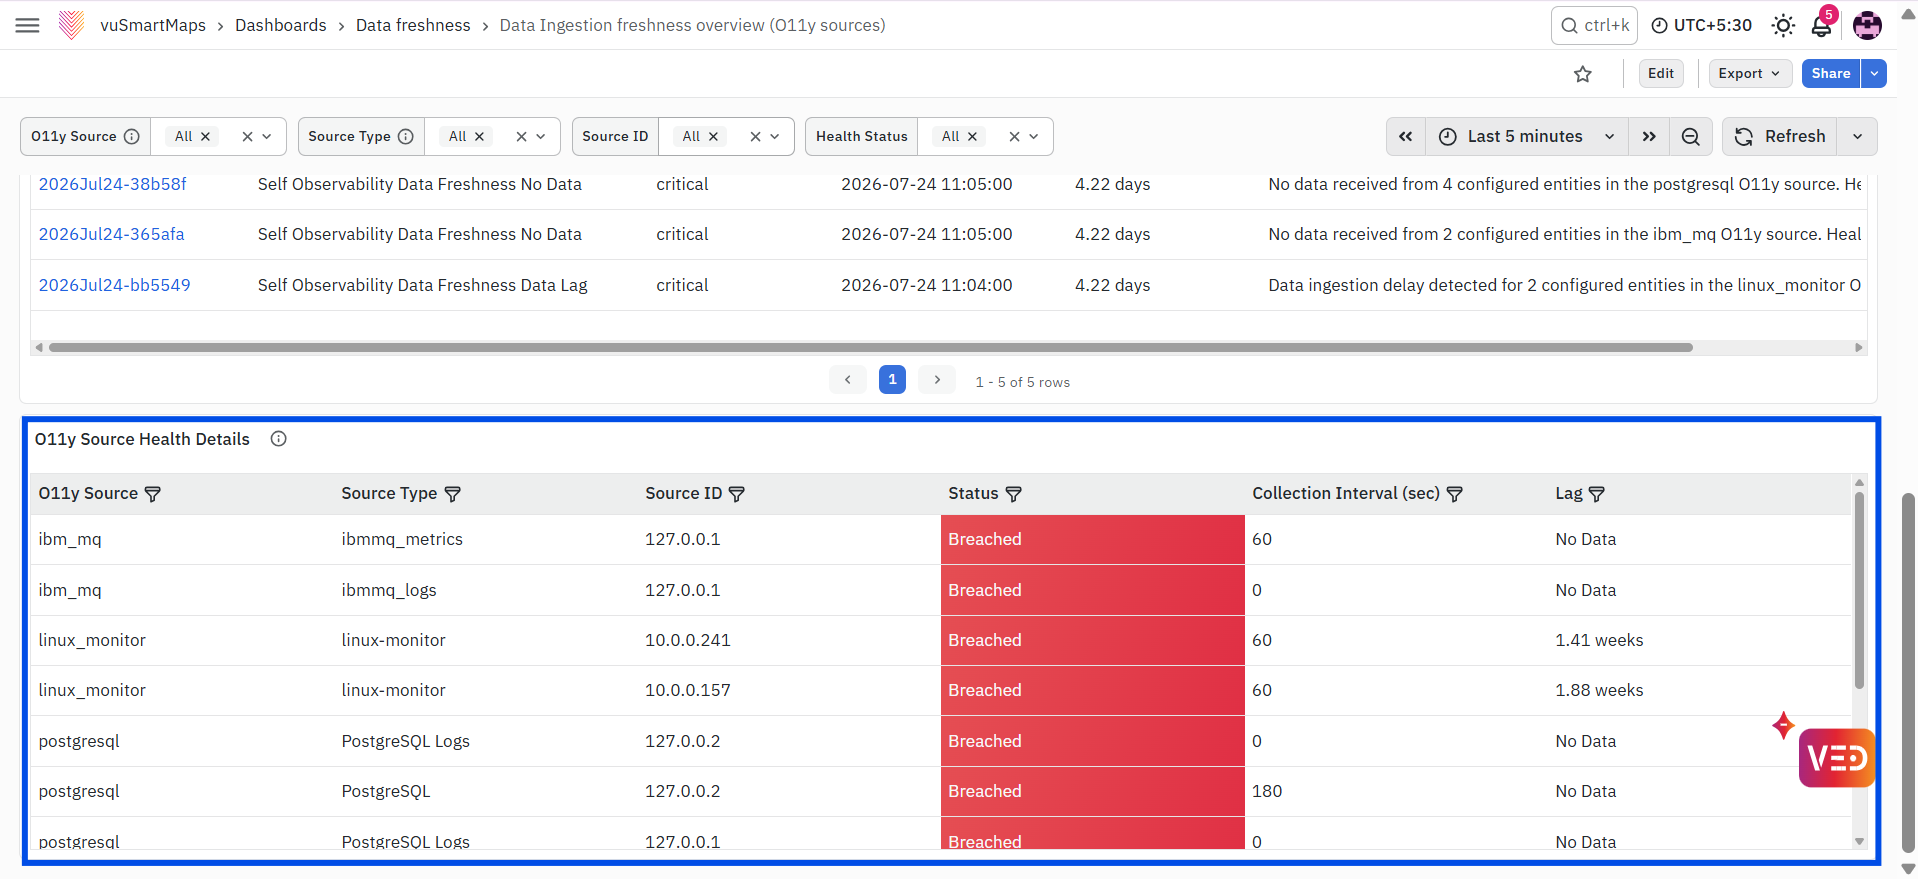
The O11y Source Health Details table provides source-instance-level ingestion information for all configured O11y sources.
The table contains the following fields:
- O11y Source: Displays the name of the configured observability source.
- Source Type: Displays the type of telemetry source associated with the source instance.
- Source ID: Displays the identifier of the individual source instance.
- Status: Displays the current ingestion health state of the source instance, such as Healthy, Near Breach, or Breached.
- Collection Interval (sec): Displays the configured interval at which data is expected from the source instance.
- Lag: Displays the current ingestion delay. When no data has been received, the value is displayed as No Data.
This table supports the identification of the specific source instances affected by delayed or interrupted data ingestion.
Monitoring Scenarios
he Data Ingestion Freshness feature monitors the following ingestion health scenarios:
- Normal Data Ingestion—Healthy: Data is ingested within the expected collection interval for all configured source instances. No ingestion delay or interruption is detected. The health state is Healthy, and no alert is generated.
- Data Lag—Near Breach: Data ingestion is delayed but remains within the collection interval plus 10 to 30 seconds. The health state is Near Breach, and the Self Observability Data Freshness Data Lag Alert is generated with Warning severity.
- Data Lag—Breached: Data continues to be ingested, but the ingestion delay exceeds the configured freshness threshold. The health state is Breached, and the Self Observability Data Freshness Data Lag Alert is generated with Critical severity.
- No Data—Breached: No data is received from one or more source instances within the expected collection interval or from the time the O11y Source was onboarded. The health state is Breached, and the Self Observability Data Freshness No Data Alert is generated with Critical severity.
Troubleshooting and Escalation
For a Data Lag condition, the affected O11y source and source instances can be identified from the alert details and the Data Ingestion Freshness Overview (O11y Sources) dashboard. The Data Lag Alert troubleshooting document can then be used to determine whether the issue is related to HyperScale, Kafka, or an upstream component.
For a No Data condition, the affected O11y source and source instances can be identified by filtering the dashboard using the selected O11y source and the Breached health state. The recommended next steps in the alert description can be followed, including validating the source status through Data Studio > Host Landscape and verifying that the source configuration is correct. If the issue continues after completing the recommended troubleshooting steps, a support ticket can be raised with the investigation details and observed findings.
Step-by-Step Instructions
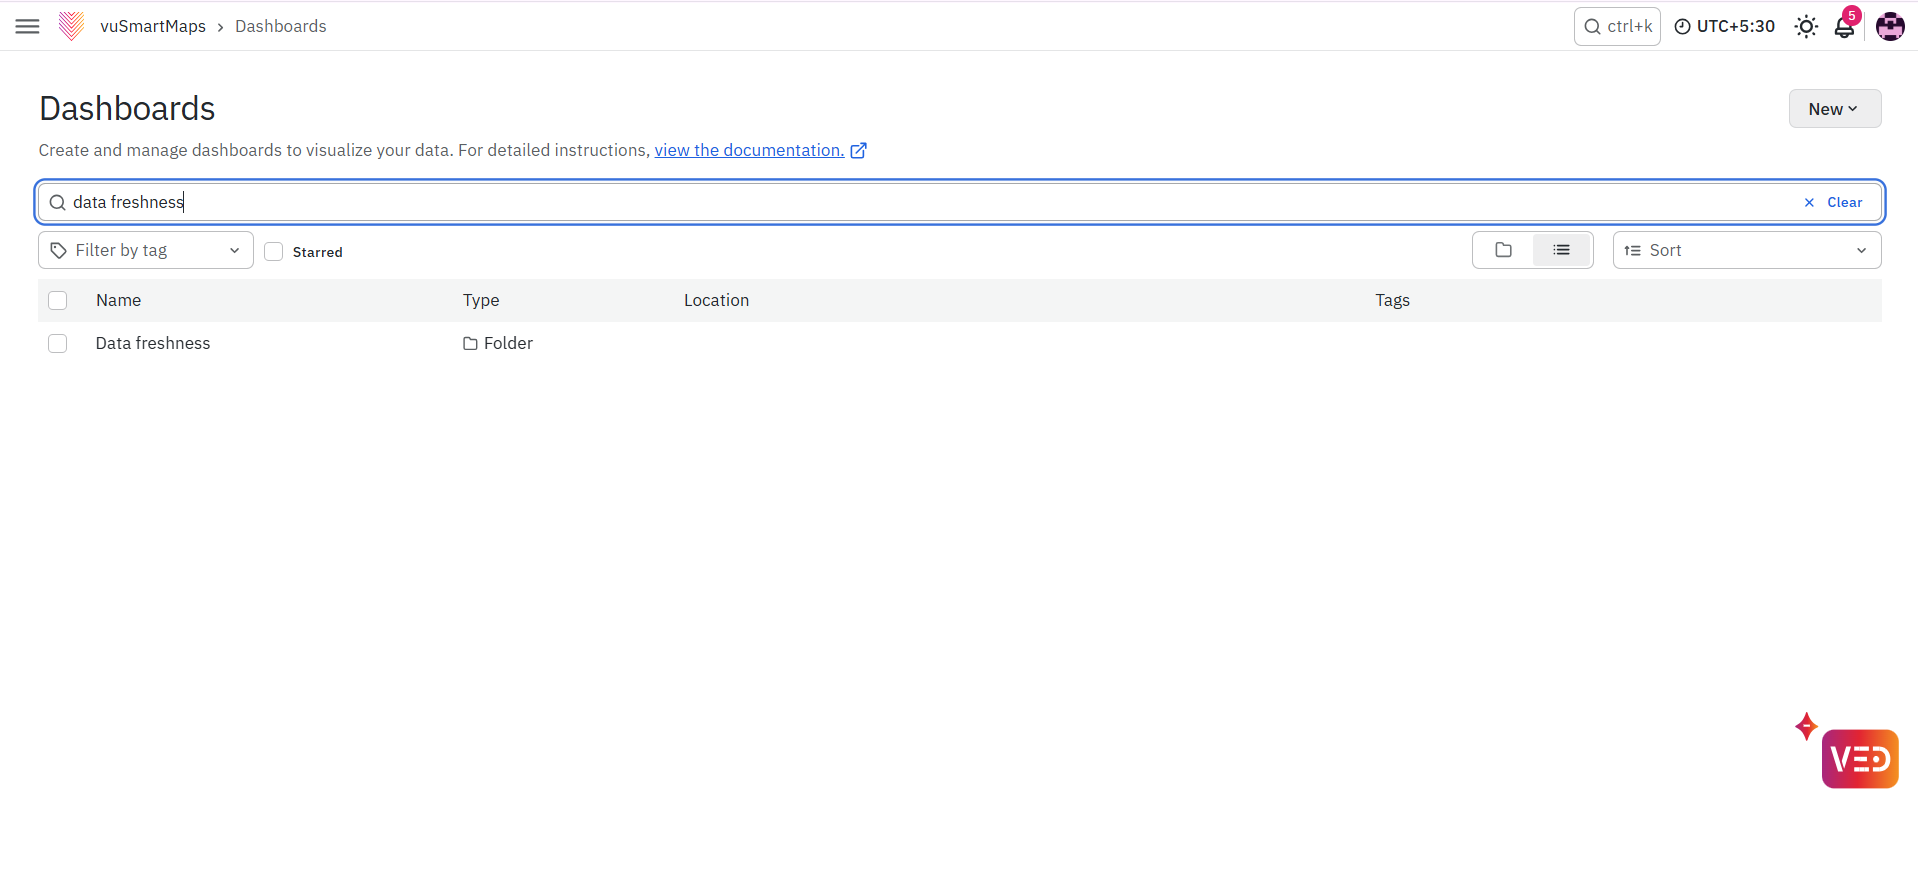
- Navigate to the left navigation menu and select Dashboards.
- In the dashboard search bar, search for Data Freshness.
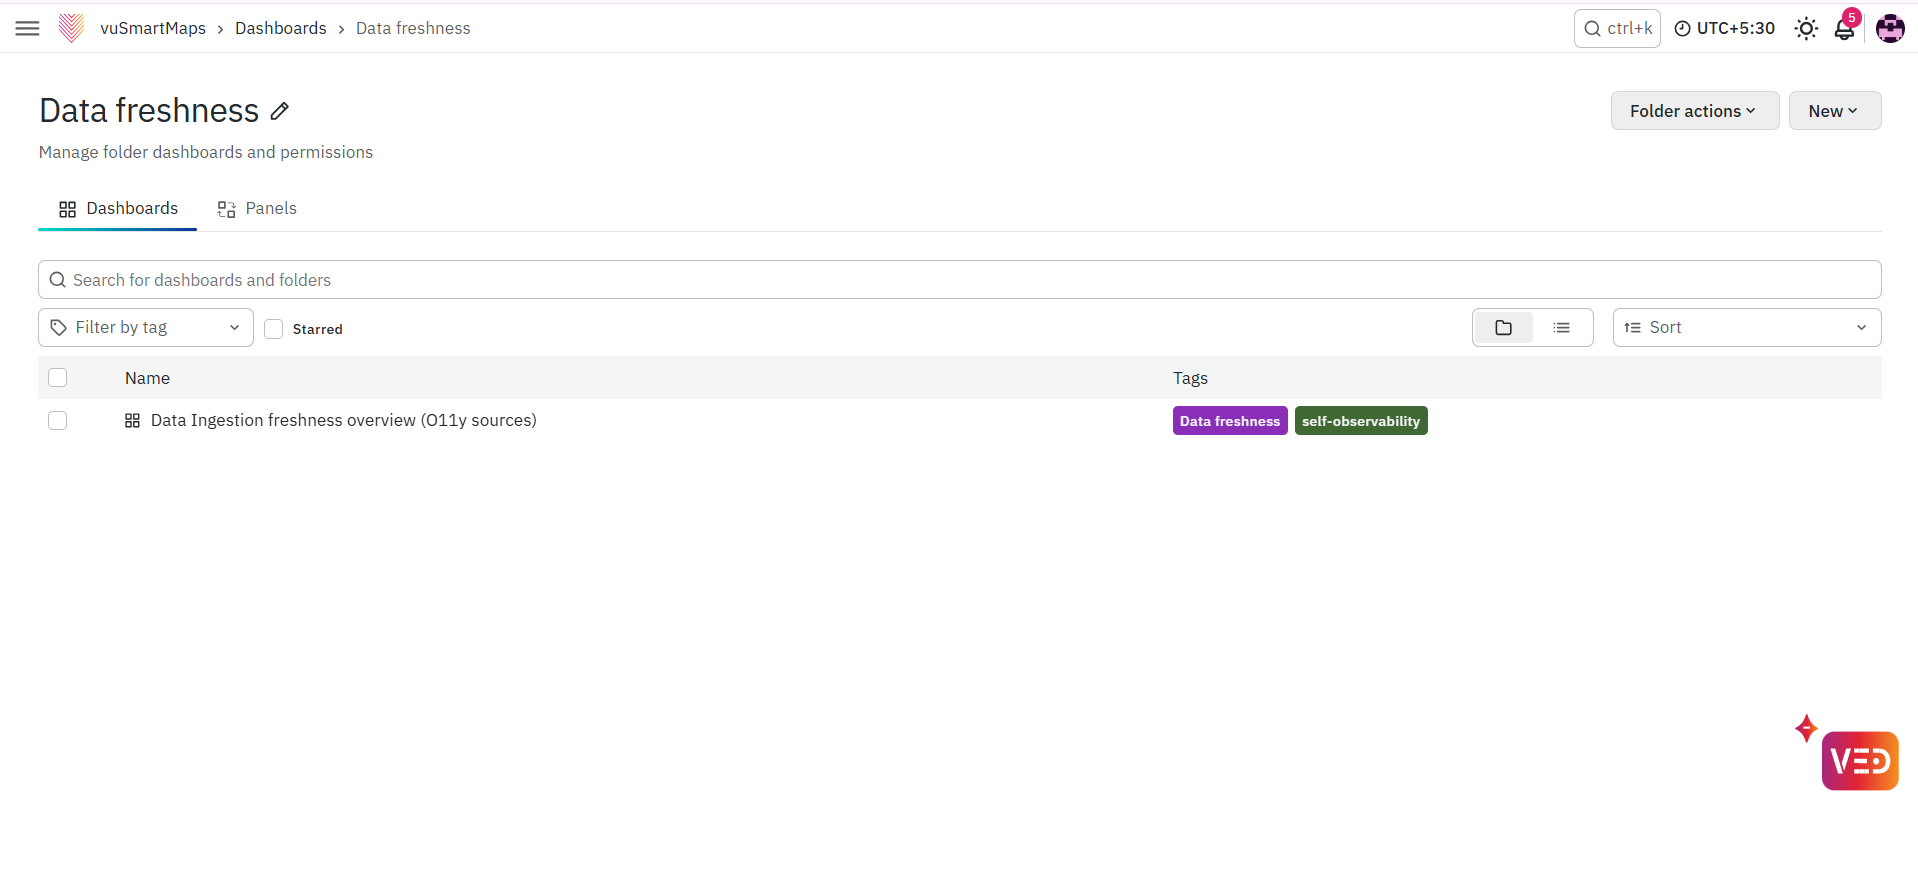
- Select Data Ingestion Freshness Overview (O11y Sources) from the search results.
- Use the O11y Source, Source Type, Source ID, and Health Status filters to display the required source instances.
- Select an Alert ID from the Details of Active Alerts table to open the corresponding alert under Control Center > System Console > View System Alerts > View Alerts.
FAQs
What does the Data Ingestion Freshness dashboard monitor?
The Data Ingestion Freshness dashboard monitors the freshness of data being ingested from configured O11y Source instances and helps identify delayed or interrupted data ingestion.
What do Healthy, Near Breach, and Breached mean in Data Ingestion Freshness?
Healthy indicates that data is arriving within the expected collection interval. Near Breach indicates that ingestion is approaching the defined freshness threshold, while Breached indicates that the delay has exceeded the threshold.
What is the difference between a Data Lag alert and a No Data alert?
A Data Lag alert indicates that data is still being received but later than expected. A No Data alert indicates that expected data has not been received from one or more source instances.
How can I identify the O11y Source instance responsible for a freshness issue?
Use the dashboard filters and review the O11y Source Health Details. Details such as Source ID, Status, Collection Interval, and Lag help identify the affected source instance.
What should I do when a Data Freshness breach is detected?
Review the Active Alerts and the affected O11y Source instances on the Data Ingestion Freshness dashboard to identify whether the issue is related to delayed ingestion or the absence of expected data.
