Data Consumption
Overview
The Data Consumption dashboard helps administrators monitor the health of dashboards and alerts by analyzing the queries executed by them. It provides a consolidated view of dashboard and alert health, identifies objects affected by slow, resource-heavy, or error-prone queries, and enables users to drill down to investigate the affected queries in detail.
The Data Consumption feature consists of three dashboards that together support the complete investigation workflow:
- Data Consumption – Summary provides an overall view of the health of monitored dashboards and alerts and highlights objects that require attention.
- Data Consumption – Dashboard Drilldown provides a detailed view of an individual dashboard, including the affected panels, UTMs, insights, and the queries contributing to its health status.
- Data Consumption – Alert Drilldown provides a detailed view of an individual alert, helping users identify the affected data models and the queries associated with the alert.
These dashboards help users identify unhealthy objects, understand the reason for degradation, and verify the health of dashboards and alerts after the underlying queries have been optimized.
Scenarios Considered
The Data Consumption feature supports the following monitoring scenarios:
- A Dashboard Panel Becomes Slower Over Time: As data volume increases, a dashboard panel query that previously completed quickly may take longer to execute. The Data Consumption feature helps identify the affected dashboard and the panel queries contributing to the performance issue.
- An Alert Stops Firing Reliably: When the query associated with an alert begins timing out or encountering errors, the alert may stop triggering reliably. The Data Consumption feature helps identify the affected alert and the underlying query requiring attention.
- Manual Auditing of Dashboards and Alerts: Manually checking the query health of multiple dashboards and alerts becomes difficult as their number increases. The Data Consumption dashboards provide a consolidated view that helps identify affected dashboards and alerts without checking each object individually.
Comprehensive understanding
The Data Consumption framework includes profilers that monitor the queries associated with dashboards and alerts. Once the profilers are enabled, the checks run automatically and the Data Consumption dashboards become available for monitoring query health.
The Data Consumption profilers run once every 10 hours. The configured Data Consumption health-check alert runs once every day.
Panel Options
Each dashboard panel includes a three-dot menu in the top-right corner that provides additional panel-level actions:
- View: Opens the panel in an expanded view.
- Edit: Opens the panel configuration for editing.
- Share: Provides options to share the panel.
- Explore: Opens the panel query in Explore for further analysis.
- Inspect: Displays detailed information about the panel, including its data and query details.
- More: Provides additional panel-specific options.
Data Consumption Health Alerts
The Data Consumption framework provides the following alerts for monitoring the health of dashboards and alerts:
- Self-Observability Dashboard Health Check: Generates a notification when one or more dashboards contain queries that have become Degraded or Unhealthy.
- Self-Observability Alert Health Check: Generates a notification when the underlying query of an alert becomes unreliable.
Alert Mail Notifications
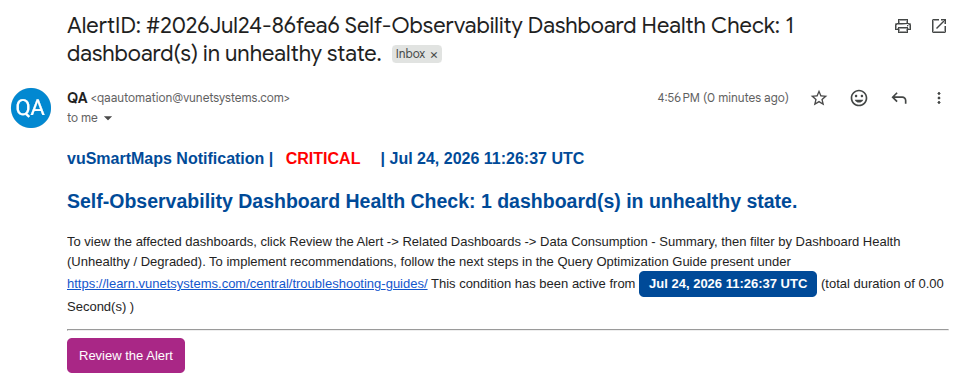
A Dashboard Health Check or Alert Health Check notification is sent through email when one or more dashboards or alerts become Degraded or Unhealthy. The notification provides the first indication that further investigation is required.
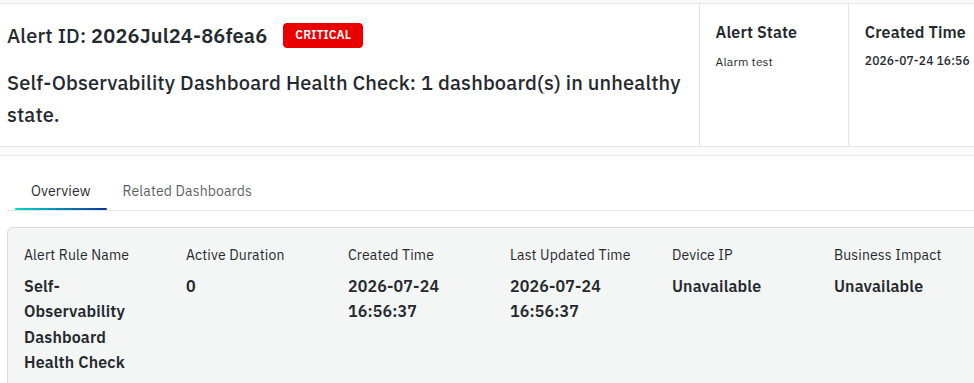
The email notification displays the alert information and provides the Review the Alert option. Selecting this option opens the corresponding alert details. For a Dashboard Health Check alert, the information table displays the affected dashboard and its current health status. The alert description includes a link to the supporting document containing the recommended next steps for addressing the detected query issue.
Data Consumption Alert Drilldown
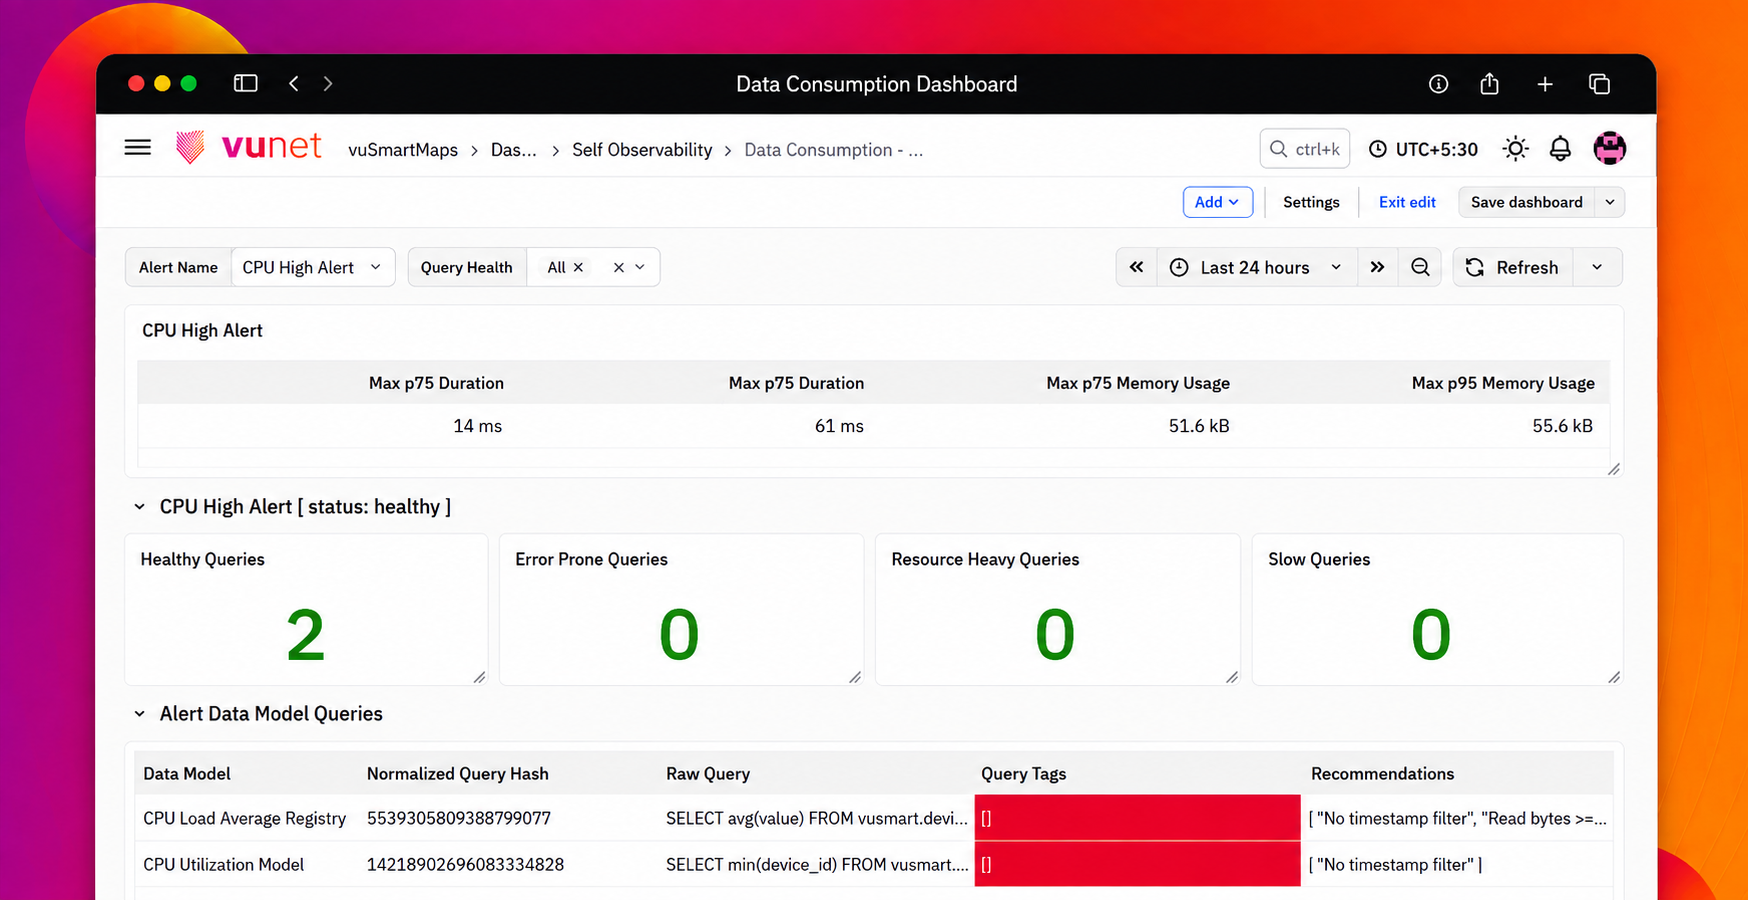
The Data Consumption Alert Drilldown dashboard provides a detailed analysis of an individual alert by displaying the execution health of the queries associated with the selected alert. It helps users investigate alert performance, identify unhealthy queries, review query execution metrics, and analyze the recommendations generated for query optimization. This dashboard enables users to determine the queries contributing to degraded alert health and take the necessary actions to improve alert execution.
Dashboard Panels
The Data Consumption Alert Drilldown dashboard is divided into the following sections:
- Alert Filters
- Alert Performance Metrics
- Alert Query Health
- Alert Data Model Queries
Alert Filters
The filters at the top of the dashboard allow users to select the alert they want to analyze and filter the displayed query information based on the selected Query Health category. These filters help users focus on a specific alert and quickly investigate the associated queries.
Alert Performance Metrics
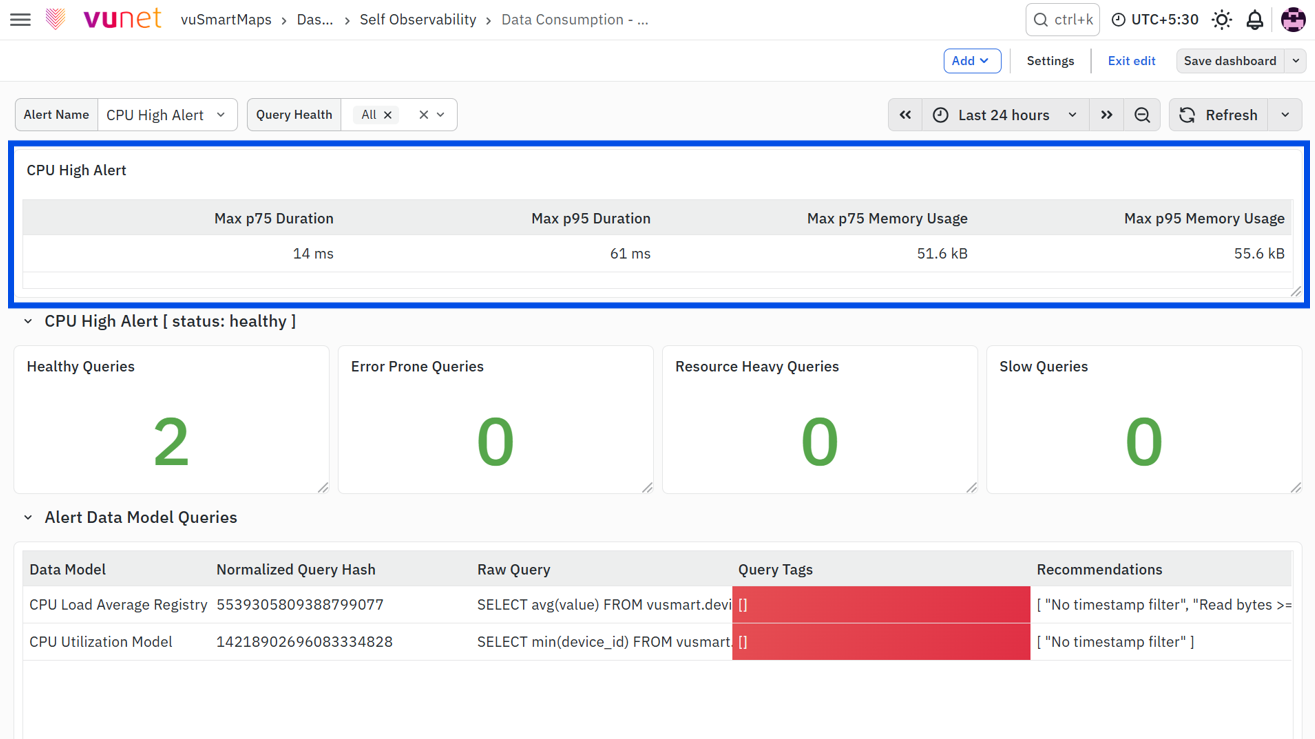
This section provides a summary of the execution performance of the selected alert by displaying key query execution metrics.
- Max p75 Duration – Displays the 75th percentile of the maximum query execution duration observed for the selected alert. This helps users understand the typical execution time of alert queries.
- Max p95 Duration – Displays the 95th percentile of the maximum query execution duration, helping identify queries that require significantly longer execution time.
- Max p75 Memory Usage – Displays the 75th percentile of the maximum memory consumed during query execution, allowing users to monitor the overall memory utilization of alert queries.
- Max p95 Memory Usage – Displays the 95th percentile of the maximum memory consumed by the queries, helping identify queries with high memory consumption.
Together, these metrics provide an overview of the execution characteristics of the selected alert and help determine whether execution time or memory utilization is affecting alert performance.
Alert Query Health
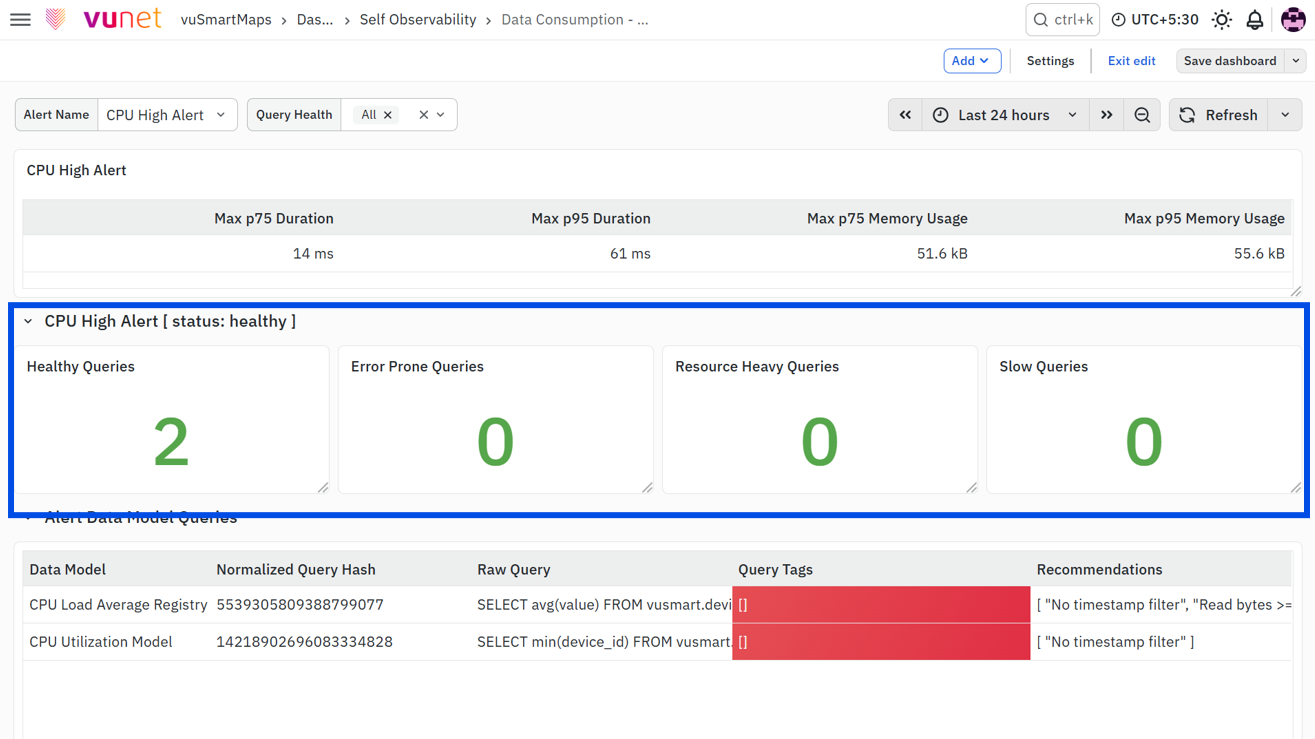
This section provides the health distribution of the queries executed by the selected alert. It categorizes the profiled queries into the following health classifications:
- Healthy Queries – Displays the number of queries executing within the expected performance thresholds.
- Error Prone Queries – Displays the number of queries that encountered execution errors during profiling and require further investigation.
- Resource Heavy Queries – Displays the number of queries consuming higher system resources during execution.
- Slow Queries – Displays the number of queries with higher execution duration than the expected threshold.
This section provides a quick summary of the overall health of the queries associated with the selected alert and helps users identify whether query execution issues are affecting alert performance.
Alert Data Model Queries
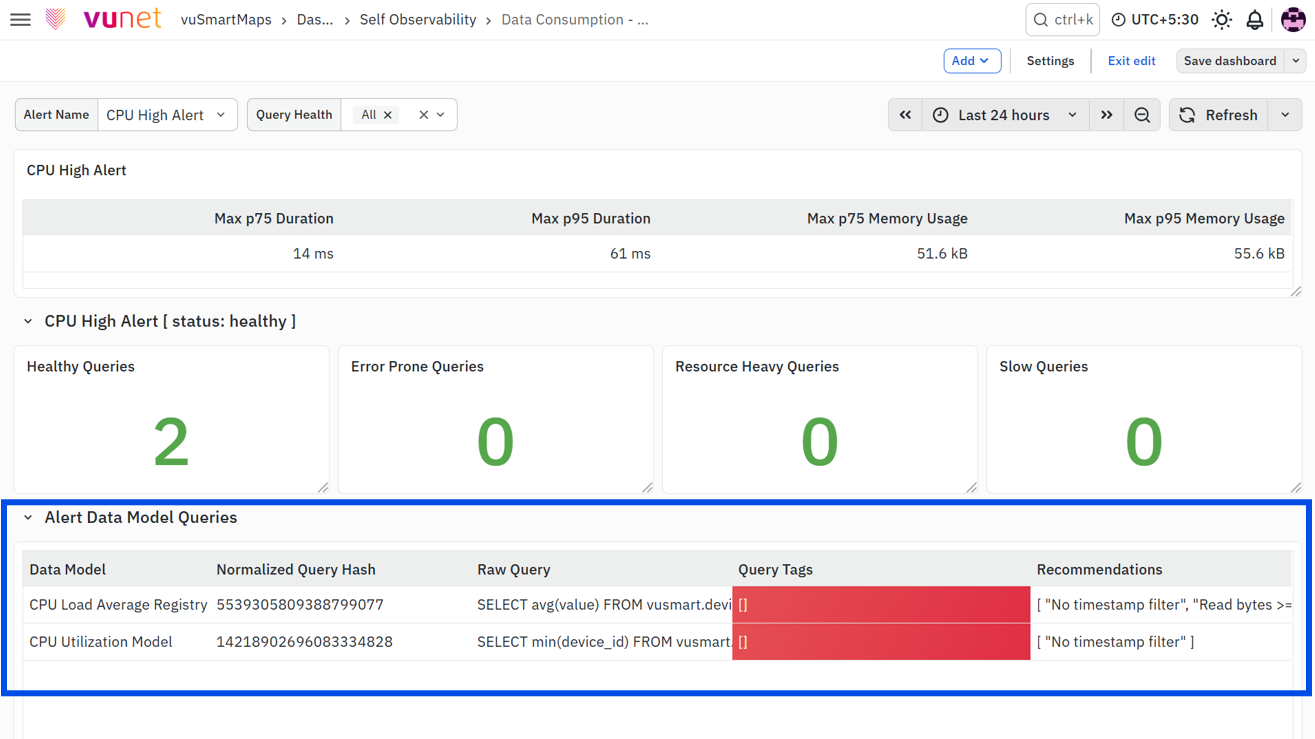
This section provides detailed information about the queries executed by the selected alert. It helps users identify the data model associated with the alert, review the executed query, understand its health classification, and analyze the recommendations generated for query optimization.
The table includes the following information:
- Data Model – Displays the name of the data model used by the selected alert to execute the query. This helps users identify which data model is associated with the alert.
- Normalized Query Hash – Displays the normalized hash value generated for the query. This unique identifier helps users recognize identical query patterns across different executions, even if the query parameters change.
- Raw Query – Displays the actual ClickHouse query executed by the selected alert. Reviewing the query helps users understand the query logic and identify conditions that may contribute to degraded performance.
- Query Tags – Displays the health classifications assigned to the query during profiling. These tags indicate whether the query has been identified as Slow, Resource Heavy, Error Prone, or belongs to another detected health category, enabling users to quickly understand the execution characteristics of the query.
- Recommendations – Displays the optimization recommendations generated for the query based on the detected query patterns. These recommendations help users identify possible improvements to optimize query execution and improve the overall health of the alert.
Data Consumption Dashboard Drilldown
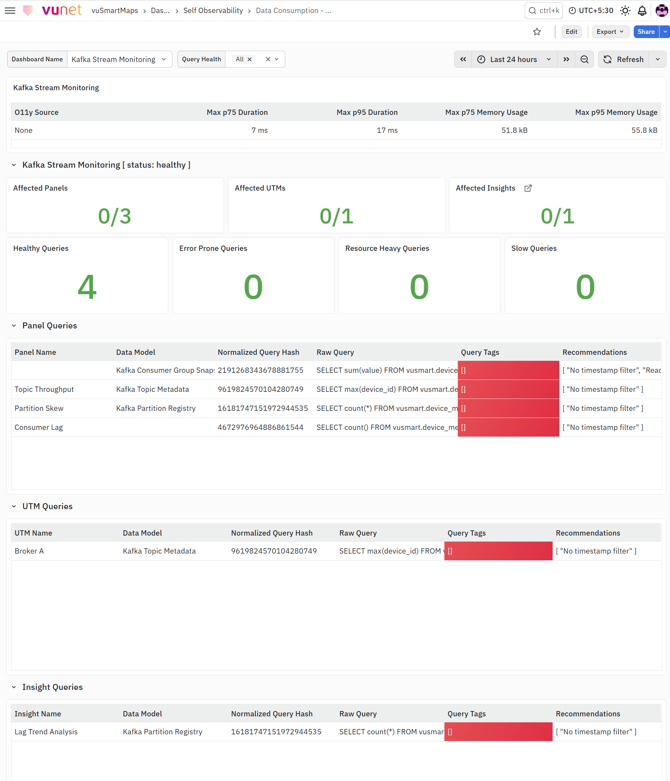
The Data Consumption Dashboard Drilldown dashboard provides a detailed analysis of an individual dashboard selected from the Data Consumption Summary dashboard. It enables users to investigate the health of the selected dashboard by identifying the affected dashboard components and the queries responsible for its current health status. The dashboard also provides detailed query information and recommendations that help users understand the reason for degraded performance and identify optimization opportunities.
Dashboard Panels
The Data Consumption Dashboard Drilldown dashboard is divided into the following sections:
- Dashboard Filters
- Dashboard Performance Metrics
- Dashboard Health Summary
- Panel Queries
- UTM Queries
- Insight Queries
- Variable Queries
Dashboard Filters
The filters at the top of the dashboard allow users to select the dashboard they want to investigate and filter the displayed queries based on their Query Health. These filters help users focus on a specific dashboard and analyze only the required category of queries, making it easier to investigate performance issues.
Dashboard Performance Metrics
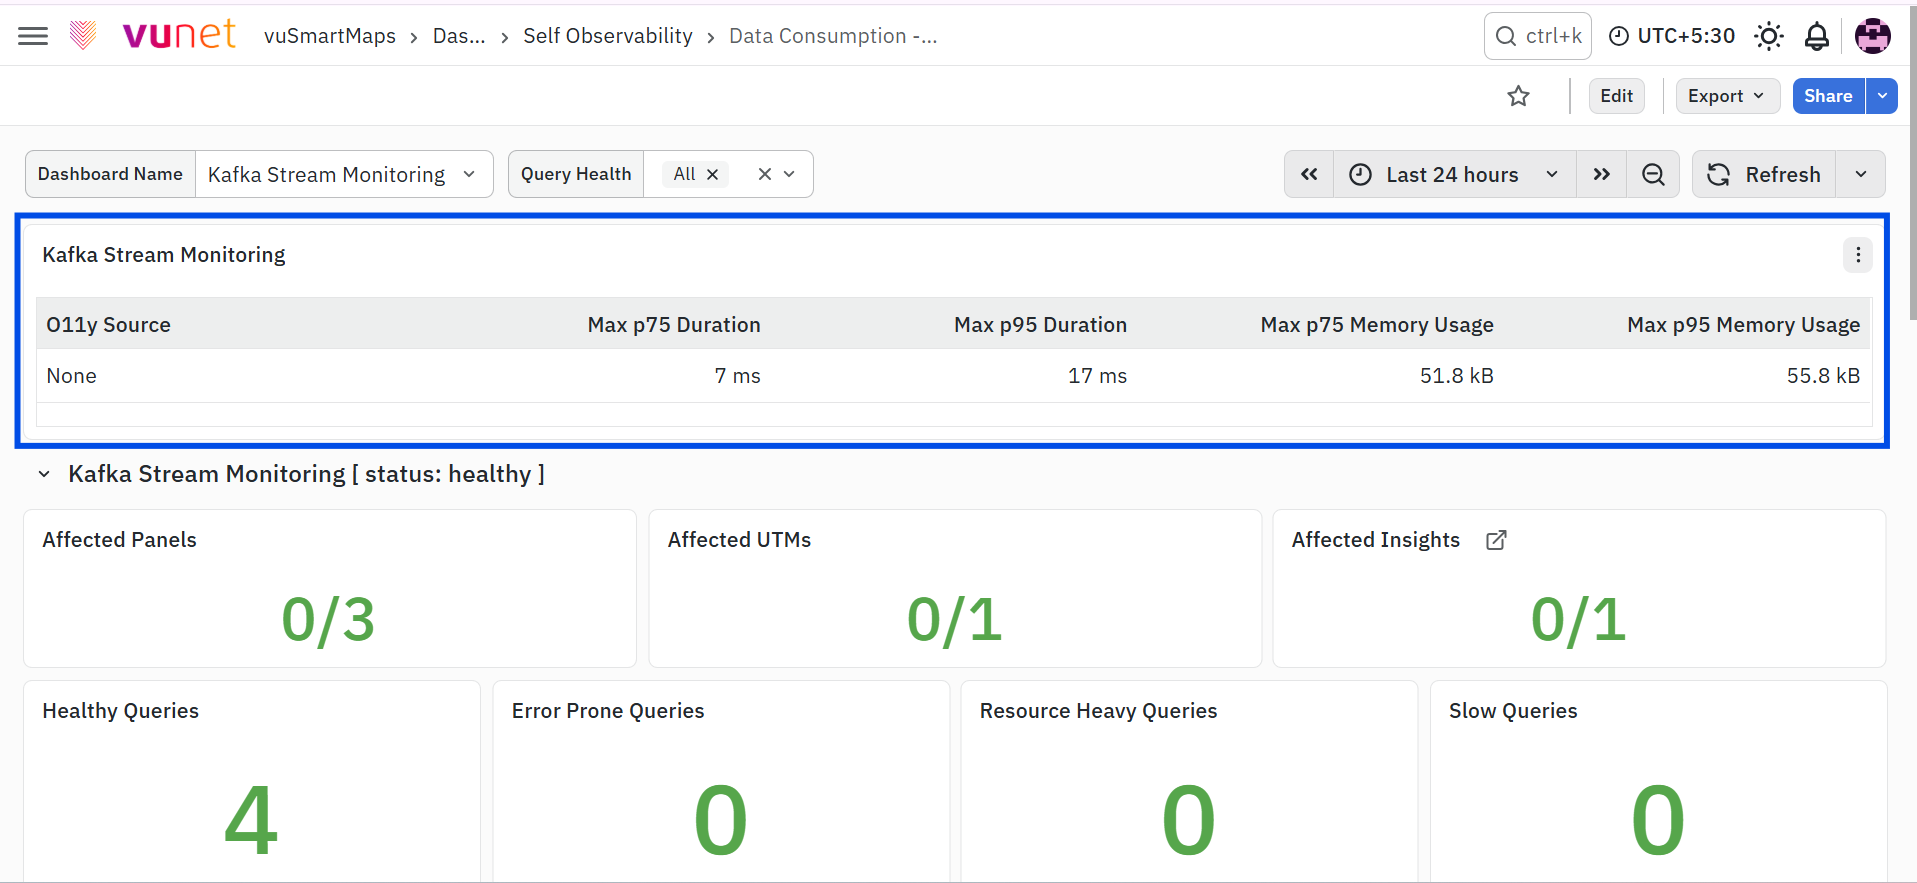
This section provides a summary of the query execution performance for the selected dashboard. The table includes the following metrics:
- O11y Source – Displays the observability source associated with the selected dashboard. This helps users identify the source from which the dashboard retrieves its data.
- Max p75 Duration – Displays the 75th percentile of the maximum query execution duration observed for the dashboard. This metric helps users understand the typical execution time of dashboard queries.
- Max p95 Duration – Displays the 95th percentile of the maximum query execution duration. Higher values indicate queries that require significantly longer execution time and may affect dashboard responsiveness.
- Max p75 Memory Usage – Displays the 75th percentile of the maximum memory consumed during query execution. This helps users monitor the overall memory utilization of the dashboard queries.
- Max p95 Memory Usage – Displays the 95th percentile of the maximum memory consumed during query execution. This metric helps identify queries that consume a large amount of system memory.
These metrics provide an overview of the execution characteristics of the selected dashboard and help determine whether execution time or memory consumption is contributing to degraded dashboard health.
Dashboard Health Summary
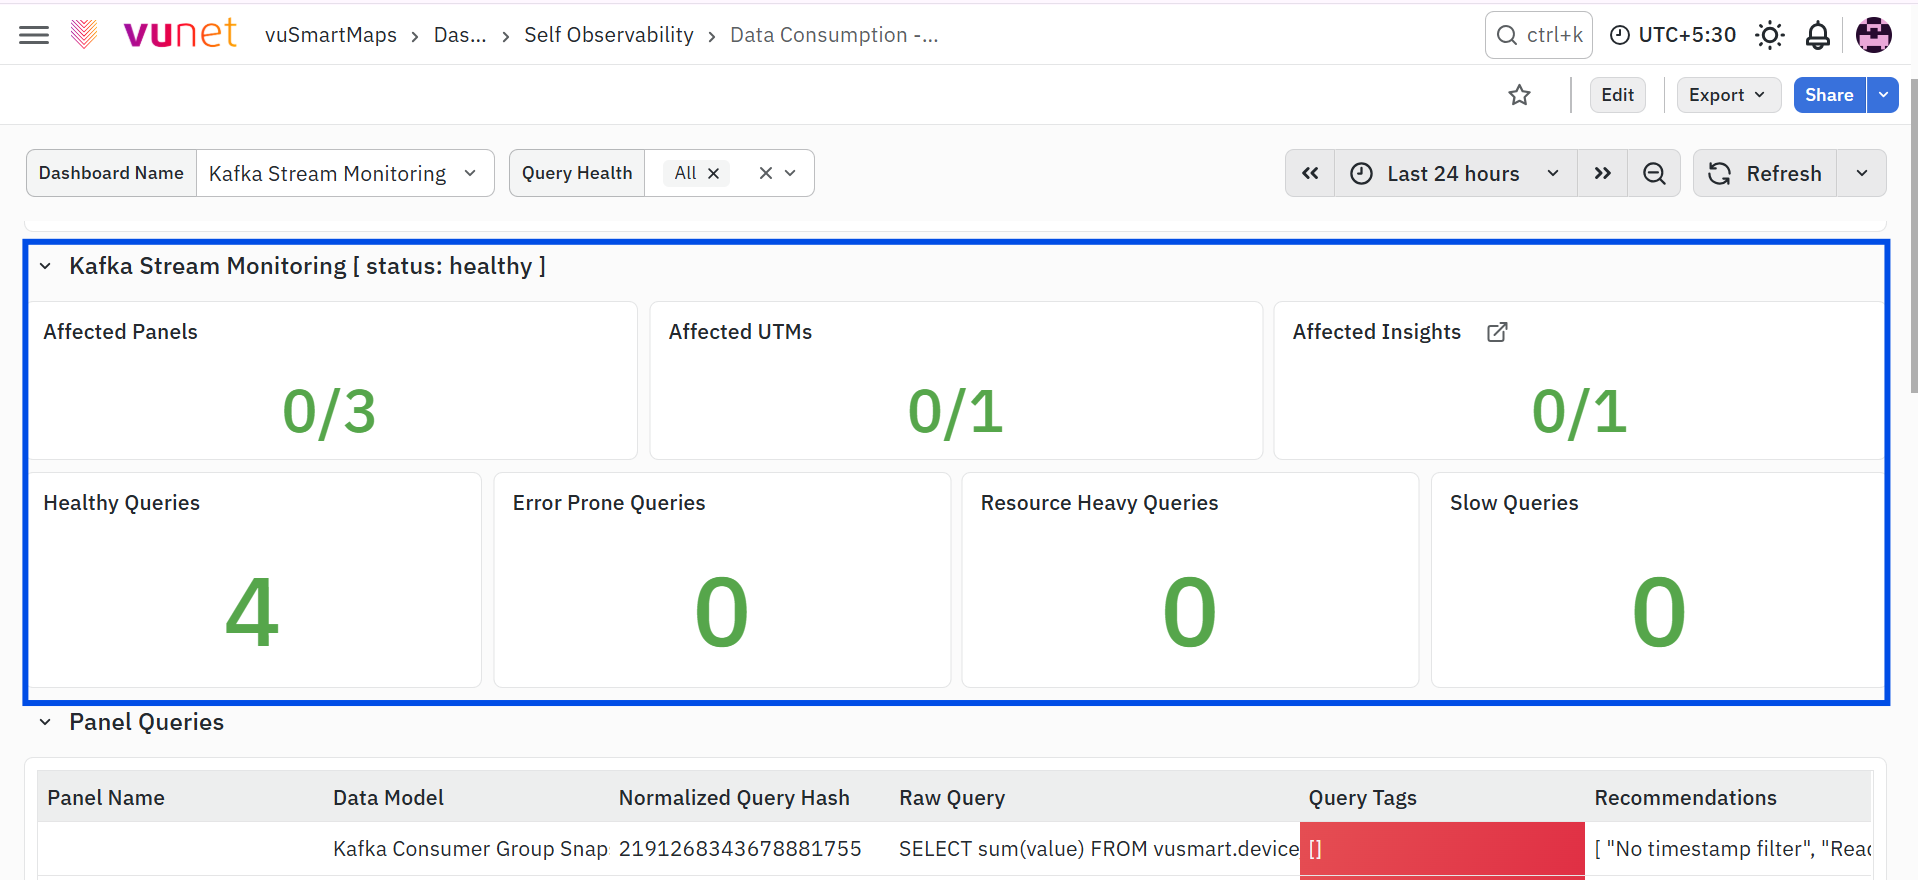
This section provides an overview of the health of the selected dashboard by displaying the health of its components and the queries executed within it. The dashboard includes the following indicators:
- Affected Panels – Displays the number of dashboard panels affected by unhealthy queries compared to the total number of panels. This helps users quickly determine how many panels require investigation.
- Affected UTMs – Displays the number of User Touchpoints (UTMs) affected by unhealthy queries. This enables users to identify whether UTM visualizations are contributing to dashboard degradation.
- Affected Insights – Displays the number of Insights affected by unhealthy queries. This helps users identify Insights that require further analysis.
The values displayed for Affected Panels, Affected UTMs, Affected Insights, and Affected Variables represent the number of distinct objects containing at least one flagged query compared with the total number of corresponding objects in use.
- Healthy Queries – Displays the total number of queries executing within the expected performance thresholds.
- Error Prone Queries – Displays the number of queries that encountered frequent error.
- Resource Heavy Queries – Displays the number of queries consuming high system resources during execution. These queries may impact dashboard performance and should be reviewed for optimization.
- Slow Queries – Displays the number of queries with higher execution duration than the expected threshold. These queries can increase dashboard loading time and should be analyzed for performance improvements.
The query-health counts represent the number of times queries received the corresponding health tag during the previous profiler run. A query that occurs multiple times and continues to receive the same tag is counted each time it is profiled. Therefore, these values do not necessarily represent the number of distinct query hashes.
Panel Queries
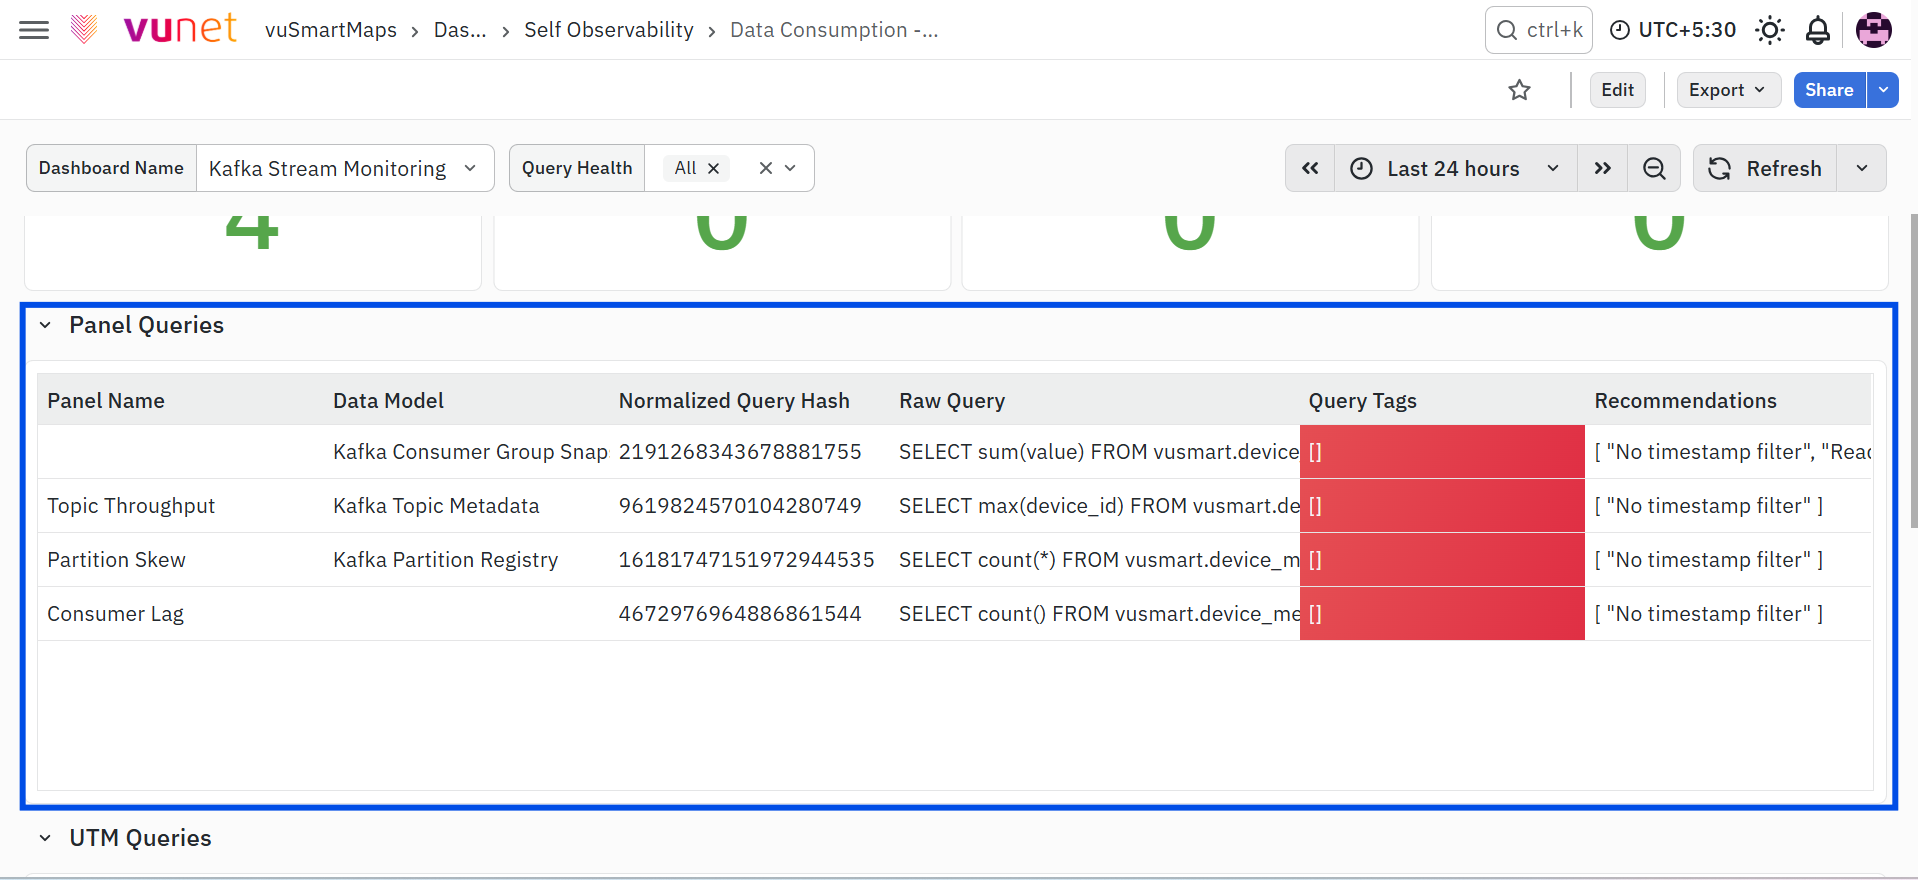
This section provides detailed information about the queries executed by the dashboard panels. Each row represents a query executed by a panel and includes the following information:
- Panel Name – Displays the name of the dashboard panel executing the query.
- Data Model – Displays the data model associated with the panel query.
- Normalized Query Hash – Displays the normalized hash value generated for the query, helping users identify repeated query patterns across executions.
- Raw Query – Displays the ClickHouse query executed by the panel, enabling users to review the query logic.
- Query Tags – Displays the health classifications assigned during profiling, indicating the execution characteristics of the query.
- Potential Optimization – Displays optimization recommendations generated for the query to help users improve query performance.
This section enables users to identify which dashboard panels contain unhealthy queries and review the recommendations for optimization.
UTM Queries
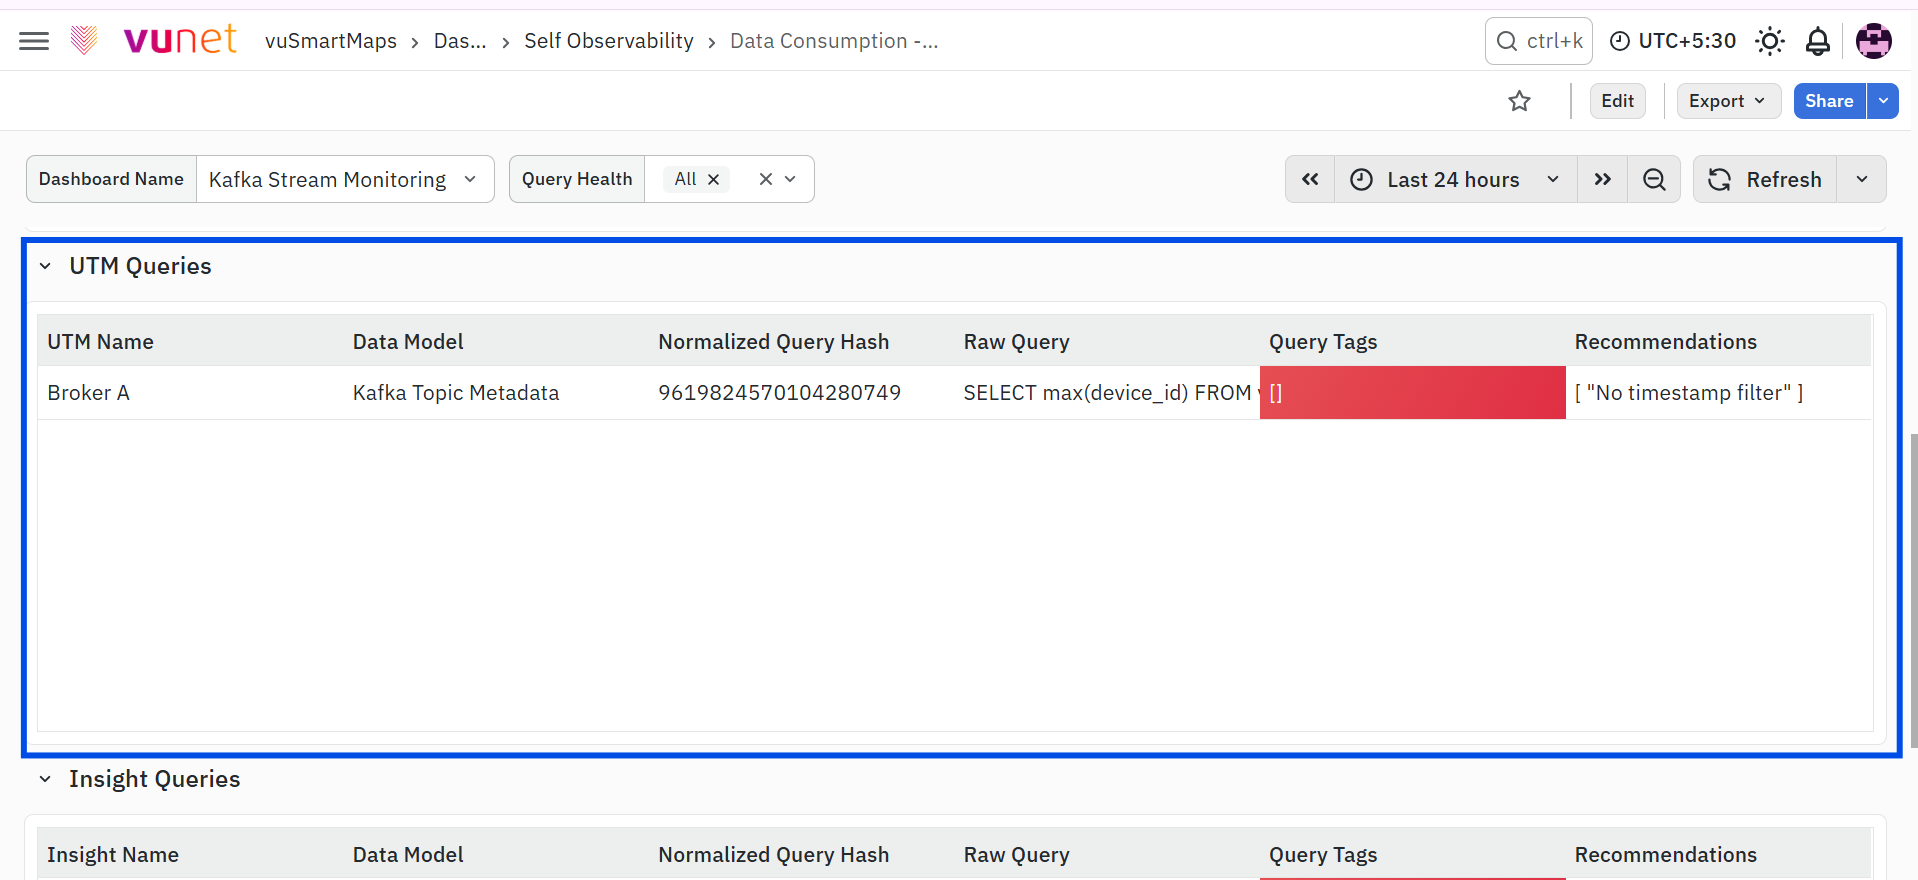
This section provides detailed information about the queries executed by the User Touchpoints (UTMs) associated with the selected dashboard. The table includes the following information:
- UTM Name – Displays the name of the UTM associated with the query.
- Data Model – Displays the data model used by the UTM.
- Normalized Query Hash – Displays the normalized hash value for the query.
- Raw Query – Displays the ClickHouse query executed by the selected UTM.
- Query Tags – Displays the health classifications assigned to the query during profiling.
- Potential Optimization – Displays optimization recommendations generated for the query.
This section helps users investigate query performance for individual UTMs and determine whether they contribute to degraded dashboard health.
Insight Queries
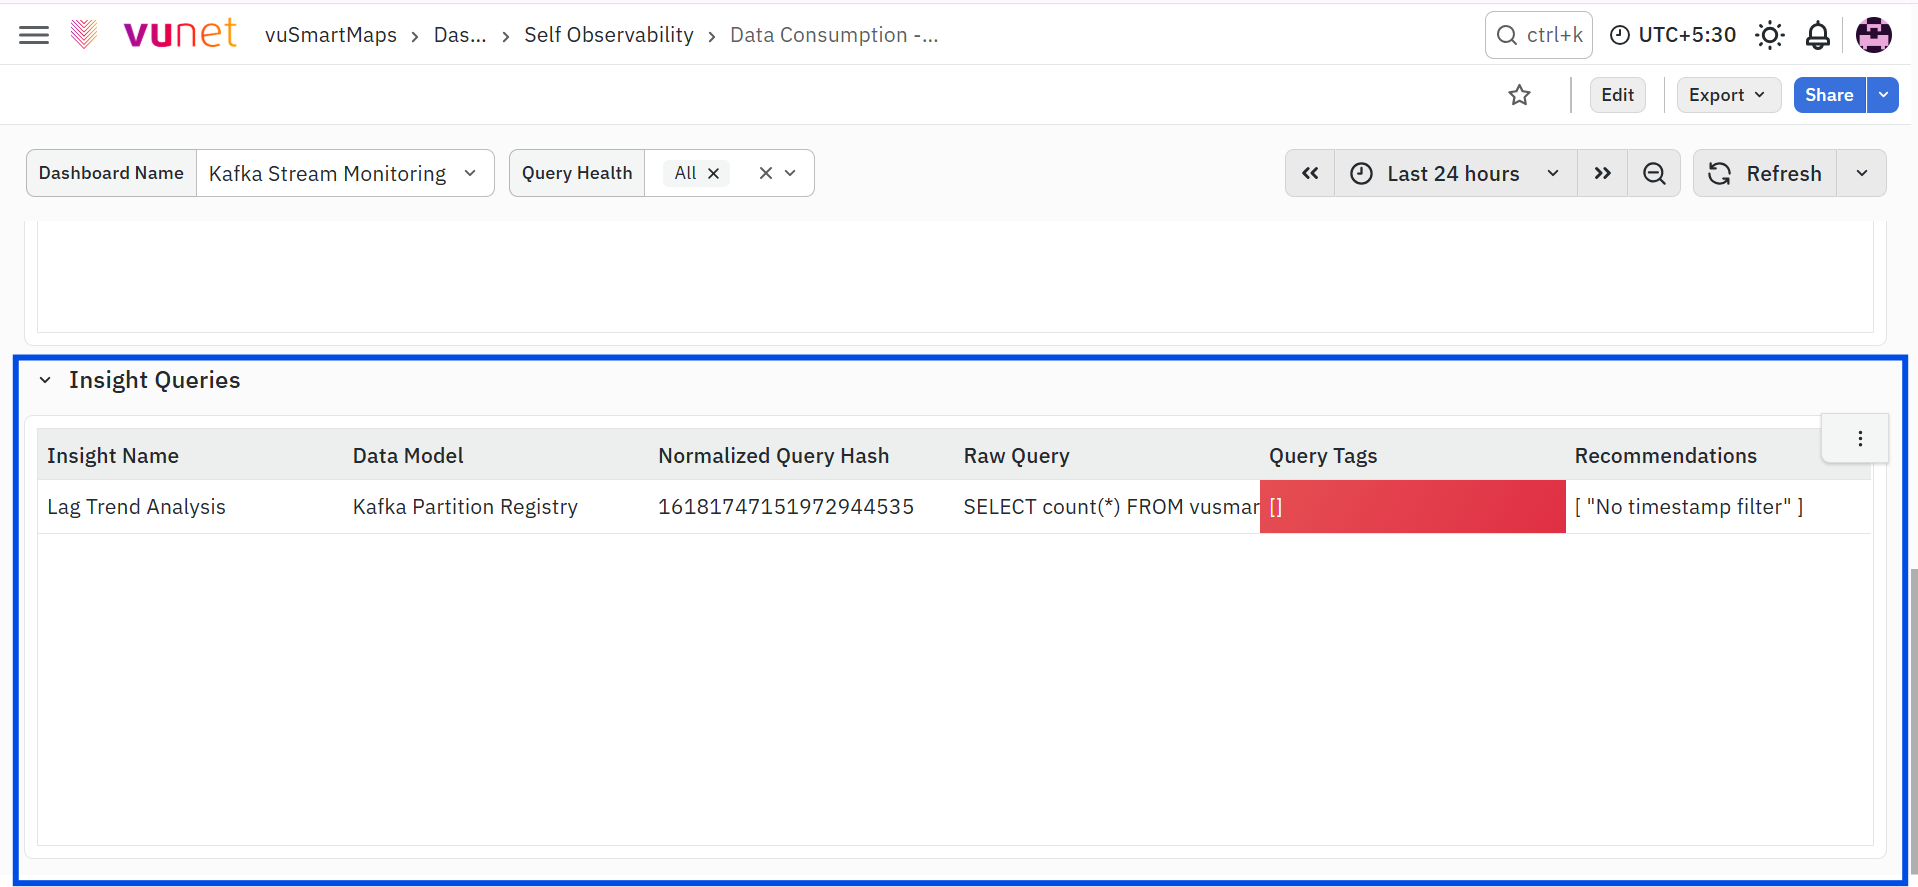
This section provides detailed information about the queries executed by the Insights associated with the selected dashboard. The table includes the following information:
- Insight Name – Displays the name of the Insight executing the query.
- Data Model – Displays the data model associated with the Insight.
- Normalized Query Hash – Displays the normalized hash value generated for the query.
- Raw Query – Displays the ClickHouse query executed by the Insight.
- Query Tags – Displays the health classifications assigned during profiling.
- Potential Optimization – Displays optimization recommendations generated for the query based on the detected query patterns.
This section helps users analyze the queries executed by Insights, understand their execution characteristics, and identify optimization opportunities to improve the overall health of the dashboard.
Query Analysis:
Query health tags and detected query findings are evaluated independently. A query may be classified as Slow, Resource Heavy, or Error Prone without having a detected query finding. Similarly, a query may have a detected finding while its current health classification remains Healthy.
A detected finding should still be addressed even when the query is currently classified as Healthy. Every occurrence of a query hash is displayed in decreasing order of priority and start time. The most recent occurrence of a higher-priority query is displayed first.
Variable Queries
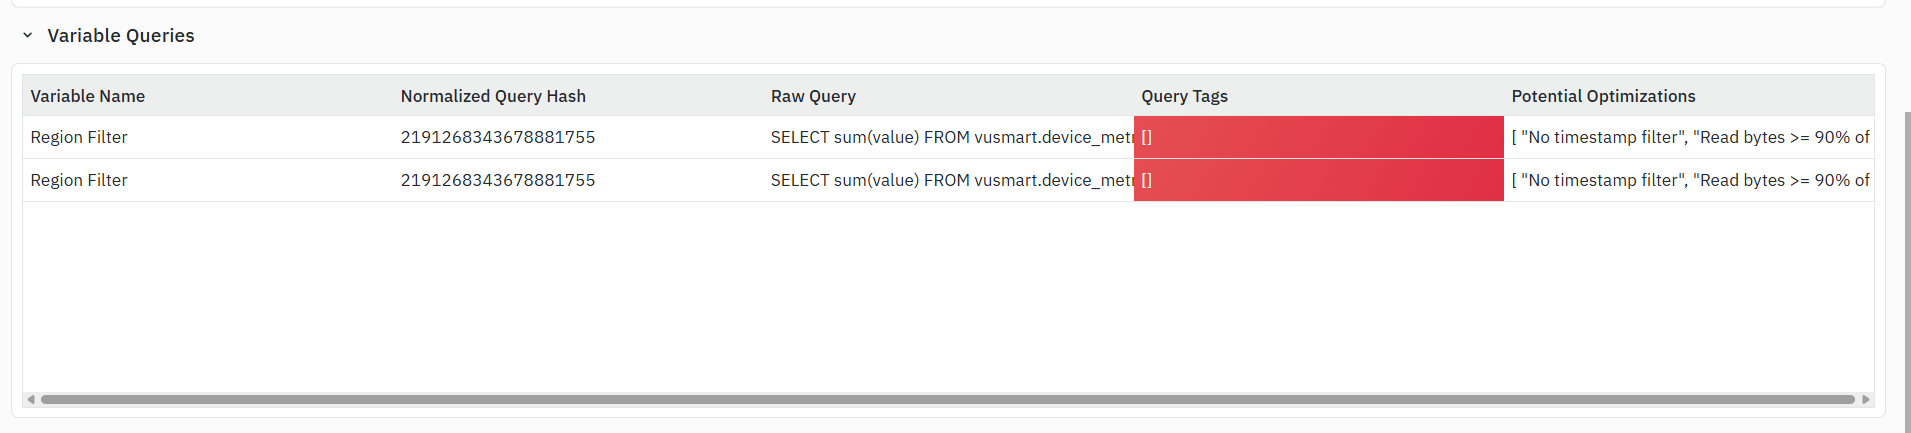
The Variable Queries section provides detailed information about the queries executed by dashboard variables. It helps identify variable queries that have been profiled and provides the corresponding query details, health classifications, and potential optimization findings.
Each row represents a query associated with a dashboard variable and includes the following information:
- Variable Name: Displays the name of the dashboard variable associated with the query.
- Normalized Query Hash: Displays the normalized hash value generated for the query, helping identify the same query pattern across different executions.
- Raw Query: Displays the ClickHouse query executed by the dashboard variable, enabling the query logic to be reviewed.
- Query Tags: Displays the health classifications assigned to the query during profiling. These tags indicate the execution health of the query.
- Potential Optimizations: Displays the optimization findings identified for the query based on the detected query patterns, helping identify areas where the query can be improved.
This section helps identify dashboard variables associated with query issues and provides the information required to understand their query behaviour and potential optimization opportunities.
Data Consumption Summary
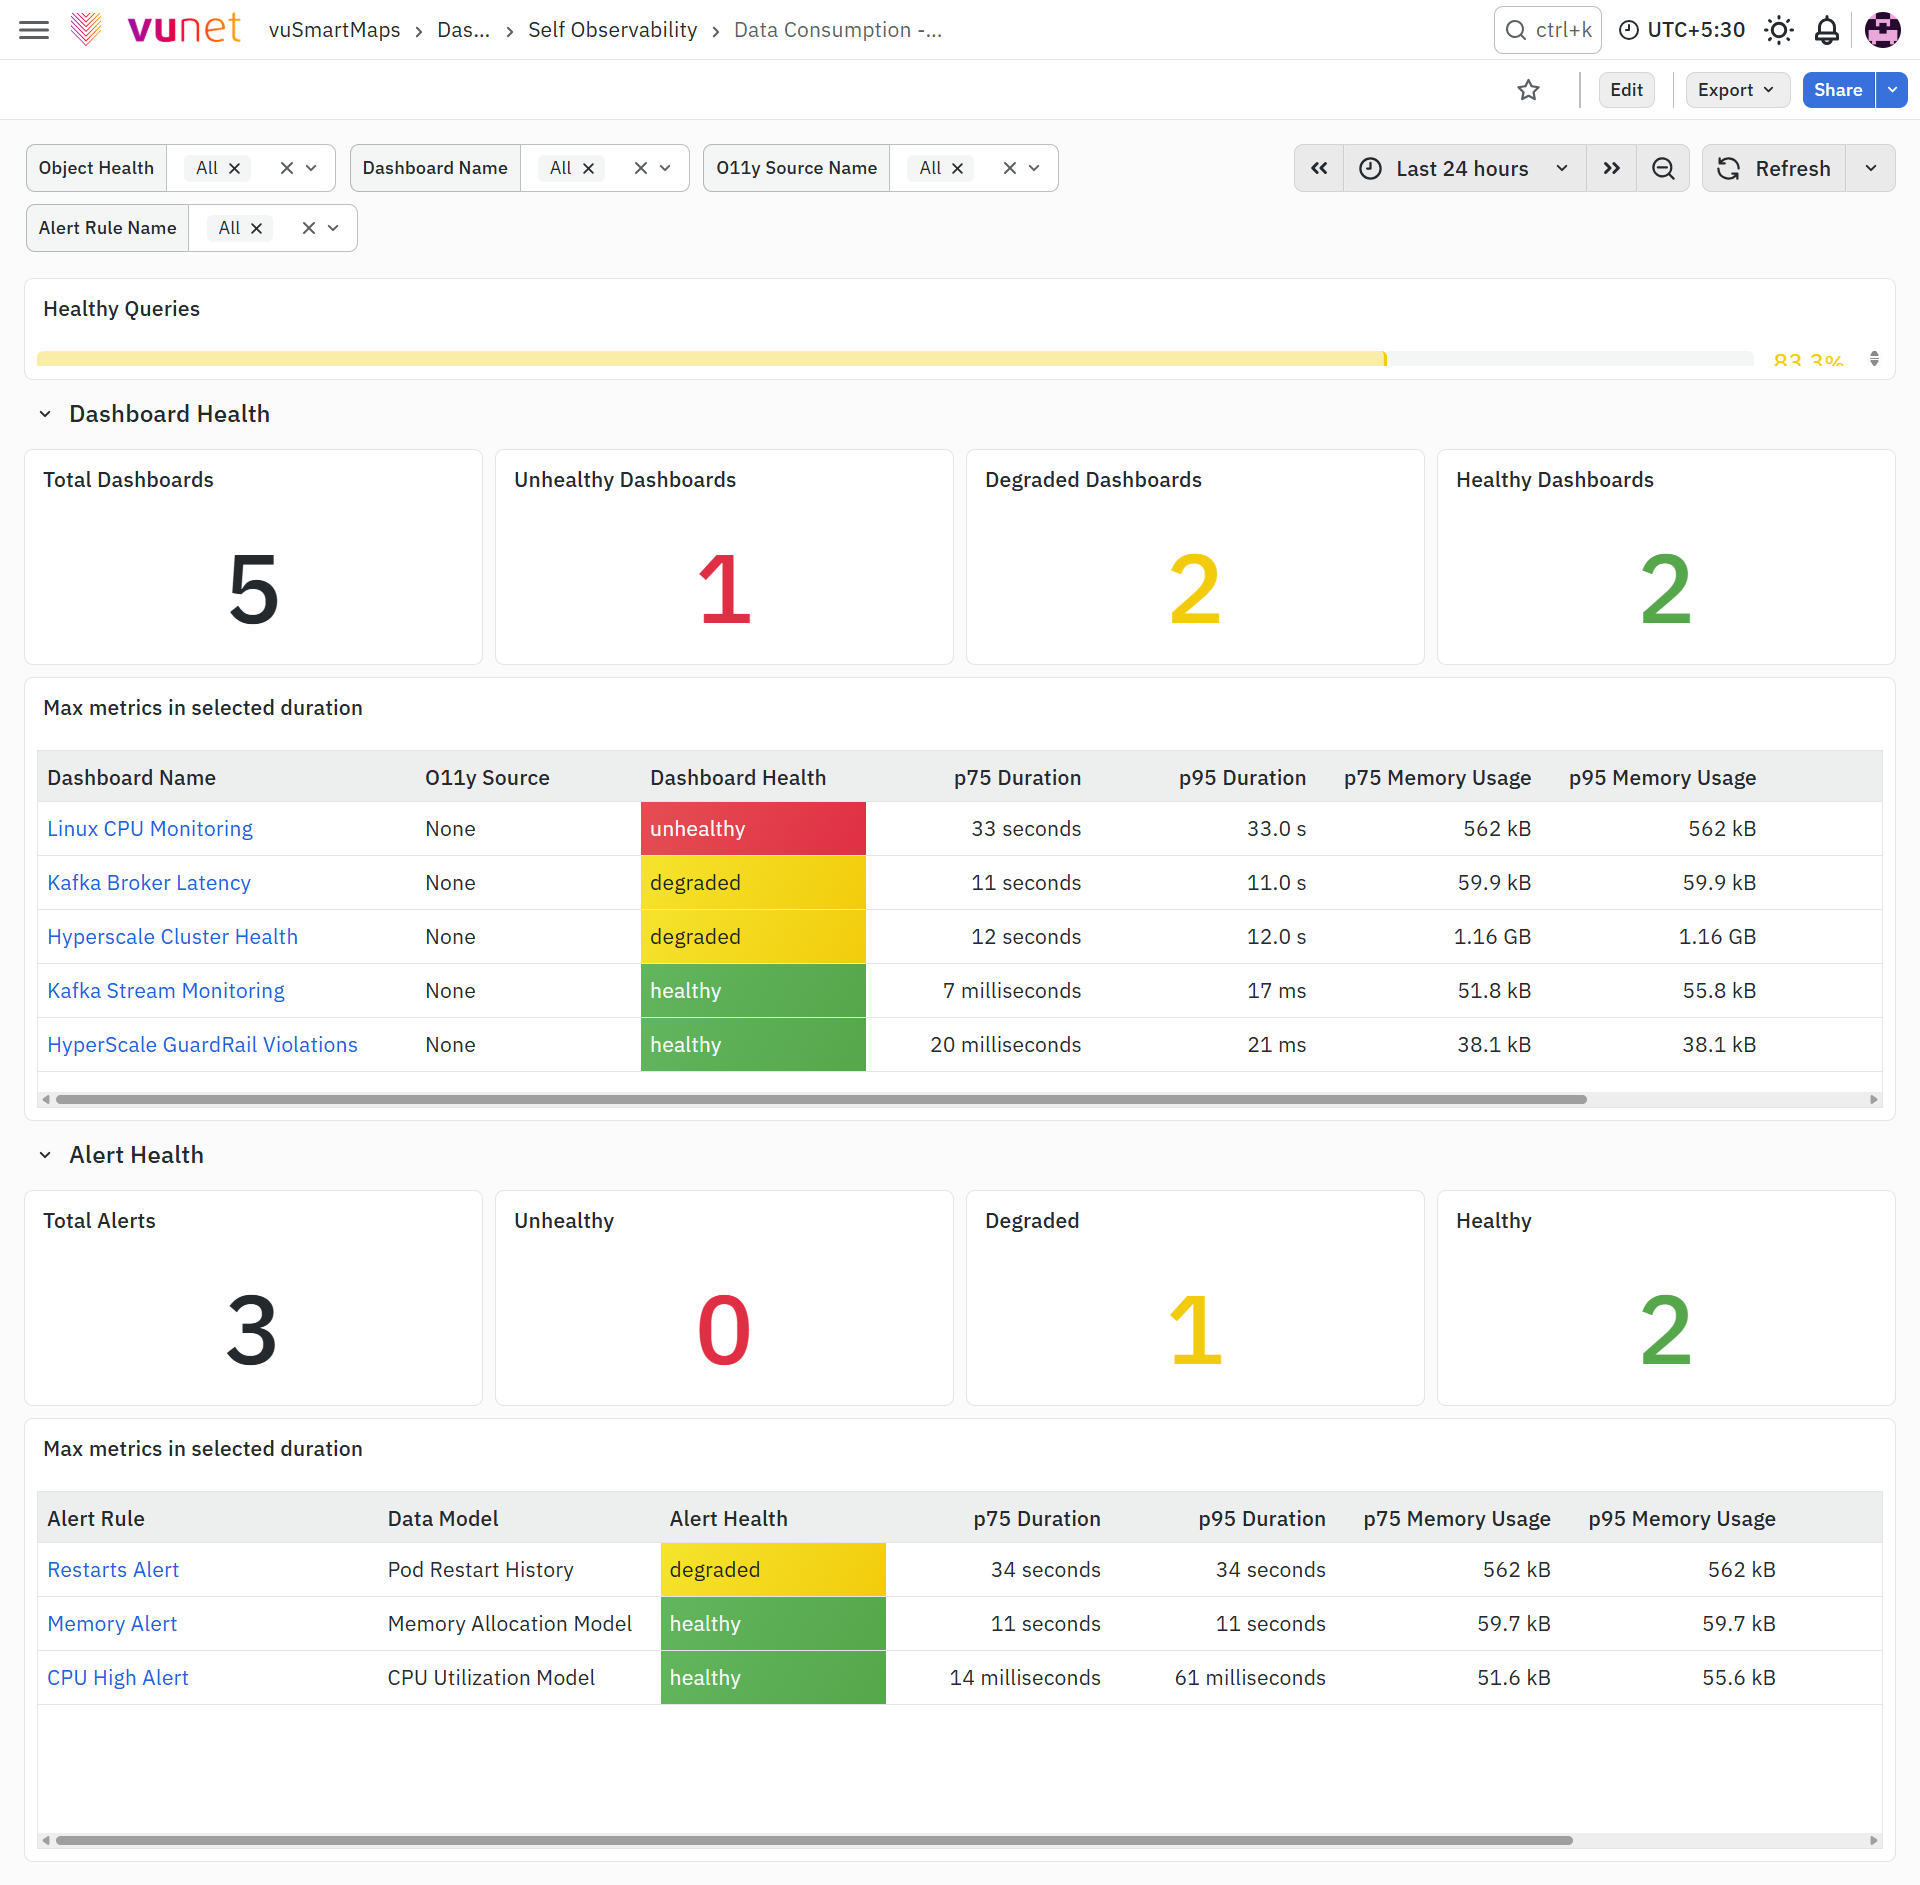
The Data Consumption Summary dashboard provides a consolidated view of the health of dashboards and alerts monitored by the platform. It enables users to assess the overall health of dashboard and alert queries, identify objects that require attention, and quickly determine whether performance issues are caused by slow, resource-heavy, or error-prone queries. The dashboard also provides key execution metrics that help users prioritize dashboards and alerts for further investigation. Users can drill down into individual dashboards or alerts to perform detailed query-level analysis.
Dashboard Panels
The Data Consumption Summary dashboard is divided into the following sections:
- Filters
- Healthy Queries
- Dashboard Health
- Alert Health
Filters
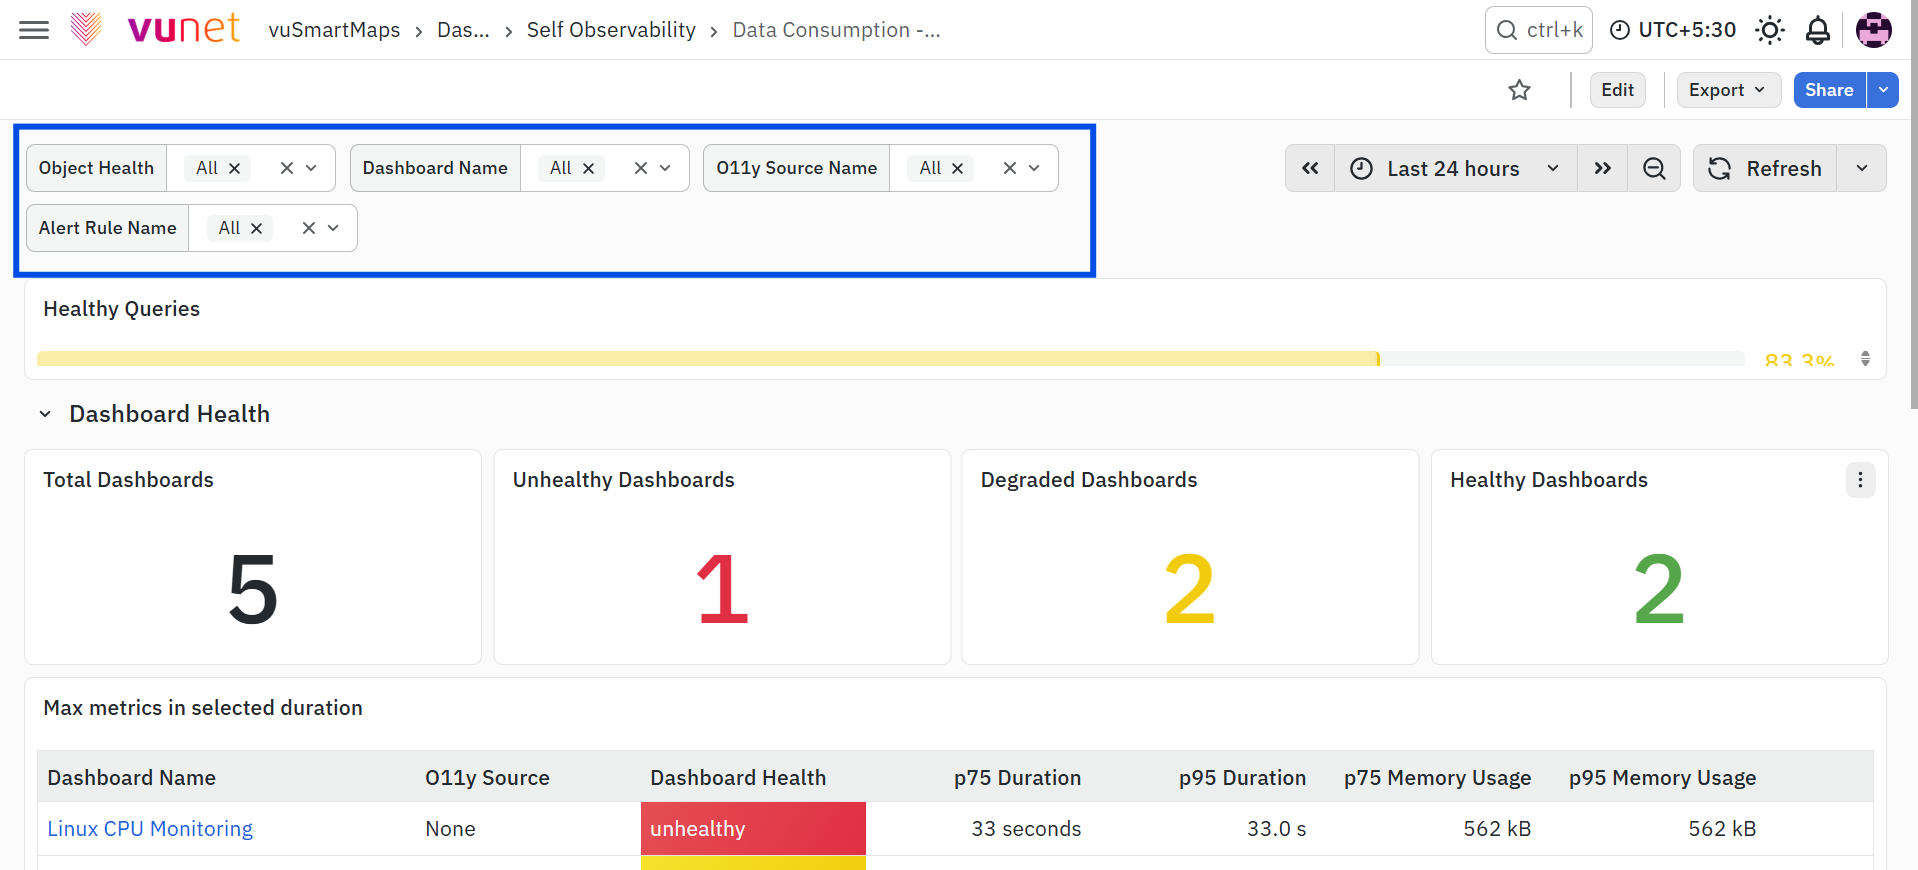
The filters at the top of the dashboard allow users to narrow the displayed information based on specific criteria. These filters help users focus on the required dashboards or alerts and simplify the investigation process.
The available filters include:
- Object Health – Filters dashboards and alerts based on their health status, enabling users to view only Healthy, Degraded, or Unhealthy objects.
- Dashboard Name – Displays information for the selected dashboard.
- O11y Source Name – Filters the dashboard information based on the selected observability source.
- Alert Rule Name – Displays information for the selected alert rule.
These filters can be used individually or together to perform targeted analysis.
Healthy Queries
The Healthy Queries panel displays the percentage of healthy queries across the monitored dashboards and alerts. It provides an overall indication of query health within the Data Consumption framework. A value of 100% indicates that all monitored queries are healthy. A value below 100% indicates that one or more queries require further investigation.
Dashboard Health
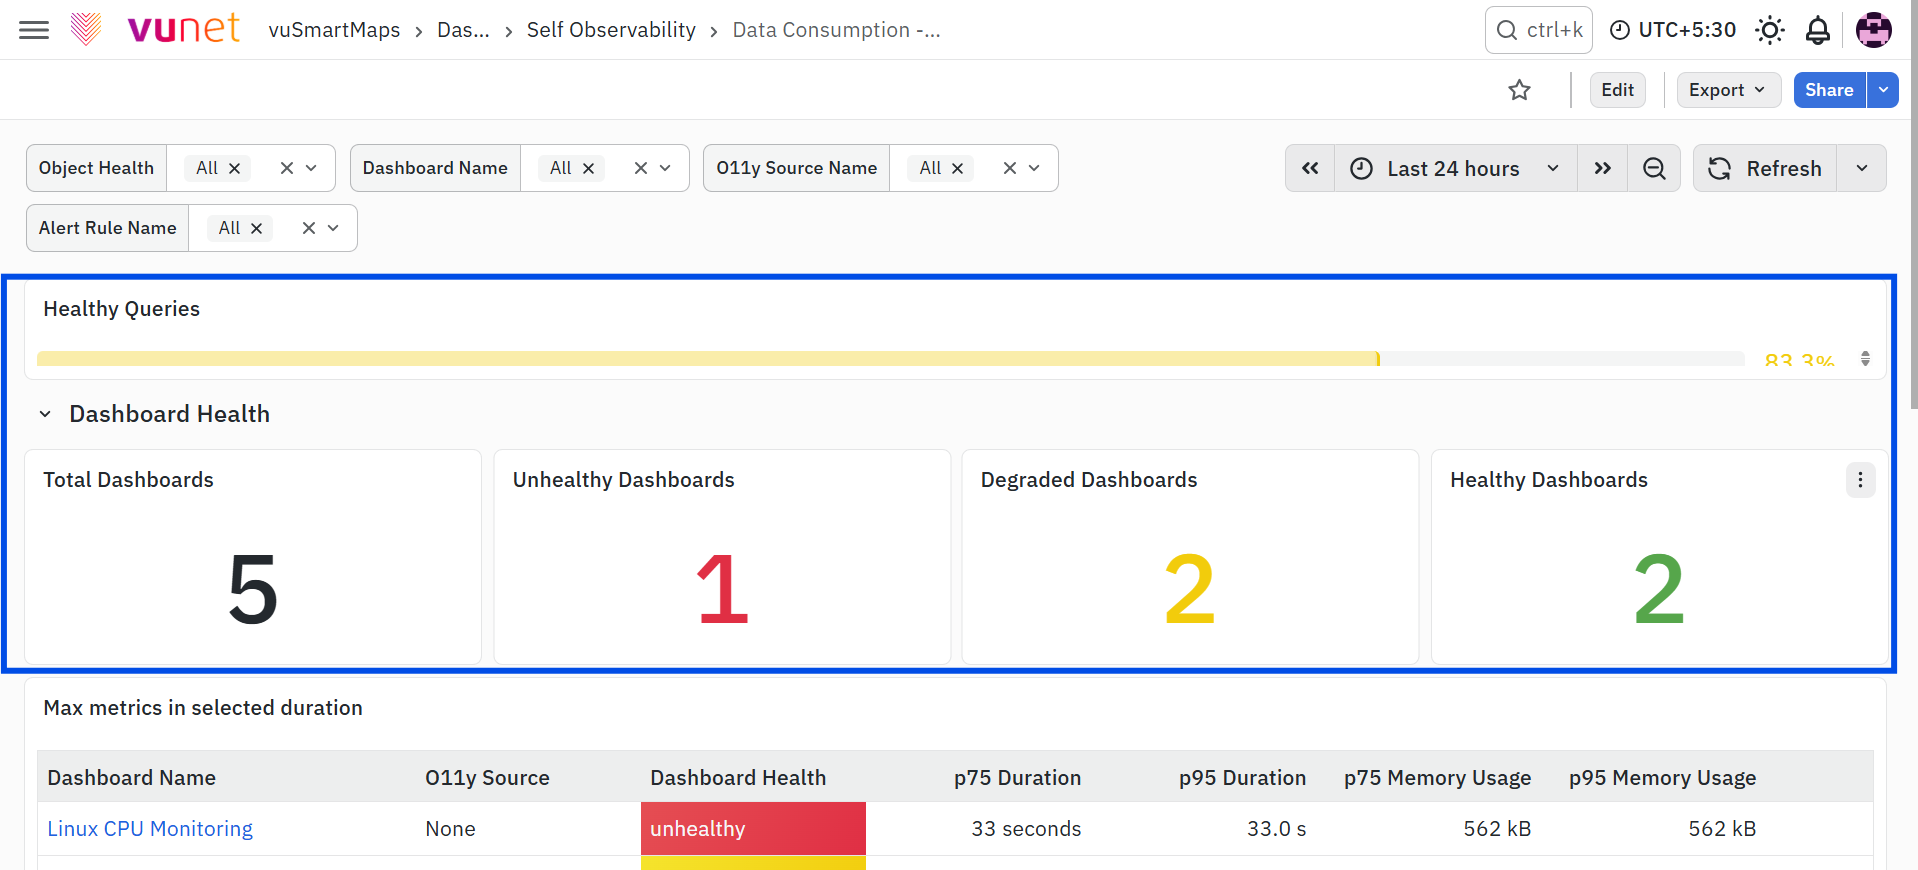
The Dashboard Health section provides an overview of the health of all monitored dashboards. It summarizes the number of dashboards in each health category and displays execution metrics that help users identify dashboards requiring further investigation.
Dashboard Health Summary
This section displays the overall health distribution of monitored dashboards. It includes the following metrics:
- Total Dashboards – Displays the total number of dashboards monitored by the Data Consumption feature during the selected time range.
- Unhealthy Dashboards – Displays the number of dashboards classified as Unhealthy based on the health of the queries executed by the dashboard.
- Degraded Dashboards – Displays the number of dashboards classified as Degraded, indicating that one or more queries require attention but the dashboard remains operational.
- Healthy Dashboards – Displays the number of dashboards whose queries are executing within the expected performance thresholds.
These summary metrics provide a quick understanding of the overall health of dashboards across the platform.
Dashboard Metrics
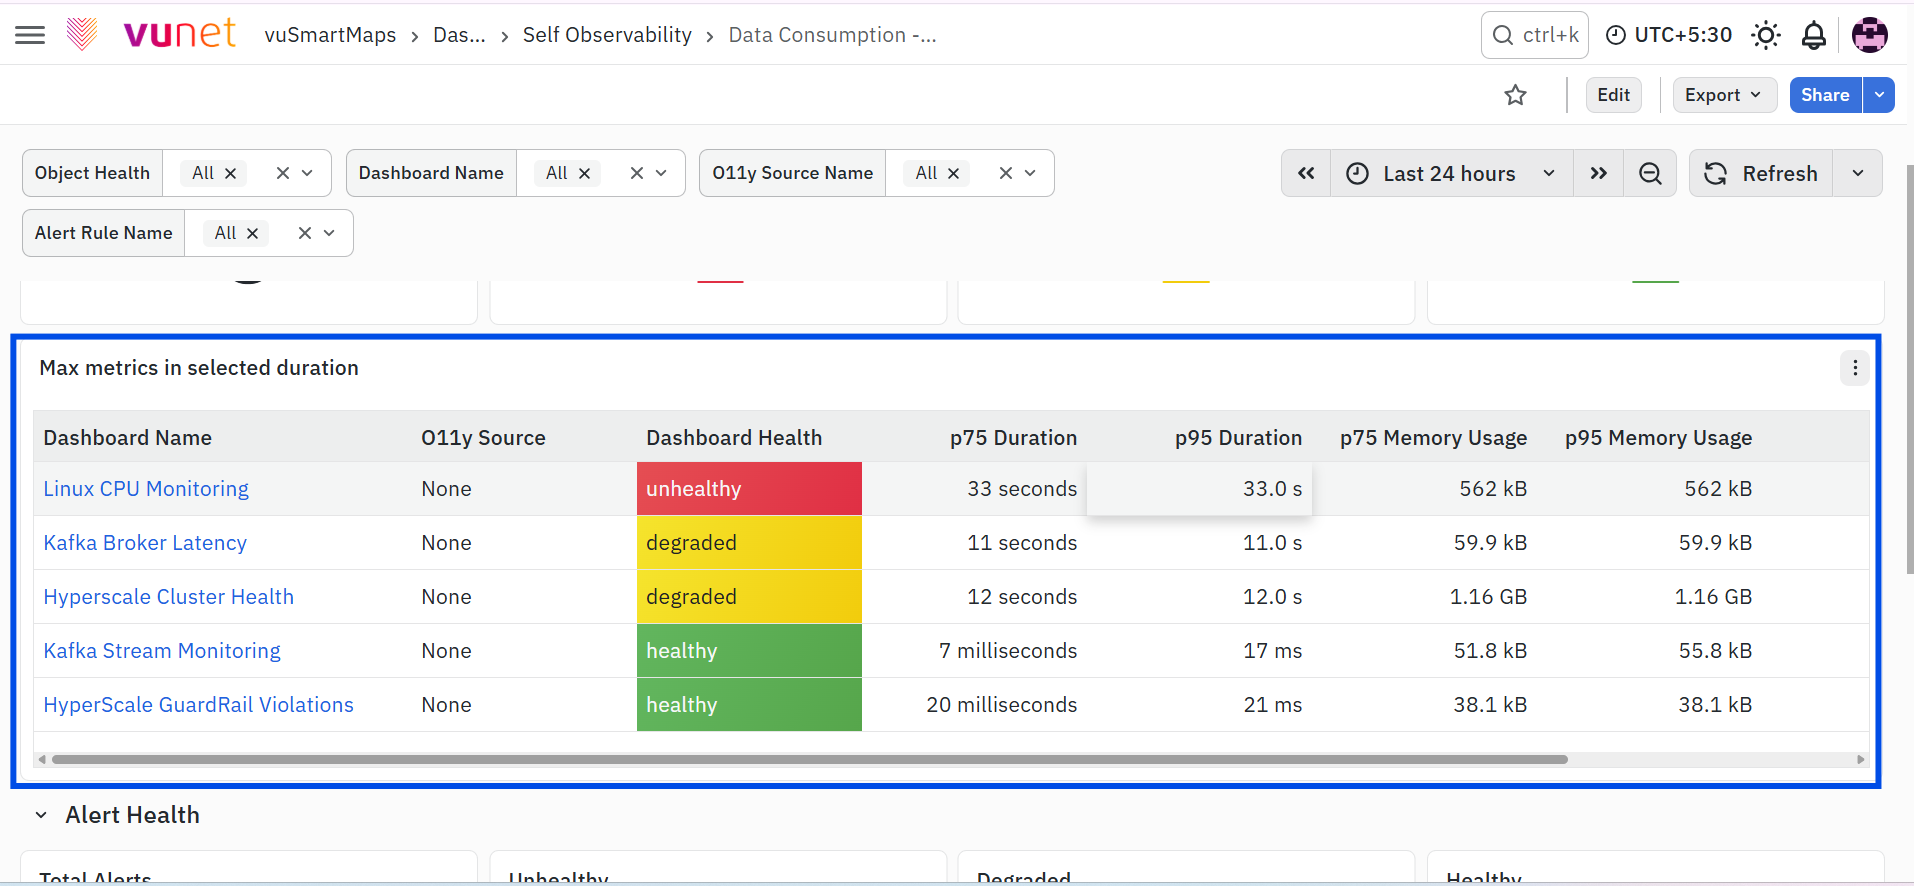
The Max metrics in selected duration table provides execution statistics for each monitored dashboard during the selected time range. The table includes the following information:
- Dashboard Name – Displays the name of the monitored dashboard as a clickable link. Selecting the dashboard name opens the corresponding dashboard for reviewing its panels and metrics.
- O11y Source – Displays the observability source associated with the dashboard.
- Dashboard Health – Displays the current health classification of the dashboard as Healthy, Degraded, or Unhealthy.
- p75 Duration – Displays the 75th percentile of the dashboard query execution duration, helping users understand the typical execution time.
- p95 Duration – Displays the 95th percentile of the dashboard query execution duration, helping identify dashboards with longer-running queries.
- p75 Memory Usage – Displays the 75th percentile of memory consumed by the dashboard queries.
- p95 Memory Usage – Displays the 95th percentile of memory consumed during dashboard query execution, helping identify dashboards with higher resource utilization.
- Error Rate: Displays the percentage of dashboard query executions that resulted in errors during the selected duration.
- Refreshes/Day: Displays the number of times the dashboard is refreshed per day within the selected duration, helping indicate how frequently the dashboard is used.
These metrics help users compare dashboard performance and identify dashboards that should be investigated further using the Dashboard Drilldown dashboard.
Alert Health
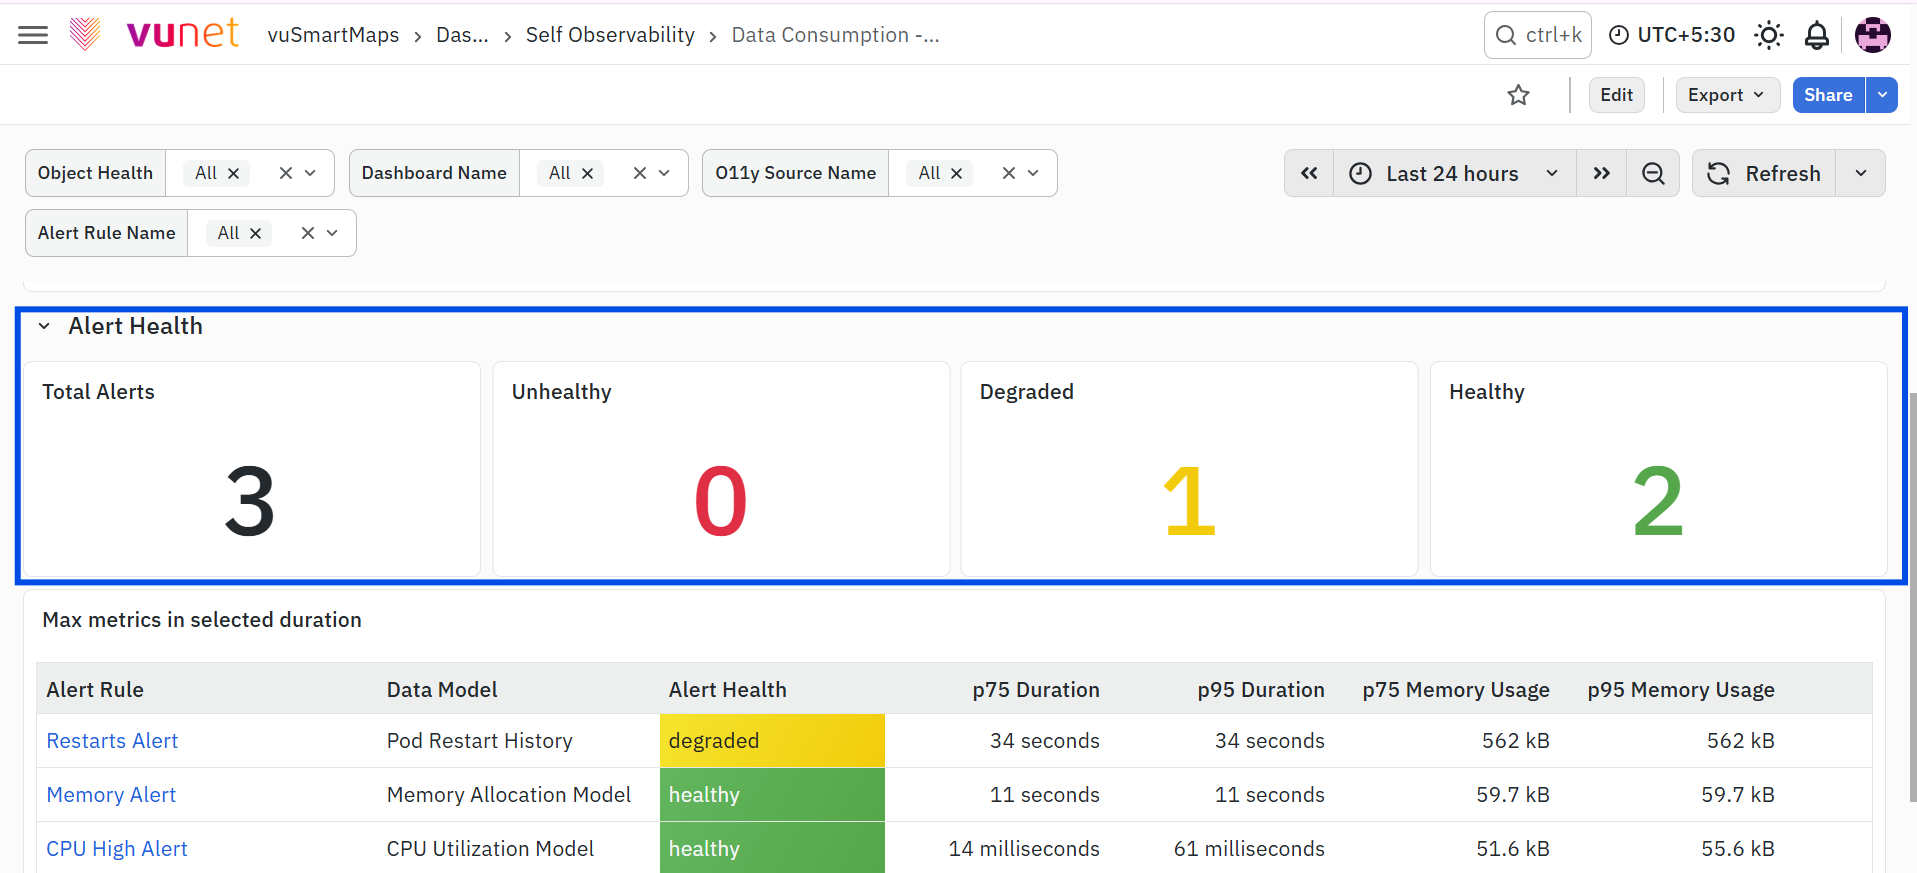
The Alert Health section provides an overview of the health of monitored alert rules. It summarizes the health of alert queries and provides execution metrics that help users identify alerts affected by query performance issues.
Alert Health Summary
This section displays the overall health distribution of monitored alerts. It includes the following metrics:
- Total Alerts – Displays the total number of monitored alert rules.
- Unhealthy – Displays the number of alerts classified as Unhealthy based on the health of the queries executed during alert evaluation.
- Degraded – Displays the number of alerts classified as Degraded, indicating that the alert contains queries requiring optimization.
- Healthy – Displays the number of alerts executing within the expected performance thresholds.
These summary metrics help users quickly understand the overall health of the monitored alerts.
Alert Metrics
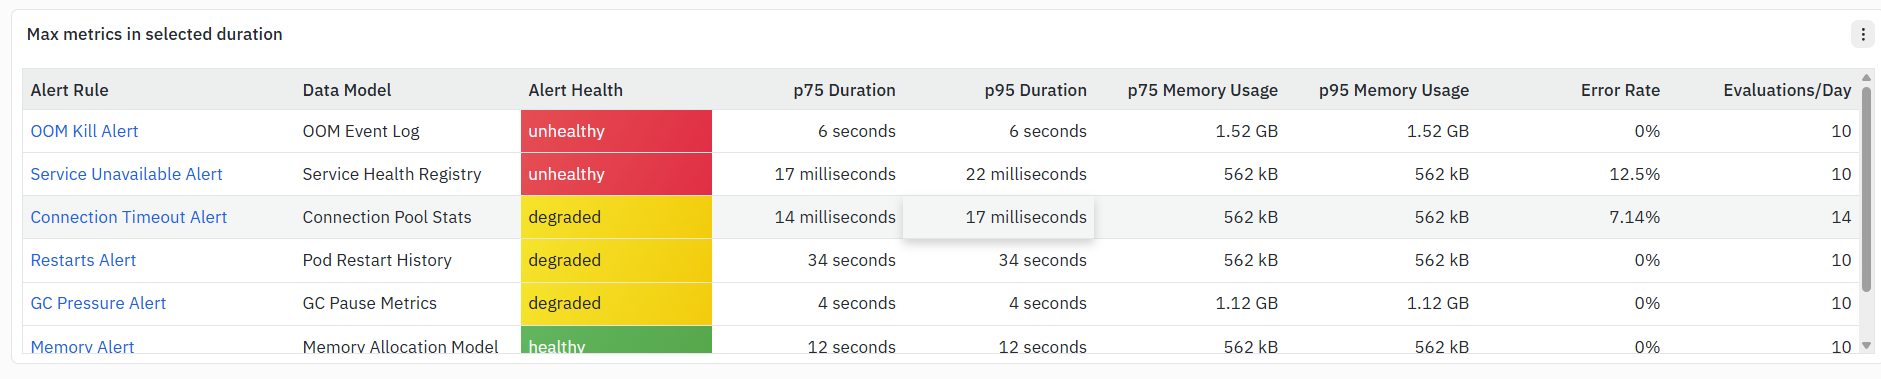
The Max metrics in selected duration table provides execution statistics for each monitored alert during the selected time range. The table includes the following information:
- Alert Rule – Displays the name of the monitored alert rule as a clickable link. Clicking the alert rule name redirects users to the Data Consumption Alert Drilldown dashboard for the selected alert, where they can perform detailed query-level analysis.
- Data Model – Displays the data model associated with the alert rule.
- Alert Health – Displays the current health classification of the alert as Healthy, Degraded, or Unhealthy.
- p75 Duration – Displays the 75th percentile of the alert query execution duration.
- p95 Duration – Displays the 95th percentile of the alert query execution duration.
- p75 Memory Usage – Displays the 75th percentile of memory consumed during alert query execution.
- p95 Memory Usage – Displays the 95th percentile of memory consumed during alert query execution.
- Error Rate: Displays the percentage of query executions that resulted in errors for the alert rule during the selected duration. This helps identify alert rules whose underlying queries are encountering execution failures.
- Evaluations/Day: Displays the number of times the alert rule is evaluated in a day. This indicates how frequently the alert query is executed as part of the configured alert evaluation cycle.
These metrics help users compare alert performance, identify alerts affected by unhealthy queries, and navigate to the Alert Drilldown dashboard for detailed query-level investigation.
Step-by-Step Instructions
Access the Data Consumption Dashboards
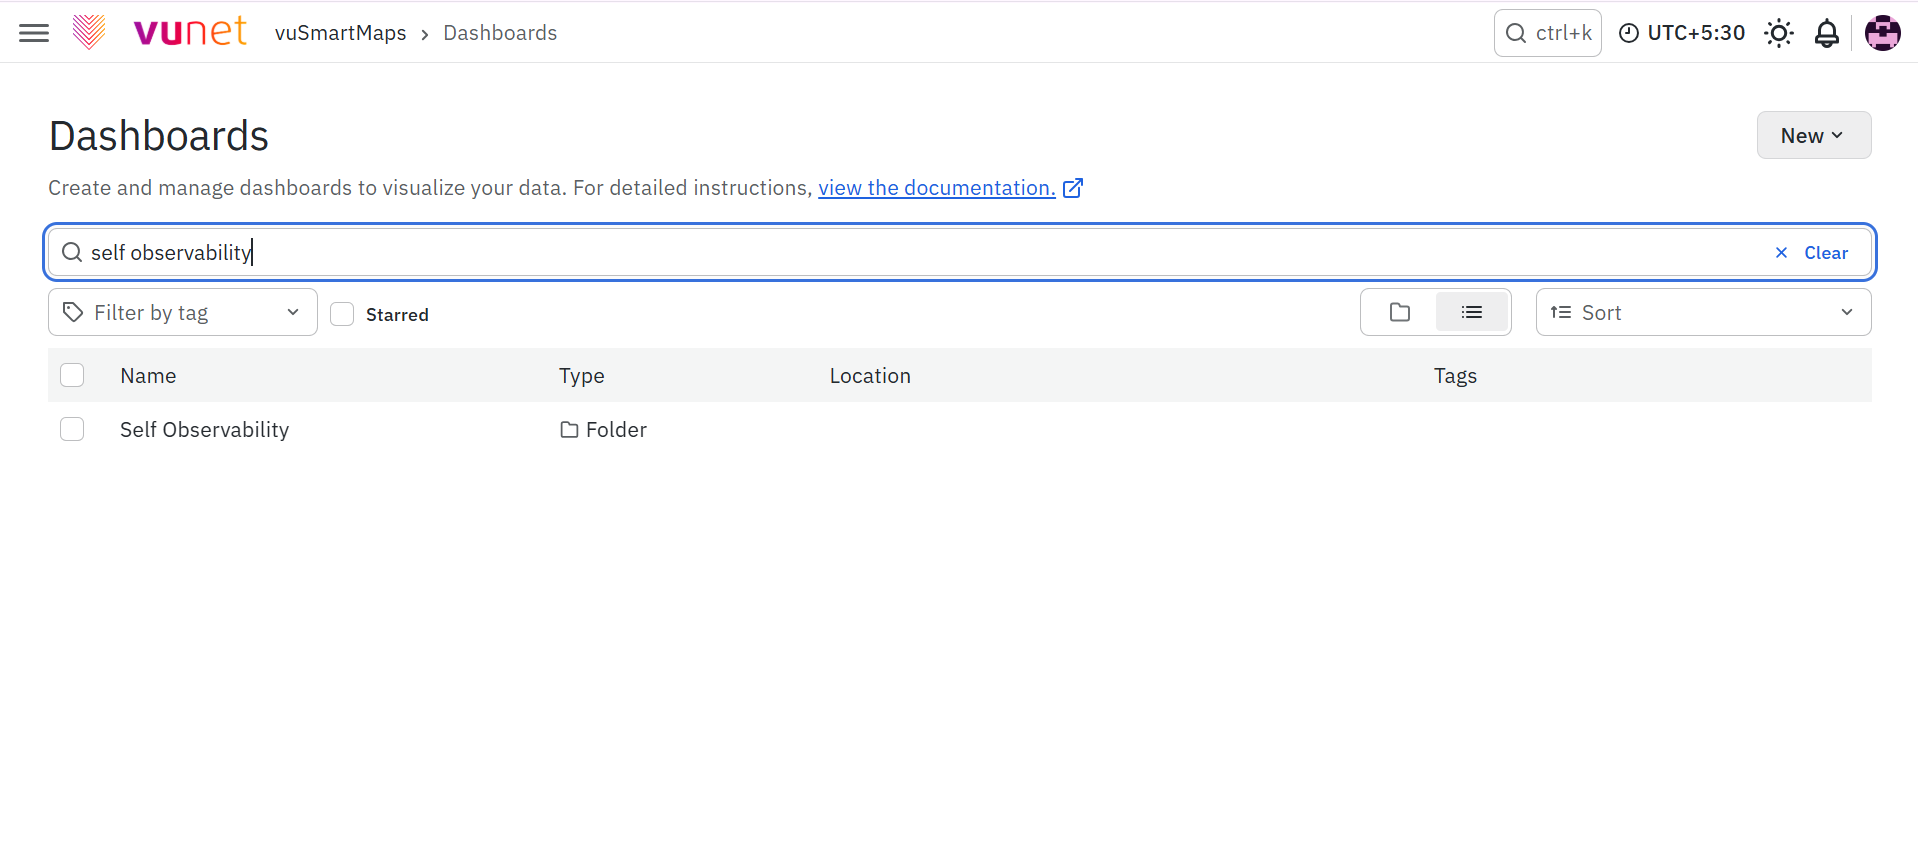
Follow these steps to access the Data Consumption dashboards:
- Log in to the vuSmartMaps application.
- Navigate to the left navigation menu and click Dashboards.
- In the dashboard search bar, search for the Self Observability folder.
- Expand the Self Observability folder to view the available dashboards.
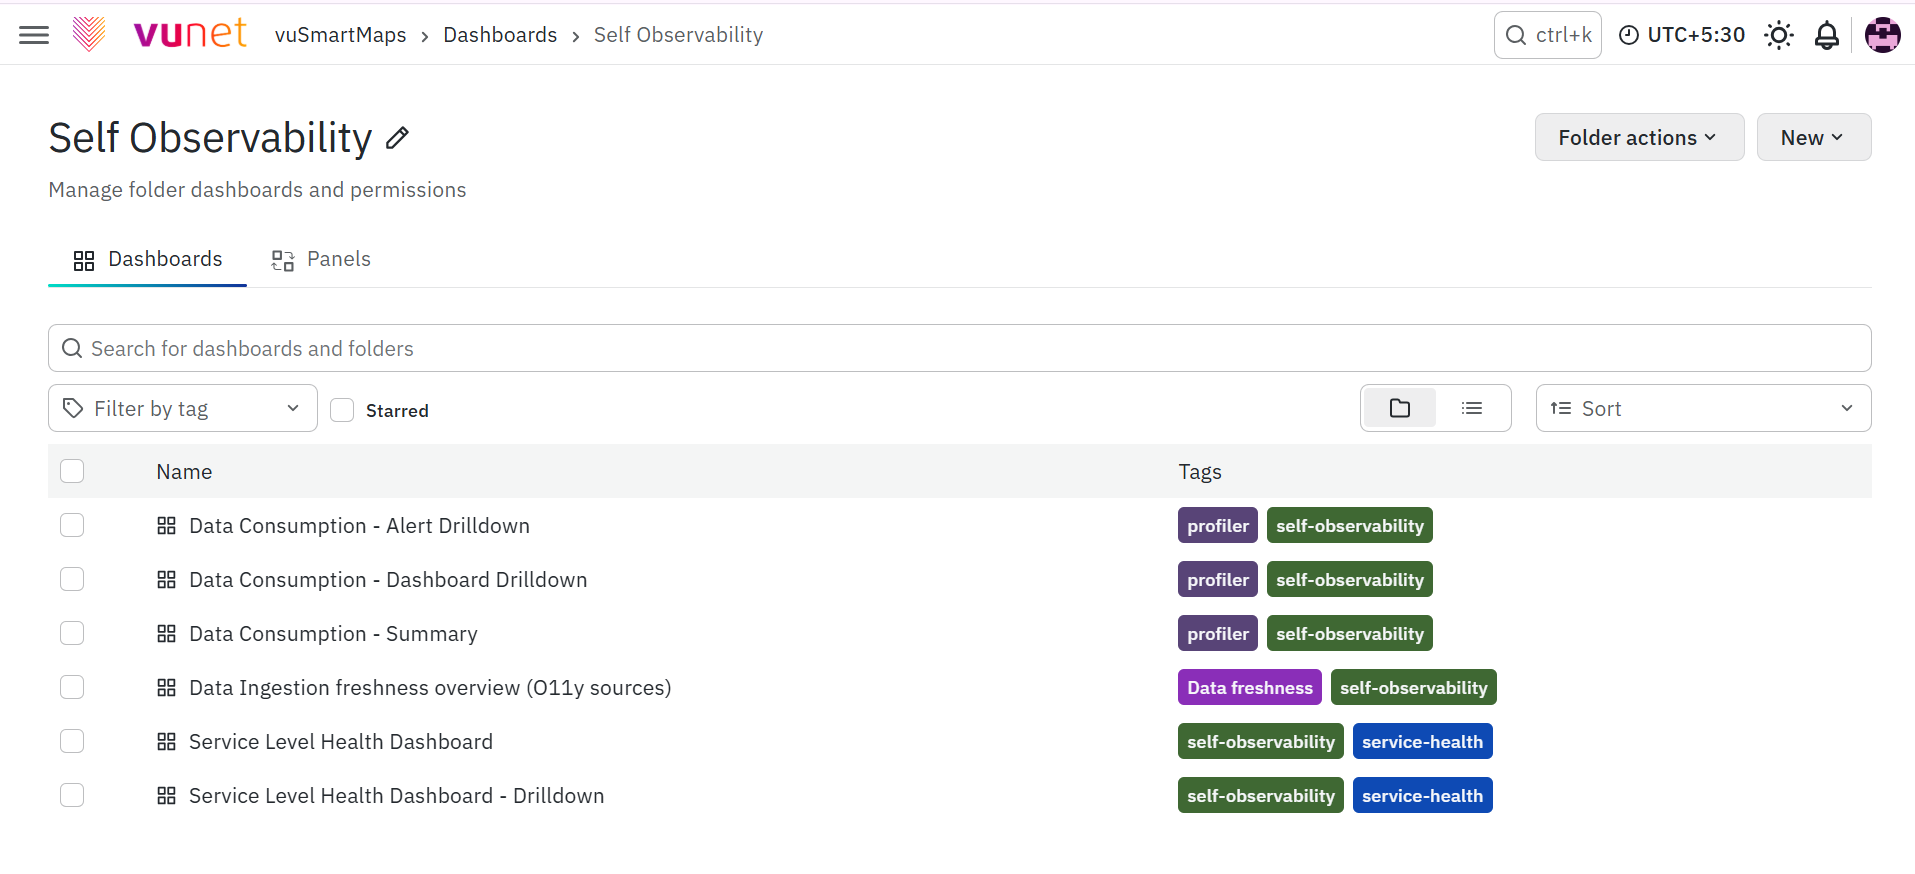
- Select the required dashboard:
- Data Consumption Summary
- Data Consumption Dashboard Drilldown
- Data Consumption Alert Drilldown
- The selected dashboard opens and displays the corresponding Data Consumption metrics and visualizations.
Apply Filters
Data Consumption Alert Drilldown
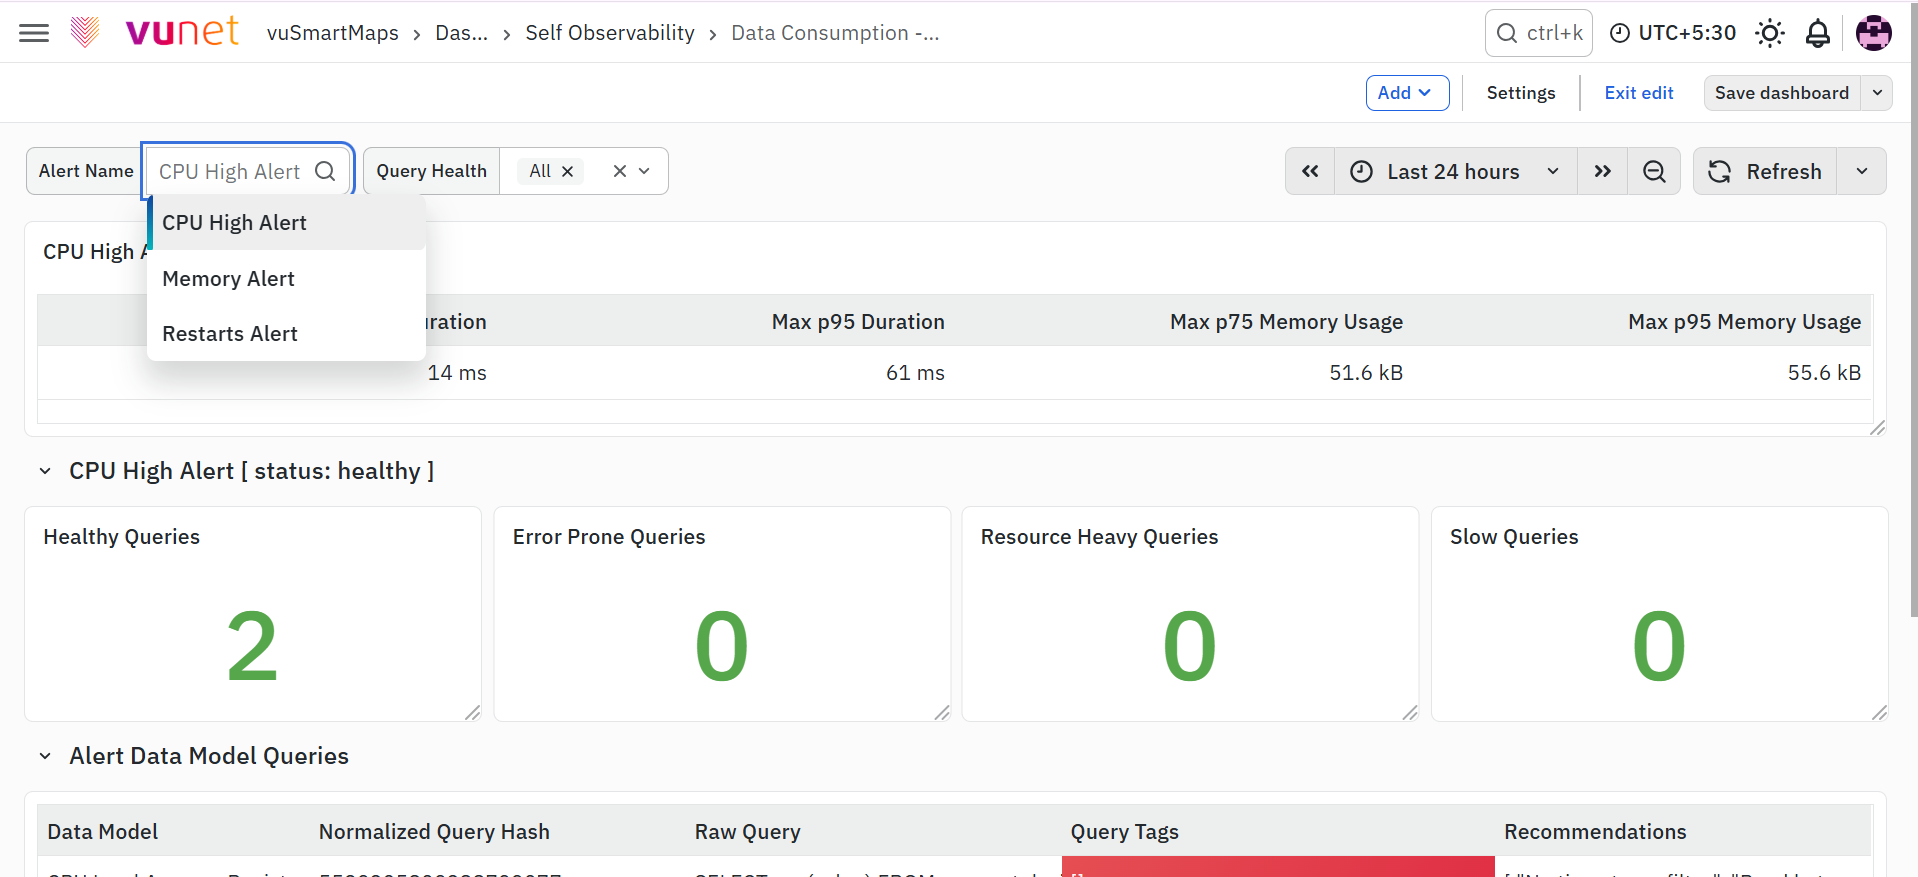
- Click the Alert Name filter and select the alert that you want to analyze.
- Click the Query Health filter and select the required query health category.
- To remove a selected filter value, click the × icon next to the selected value.
- To clear all selected values, use the filter reset option available in the filter control.
Data Consumption Dashboard Drilldown
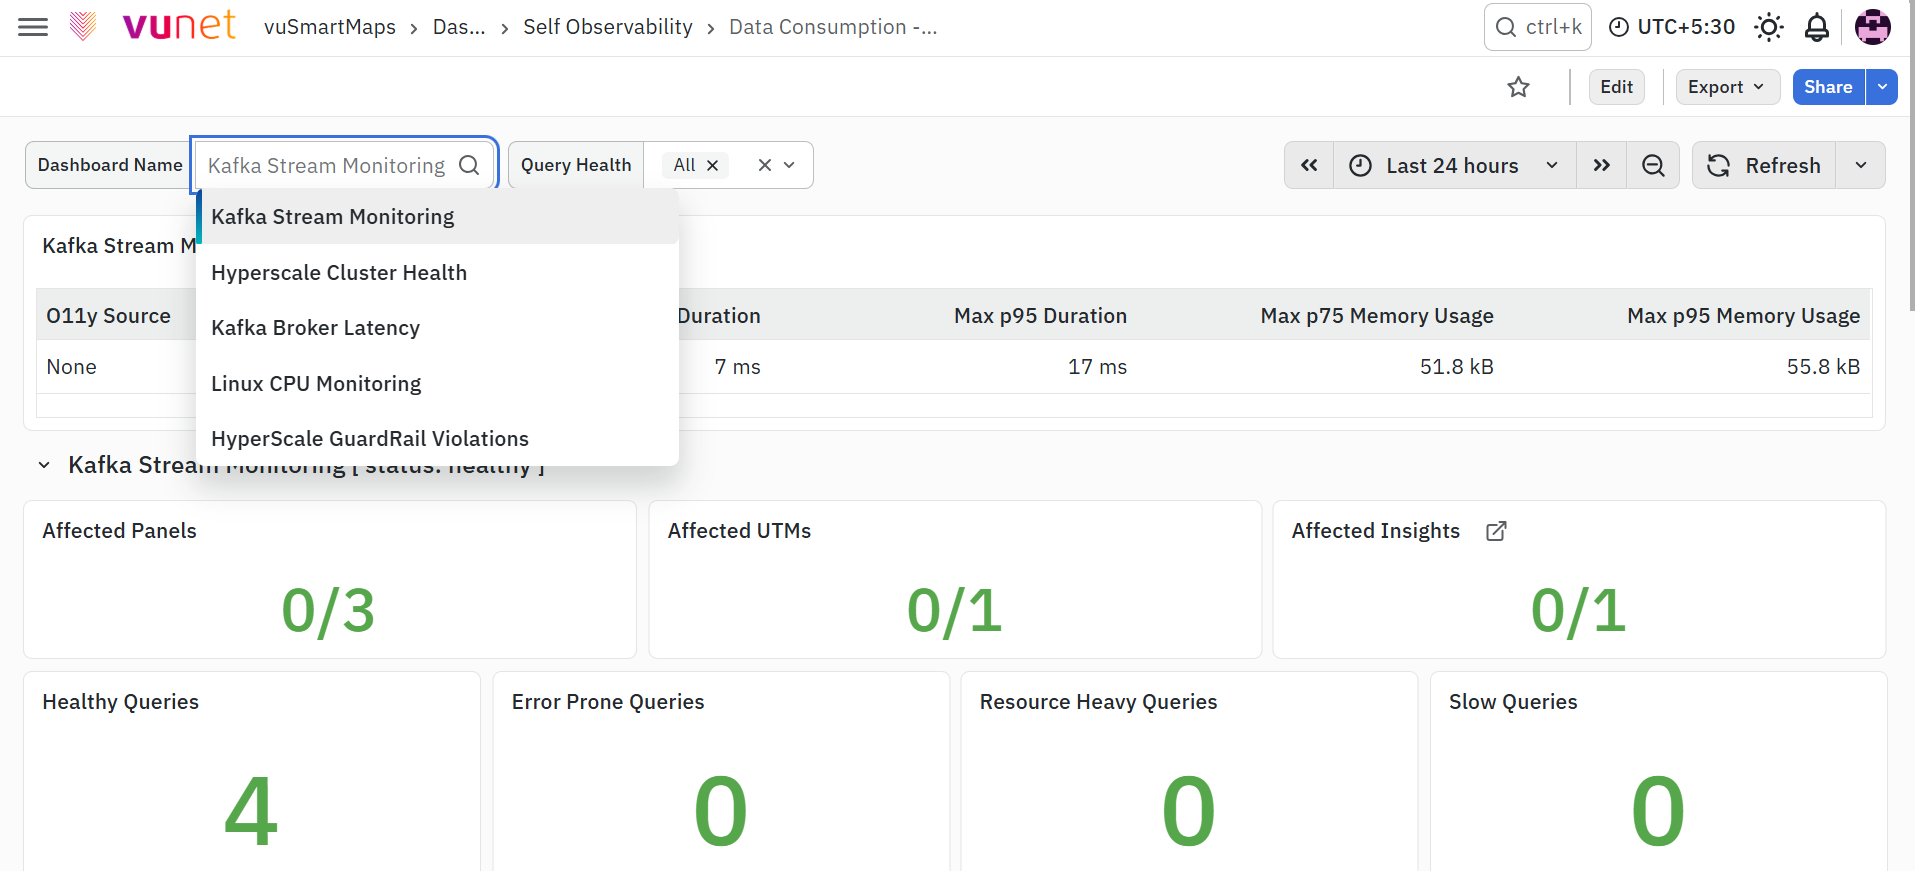
- Click the Dashboard Name filter and select the dashboard that you want to investigate.
- Click the Query Health filter and select the required query health category.
- To remove a selected filter value, click the × icon next to the selected value.
- To clear all selected values, use the filter reset option available in the filter control.
Data Consumption Summary
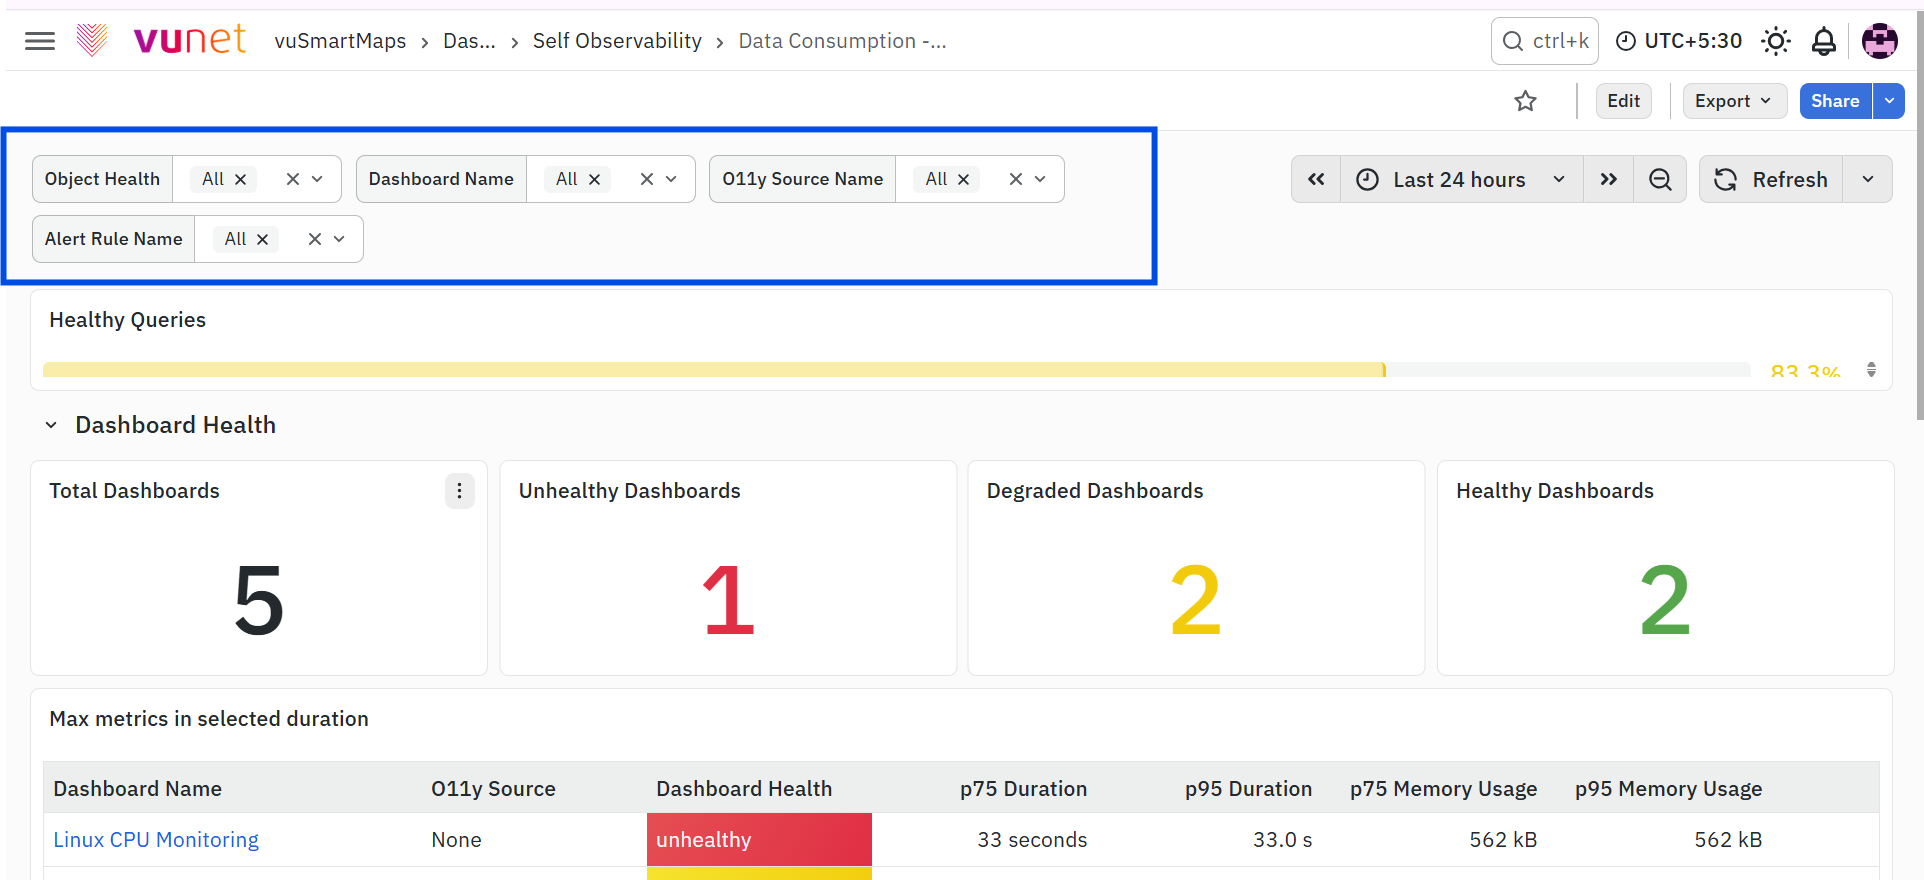
- Click the Object Health filter and select the required health status to display dashboards and alerts with the selected health classification.
- Click the Dashboard Name filter and select the dashboard that you want to analyze.
- Click the O11y Source Name filter and select the required observability source.
- Click the Alert Rule Name filter and select the required alert rule.
- To remove a filter, click the × icon next to the selected value.
- To clear all selected values for a filter, use the filter reset option available in the filter control.
Investigate an Affected Dashboard or Alert
- When a Self-Observability Dashboard Health Check or Self-Observability Alert Health Check email is received, select Review the Alert to open the alert details.
- Open the Data Consumption – Summary dashboard to view the overall health of the monitored dashboards and alerts.
- Locate the dashboard or alert classified as Degraded or Unhealthy.
- Select the affected dashboard or alert to open the corresponding Dashboard Drilldown or Alert Drilldown dashboard.
- For a dashboard, use the Affected Panels, Affected UTMs, and Affected Insights indicators to identify where the flagged queries are present.
- Use the Healthy Queries, Error Prone Queries, Resource Heavy Queries, and Slow Queries indicators to understand the query-health classifications identified during the profiler run.
- Use the query table to identify the affected object, Normalized Query Hash, Raw Query, Query Tags, and Recommendations.
- Apply the required correction to the underlying query.
- After the next scheduled profiler run, verify the updated health status in the Data Consumption Summary and the corresponding Drilldown dashboard.
Confirming the Resolution
After the underlying query is updated, its health is evaluated again during the next scheduled profiler run. The Normalized Query Hash may change after the query is modified. When the query is classified as Healthy, the Query Tags are displayed as blank. The previously affected query hash is no longer displayed in the Data Consumption Summary and Drilldown views after it is classified as Healthy.
FAQs
What is the purpose of the Data Consumption dashboards?
The Data Consumption dashboards monitor the health of dashboards and alerts by analyzing the queries executed by them. They help identify slow, resource-heavy, or error-prone queries that may affect dashboard performance or alert execution.
What is the difference between the Data Consumption Summary, Dashboard Drilldown, and Alert Drilldown dashboards?
The Data Consumption Summary dashboard provides an overall view of dashboard and alert health. The Dashboard Drilldown provides detailed information about an individual dashboard, while the Alert Drilldown focuses on the queries and data models associated with a selected alert.
What types of query issues can be identified using Data Consumption?
Data Consumption helps identify Slow Queries, Resource Heavy Queries, and Error Prone Queries. It also displays Healthy Queries that are operating within the expected performance thresholds.
How can I investigate a dashboard or alert that is Degraded or Unhealthy?
Start with the Data Consumption Summary dashboard to identify the affected dashboard or alert. Then, open the corresponding drilldown dashboard to identify the queries, panels, data models, UTMs, or insights contributing to the health condition.
How frequently is Data Consumption health evaluated?
The Data Consumption profilers run once every 10 hours. The configured Data Consumption health-check alert runs once every day.
